Embed Size (px)
Citation preview
Kinetics of Ferric Cytochrome P450 Reduction by NADPH-Cytochrome P450Reductase: Rapid Reduction in the Absence of Substrate and Variations among
Cytochrome P450 Systems†
F. Peter Guengerich* and William W. Johnson‡
Department of Biochemistry and Center in Molecular Toxicology, Vanderbilt UniVersity School of Medicine,NashVille, Tennessee 37232-0146
ReceiVed August 6, 1997; ReVised Manuscript ReceiVed September 18, 1997X
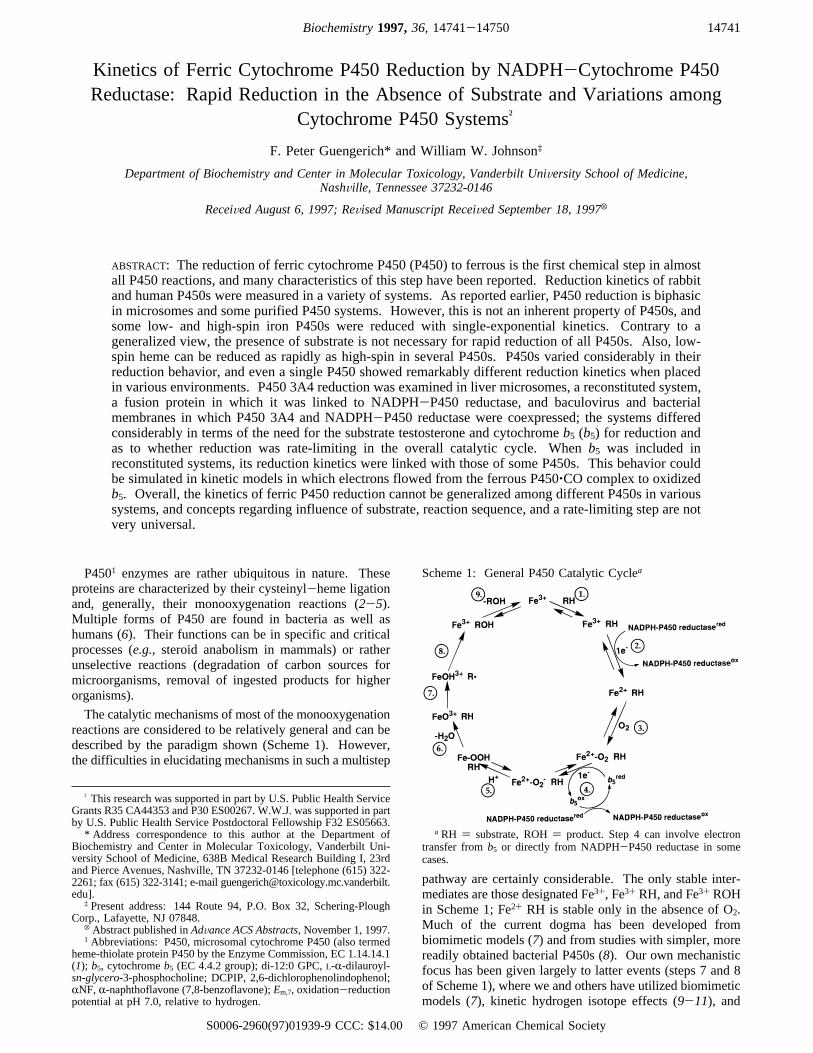
ABSTRACT: The reduction of ferric cytochrome P450 (P450) to ferrous is the first chemical step in almostall P450 reactions, and many characteristics of this step have been reported. Reduction kinetics of rabbitand human P450s were measured in a variety of systems. As reported earlier, P450 reduction is biphasicin microsomes and some purified P450 systems. However, this is not an inherent property of P450s, andsome low- and high-spin iron P450s were reduced with single-exponential kinetics. Contrary to ageneralized view, the presence of substrate is not necessary for rapid reduction of all P450s. Also, low-spin heme can be reduced as rapidly as high-spin in several P450s. P450s varied considerably in theirreduction behavior, and even a single P450 showed remarkably different reduction kinetics when placedin various environments. P450 3A4 reduction was examined in liver microsomes, a reconstituted system,a fusion protein in which it was linked to NADPH-P450 reductase, and baculovirus and bacterialmembranes in which P450 3A4 and NADPH-P450 reductase were coexpressed; the systems differedconsiderably in terms of the need for the substrate testosterone and cytochromeb5 (b5) for reduction andas to whether reduction was rate-limiting in the overall catalytic cycle. Whenb5 was included inreconstituted systems, its reduction kinetics were linked with those of some P450s. This behavior couldbe simulated in kinetic models in which electrons flowed from the ferrous P450‚CO complex to oxidizedb5. Overall, the kinetics of ferric P450 reduction cannot be generalized among different P450s in varioussystems, and concepts regarding influence of substrate, reaction sequence, and a rate-limiting step are notvery universal.
P4501 enzymes are rather ubiquitous in nature. Theseproteins are characterized by their cysteinyl-heme ligationand, generally, their monooxygenation reactions (2-5).Multiple forms of P450 are found in bacteria as well ashumans (6). Their functions can be in specific and criticalprocesses (e.g., steroid anabolism in mammals) or ratherunselective reactions (degradation of carbon sources formicroorganisms, removal of ingested products for higherorganisms).
The catalytic mechanisms of most of the monooxygenationreactions are considered to be relatively general and can bedescribed by the paradigm shown (Scheme 1). However,the difficulties in elucidating mechanisms in such a multistep
pathway are certainly considerable. The only stable inter-mediates are those designated Fe3+, Fe3+ RH, and Fe3+ ROHin Scheme 1; Fe2+ RH is stable only in the absence of O2.Much of the current dogma has been developed frombiomimetic models (7) and from studies with simpler, morereadily obtained bacterial P450s (8). Our own mechanisticfocus has been given largely to latter events (steps 7 and 8of Scheme 1), where we and others have utilized biomimeticmodels (7), kinetic hydrogen isotope effects (9-11), and
† This research was supported in part by U.S. Public Health ServiceGrants R35 CA44353 and P30 ES00267. W.W.J. was supported in partby U.S. Public Health Service Postdoctoral Fellowship F32 ES05663.* Address correspondence to this author at the Department of
Biochemistry and Center in Molecular Toxicology, Vanderbilt Uni-versity School of Medicine, 638B Medical Research Building I, 23rdand Pierce Avenues, Nashville, TN 37232-0146 [telephone (615) 322-2261; fax (615) 322-3141; e-mail [email protected]].
‡ Present address: 144 Route 94, P.O. Box 32, Schering-PloughCorp., Lafayette, NJ 07848.
X Abstract published inAdVance ACS Abstracts,November 1, 1997.1 Abbreviations: P450, microsomal cytochrome P450 (also termed
heme-thiolate protein P450 by the Enzyme Commission, EC 1.14.14.1(1); b5, cytochromeb5 (EC 4.4.2 group); di-12:0 GPC,L-R-dilauroyl-sn-glycero-3-phosphocholine; DCPIP, 2,6-dichlorophenolindophenol;RNF,R-naphthoflavone (7,8-benzoflavone);Em,7, oxidation-reductionpotential at pH 7.0, relative to hydrogen.
Scheme 1: General P450 Catalytic Cyclea
aRH ) substrate, ROH) product. Step 4 can involve electrontransfer fromb5 or directly from NADPH-P450 reductase in somecases.
14741Biochemistry1997,36, 14741-14750
S0006-2960(97)01939-9 CCC: $14.00 © 1997 American Chemical Society
substrates that undergo diagnostic rearrangements or conver-sions to inactivating species (9, 12, 13).Recently we have directed our attention to step 2 of
Scheme 1, in which the first electron enters the catalyticcycle. In the course of P450 research this reduction, as wellas step 1, has been a source of much attention (14). Gilletteand his associates (15, 16) first observed the biphasic natureof this step in rat liver microsomes, monitoring the formationof the Fe2+‚CO complex in microsomes mixed with NADPH.Diehl et al. (17) extended this approach with rat livermicrosomes and the substrates cyclohexane and hexobarbital.Biphasic reduction kinetics were also observed, which couldbe described by rate constants of 46 and 10 min-1.2 Theauthors also used changes in the Soret spectrum as a measureof substrate binding and concluded that the extent of thefaster phase of P450 reduction was similar to the fraction ofsubstrate bound to P450. The authors conceptually linkedthe iron spin state, rate of reduction, and substrate binding.They also expressed the view that the rate of reduction offerric P450 was rate-limiting. Extensive studies with bacte-rial P450 101 (P450cam) showed a strong linkage betweensubstrate binding, spin state, andEm,7 (8, 18). Althoughbacterial P450 101 is reduced (by putidaredoxin) in a single-exponential reaction (18), many studies have been done withmicrosomal P450s in microsomes and after purification, andbiphasic reductions have usually been observed (14-17, 19-22). At least three possible explanations have been pre-sented: (i) The two phases correspond to reduction of thehigh- (faster rate) and low-spin (slower rate) P450 compo-nents (17, 22-24); (ii) biphasic reduction properties are dueto aspects of intramolecular electron transfer between thetwo flavins in NADPH-P450 reductase (20); and (iii)biphasic reduction is due to reduction of two populations ofspatially aggregated (19) or otherwise conformationallyrestricted populations of P450 (14).Kominami and Takemori (21) observed biphasic reduction
kinetics for P450 reduction in bovine adrenal microsomesand found that substrate was required for efficient reduction.However, they did not find any correlation of the high-spinstate with rates of reduction of ferric P450. In a study withseveral isolated rat liver P450s in this laboratory, there wasno general correlation between substrate binding, spin state,Em,7, and rates of substrate oxidation (25). Backes and Eyer(26), in a series of studies with rabbit P450 2B4, were unableto correlate the high-spin content (induced by addition ofsubstrates) with rates of P450 reduction. Although severalkey reviews point out that the P450 101 model of ligand/spin/redox equilibrium cannot be extended to mammalianP450s (e.g.refs 8 and 14), statements that low-spin P450 isnot reducible are still common in the primary literature (e.g.refs 27 and 28) and texts and reviews (e.g. refs 29-31).In the course of our studies on a series of recombinant
human and other P450s we examined reduction kinetics ina variety of settings. We report here that some mammalianP450s clearly exhibit single-exponential reduction kineticswhile others do not, that there is no general link betweenspin state and reduction kinetics, that the presence ofsubstrate is not obligatory for rapid P450 reduction, and thata “linked” reduction of some P450s andb5 postulated by
Schenkman et al. (32) may provide a reasonable explanationfor several observations regardingb5.
EXPERIMENTAL PROCEDURES
Chemicals. (S)-Warfarin was a gift of Dr. L. S. Kaminsky,New York State Department of Health (Albany, NY).Tolbutamide was purchased from Sigma Chemical Co. (St.Louis, MO) and recrystallized from H2O/CH3OH. (S)-Mephenytoin was provided by Prof. G. R. Wilkinson,Department of Pharmacology, Vanderbilt University. Allthree of these compounds were dissolved as monosodiumsalts in aqueous solution prior to use.Enzymes. P450 1A2 was purified from liver microsomes
of rabbits treated with 7,8-benzoflavone using a modification(33) of the procedure of Alterman and Dowgii (34).Recombinant human P450s 1A2 (33), 2C9 (35), 2E1 (36),and 3A4 (37) were purified fromEscherichia colimembranesas described. P450 2C19 was produced in a baculovirussystem (Trichoplusia nicells) by Dr. P. M. Shaw (PanVeraCorp., Madison, WI) and purified using a modification ofthe procedure used to isolate P450 2C9 fromE. coli (35). b5was purified from rabbit liver microsomes (38, 39). Re-combinant rat NADPH-P450 reductase was prepared fromE. coli using a vector obtained from Prof. C. B. Kasper,University of Wisconsin (Madison, WI) (40). All purifiedproteins were>95% homogenous as judged by electrophore-sis. Baculovirus microsomes containing P450 3A4 werefrom Dr. Shaw of PanVera Corp. (41, 42); the molar ratioof NADPH-P450 reductase to P450 was 8.E. colimembranes containing equal amounts of P450 3A4 andhuman NADPH-P450 reductase were prepared using abicistronic vector (43). The fused P450 3A4:rat NADPH-P450 reductase protein (44) was prepared as described (45,46).Reconstitution Systems. Purified rabbit P450 1A2 and
human P450s 1A2 and 2E1 were mixed with a 2-fold molarexcess of NADPH-P450 reductase and 30µM di-12:0 GPCin 0.10 M potassium phosphate buffer (pH 7.4). PurifiedP450s 2C9, 2C19, and 3A4 were mixed with a 2-fold molarexcess of NADPH-450 reductase, an equimolar amount ofb5, 0.25 mM sodium cholate, 30 mM MgCl2, and aphospholipid mixture [20µg mL-1 mixture (1:1:1, w/w/w)of di-12:0 GPC,L-R-dioleoyl-sn-glycero-3-phosphocholine,and bovine brain phosphatidylserine] (47) in 50 mM potas-sium 4-(2-hydroxyethyl)-1-piperazineethanesulfonate (pH7.4).Spectroscopy. Absorbance spectra were recorded using
modified Aminco DW2/OLIS and Cary 14/OLIS instruments(On-Line Instrument Systems, Bogart, GA). Second-deriva-tive spectra were obtained using the manufacturer’s software,with the application of the curve smoothing program.Analysis of second-derivative spectra involved the zero-baseline method (48).Reduction Kinetics. Reduction of ferric P450 to the
ferrous form was measured at 37°C under an anaerobic COenvironment using anaerobic techniques described elsewhere(49). All studies were done using an Applied PhotophysicsSX-17MV instrument (Applied Photophysics, Leatherhead,U.K.) and the manufacturer’s computer system. P450reductions were monitored near 450 nm (446-450 nm,depending upon theλmax of each particular P450red‚COcomplex) or at 390 or 415 nm (decrease in ferric P450).b5reduction was monitored by the increase at 424 nm, which
2 For consistency, all first-order rate constants are expressed in unitsof min-1. We also refer to “biphasic” kinetics even though some maybe more complex, if they can be fitted to biexponential plots.
14742 Biochemistry, Vol. 36, No. 48, 1997 Guengerich and Johnson
is relatively distinct from changes in P450 spectral changesunder these conditions (b5 was usually equimolar with P450)as established in parallel experiments devoid ofb5.Traces are presented as averages of several individual
reactions (3-10) and the analysis of residuals is shown belowthe plots. The manufacturer’s software supplied with theinstrument also provides an estimate of the error in each trace(applied on the averaged traces). These estimates were<(10% in every case and are not routinely presented exceptin a few selected cases.Other Assays. Previously described procedures were used
to monitor the oxidation of phenacetin (50), tolbutamide (51),(S)-warfarin (52), (S)-mephenytoin (53), and C2H5OH (54).
RESULTS
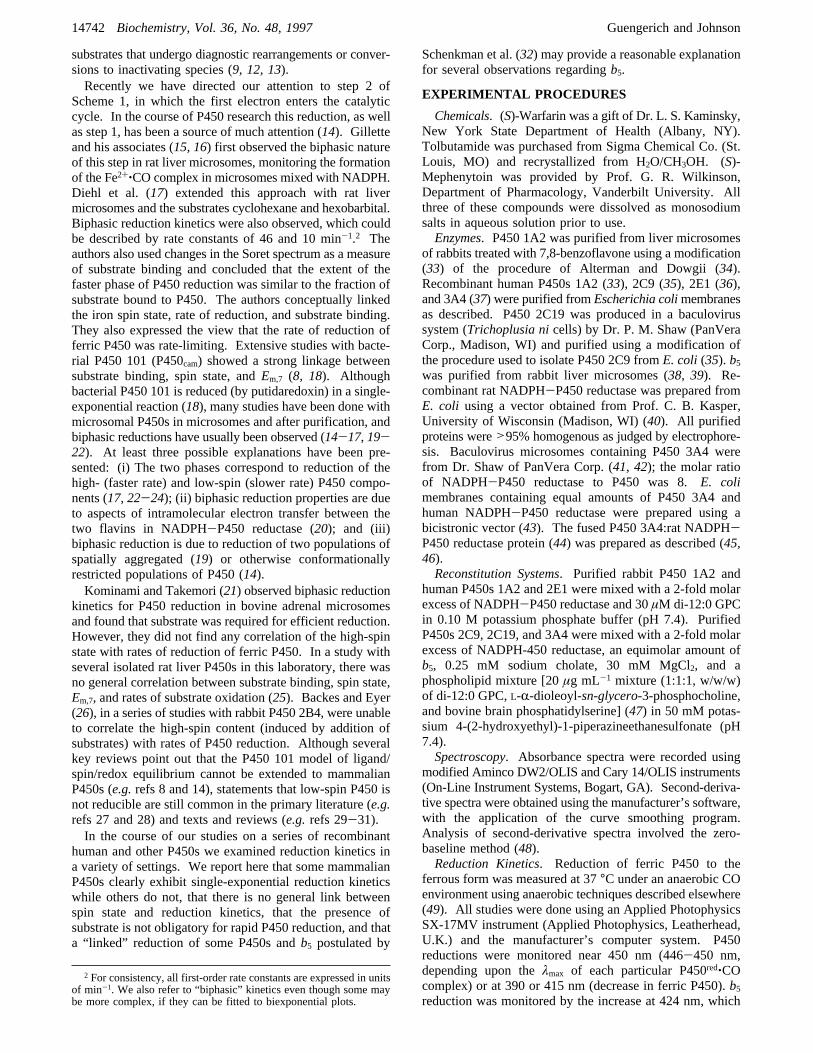
Reduction of Ferric P450 in Human LiVer Microsomes.As expected from the literature describing other microsomalpreparations, we found that apparently biphasic kinetics wereobserved when the ferric P450 in human liver microsomeswas reduced using NADPH (Figure 1). In this particularcase, global fitting of the results yielded an estimated 43%of the P450 reduced at a rate of 41 min-1 and the remaining57% was reduced at a rate of 4 min-1. Although the stopped-flow spectrophotometer used here was not specificallydesigned for use with turbid samples, the system could beused to obtain good data when the optical density wase1.0.Monophasic Reduction of Human P450 1A2. The litera-
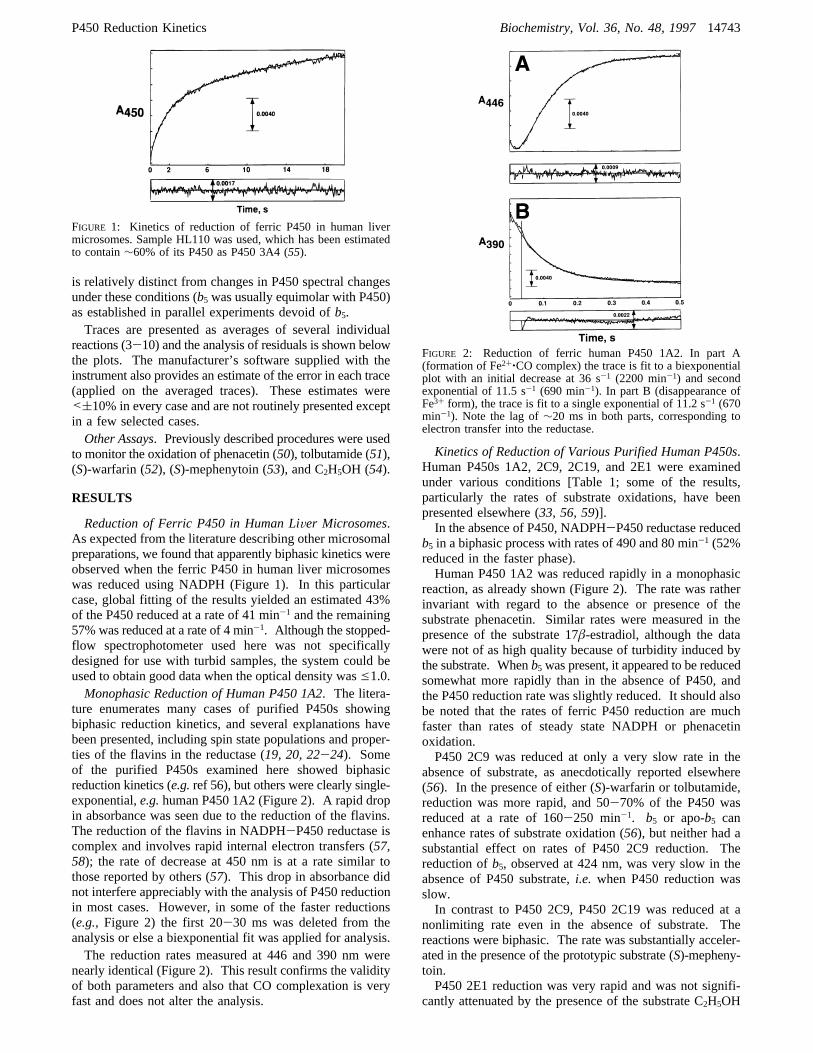
ture enumerates many cases of purified P450s showingbiphasic reduction kinetics, and several explanations havebeen presented, including spin state populations and proper-ties of the flavins in the reductase (19, 20, 22-24). Someof the purified P450s examined here showed biphasicreduction kinetics (e.g.ref 56), but others were clearly single-exponential,e.g.human P450 1A2 (Figure 2). A rapid dropin absorbance was seen due to the reduction of the flavins.The reduction of the flavins in NADPH-P450 reductase iscomplex and involves rapid internal electron transfers (57,58); the rate of decrease at 450 nm is at a rate similar tothose reported by others (57). This drop in absorbance didnot interfere appreciably with the analysis of P450 reductionin most cases. However, in some of the faster reductions(e.g., Figure 2) the first 20-30 ms was deleted from theanalysis or else a biexponential fit was applied for analysis.The reduction rates measured at 446 and 390 nm were
nearly identical (Figure 2). This result confirms the validityof both parameters and also that CO complexation is veryfast and does not alter the analysis.
Kinetics of Reduction of Various Purified Human P450s.Human P450s 1A2, 2C9, 2C19, and 2E1 were examinedunder various conditions [Table 1; some of the results,particularly the rates of substrate oxidations, have beenpresented elsewhere (33, 56, 59)].In the absence of P450, NADPH-P450 reductase reduced
b5 in a biphasic process with rates of 490 and 80 min-1 (52%reduced in the faster phase).Human P450 1A2 was reduced rapidly in a monophasic
reaction, as already shown (Figure 2). The rate was ratherinvariant with regard to the absence or presence of thesubstrate phenacetin. Similar rates were measured in thepresence of the substrate 17â-estradiol, although the datawere not of as high quality because of turbidity induced bythe substrate. Whenb5 was present, it appeared to be reducedsomewhat more rapidly than in the absence of P450, andthe P450 reduction rate was slightly reduced. It should alsobe noted that the rates of ferric P450 reduction are muchfaster than rates of steady state NADPH or phenacetinoxidation.P450 2C9 was reduced at only a very slow rate in the
absence of substrate, as anecdotically reported elsewhere(56). In the presence of either (S)-warfarin or tolbutamide,reduction was more rapid, and 50-70% of the P450 wasreduced at a rate of 160-250 min-1. b5 or apo-b5 canenhance rates of substrate oxidation (56), but neither had asubstantial effect on rates of P450 2C9 reduction. Thereduction ofb5, observed at 424 nm, was very slow in theabsence of P450 substrate,i.e. when P450 reduction wasslow.In contrast to P450 2C9, P450 2C19 was reduced at a
nonlimiting rate even in the absence of substrate. Thereactions were biphasic. The rate was substantially acceler-ated in the presence of the prototypic substrate (S)-mepheny-toin.P450 2E1 reduction was very rapid and was not signifi-
cantly attenuated by the presence of the substrate C2H5OH
FIGURE 1: Kinetics of reduction of ferric P450 in human livermicrosomes. Sample HL110 was used, which has been estimatedto contain∼60% of its P450 as P450 3A4 (55).
FIGURE 2: Reduction of ferric human P450 1A2. In part A(formation of Fe2+‚CO complex) the trace is fit to a biexponentialplot with an initial decrease at 36 s-1 (2200 min-1) and secondexponential of 11.5 s-1 (690 min-1). In part B (disappearance ofFe3+ form), the trace is fit to a single exponential of 11.2 s-1 (670min-1). Note the lag of∼20 ms in both parts, corresponding toelectron transfer into the reductase.
P450 Reduction Kinetics Biochemistry, Vol. 36, No. 48, 199714743
or chlorzoxazone in this and repeated experiments (59).Reactions were biphasic. The apparent rates of P450reduction were attenuated considerably in the presence ofb5, and rates ofb5 reduction exceeded the rates of P450 2E1reduction. Apo-b5, which has no electron transfer capability,did not affect the rates.Effect of P450 Spin State on Reduction Kinetics. Human
recombinant P450 1A2 is isolated as a nearly completelyhigh-spin protein fromE. coli (33). Rabbit (60) and rat (25)P450s 1A2 can be converted to low-spin P450 in the presenceof 0.25 M 1-butanol. However, analysis of human P450 1A2in the presence of 0.25 M 1-butanol indicated that it hadbeen converted to cytochrome P420.Rabbit P450 1A2, as isolated from liver microsomes of
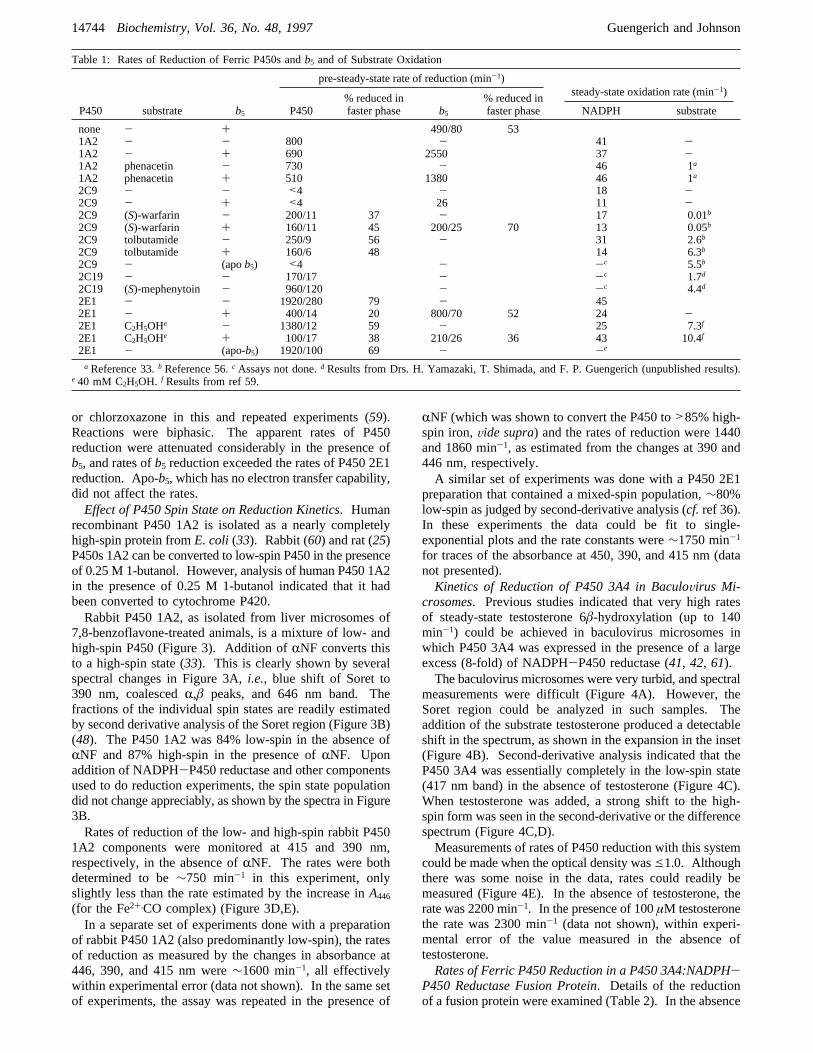
7,8-benzoflavone-treated animals, is a mixture of low- andhigh-spin P450 (Figure 3). Addition ofRNF converts thisto a high-spin state (33). This is clearly shown by severalspectral changes in Figure 3A,i.e., blue shift of Soret to390 nm, coalescedR,â peaks, and 646 nm band. Thefractions of the individual spin states are readily estimatedby second derivative analysis of the Soret region (Figure 3B)(48). The P450 1A2 was 84% low-spin in the absence ofRNF and 87% high-spin in the presence ofRNF. Uponaddition of NADPH-P450 reductase and other componentsused to do reduction experiments, the spin state populationdid not change appreciably, as shown by the spectra in Figure3B.Rates of reduction of the low- and high-spin rabbit P450
1A2 components were monitored at 415 and 390 nm,respectively, in the absence ofRNF. The rates were bothdetermined to be∼750 min-1 in this experiment, onlyslightly less than the rate estimated by the increase inA446(for the Fe2+.CO complex) (Figure 3D,E).In a separate set of experiments done with a preparation
of rabbit P450 1A2 (also predominantly low-spin), the ratesof reduction as measured by the changes in absorbance at446, 390, and 415 nm were∼1600 min-1, all effectivelywithin experimental error (data not shown). In the same setof experiments, the assay was repeated in the presence of
RNF (which was shown to convert the P450 to>85% high-spin iron,Vide supra) and the rates of reduction were 1440and 1860 min-1, as estimated from the changes at 390 and446 nm, respectively.A similar set of experiments was done with a P450 2E1
preparation that contained a mixed-spin population,∼80%low-spin as judged by second-derivative analysis (cf. ref 36).In these experiments the data could be fit to single-exponential plots and the rate constants were∼1750 min-1for traces of the absorbance at 450, 390, and 415 nm (datanot presented).Kinetics of Reduction of P450 3A4 in BaculoVirus Mi-
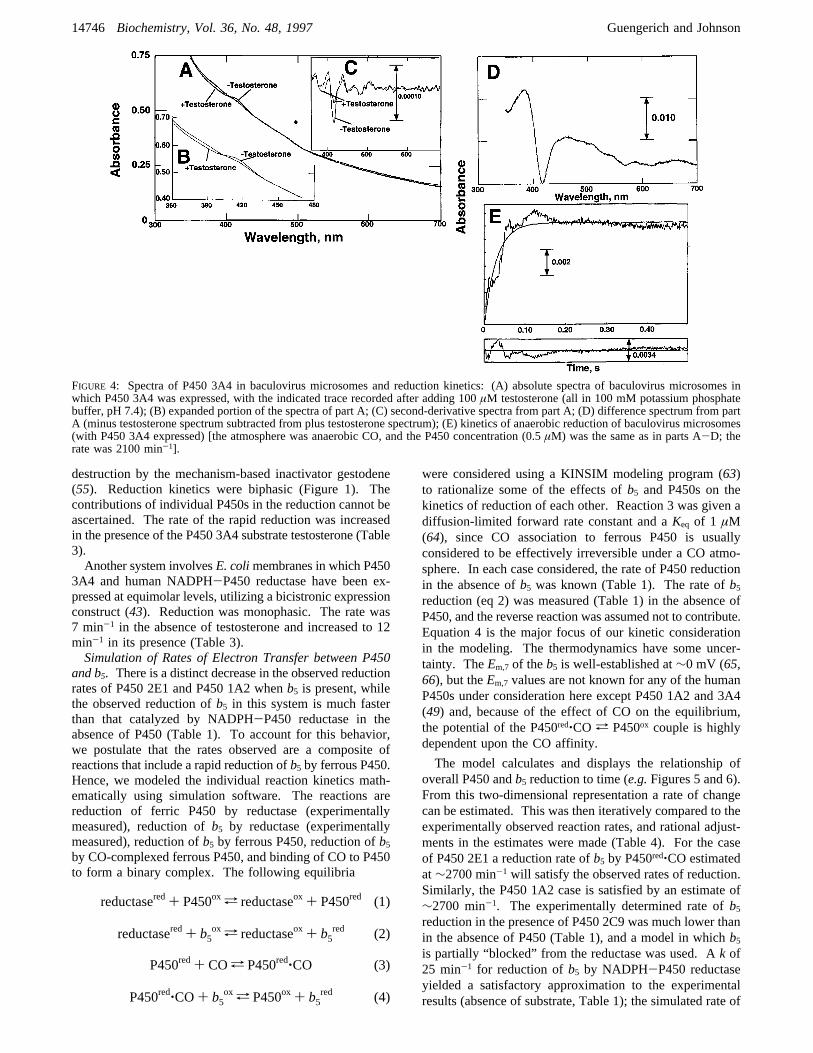
crosomes. Previous studies indicated that very high ratesof steady-state testosterone 6â-hydroxylation (up to 140min-1) could be achieved in baculovirus microsomes inwhich P450 3A4 was expressed in the presence of a largeexcess (8-fold) of NADPH-P450 reductase (41, 42, 61).The baculovirus microsomes were very turbid, and spectral
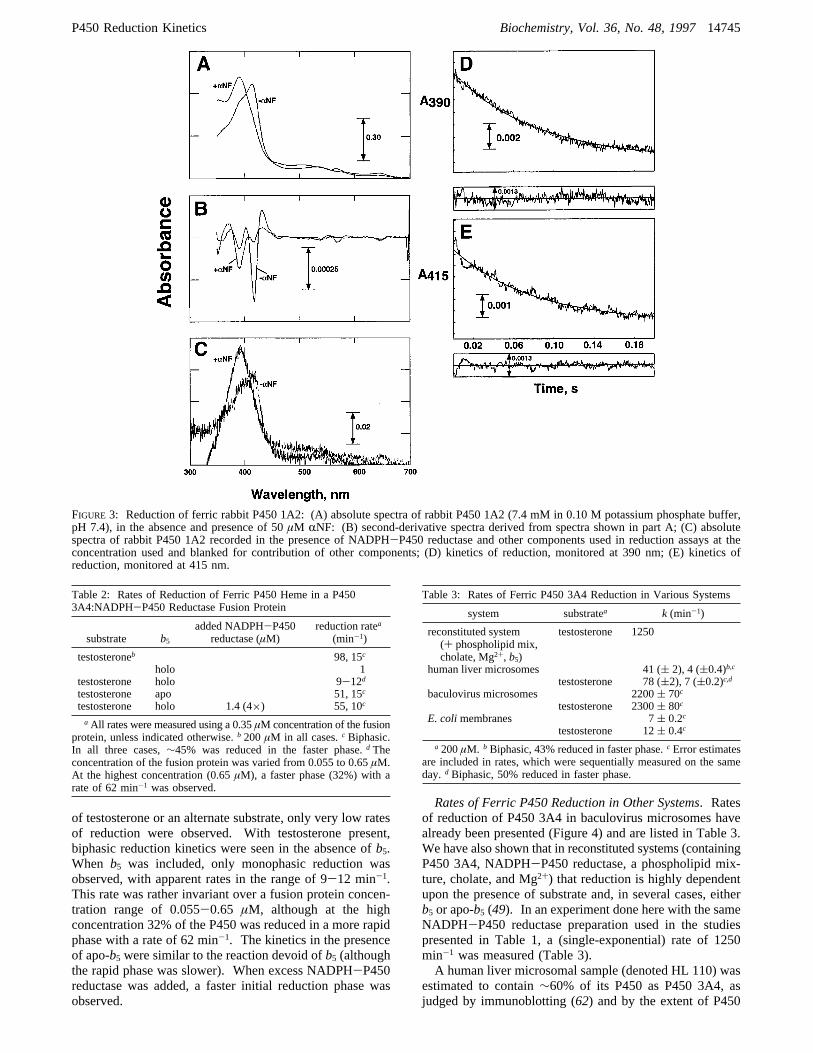
measurements were difficult (Figure 4A). However, theSoret region could be analyzed in such samples. Theaddition of the substrate testosterone produced a detectableshift in the spectrum, as shown in the expansion in the inset(Figure 4B). Second-derivative analysis indicated that theP450 3A4 was essentially completely in the low-spin state(417 nm band) in the absence of testosterone (Figure 4C).When testosterone was added, a strong shift to the high-spin form was seen in the second-derivative or the differencespectrum (Figure 4C,D).Measurements of rates of P450 reduction with this system
could be made when the optical density wase1.0. Althoughthere was some noise in the data, rates could readily bemeasured (Figure 4E). In the absence of testosterone, therate was 2200 min-1. In the presence of 100µM testosteronethe rate was 2300 min-1 (data not shown), within experi-mental error of the value measured in the absence oftestosterone.Rates of Ferric P450 Reduction in a P450 3A4:NADPH-
P450 Reductase Fusion Protein. Details of the reductionof a fusion protein were examined (Table 2). In the absence
Table 1: Rates of Reduction of Ferric P450s andb5 and of Substrate Oxidation
pre-steady-state rate of reduction (min-1)steady-state oxidation rate (min-1)
P450 substrate b5 P450% reduced infaster phase b5
% reduced infaster phase NADPH substrate
none - + 490/80 531A2 - - 800 - 41 -1A2 - + 690 2550 37 -1A2 phenacetin - 730 - 46 1a
1A2 phenacetin + 510 1380 46 1a
2C9 - - <4 - 18 -2C9 - + <4 26 11 -2C9 (S)-warfarin - 200/11 37 - 17 0.01b
2C9 (S)-warfarin + 160/11 45 200/25 70 13 0.05b
2C9 tolbutamide - 250/9 56 - 31 2.6b
2C9 tolbutamide + 160/6 48 14 6.3b
2C9 - (apob5) <4 - -c 5.5b
2C19 - - 170/17 - -c 1.7d
2C19 (S)-mephenytoin - 960/120 - -c 4.4d
2E1 - - 1920/280 79 - 452E1 - + 400/14 20 800/70 52 24 -2E1 C2H5OHe - 1380/12 59 - 25 7.3f
2E1 C2H5OHe + 100/17 38 210/26 36 43 10.4f
2E1 - (apo-b5) 1920/100 69 - -e
aReference 33.bReference 56.c Assays not done.dResults from Drs. H. Yamazaki, T. Shimada, and F. P. Guengerich (unpublished results).e 40 mM C2H5OH. f Results from ref 59.
14744 Biochemistry, Vol. 36, No. 48, 1997 Guengerich and Johnson
of testosterone or an alternate substrate, only very low ratesof reduction were observed. With testosterone present,biphasic reduction kinetics were seen in the absence ofb5.When b5 was included, only monophasic reduction wasobserved, with apparent rates in the range of 9-12 min-1.This rate was rather invariant over a fusion protein concen-tration range of 0.055-0.65 µM, although at the highconcentration 32% of the P450 was reduced in a more rapidphase with a rate of 62 min-1. The kinetics in the presenceof apo-b5 were similar to the reaction devoid ofb5 (althoughthe rapid phase was slower). When excess NADPH-P450reductase was added, a faster initial reduction phase wasobserved.
Rates of Ferric P450 Reduction in Other Systems. Ratesof reduction of P450 3A4 in baculovirus microsomes havealready been presented (Figure 4) and are listed in Table 3.We have also shown that in reconstituted systems (containingP450 3A4, NADPH-P450 reductase, a phospholipid mix-ture, cholate, and Mg2+) that reduction is highly dependentupon the presence of substrate and, in several cases, eitherb5 or apo-b5 (49). In an experiment done here with the sameNADPH-P450 reductase preparation used in the studiespresented in Table 1, a (single-exponential) rate of 1250min-1 was measured (Table 3).A human liver microsomal sample (denoted HL 110) was
estimated to contain∼60% of its P450 as P450 3A4, asjudged by immunoblotting (62) and by the extent of P450
FIGURE 3: Reduction of ferric rabbit P450 1A2: (A) absolute spectra of rabbit P450 1A2 (7.4 mM in 0.10 M potassium phosphate buffer,pH 7.4), in the absence and presence of 50µM RNF: (B) second-derivative spectra derived from spectra shown in part A; (C) absolutespectra of rabbit P450 1A2 recorded in the presence of NADPH-P450 reductase and other components used in reduction assays at theconcentration used and blanked for contribution of other components; (D) kinetics of reduction, monitored at 390 nm; (E) kinetics ofreduction, monitored at 415 nm.
Table 2: Rates of Reduction of Ferric P450 Heme in a P4503A4:NADPH-P450 Reductase Fusion Protein
substrate b5added NADPH-P450
reductase (µM)reduction ratea
(min-1)
testosteroneb 98, 15c
holo 1testosterone holo 9-12dtestosterone apo 51, 15c
testosterone holo 1.4 (4×) 55, 10c
aAll rates were measured using a 0.35µM concentration of the fusionprotein, unless indicated otherwise.b 200µM in all cases.c Biphasic.In all three cases,∼45% was reduced in the faster phase.d Theconcentration of the fusion protein was varied from 0.055 to 0.65µM.At the highest concentration (0.65µM), a faster phase (32%) with arate of 62 min-1 was observed.
Table 3: Rates of Ferric P450 3A4 Reduction in Various Systems
system substratea k (min-1)
reconstituted system(+ phospholipid mix,cholate, Mg2+, b5)
testosterone 1250
human liver microsomes 41 (( 2), 4 ((0.4)b,ctestosterone 78 ((2), 7 ((0.2)c,d
baculovirus microsomes 2200( 70c
testosterone 2300( 80c
E. colimembranes 7( 0.2c
testosterone 12( 0.4c
a 200µM. b Biphasic, 43% reduced in faster phase.c Error estimatesare included in rates, which were sequentially measured on the sameday. d Biphasic, 50% reduced in faster phase.
P450 Reduction Kinetics Biochemistry, Vol. 36, No. 48, 199714745
destruction by the mechanism-based inactivator gestodene(55). Reduction kinetics were biphasic (Figure 1). Thecontributions of individual P450s in the reduction cannot beascertained. The rate of the rapid reduction was increasedin the presence of the P450 3A4 substrate testosterone (Table3).Another system involvesE. colimembranes in which P450
3A4 and human NADPH-P450 reductase have been ex-pressed at equimolar levels, utilizing a bicistronic expressionconstruct (43). Reduction was monophasic. The rate was7 min-1 in the absence of testosterone and increased to 12min-1 in its presence (Table 3).Simulation of Rates of Electron Transfer between P450
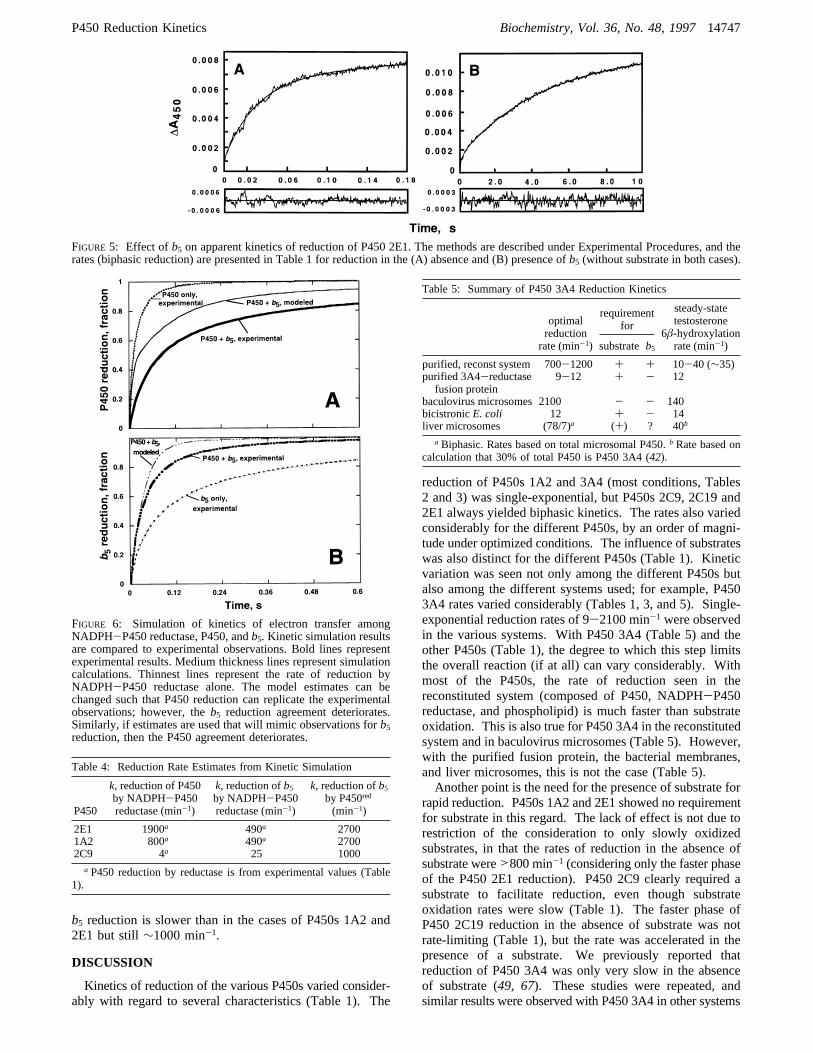
and b5. There is a distinct decrease in the observed reductionrates of P450 2E1 and P450 1A2 whenb5 is present, whilethe observed reduction ofb5 in this system is much fasterthan that catalyzed by NADPH-P450 reductase in theabsence of P450 (Table 1). To account for this behavior,we postulate that the rates observed are a composite ofreactions that include a rapid reduction ofb5 by ferrous P450.Hence, we modeled the individual reaction kinetics math-ematically using simulation software. The reactions arereduction of ferric P450 by reductase (experimentallymeasured), reduction ofb5 by reductase (experimentallymeasured), reduction ofb5 by ferrous P450, reduction ofb5by CO-complexed ferrous P450, and binding of CO to P450to form a binary complex. The following equilibria
were considered using a KINSIM modeling program (63)to rationalize some of the effects ofb5 and P450s on thekinetics of reduction of each other. Reaction 3 was given adiffusion-limited forward rate constant and aKeq of 1 µM(64), since CO association to ferrous P450 is usuallyconsidered to be effectively irreversible under a CO atmo-sphere. In each case considered, the rate of P450 reductionin the absence ofb5 was known (Table 1). The rate ofb5reduction (eq 2) was measured (Table 1) in the absence ofP450, and the reverse reaction was assumed not to contribute.Equation 4 is the major focus of our kinetic considerationin the modeling. The thermodynamics have some uncer-tainty. TheEm,7 of theb5 is well-established at∼0 mV (65,66), but theEm,7 values are not known for any of the humanP450s under consideration here except P450 1A2 and 3A4(49) and, because of the effect of CO on the equilibrium,the potential of the P450red‚CO a P450ox couple is highlydependent upon the CO affinity.
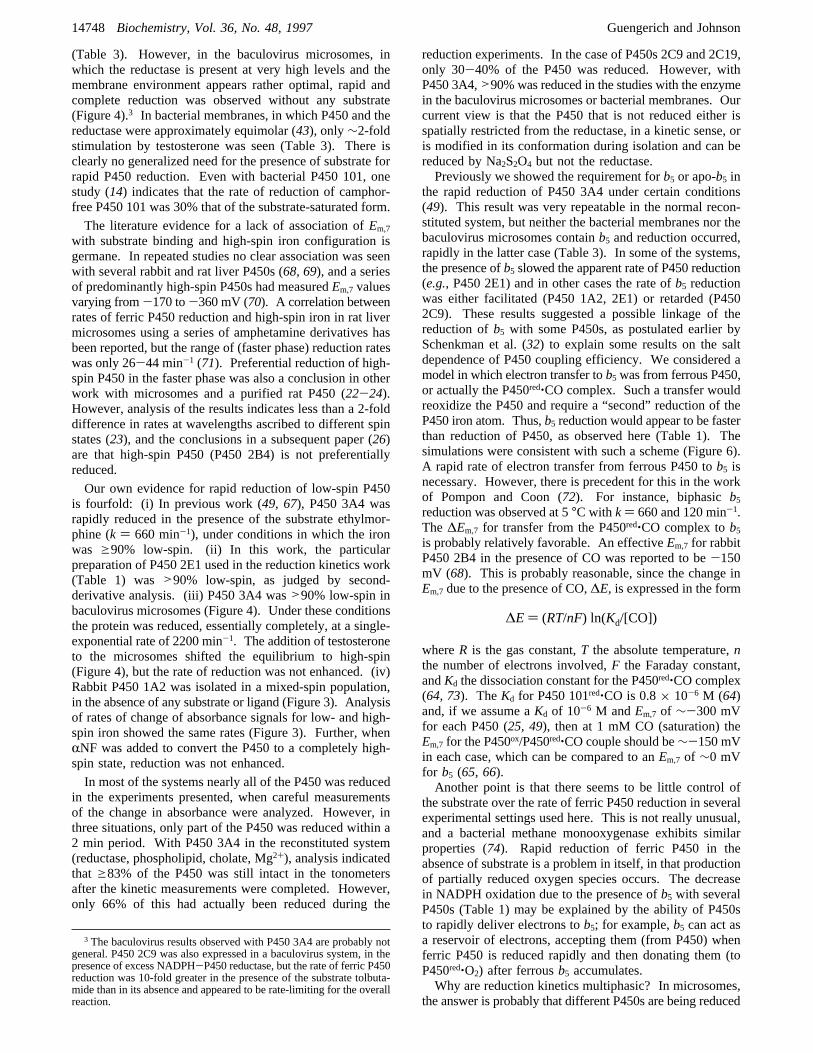
The model calculates and displays the relationship ofoverall P450 andb5 reduction to time (e.g.Figures 5 and 6).From this two-dimensional representation a rate of changecan be estimated. This was then iteratively compared to theexperimentally observed reaction rates, and rational adjust-ments in the estimates were made (Table 4). For the caseof P450 2E1 a reduction rate ofb5 by P450red‚CO estimatedat∼2700 min-1 will satisfy the observed rates of reduction.Similarly, the P450 1A2 case is satisfied by an estimate of∼2700 min-1. The experimentally determined rate ofb5reduction in the presence of P450 2C9 was much lower thanin the absence of P450 (Table 1), and a model in whichb5is partially “blocked” from the reductase was used. Ak of25 min-1 for reduction ofb5 by NADPH-P450 reductaseyielded a satisfactory approximation to the experimentalresults (absence of substrate, Table 1); the simulated rate of
FIGURE 4: Spectra of P450 3A4 in baculovirus microsomes and reduction kinetics: (A) absolute spectra of baculovirus microsomes inwhich P450 3A4 was expressed, with the indicated trace recorded after adding 100µM testosterone (all in 100 mM potassium phosphatebuffer, pH 7.4); (B) expanded portion of the spectra of part A; (C) second-derivative spectra from part A; (D) difference spectrum from partA (minus testosterone spectrum subtracted from plus testosterone spectrum); (E) kinetics of anaerobic reduction of baculovirus microsomes(with P450 3A4 expressed) [the atmosphere was anaerobic CO, and the P450 concentration (0.5µM) was the same as in parts A-D; therate was 2100 min-1].
reductasered+ P450ox a reductaseox + P450red (1)
reductasered+ b5ox a reductaseox + b5
red (2)
P450red+ COa P450red‚CO (3)
P450red‚CO+ b5ox a P450ox + b5
red (4)
14746 Biochemistry, Vol. 36, No. 48, 1997 Guengerich and Johnson
b5 reduction is slower than in the cases of P450s 1A2 and2E1 but still∼1000 min-1.
DISCUSSION
Kinetics of reduction of the various P450s varied consider-ably with regard to several characteristics (Table 1). The
reduction of P450s 1A2 and 3A4 (most conditions, Tables2 and 3) was single-exponential, but P450s 2C9, 2C19 and2E1 always yielded biphasic kinetics. The rates also variedconsiderably for the different P450s, by an order of magni-tude under optimized conditions. The influence of substrateswas also distinct for the different P450s (Table 1). Kineticvariation was seen not only among the different P450s butalso among the different systems used; for example, P4503A4 rates varied considerably (Tables 1, 3, and 5). Single-exponential reduction rates of 9-2100 min-1 were observedin the various systems. With P450 3A4 (Table 5) and theother P450s (Table 1), the degree to which this step limitsthe overall reaction (if at all) can vary considerably. Withmost of the P450s, the rate of reduction seen in thereconstituted system (composed of P450, NADPH-P450reductase, and phospholipid) is much faster than substrateoxidation. This is also true for P450 3A4 in the reconstitutedsystem and in baculovirus microsomes (Table 5). However,with the purified fusion protein, the bacterial membranes,and liver microsomes, this is not the case (Table 5).Another point is the need for the presence of substrate for
rapid reduction. P450s 1A2 and 2E1 showed no requirementfor substrate in this regard. The lack of effect is not due torestriction of the consideration to only slowly oxidizedsubstrates, in that the rates of reduction in the absence ofsubstrate were>800 min-1 (considering only the faster phaseof the P450 2E1 reduction). P450 2C9 clearly required asubstrate to facilitate reduction, even though substrateoxidation rates were slow (Table 1). The faster phase ofP450 2C19 reduction in the absence of substrate was notrate-limiting (Table 1), but the rate was accelerated in thepresence of a substrate. We previously reported thatreduction of P450 3A4 was only very slow in the absenceof substrate (49, 67). These studies were repeated, andsimilar results were observed with P450 3A4 in other systems
FIGURE 5: Effect ofb5 on apparent kinetics of reduction of P450 2E1. The methods are described under Experimental Procedures, and therates (biphasic reduction) are presented in Table 1 for reduction in the (A) absence and (B) presence ofb5 (without substrate in both cases).
FIGURE 6: Simulation of kinetics of electron transfer amongNADPH-P450 reductase, P450, andb5. Kinetic simulation resultsare compared to experimental observations. Bold lines representexperimental results. Medium thickness lines represent simulationcalculations. Thinnest lines represent the rate of reduction byNADPH-P450 reductase alone. The model estimates can bechanged such that P450 reduction can replicate the experimentalobservations; however, theb5 reduction agreement deteriorates.Similarly, if estimates are used that will mimic observations forb5reduction, then the P450 agreement deteriorates.
Table 4: Reduction Rate Estimates from Kinetic Simulation
P450
k, reduction of P450by NADPH-P450reductase (min-1)
k, reduction ofb5by NADPH-P450reductase (min-1)
k, reduction ofb5by P450red
(min-1)
2E1 1900a 490a 27001A2 800a 490a 27002C9 4a 25 1000
a P450 reduction by reductase is from experimental values (Table1).
Table 5: Summary of P450 3A4 Reduction Kinetics
requirementforoptimal
reductionrate (min-1) substrateb5
steady-statetestosterone
6â-hydroxylationrate (min-1)
purified, reconst system 700-1200 + + 10-40 (∼35)purified 3A4-reductasefusion protein
9-12 + - 12
baculovirus microsomes 2100 - - 140bicistronicE. coli 12 + - 14liver microsomes (78/7)a (+) ? 40b
a Biphasic. Rates based on total microsomal P450.bRate based oncalculation that 30% of total P450 is P450 3A4 (42).
P450 Reduction Kinetics Biochemistry, Vol. 36, No. 48, 199714747
(Table 3). However, in the baculovirus microsomes, inwhich the reductase is present at very high levels and themembrane environment appears rather optimal, rapid andcomplete reduction was observed without any substrate(Figure 4).3 In bacterial membranes, in which P450 and thereductase were approximately equimolar (43), only∼2-foldstimulation by testosterone was seen (Table 3). There isclearly no generalized need for the presence of substrate forrapid P450 reduction. Even with bacterial P450 101, onestudy (14) indicates that the rate of reduction of camphor-free P450 101 was 30% that of the substrate-saturated form.
The literature evidence for a lack of association ofEm,7with substrate binding and high-spin iron configuration isgermane. In repeated studies no clear association was seenwith several rabbit and rat liver P450s (68, 69), and a seriesof predominantly high-spin P450s had measuredEm,7 valuesvarying from-170 to-360 mV (70). A correlation betweenrates of ferric P450 reduction and high-spin iron in rat livermicrosomes using a series of amphetamine derivatives hasbeen reported, but the range of (faster phase) reduction rateswas only 26-44 min-1 (71). Preferential reduction of high-spin P450 in the faster phase was also a conclusion in otherwork with microsomes and a purified rat P450 (22-24).However, analysis of the results indicates less than a 2-folddifference in rates at wavelengths ascribed to different spinstates (23), and the conclusions in a subsequent paper (26)are that high-spin P450 (P450 2B4) is not preferentiallyreduced.
Our own evidence for rapid reduction of low-spin P450is fourfold: (i) In previous work (49, 67), P450 3A4 wasrapidly reduced in the presence of the substrate ethylmor-phine (k ) 660 min-1), under conditions in which the ironwas g90% low-spin. (ii) In this work, the particularpreparation of P450 2E1 used in the reduction kinetics work(Table 1) was>90% low-spin, as judged by second-derivative analysis. (iii) P450 3A4 was>90% low-spin inbaculovirus microsomes (Figure 4). Under these conditionsthe protein was reduced, essentially completely, at a single-exponential rate of 2200 min-1. The addition of testosteroneto the microsomes shifted the equilibrium to high-spin(Figure 4), but the rate of reduction was not enhanced. (iv)Rabbit P450 1A2 was isolated in a mixed-spin population,in the absence of any substrate or ligand (Figure 3). Analysisof rates of change of absorbance signals for low- and high-spin iron showed the same rates (Figure 3). Further, whenRNF was added to convert the P450 to a completely high-spin state, reduction was not enhanced.
In most of the systems nearly all of the P450 was reducedin the experiments presented, when careful measurementsof the change in absorbance were analyzed. However, inthree situations, only part of the P450 was reduced within a2 min period. With P450 3A4 in the reconstituted system(reductase, phospholipid, cholate, Mg2+), analysis indicatedthat g83% of the P450 was still intact in the tonometersafter the kinetic measurements were completed. However,only 66% of this had actually been reduced during the
reduction experiments. In the case of P450s 2C9 and 2C19,only 30-40% of the P450 was reduced. However, withP450 3A4,>90% was reduced in the studies with the enzymein the baculovirus microsomes or bacterial membranes. Ourcurrent view is that the P450 that is not reduced either isspatially restricted from the reductase, in a kinetic sense, oris modified in its conformation during isolation and can bereduced by Na2S2O4 but not the reductase.Previously we showed the requirement forb5 or apo-b5 in
the rapid reduction of P450 3A4 under certain conditions(49). This result was very repeatable in the normal recon-stituted system, but neither the bacterial membranes nor thebaculovirus microsomes containb5 and reduction occurred,rapidly in the latter case (Table 3). In some of the systems,the presence ofb5 slowed the apparent rate of P450 reduction(e.g., P450 2E1) and in other cases the rate ofb5 reductionwas either facilitated (P450 1A2, 2E1) or retarded (P4502C9). These results suggested a possible linkage of thereduction ofb5 with some P450s, as postulated earlier bySchenkman et al. (32) to explain some results on the saltdependence of P450 coupling efficiency. We considered amodel in which electron transfer tob5 was from ferrous P450,or actually the P450red‚CO complex. Such a transfer wouldreoxidize the P450 and require a “second” reduction of theP450 iron atom. Thus,b5 reduction would appear to be fasterthan reduction of P450, as observed here (Table 1). Thesimulations were consistent with such a scheme (Figure 6).A rapid rate of electron transfer from ferrous P450 tob5 isnecessary. However, there is precedent for this in the workof Pompon and Coon (72). For instance, biphasicb5reduction was observed at 5°C with k) 660 and 120 min-1.The∆Em,7 for transfer from the P450red‚CO complex tob5is probably relatively favorable. An effectiveEm,7 for rabbitP450 2B4 in the presence of CO was reported to be-150mV (68). This is probably reasonable, since the change inEm,7 due to the presence of CO,∆E, is expressed in the form
whereR is the gas constant,T the absolute temperature,nthe number of electrons involved,F the Faraday constant,andKd the dissociation constant for the P450red‚CO complex(64, 73). TheKd for P450 101red‚CO is 0.8× 10⁻⁶ M (64)and, if we assume aKd of 10-6 M andEm,7 of ∼-300 mVfor each P450 (25, 49), then at 1 mM CO (saturation) theEm,7 for the P450ox/P450red‚CO couple should be∼-150 mVin each case, which can be compared to anEm,7 of ∼0 mVfor b5 (65, 66).Another point is that there seems to be little control of
the substrate over the rate of ferric P450 reduction in severalexperimental settings used here. This is not really unusual,and a bacterial methane monooxygenase exhibits similarproperties (74). Rapid reduction of ferric P450 in theabsence of substrate is a problem in itself, in that productionof partially reduced oxygen species occurs. The decreasein NADPH oxidation due to the presence ofb5 with severalP450s (Table 1) may be explained by the ability of P450sto rapidly deliver electrons tob5; for example,b5 can act asa reservoir of electrons, accepting them (from P450) whenferric P450 is reduced rapidly and then donating them (toP450red‚O2) after ferrousb5 accumulates.Why are reduction kinetics multiphasic? In microsomes,
the answer is probably that different P450s are being reduced
3 The baculovirus results observed with P450 3A4 are probably notgeneral. P450 2C9 was also expressed in a baculovirus system, in thepresence of excess NADPH-P450 reductase, but the rate of ferric P450reduction was 10-fold greater in the presence of the substrate tolbuta-mide than in its absence and appeared to be rate-limiting for the overallreaction.
∆E) (RT/nF) ln(Kd/[CO])
14748 Biochemistry, Vol. 36, No. 48, 1997 Guengerich and Johnson
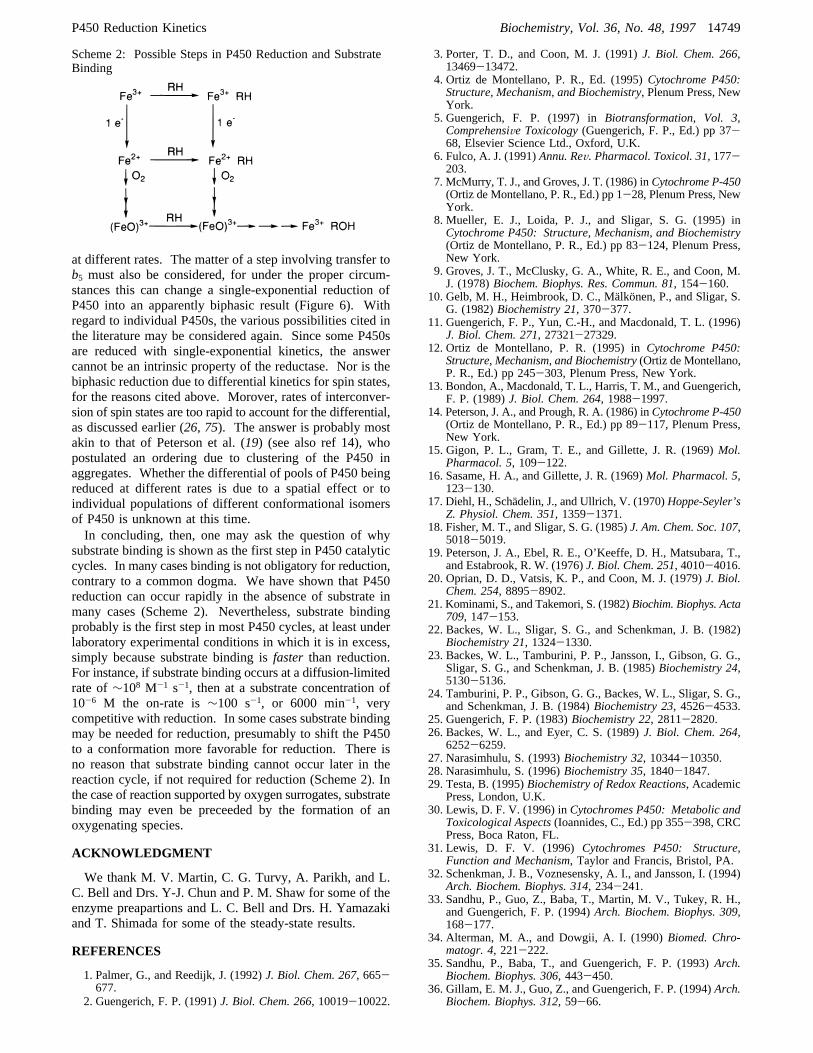
at different rates. The matter of a step involving transfer tob5 must also be considered, for under the proper circum-stances this can change a single-exponential reduction ofP450 into an apparently biphasic result (Figure 6). Withregard to individual P450s, the various possibilities cited inthe literature may be considered again. Since some P450sare reduced with single-exponential kinetics, the answercannot be an intrinsic property of the reductase. Nor is thebiphasic reduction due to differential kinetics for spin states,for the reasons cited above. Morover, rates of interconver-sion of spin states are too rapid to account for the differential,as discussed earlier (26, 75). The answer is probably mostakin to that of Peterson et al. (19) (see also ref 14), whopostulated an ordering due to clustering of the P450 inaggregates. Whether the differential of pools of P450 beingreduced at different rates is due to a spatial effect or toindividual populations of different conformational isomersof P450 is unknown at this time.In concluding, then, one may ask the question of why
substrate binding is shown as the first step in P450 catalyticcycles. In many cases binding is not obligatory for reduction,contrary to a common dogma. We have shown that P450reduction can occur rapidly in the absence of substrate inmany cases (Scheme 2). Nevertheless, substrate bindingprobably is the first step in most P450 cycles, at least underlaboratory experimental conditions in which it is in excess,simply because substrate binding isfaster than reduction.For instance, if substrate binding occurs at a diffusion-limitedrate of∼108 M-1 s-1, then at a substrate concentration of10-6 M the on-rate is∼100 s-1, or 6000 min-1, verycompetitive with reduction. In some cases substrate bindingmay be needed for reduction, presumably to shift the P450to a conformation more favorable for reduction. There isno reason that substrate binding cannot occur later in thereaction cycle, if not required for reduction (Scheme 2). Inthe case of reaction supported by oxygen surrogates, substratebinding may even be preceeded by the formation of anoxygenating species.
ACKNOWLEDGMENT
We thank M. V. Martin, C. G. Turvy, A. Parikh, and L.C. Bell and Drs. Y-J. Chun and P. M. Shaw for some of theenzyme preapartions and L. C. Bell and Drs. H. Yamazakiand T. Shimada for some of the steady-state results.
REFERENCES
1. Palmer, G., and Reedijk, J. (1992)J. Biol. Chem. 267, 665-677.
2. Guengerich, F. P. (1991)J. Biol. Chem. 266, 10019-10022.
3. Porter, T. D., and Coon, M. J. (1991)J. Biol. Chem. 266,13469-13472.
4. Ortiz de Montellano, P. R., Ed. (1995)Cytochrome P450:Structure, Mechanism, and Biochemistry, Plenum Press, NewYork.
5. Guengerich, F. P. (1997) inBiotransformation, Vol. 3,ComprehensiVe Toxicology(Guengerich, F. P., Ed.) pp 37-68, Elsevier Science Ltd., Oxford, U.K.
6. Fulco, A. J. (1991)Annu. ReV. Pharmacol. Toxicol. 31, 177-203.
7. McMurry, T. J., and Groves, J. T. (1986) inCytochrome P-450(Ortiz de Montellano, P. R., Ed.) pp 1-28, Plenum Press, NewYork.
8. Mueller, E. J., Loida, P. J., and Sligar, S. G. (1995) inCytochrome P450: Structure, Mechanism, and Biochemistry(Ortiz de Montellano, P. R., Ed.) pp 83-124, Plenum Press,New York.
9. Groves, J. T., McClusky, G. A., White, R. E., and Coon, M.J. (1978)Biochem. Biophys. Res. Commun. 81, 154-160.
10. Gelb, M. H., Heimbrook, D. C., Ma¨lkonen, P., and Sligar, S.G. (1982)Biochemistry 21, 370-377.
11. Guengerich, F. P., Yun, C.-H., and Macdonald, T. L. (1996)J. Biol. Chem. 271, 27321-27329.
12. Ortiz de Montellano, P. R. (1995) inCytochrome P450:Structure, Mechanism, and Biochemistry(Ortiz de Montellano,P. R., Ed.) pp 245-303, Plenum Press, New York.
13. Bondon, A., Macdonald, T. L., Harris, T. M., and Guengerich,F. P. (1989)J. Biol. Chem. 264, 1988-1997.
14. Peterson, J. A., and Prough, R. A. (1986) inCytochrome P-450(Ortiz de Montellano, P. R., Ed.) pp 89-117, Plenum Press,New York.
15. Gigon, P. L., Gram, T. E., and Gillette, J. R. (1969)Mol.Pharmacol. 5, 109-122.
16. Sasame, H. A., and Gillette, J. R. (1969)Mol. Pharmacol. 5,123-130.
17. Diehl, H., Scha¨delin, J., and Ullrich, V. (1970)Hoppe-Seyler’sZ. Physiol. Chem. 351, 1359-1371.
18. Fisher, M. T., and Sligar, S. G. (1985)J. Am. Chem. Soc. 107,5018-5019.
19. Peterson, J. A., Ebel, R. E., O’Keeffe, D. H., Matsubara, T.,and Estabrook, R. W. (1976)J. Biol. Chem. 251, 4010-4016.
20. Oprian, D. D., Vatsis, K. P., and Coon, M. J. (1979)J. Biol.Chem. 254, 8895-8902.
21. Kominami, S., and Takemori, S. (1982)Biochim. Biophys. Acta709, 147-153.
22. Backes, W. L., Sligar, S. G., and Schenkman, J. B. (1982)Biochemistry 21, 1324-1330.
23. Backes, W. L., Tamburini, P. P., Jansson, I., Gibson, G. G.,Sligar, S. G., and Schenkman, J. B. (1985)Biochemistry 24,5130-5136.
24. Tamburini, P. P., Gibson, G. G., Backes, W. L., Sligar, S. G.,and Schenkman, J. B. (1984)Biochemistry 23, 4526-4533.
25. Guengerich, F. P. (1983)Biochemistry 22, 2811-2820.26. Backes, W. L., and Eyer, C. S. (1989)J. Biol. Chem. 264,
6252-6259.27. Narasimhulu, S. (1993)Biochemistry 32, 10344-10350.28. Narasimhulu, S. (1996)Biochemistry 35, 1840-1847.29. Testa, B. (1995)Biochemistry of Redox Reactions, Academic
Press, London, U.K.30. Lewis, D. F. V. (1996) inCytochromes P450: Metabolic and
Toxicological Aspects(Ioannides, C., Ed.) pp 355-398, CRCPress, Boca Raton, FL.
31. Lewis, D. F. V. (1996)Cytochromes P450: Structure,Function and Mechanism, Taylor and Francis, Bristol, PA.
32. Schenkman, J. B., Voznesensky, A. I., and Jansson, I. (1994)Arch. Biochem. Biophys. 314, 234-241.
33. Sandhu, P., Guo, Z., Baba, T., Martin, M. V., Tukey, R. H.,and Guengerich, F. P. (1994)Arch. Biochem. Biophys. 309,168-177.
34. Alterman, M. A., and Dowgii, A. I. (1990)Biomed. Chro-matogr. 4, 221-222.
35. Sandhu, P., Baba, T., and Guengerich, F. P. (1993)Arch.Biochem. Biophys. 306, 443-450.
36. Gillam, E. M. J., Guo, Z., and Guengerich, F. P. (1994)Arch.Biochem. Biophys. 312, 59-66.
Scheme 2: Possible Steps in P450 Reduction and SubstrateBinding
P450 Reduction Kinetics Biochemistry, Vol. 36, No. 48, 199714749
37. Gillam, E. M. J., Baba, T., Kim, B.-R., Ohmori, S., andGuengerich, F. P. (1993)Arch. Biochem. Biophys. 305, 123-131.
38. Strittmatter, P., Fleming, P., Connors, M., and Corcoran, D.(1978)Methods Enzymol. 52, 97-101.
39. Shimada, T., Misono, K. S., and Guengerich, F. P. (1986)J.Biol. Chem. 261, 909-921.
40. Shen, A. L., Porter, T. D., Wilson, T. E., and Kasper, C. B.(1989)J. Biol. Chem. 264, 7584-7589.
41. Guengerich, F. P., Parikh, A., Johnson, E. F., Richardson, T.H., von Wachenfeldt, C., Cosme, J., Jung, F., Strassburg, C.P., Manns, M. P., Tukey, R. H., Pritchard, M., Fournel-Gigleux, S., and Burchell, B. (1997)Drug Metab. Dispos.(inpress).
42. Shaw, P. M., Hosea, N. A., Thompson, D. V., Lenius, J. M.,and Guengerich, F. P. (1997)Arch. Biochem. Biophys.(inpress).
43. Parikh, A., Gillam, E. M. J., and Guengerich, F. P. (1997)Nat. Biotechnol. 15, 784-788.
44. Shet, M. S., Fisher, C. W., Holmans, P. L., and Estabrook, R.W. (1993)Proc. Natl. Acad. Sci. U.S.A. 90, 11748-11752.
45. Guengerich, F. P., Martin, M. V., Guo, Z., and Chun, Y.-J.(1996)Methods Enzymol. 272, 35-44.
46. Ueng, Y.-F., Kuwabara, T., Chun, Y.-J., and Guengerich, F.P. (1997)Biochemistry 36, 370-381.
47. Imaoka, S., Imai, Y., Shimada, T., and Funae, Y. (1992)Biochemistry 31, 6063-6069.
48. O’Haver, T. C., and Green, G. L. (1976)Anal. Chem. 48, 312-318.
49. Yamazaki, H., Johnson, W. W., Ueng, Y.-F., Shimada, T., andGuengerich, F. P. (1996)J. Biol. Chem. 271, 27438-27444.
50. Distlerath, L. M., Reilly, P. E. B., Martin, M. V., Davis, G.G., Wilkinson, G. R., and Guengerich, F. P. (1985)J. Biol.Chem. 260, 9057-9067.
51. Knodell, R. G., Hall, S. D., Wilkinson, G. R., and Guengerich,F. P. (1987)J. Pharmacol. Exp. Ther. 241, 1112-1119.
52. Kaminsky, L. S., Fasco, M. J., and Guengerich, F. P. (1979)J. Biol. Chem. 254, 9657-9662.
53. Shimada, T., Shea, J. P., and Guengerich, F. P. (1985)Anal.Biochem. 147, 174-179.
54. Brady, J. F., Lee, M. J., Li, M., Ishizaki, H., and Yang, C. S.(1988)Mol. Pharmacol. 33, 148-154.
55. Guengerich, F. P. (1990)Chem. Res. Toxicol. 3, 363-371.
56. Yamazaki, H., Gillam, E. M. J., Dong, M.-S., Johnson, W.W., Guengerich, F. P., and Shimada, T. (1997)Arch. Biochem.Biophys. 342, 329-337.
57. Oprian, D. D., and Coon, M. J. (1982)J. Biol. Chem. 257,8935-8944.
58. Bhattacharyya, A. K., Lipka, J. J., Waskell, L., and Tollin, G.(1991)Biochemistry 30, 759-765.
59. Bell, L. C., and Guengerich, F. P. (1997)J. Biol. Chem. 272,in press.
60. White, R. E., and Coon, M. J. (1982)J. Biol. Chem. 257,3073-3083.
61. Lee, C. A., Kadwell, S. H., Kost, T. A., and Serabjit-Singh,C. J. (1995)Arch. Biochem. Biophys. 319, 157-167.
62. Guengerich, F. P. (1988)Mol. Pharmacol. 33, 500-508.63. Barshop, B. A., Wrenn, R. F., and Frieden, C. (1983)Anal.
Biochem. 130, 134-145.64. Lau, S. M. C., Harder, P. A., and O’Keefe, D. P. (1993)
Biochemistry 32, 1945-1950.65. Velick, S. F., and Strittmatter, P. (1956)J. Biol. Chem. 221,
265-275.66. Seetharaman, R., White, S. P., and Rivera, M. (1996)
Biochemistry 35, 12455-12463.67. Yamazaki, H., Ueng, Y.-F., Shimada, T., and Guengerich, F.
P. (1995)Biochemistry 34, 8380-8389.68. Guengerich, F. P., Ballou, D. P., and Coon, M. J. (1975)J.
Biol. Chem. 250, 7405-7414.69. Backstrom, D., Ingelman-Sundberg, M., and Ehrenberg, A.
(1983)Acta Chem. Scand. 37, 891-894.70. Huang, Y. Y., Hara, T., Sligar, S., Coon, M. J., and Kimura,
T. (1986)Biochemistry 25, 1390-1394.71. Blanck, J., Rein, H., Sommer, M., Ristau, O., Smettan, G.,
and Ruckpaul, K. (1983)Biochem. Pharmacol. 32, 1683-1688.
72. Pompon, D., and Coon, M. J. (1984)J. Biol. Chem. 259,15377-15385.
73. Clark, W. M. (1960)Oxidation-Reduction Potentials ofOrganic Systems, Williams and Wilkins, Baltimore, MD.
74. Liu, Y., Nesheim, J. C., Lee, S. K., and Lipscomb, J. D. (1995)J. Biol. Chem. 270, 24662-24665.
75. Ziegler, M., Blanck, J., and Ruckpaul, K. (1982)FEBS Lett.150, 219-222.
BI9719399
14750 Biochemistry, Vol. 36, No. 48, 1997 Guengerich and Johnson