Embed Size (px)
Citation preview

i
Kitsap CountyStormwater
DesignManual
Figures & Tables
November 2009
DRAFT
i
Figures
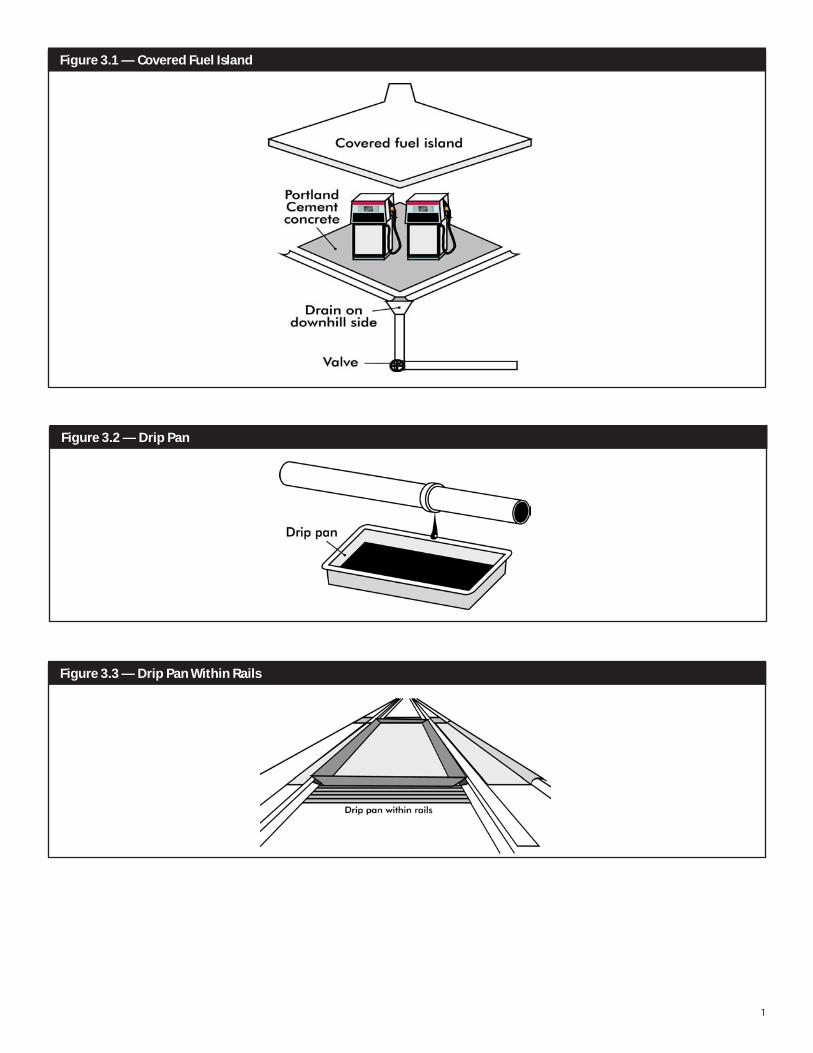
3.1 CoveredFuelIsland...............................................................................................................................................................................1
3.2 DripPan.....................................................................................................................................................................................................1
3.3 DripPanWithinRails.............................................................................................................................................................................1
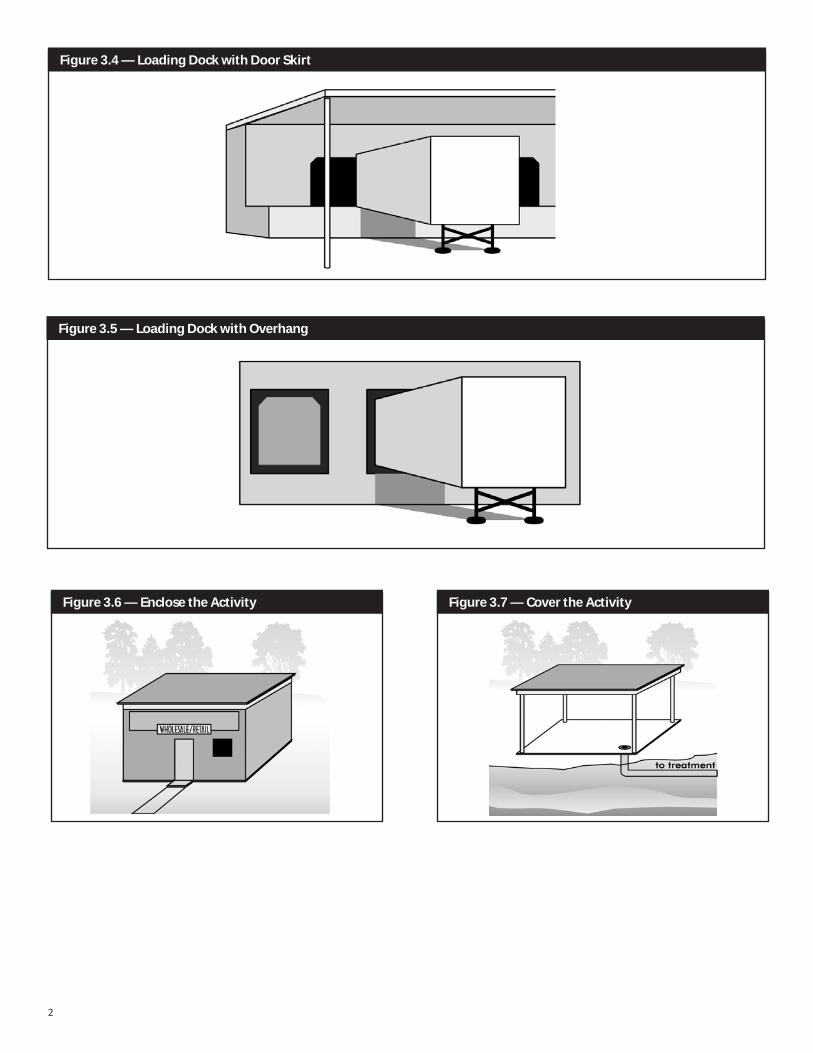
3.4 LoadingDockwithDoorSkirt...........................................................................................................................................................2
3.5 LoadingDockwithOverhang............................................................................................................................................................2
3.6 EnclosetheActivity...............................................................................................................................................................................2
3.7 CovertheActivity...................................................................................................................................................................................2
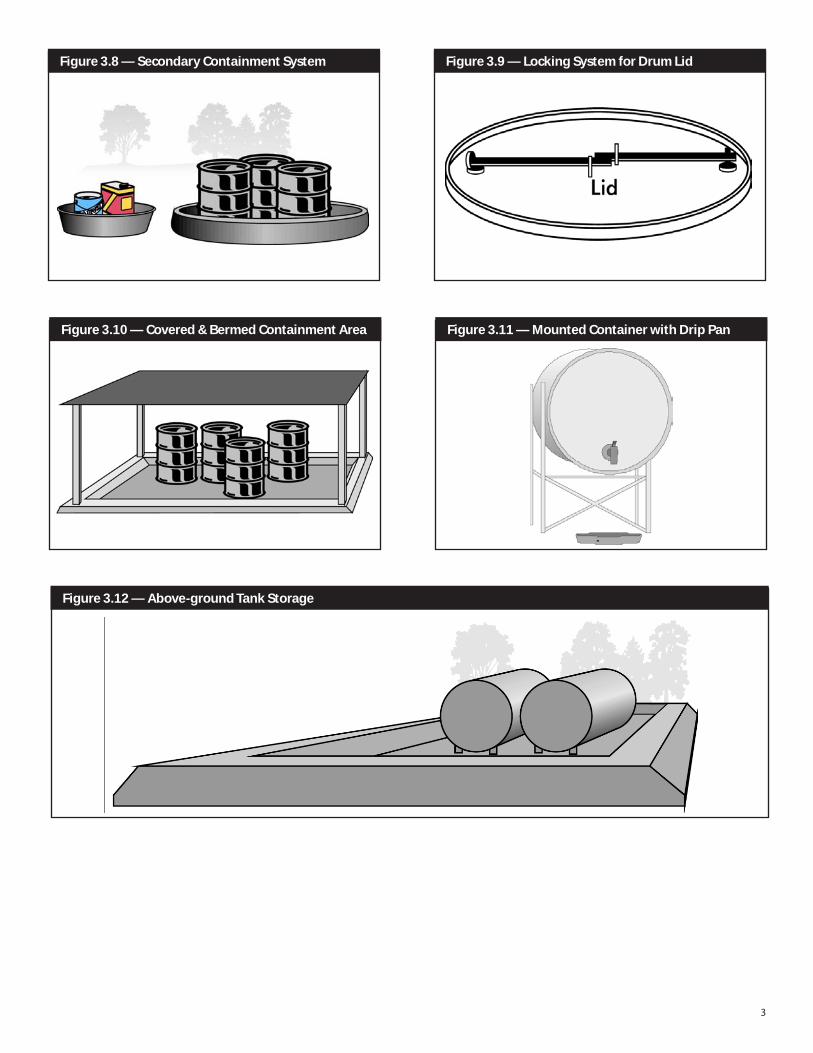
3.8 SecondaryContainmentSystem......................................................................................................................................................3
3.9 LockingsystemforDrumLid.............................................................................................................................................................3
3.10 Covered&BermedContainmentArea...........................................................................................................................................3
3.11 MountedContainerwithDripPan...................................................................................................................................................3
3.12 Above-groundTankStorage..............................................................................................................................................................3
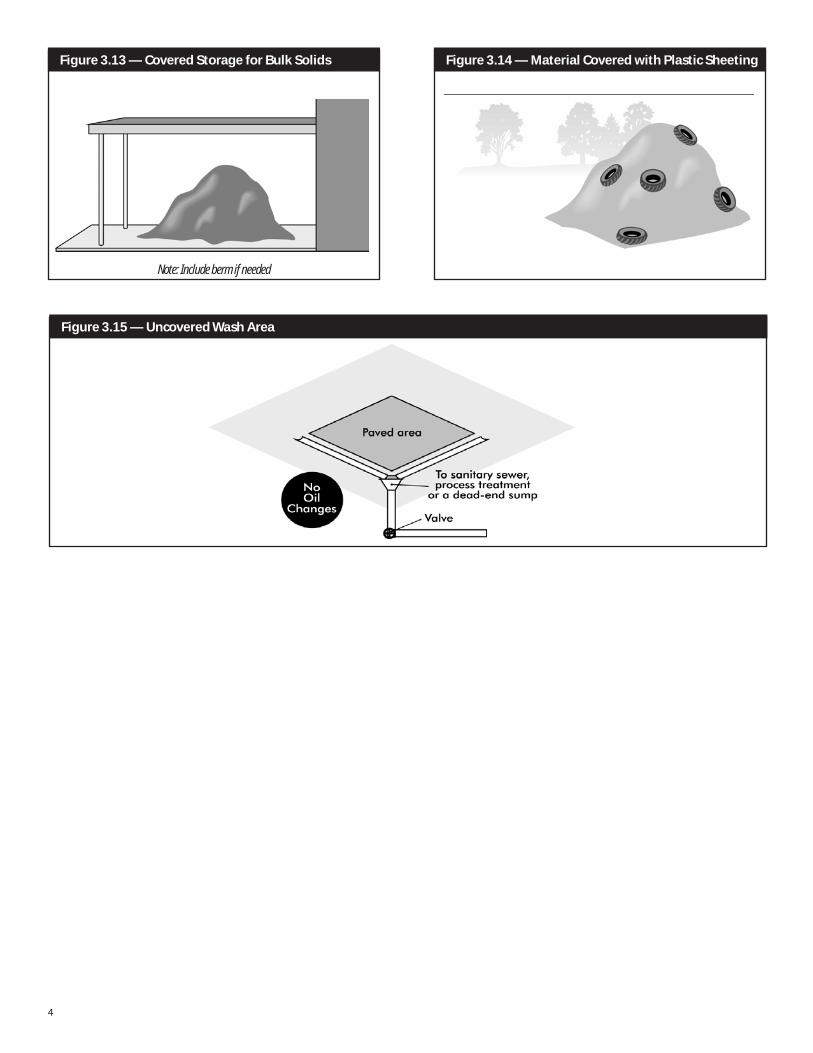
3.13 CoveredStorageforBulkSolids........................................................................................................................................................4
3.14 MaterialCoveredwithPlasticSheeting.........................................................................................................................................4
3.15 UncoveredWashArea...........................................................................................................................................................................4
4.1 RainfallIntensity-DurationCurves...................................................................................................................................................7
4.2 PipeCompactionDesignandBackfill.............................................................................................................................................8
4.3 PipeAnchorDetail.................................................................................................................................................................................9
4.4 CorrugatedMetalPipeCouplingand/orGeneralPipeAnchorAssembly.....................................................................10
4.5 DebrisBarrier(OffRoadRight-of-Way)........................................................................................................................................11
4.6 DebrisBarrier(InRoadRight-of-Way)..........................................................................................................................................12
4.7 NomographforSizingCircularDrainsFlowingFull................................................................................................................13
4.8 CircularChannelRatios.....................................................................................................................................................................14
4.9 BackwaterCalculationSheet...........................................................................................................................................................15
4.10 BackwaterCalculationSheetNotes..............................................................................................................................................16
4.11 BackwaterPipeCalculationExample...........................................................................................................................................17
4.12 BendHeadLossesinStructure.......................................................................................................................................................18
4.13 JunctionHeadLossinStructure....................................................................................................................................................19
4.14 TeeTypeEnergyDisipator................................................................................................................................................................20
4.15 PipeCulvertDischargeProtection................................................................................................................................................21
4.16 FlowDisposalTrench.........................................................................................................................................................................22
4.17 AlternativeFlowDisposalTrench..................................................................................................................................................23
4.18 GabionMattressDisipatorDetail..................................................................................................................................................24
4.19 Inlet/OutletControlConditions...................................................................................................................................................25
4.20 HeadwaterDepthforSmoothInteriorPipeCulvertswithInletControl.........................................................................26
4.21 HeadwaterDepthforCorrugatedPipeCulvertwithInletControl....................................................................................27
4.22 HeadforCulverts(PipeW/"N"=0.012)FlowingFullwithOutletControl......................................................................28
4.23 HeadforCulverts(PipeW/"N"=0.024)FlowingFullwithOutletControl........................................................................29
4.24 CriticalDepthofFlowforCircularCulverts................................................................................................................................30
4.25 MeanChannelVelocityvs.MediumStoneWeightandEquivalentStoneDiameter..................................................31
4.26 Riprap/FilterExampleGradationCurve......................................................................................................................................32
4.27 Ditches—CommonSections.........................................................................................................................................................33
428 DrainageDitches—CommonSections.....................................................................................................................................34
4.29 GeometricElementsOfCommonSections...............................................................................................................................35
4.30 OpenChannelFlowProfileComputation..................................................................................................................................36
ii
4.31 DirectStepBackwaterMethod-Example..................................................................................................................................37
4.32 FlowSplitter,OptionA......................................................................................................................................................................38
4.33 FlowSplitter,OptionB.......................................................................................................................................................................39
4.34 FlowSpreaderOptionA:AnchoredPlate...................................................................................................................................40
4.35 FlowSpreaderOptionB:ConcreteSumpBox..........................................................................................................................41
4.36 FlowSpreaderOptionC:NotchedCurbSpreader..................................................................................................................42
4.37 FlowSpreaderOptionD:Through-CurbPort............................................................................................................................42
5.1 BMP5.01RockFilledInfiltrationTrench......................................................................................................................................45
5.2 AlternativeRockFiledInfiltrationTrenchSystem....................................................................................................................46
5.3 Gravel-LessChamberInfiltrationTrench.....................................................................................................................................47
5.4 AverageAnnualRainfallInKitsapCounty..................................................................................................................................48
6.1 WaterQualityTreatmentBMPSelectionFlowChart..............................................................................................................51
6.2 SandFiltrationBasinPrecededbyPresettlingBasin..............................................................................................................52
6.3 SandFilterwithPretreatmentCell................................................................................................................................................53
6.4 SandFilterwithLevelSpreader......................................................................................................................................................54
6.5 SandFilterVault...................................................................................................................................................................................55
6.6 LinearSandFilter.................................................................................................................................................................................56
6.7 ShallowPlasticDrainageChannel.................................................................................................................................................57
6.8 StormFilterSchematic.......................................................................................................................................................................57
6.9 TypicalFilterStrip................................................................................................................................................................................58
6.10 FilterStripLenthsforNarrowRight-of-Way...............................................................................................................................59
6.11 KitsapMeanAnnualStorm..............................................................................................................................................................60
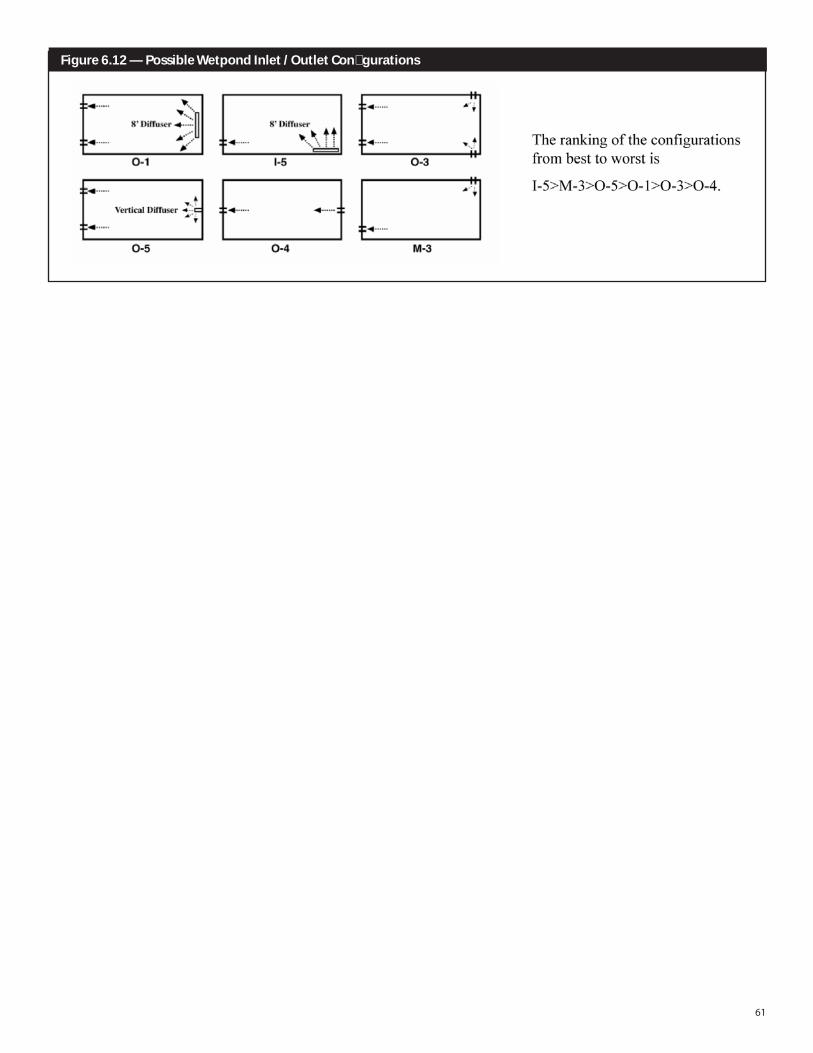
6.12 PossibleWetpondInlet/OutletConfigurations........................................................................................................................61
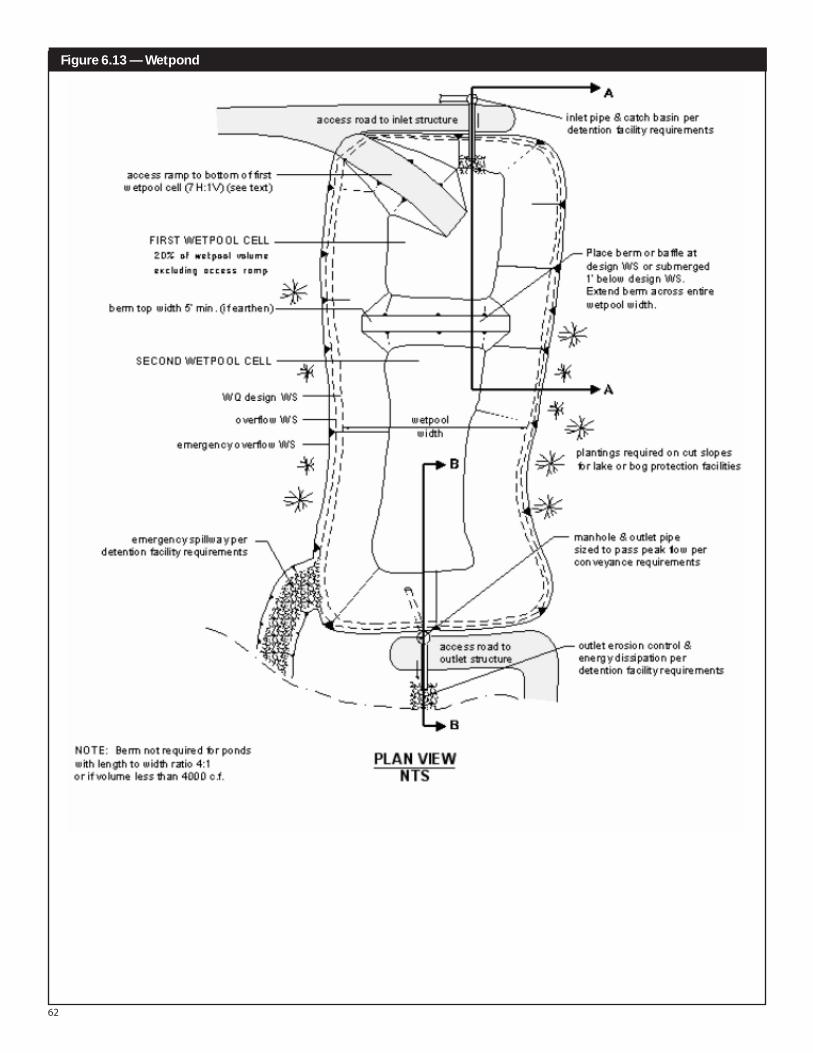
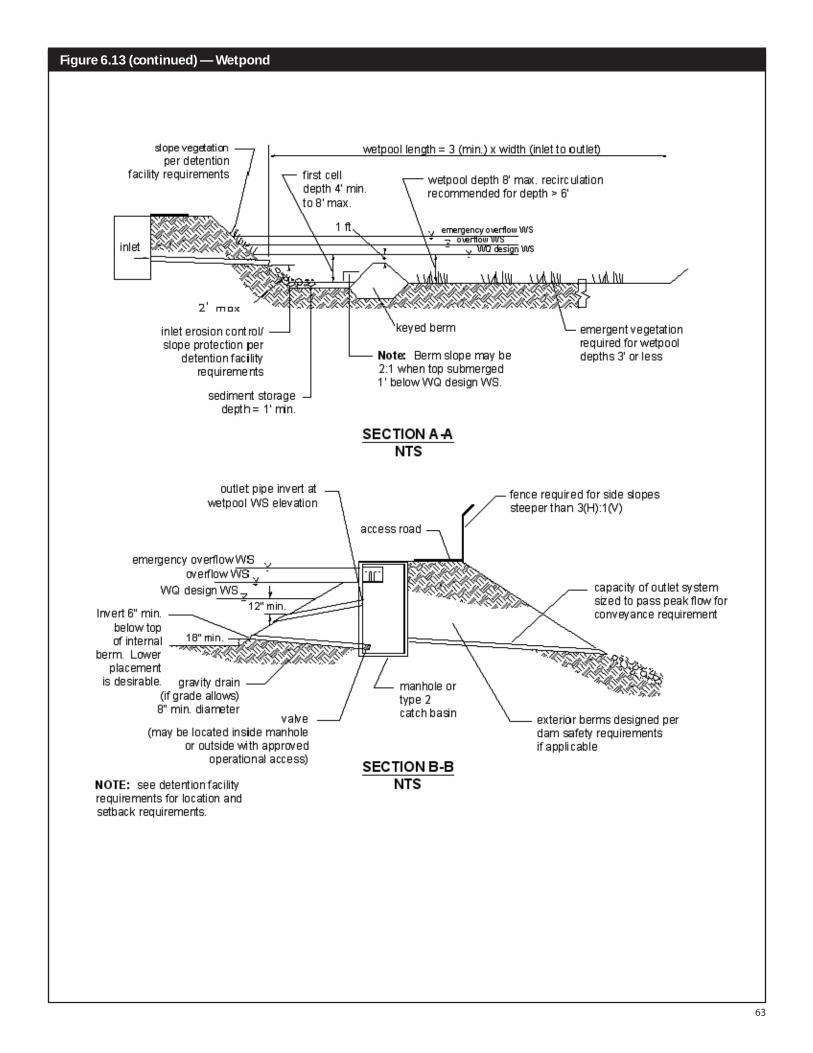
6.13 Wetpond...........................................................................................................................................................................................62-63
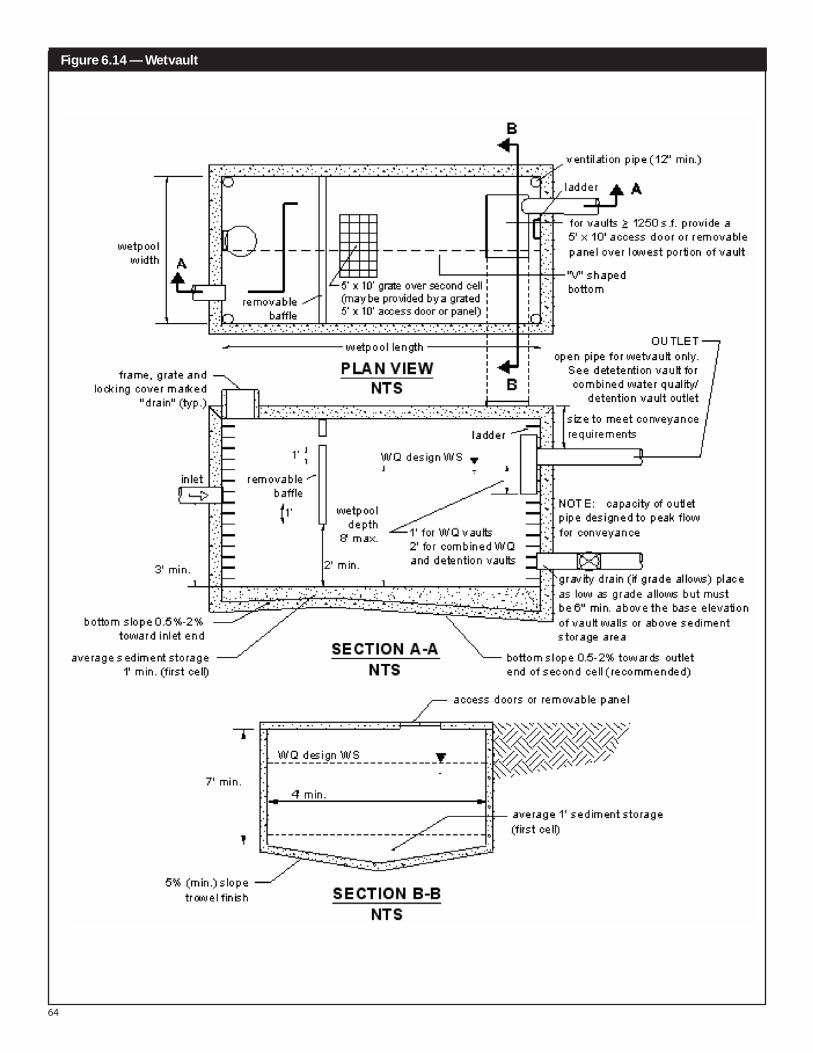
6.14 Wetvault.................................................................................................................................................................................................64
6.15 StormwaterTreatmentWetland–OptionA..............................................................................................................................65
6.16 StormwaterTreatmentWetland–OptionB..............................................................................................................................66
6.17 HeadwaterDepthforHeadwall.....................................................................................................................................................67
6.18 HeadwaterDepthforCorrugatedPipeCulvertswithInletControl..................................................................................68
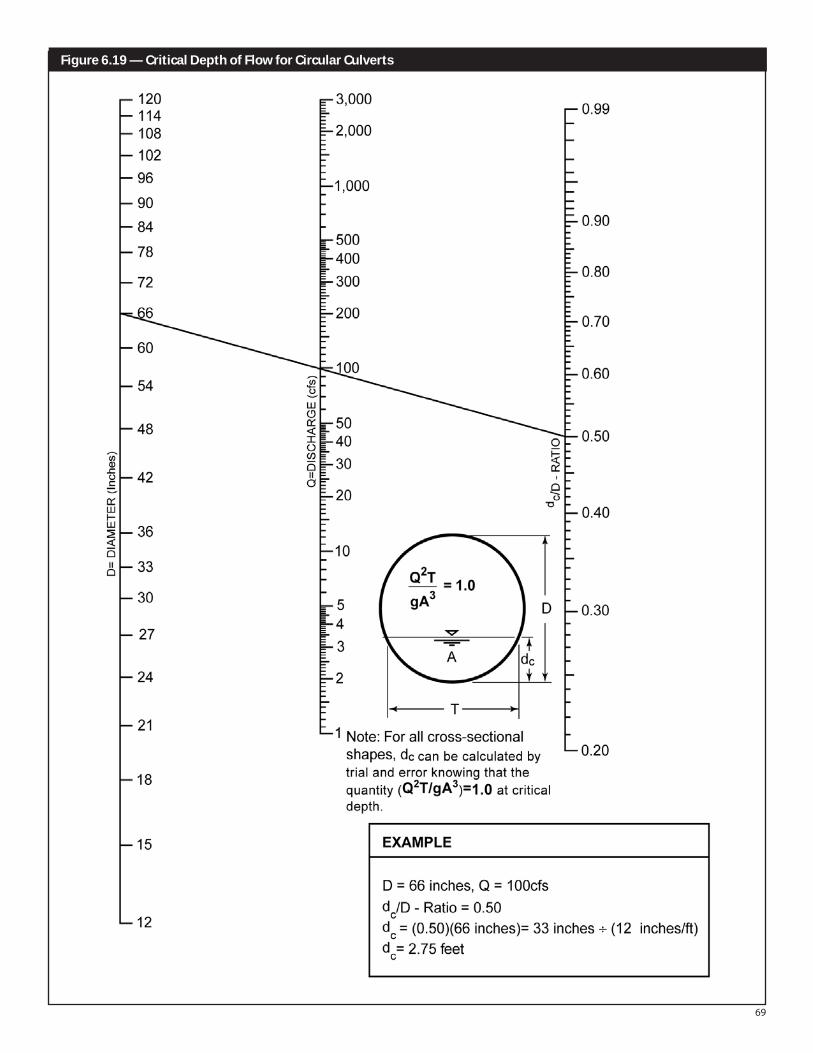
6.19 CriticalDepthofFlowforCircularCulverts................................................................................................................................69
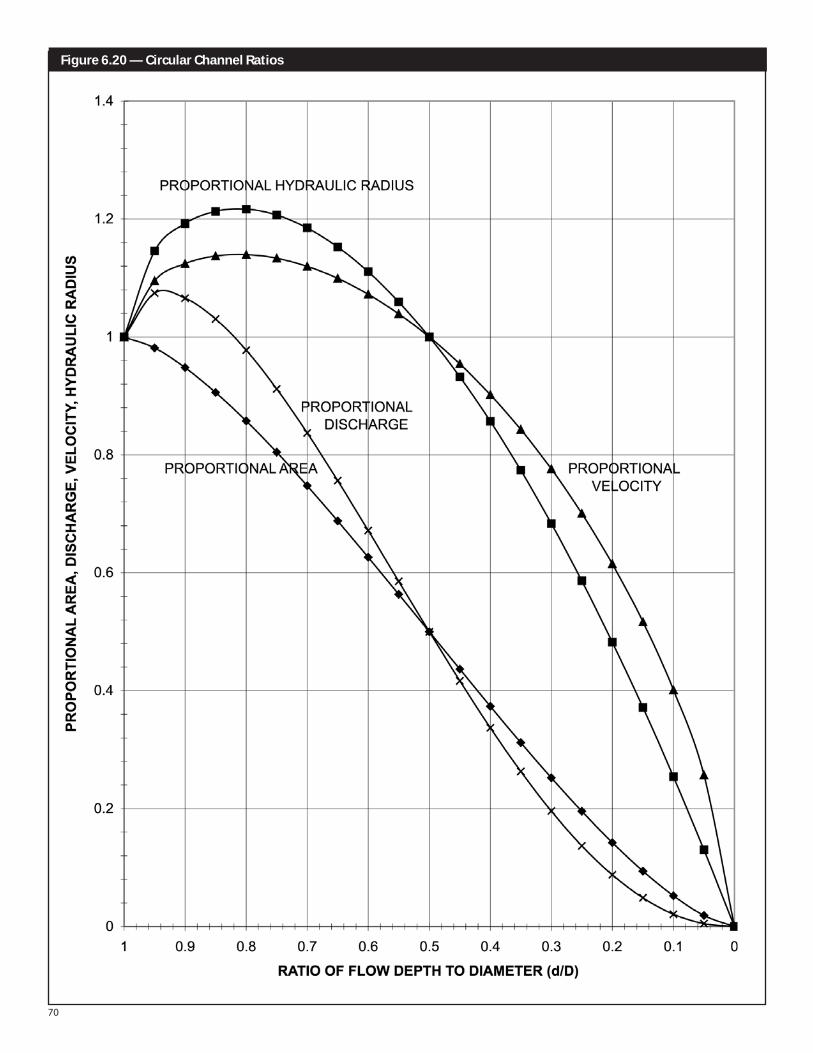
6.20 CircularChannelRatios.....................................................................................................................................................................70
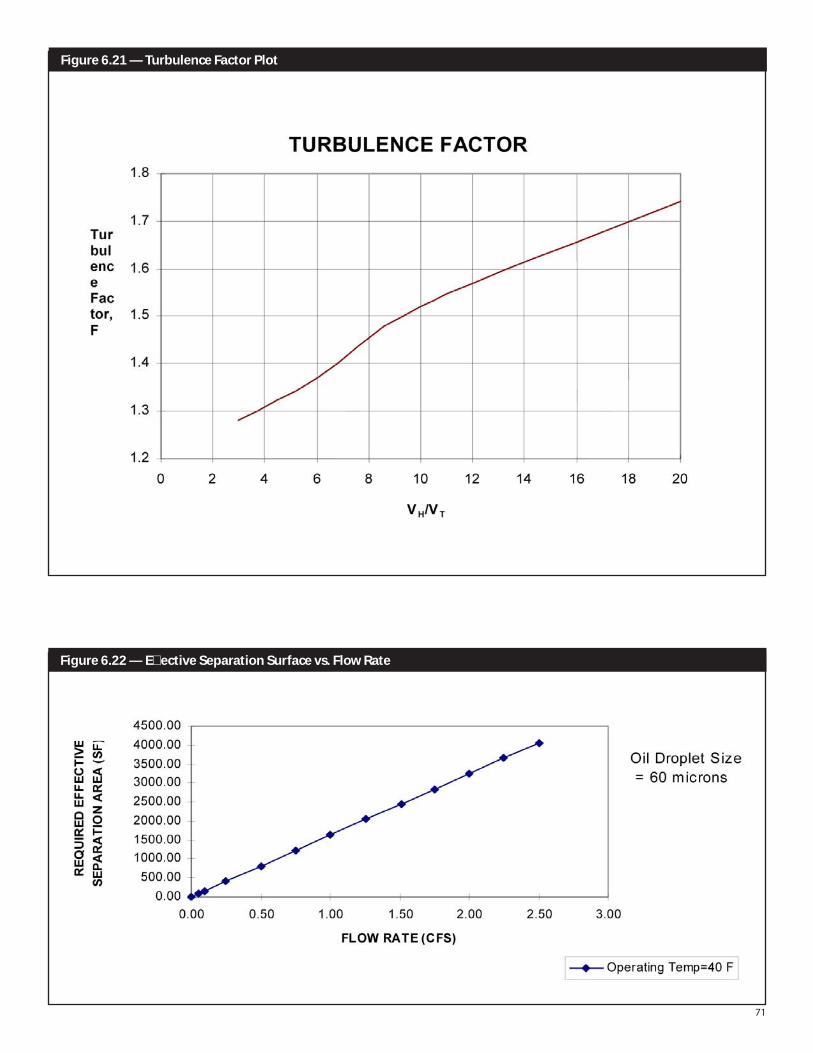
6.21 TurbulenceFactor...............................................................................................................................................................................71
6.22 EffectiveSeparationSurfacevsFlowRate..................................................................................................................................71
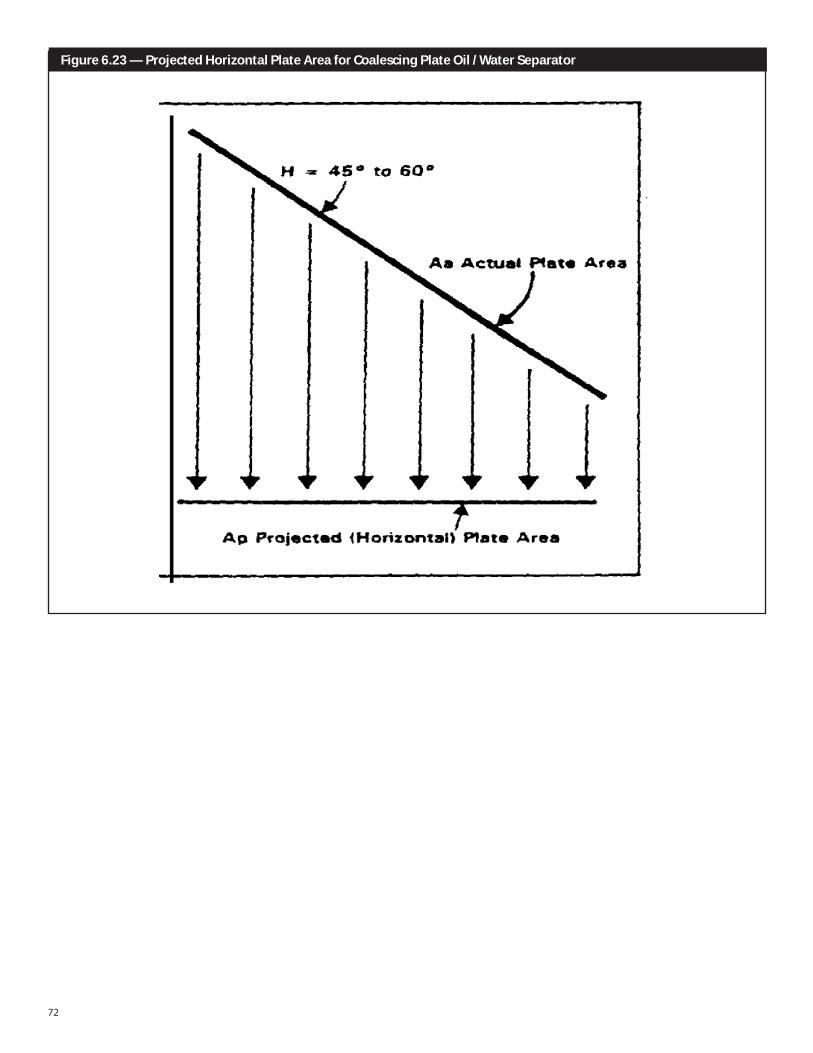
6.23 ProjectedHorizontalPlateAreaforCoalescingPlateOil/WaterSeparator....................................................................72
6.24 BaffleOil/WaterSeparator...............................................................................................................................................................73
6.25 CoalescingPlateOil/WaterSeparator..........................................................................................................................................74
6.26 SpillControlSeparator(notforoiltreatment)..........................................................................................................................75
7-1 TypicalDetentionPond.....................................................................................................................................................................79
7-2 TypicalDetentionPondSections...................................................................................................................................................80
7-3 OverflowStructure.............................................................................................................................................................................81
7-4 PermanentStormwaterFacilitySign............................................................................................................................................82
7-5 WeirSectionforEmergencyOverflowSpillway.......................................................................................................................83
7-6 TypicalDetentionTank......................................................................................................................................................................83
7-7 DetentionTankAccessDetail..........................................................................................................................................................84
7-8 TypicalDetentionVault.....................................................................................................................................................................85
7-9 FlowRestrictor......................................................................................................................................................................................86
iii
7-10 FlowRestrictor(Baffle).......................................................................................................................................................................87
7-11 FlowRestrictor(Weir).........................................................................................................................................................................88
7-12 SimpleOrifice.......................................................................................................................................................................................89
7-13 Rectangular,Sharp-CrestedWeir...................................................................................................................................................89
7-14 V-Notch,Sharp-CrestedWeir..........................................................................................................................................................90
7-15 SutroWeir...............................................................................................................................................................................................90
7-16 RiserInflowCurves.............................................................................................................................................................................91
7-17 USDATexturalTriangle......................................................................................................................................................................92
7-18 TypicalInfiltrationPond....................................................................................................................................................................93
7-19 TypicalInfiltrationTank.....................................................................................................................................................................94
7-20 InfiltrationVault...................................................................................................................................................................................95
7-21 InfiltrationTrench................................................................................................................................................................................96
7-22 ExampleofSmallInfiltrationBasin...............................................................................................................................................97
Tables
3B-1 BacteriaandViruses.........................................................................................................................................................................101
4.1 RunoffCoefficients-“C”ValuesForTheRationalMethod..................................................................................................105
4.2 MaximumPipeSlopesAndVelocities........................................................................................................................................106
4.3 AllowableStructuresAndPipeSizes..........................................................................................................................................106
4.4 MaximumCover(Feet)ForConcretePipeCompactionDesignA...................................................................................106
4.5 Manning’s“N”ValuesForPipes.....................................................................................................................................................107
4.6 RockProtectionAtOutfalls............................................................................................................................................................107
4.7 ConstantsForInletControlEquations*.....................................................................................................................................108
4.8 EntranceLossCoefficients.............................................................................................................................................................109
4.9 ChannelProtection...........................................................................................................................................................................110
4.10 ValuesOfRoughnessCoefficient“N”ForOpenChannels...................................................................................................111
4.11 EvidenceOfExistingOrPredictedProblems...........................................................................................................................111
5.1 RecommendedInfiltrationRates.................................................................................................................................................115
5.2 InfiltrationSizingFactors................................................................................................................................................................115
5.3 BioretentionFilterAndPerviousPavementSizingFactors...............................................................................................116
6.1 TreatmentFacilityPlacementinRelationtoDetention......................................................................................................120
6.2 LiningTypesforRunoffTreatmentFacilities............................................................................................................................120
6.3 CompactedTillLiners......................................................................................................................................................................121
6.4 SizingofPresettlingVaults.............................................................................................................................................................121
6.5 SandMediumSpecification...........................................................................................................................................................121
6.6 DesignFlowRatesforBasicTreatmentwithZPGMedia.....................................................................................................121
6.7 FilterStripSizingCriteria................................................................................................................................................................122
6.8 EmergentWetlandPlantSpeciesforWetponds....................................................................................................................123
6.9 DistributionofDepthsinWetlandCell......................................................................................................................................124
6.10 CoalescingPlateOil/WaterSeparatorVaultDimensions....................................................................................................124
7-1 SmallTreesandShrubswithFibrousRoots.............................................................................................................................128
7-2 StormwaterTract“LowGrow”SeedMix....................................................................................................................................128
7-3 ValuesofCdforSutroWeirs...........................................................................................................................................................128

iv
THIS PAGE LEFT BLANK INTENTIONALLY

v
Kitsap CountyStormwater
DesignManual
CHAPTER 3–FIGURES
1
Figure 3.1 — Covered Fuel Island
Figure 3.2 — Drip Pan
Figure 3.3 — Drip Pan Within Rails
2
Figure 3.4 — Loading Dock with Door Skirt
Figure 3.5 — Loading Dock with Overhang
Figure 3.6 — Enclose the Activity Figure 3.7 — Cover the Activity
3
Figure 3.8 — Secondary Containment System Figure 3.9 — Locking System for Drum Lid
Figure 3.10 — Covered & Bermed Containment Area Figure 3.11 — Mounted Container with Drip Pan
Figure 3.12 — Above-ground Tank Storage
4
Figure 3.13 — Covered Storage for Bulk Solids Figure 3.14 — Material Covered with Plastic Sheeting
Figure 3.15 — Uncovered Wash Area
Note: Include berm if needed

5
Kitsap CountyStormwater
DesignManual
CHAPTER 4–FIGURES

6
THIS PAGE LEFT BLANK INTENTIONALLY
7
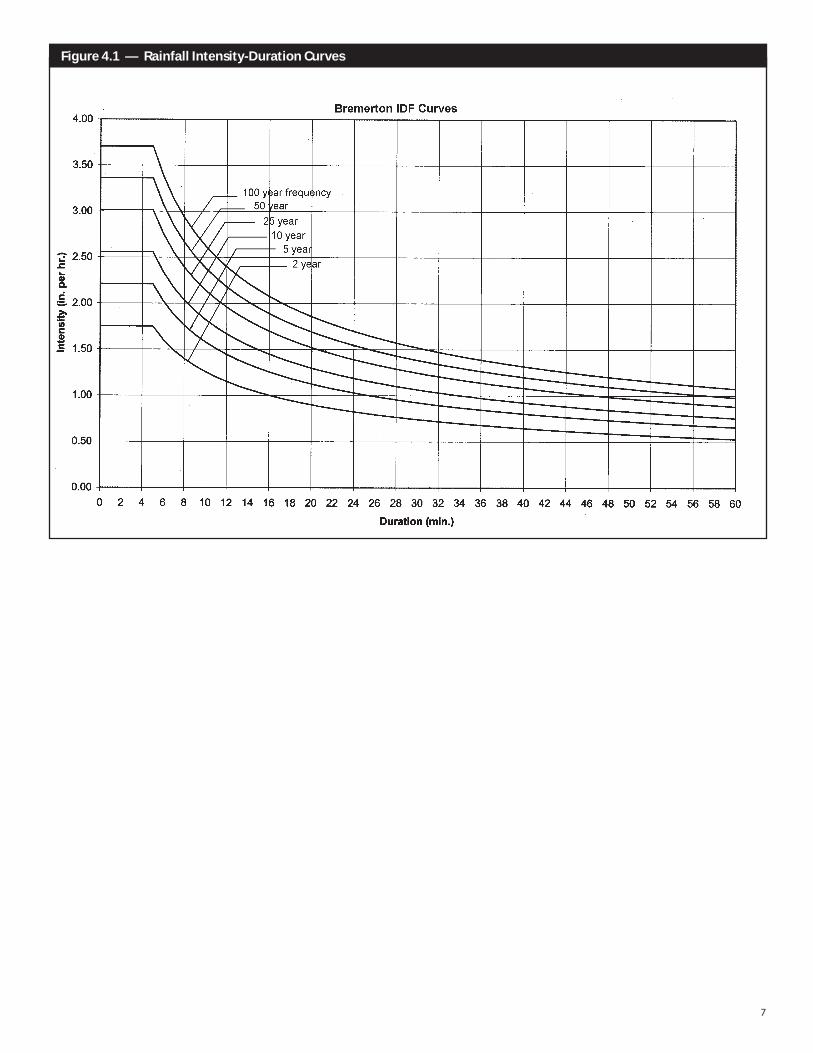
Figure 4.1 — Rainfall Intensity-Duration Curves
8
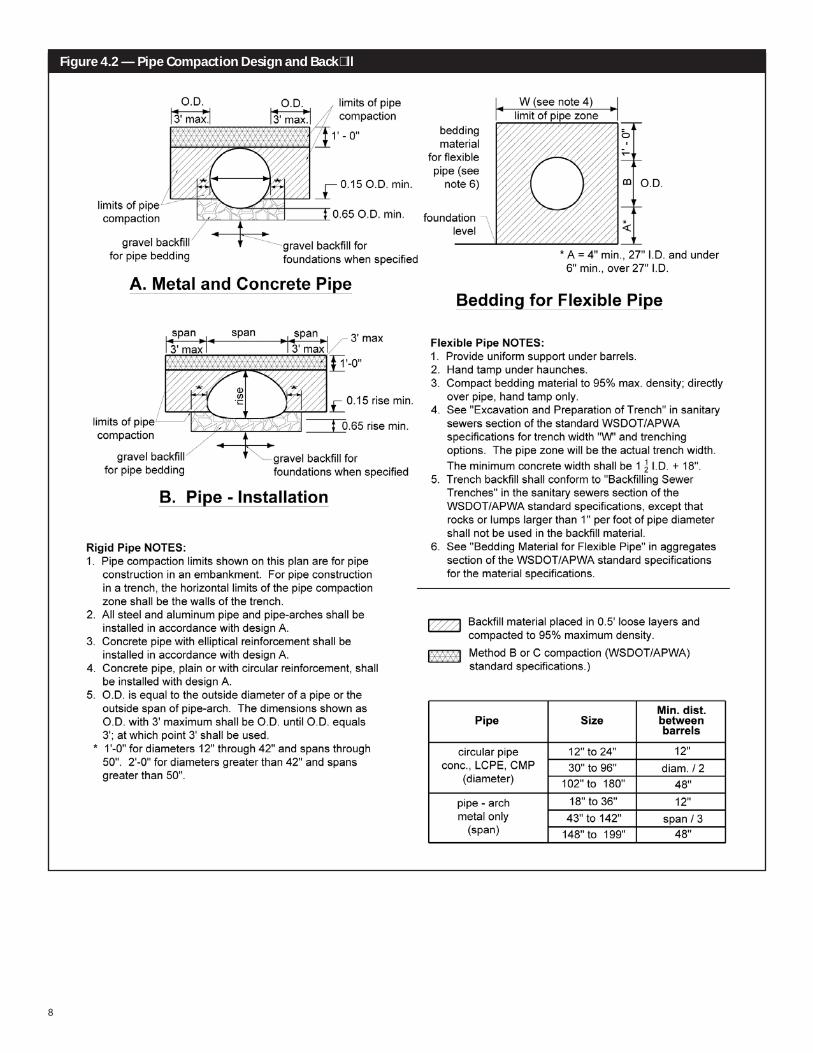
Figure 4.2 — Pipe Compaction Design and Backfill
9
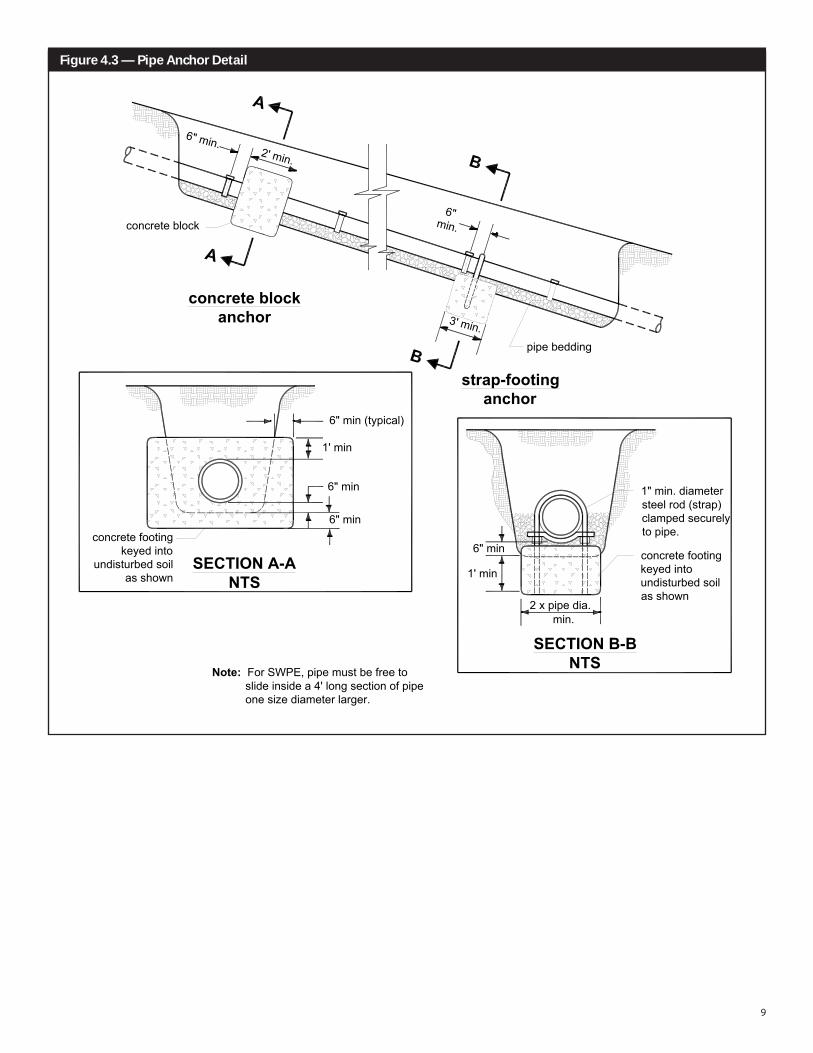
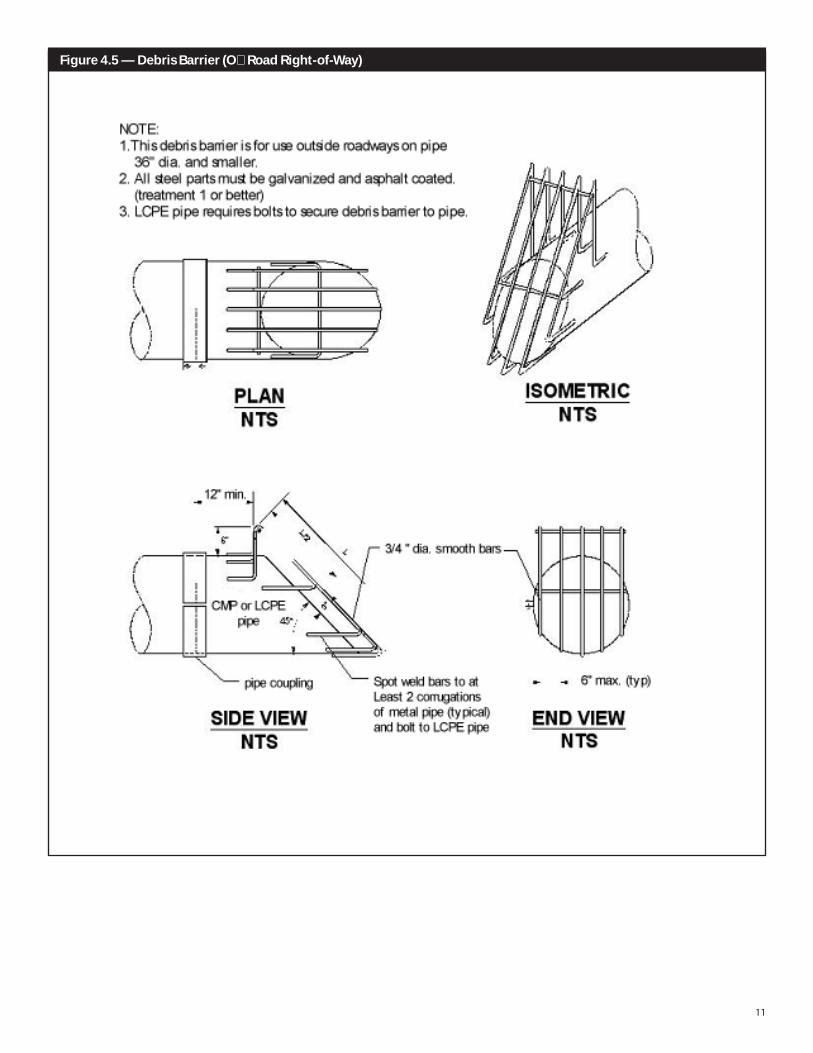
Note: For SWPE, pipe must be free toslide inside a 4' long section of pipeone size diameter larger.
concrete footingkeyed into
undisturbed soilas shown
6" min
6" min
1' min
6" min (typical)
6" min
1' min
2 x pipe dia.min.
1" min. diametersteel rod (strap)clamped securelyto pipe.
concrete footingkeyed into undisturbed soilas shown
SECTION B-BNTS
SECTION A-ANTS
concrete blockanchor
strap-footinganchor
pipe bedding
2' min.
concrete block6"
min.
6" min.
3' min.
Figure 4.3 — Pipe Anchor Detail
10
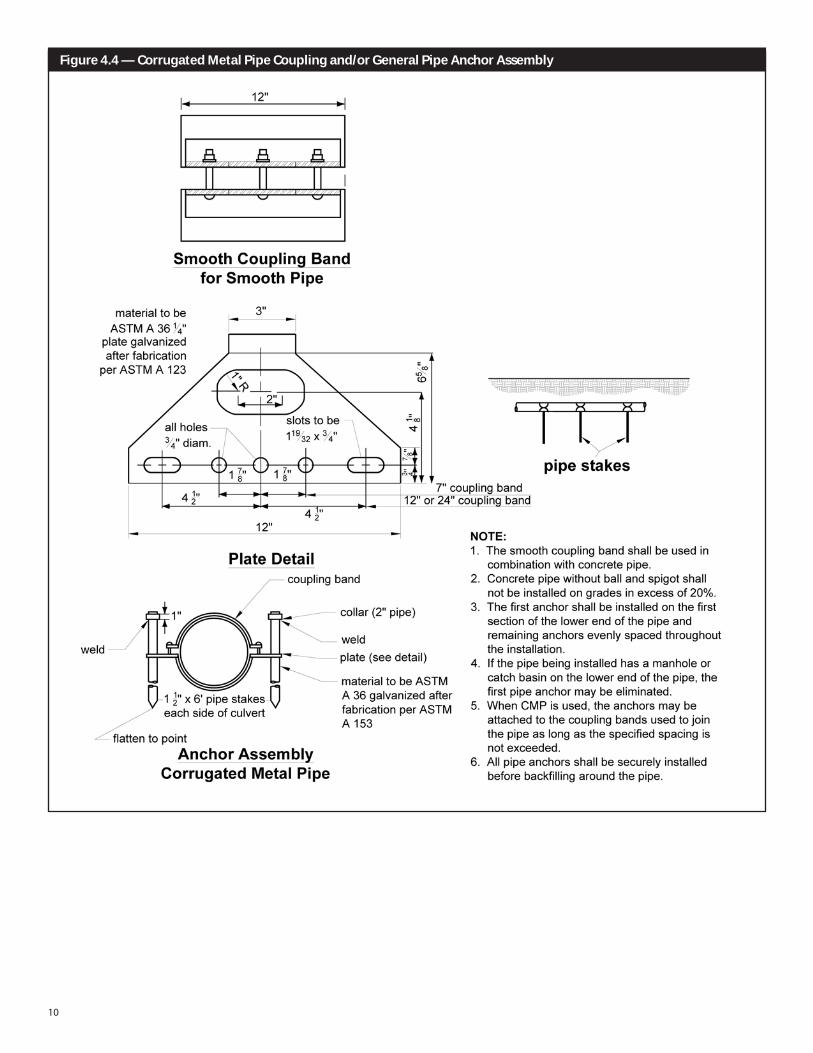
Figure 4.4 — Corrugated Metal Pipe Coupling and/or General Pipe Anchor Assembly
11
Figure 4.5 — Debris Barrier (Off Road Right-of-Way)
12
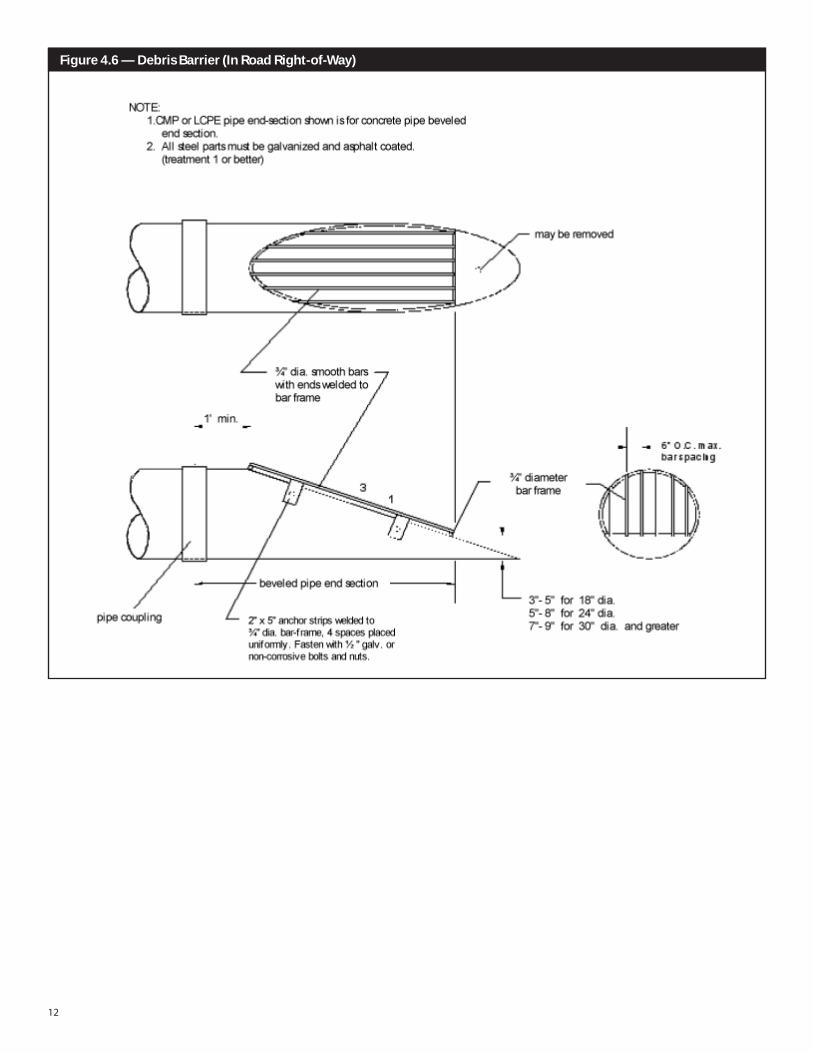
Figure 4.6 — Debris Barrier (In Road Right-of-Way)
13
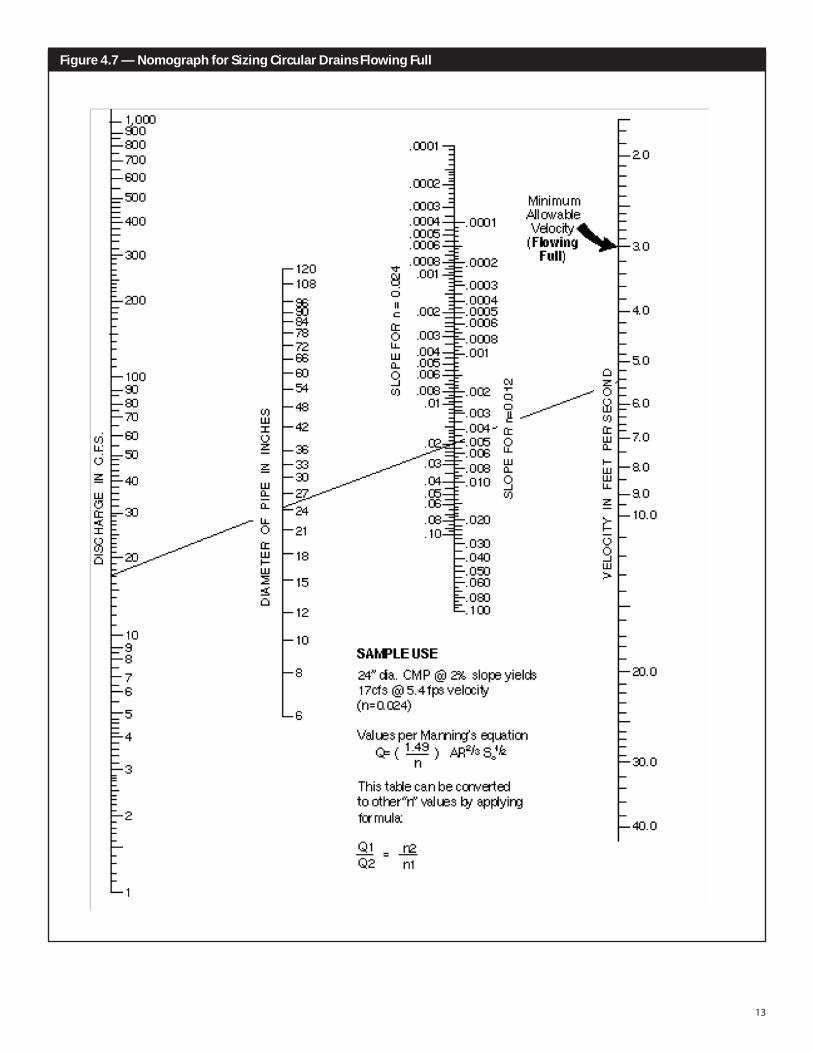
Figure 4.7 — Nomograph for Sizing Circular Drains Flowing Full
14
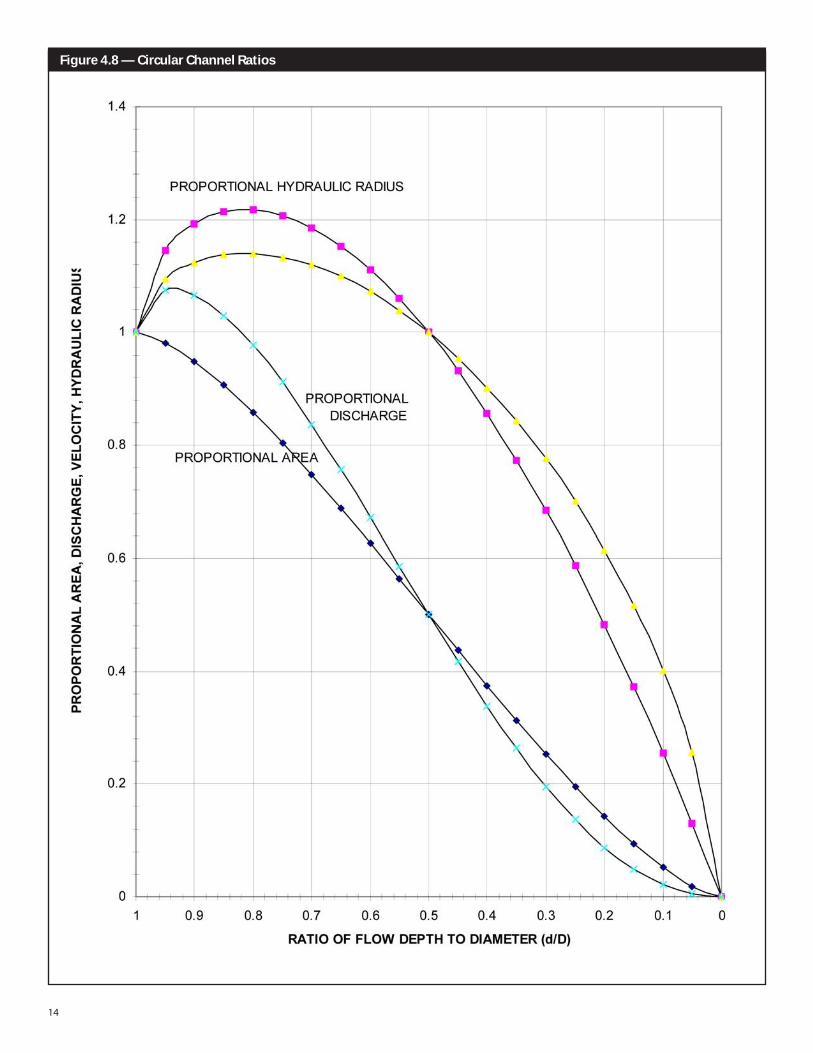
Figure 4.8 — Circular Channel Ratios

15
Figu
re 4
.9 —
Bac
kwat
er C
alcu
lati
on S
heet
Pipe
Segm
ent
CB to
CB
(4)
“n”
Value
(2)
Leng
th(ft
)
(3)
Pipe
Size
(1) Q (cfs)
(8)
Barre
lVe
locity
(fps)
(6)
Inlet
Elev
ation
(ft)
(7)
Barre
lVe
locity
(fps)
(5)
Outle
tEl
evati
on(ft
)
(12)
Entra
nce
HGL
Elev
ation
(ft)
(10) TW
Elev
ation
(ft)
(11)
Frict
ionLo
ss (ft)
(9)
Barre
lVe
locity
Head (ft)
(16)
Inlet
Contr
olEl
evati
on(ft
)
(14) Exit
Head
Loss (ft)
(15)
Outle
tCo
ntrol
Elev
ation
(ft)
(13)
Entra
nce
Head
Loss (ft)
(20) HW
Elev
ation
(ft)
(18)
Bend
Head
Loss (ft)
(19)
Junc
tion
Head
Loss (ft)
(17)
Appr
oach
Veloc
ityHe
ad (ft)
16
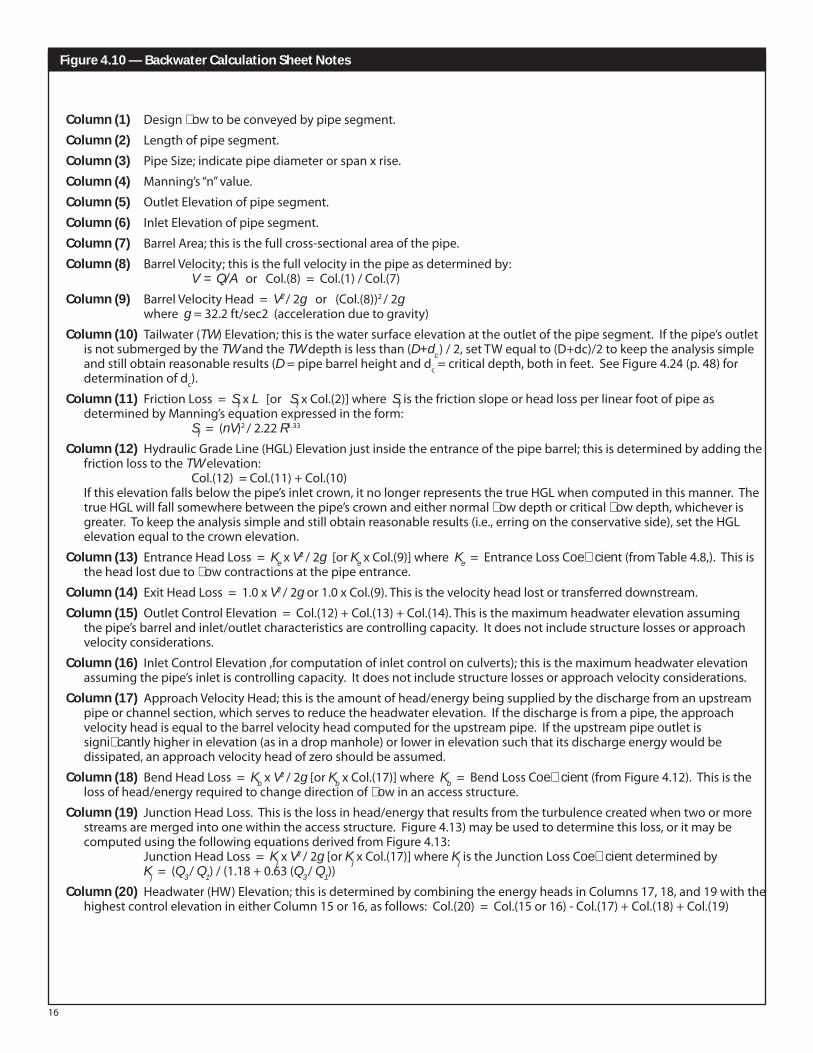
Figure 4.10 — Backwater Calculation Sheet Notes
Column (1) Designflowtobeconveyedbypipesegment.
Column (2) Lengthofpipesegment.
Column (3) PipeSize;indicatepipediameterorspanxrise.
Column (4) Manning’s“n”value.
Column (5) OutletElevationofpipesegment.
Column (6) InletElevationofpipesegment.
Column (7) BarrelArea;thisisthefullcross-sectionalareaofthepipe.
Column (8) BarrelVelocity;thisisthefullvelocityinthepipeasdeterminedby: V = Q/AorCol.(8)=Col.(1)/Col.(7)
Column (9) BarrelVelocityHead=V2 /2gor(Col.(8))2/2g whereg=32.2ft/sec2(accelerationduetogravity)
Column (10) Tailwater(TW)Elevation;thisisthewatersurfaceelevationattheoutletofthepipesegment.Ifthepipe’soutletisnotsubmergedbytheTWandtheTWdepthislessthan(D+dc )/2,setTWequalto(D+dc)/2tokeeptheanalysissimpleandstillobtainreasonableresults(D=pipebarrelheightandd
c=criticaldepth,bothinfeet.SeeFigure4.24(p.48)for
determinationofdc).
Column (11) FrictionLoss=SfxL[orSfxCol.(2)]whereSfisthefrictionslopeorheadlossperlinearfootofpipeasdeterminedbyManning’sequationexpressedintheform:
Sf=(nV)2/2.22R1.33
Column (12) HydraulicGradeLine(HGL)Elevationjustinsidetheentranceofthepipebarrel;thisisdeterminedbyaddingthefrictionlosstotheTWelevation:
Col.(12)=Col.(11)+Col.(10) Ifthiselevationfallsbelowthepipe’sinletcrown,itnolongerrepresentsthetrueHGLwhencomputedinthismanner.The
trueHGLwillfallsomewherebetweenthepipe’scrownandeithernormalflowdepthorcriticalflowdepth,whicheverisgreater.Tokeeptheanalysissimpleandstillobtainreasonableresults(i.e.,erringontheconservativeside),settheHGLelevationequaltothecrownelevation.
Column (13) EntranceHeadLoss=KexV2/2g[orKexCol.(9)]whereKe=EntranceLossCoefficient(fromTable4.8,).Thisis
theheadlostduetoflowcontractionsatthepipeentrance.
Column (14) ExitHeadLoss=1.0xV2/2gor1.0xCol.(9).Thisisthevelocityheadlostortransferreddownstream.
Column (15) OutletControlElevation=Col.(12)+Col.(13)+Col.(14).Thisisthemaximumheadwaterelevationassumingthepipe’sbarrelandinlet/outletcharacteristicsarecontrollingcapacity.Itdoesnotincludestructurelossesorapproachvelocityconsiderations.
Column (16) InletControlElevation,forcomputationofinletcontrolonculverts);thisisthemaximumheadwaterelevationassumingthepipe’sinletiscontrollingcapacity.Itdoesnotincludestructurelossesorapproachvelocityconsiderations.
Column (17) ApproachVelocityHead;thisistheamountofhead/energybeingsuppliedbythedischargefromanupstreampipeorchannelsection,whichservestoreducetheheadwaterelevation.Ifthedischargeisfromapipe,theapproachvelocityheadisequaltothebarrelvelocityheadcomputedfortheupstreampipe.Iftheupstreampipeoutletissignificantlyhigherinelevation(asinadropmanhole)orlowerinelevationsuchthatitsdischargeenergywouldbedissipated,anapproachvelocityheadofzeroshouldbeassumed.
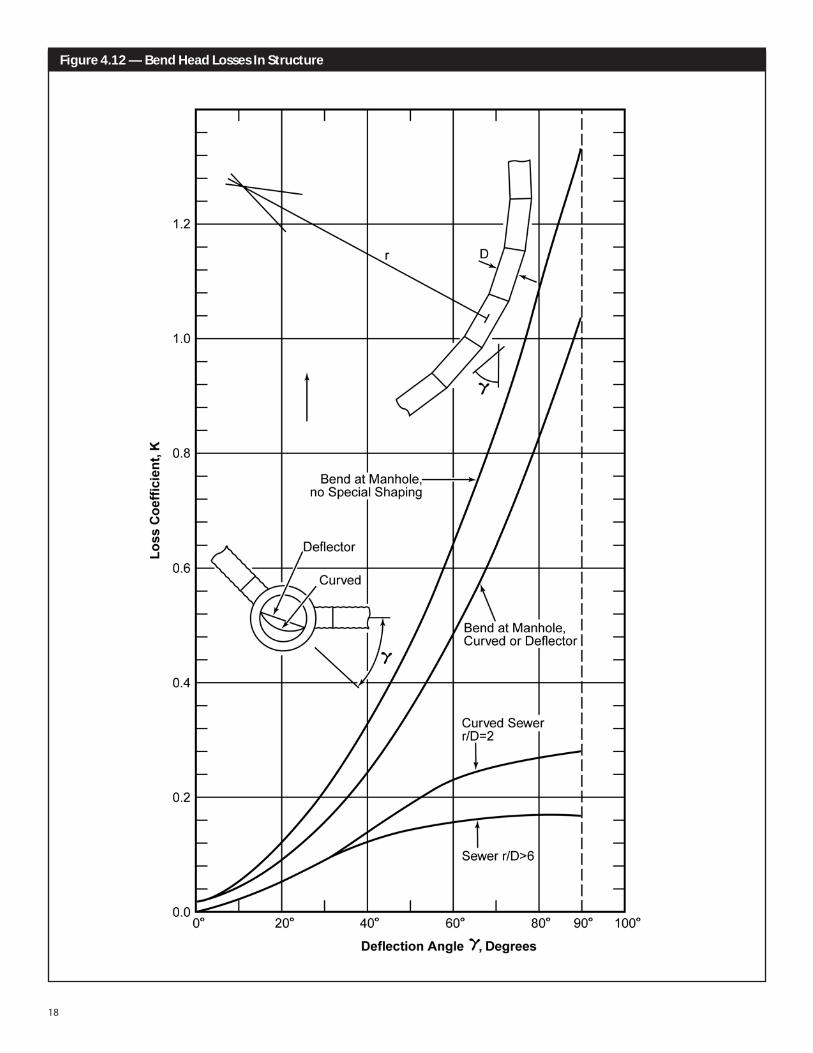
Column (18) BendHeadLoss=KbxV2/2g[orKbxCol.(17)]whereKb=BendLossCoefficient(fromFigure4.12).Thisisthe
lossofhead/energyrequiredtochangedirectionofflowinanaccessstructure.
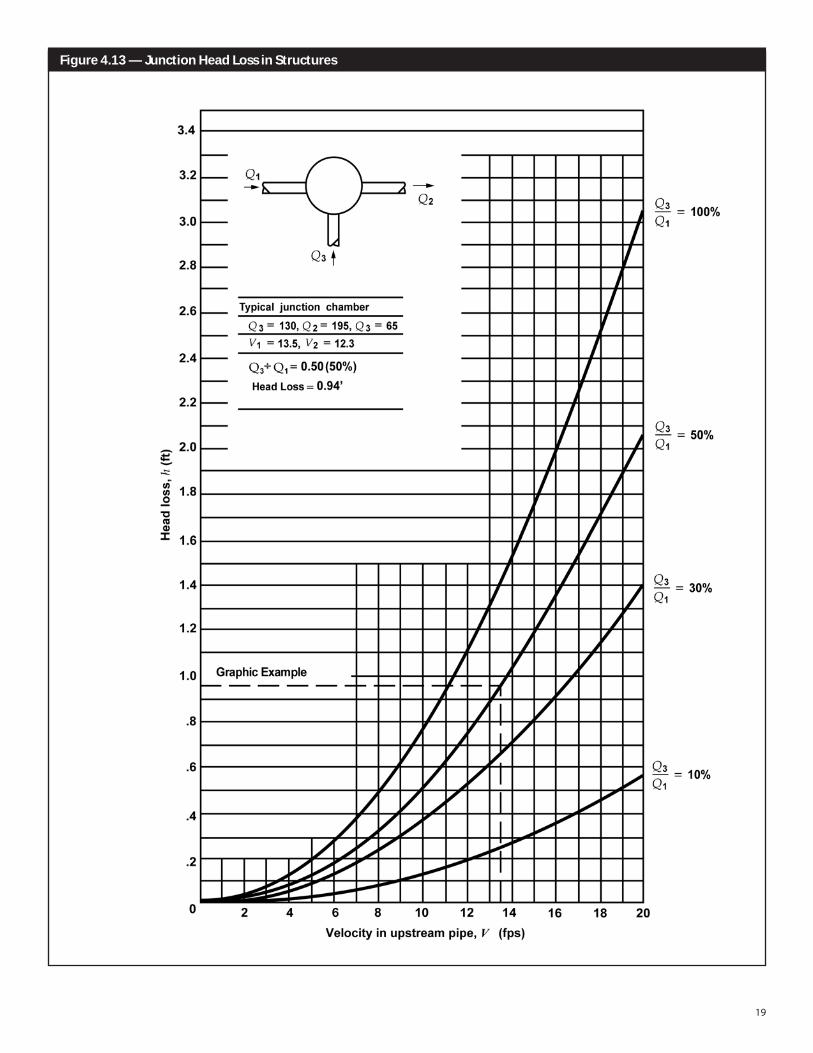
Column (19) JunctionHeadLoss.Thisisthelossinhead/energythatresultsfromtheturbulencecreatedwhentwoormorestreamsaremergedintoonewithintheaccessstructure.Figure4.13)maybeusedtodeterminethisloss,oritmaybecomputedusingthefollowingequationsderivedfromFigure4.13:
JunctionHeadLoss=KjxV2/2g[orKjxCol.(17)]whereKjistheJunctionLossCoefficientdeterminedby
Kj=(Q3 /Q1)/(1.18+0.63(Q3 /Q1))
Column (20) Headwater(HW)Elevation;thisisdeterminedbycombiningtheenergyheadsinColumns17,18,and19withthehighestcontrolelevationineitherColumn15or16,asfollows:Col.(20)=Col.(15or16)-Col.(17)+Col.(18)+Col.(19)
17
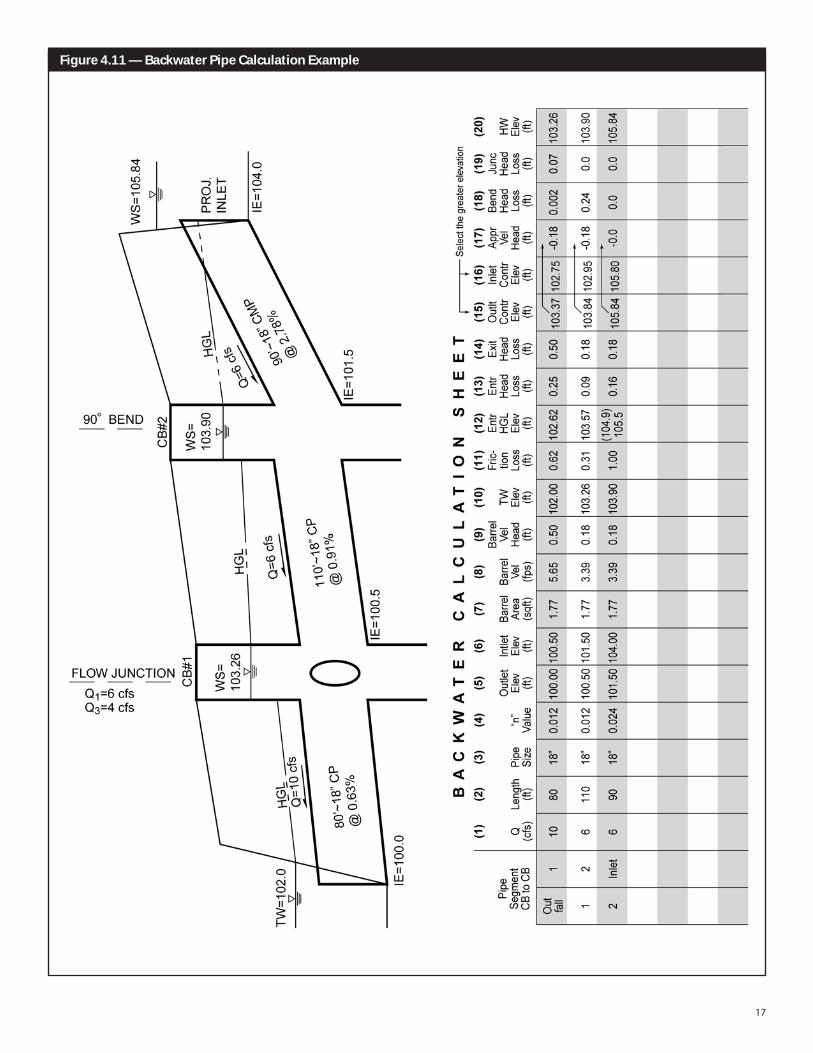
Figure 4.11 — Backwater Pipe Calculation Example
18
Figure 4.12 — Bend Head Losses In Structure
19
Figure 4.13 — Junction Head Loss in Structures
20
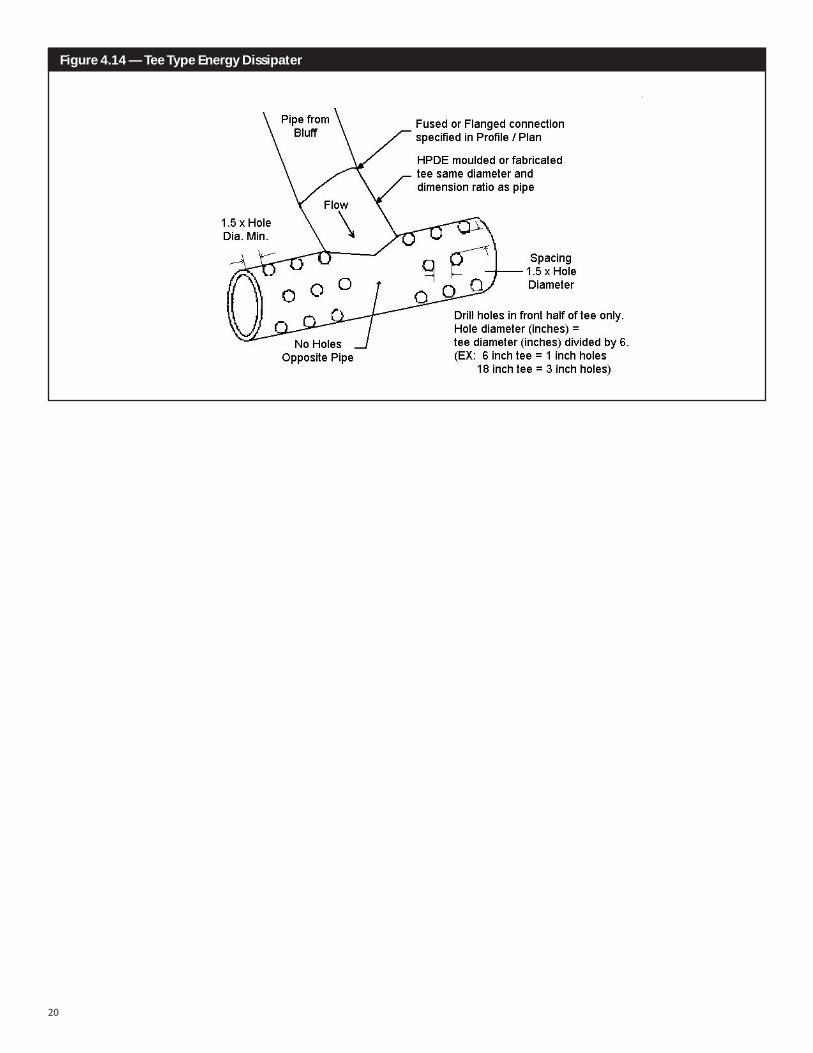
Figure 4.14 — Tee Type Energy Dissipater
21
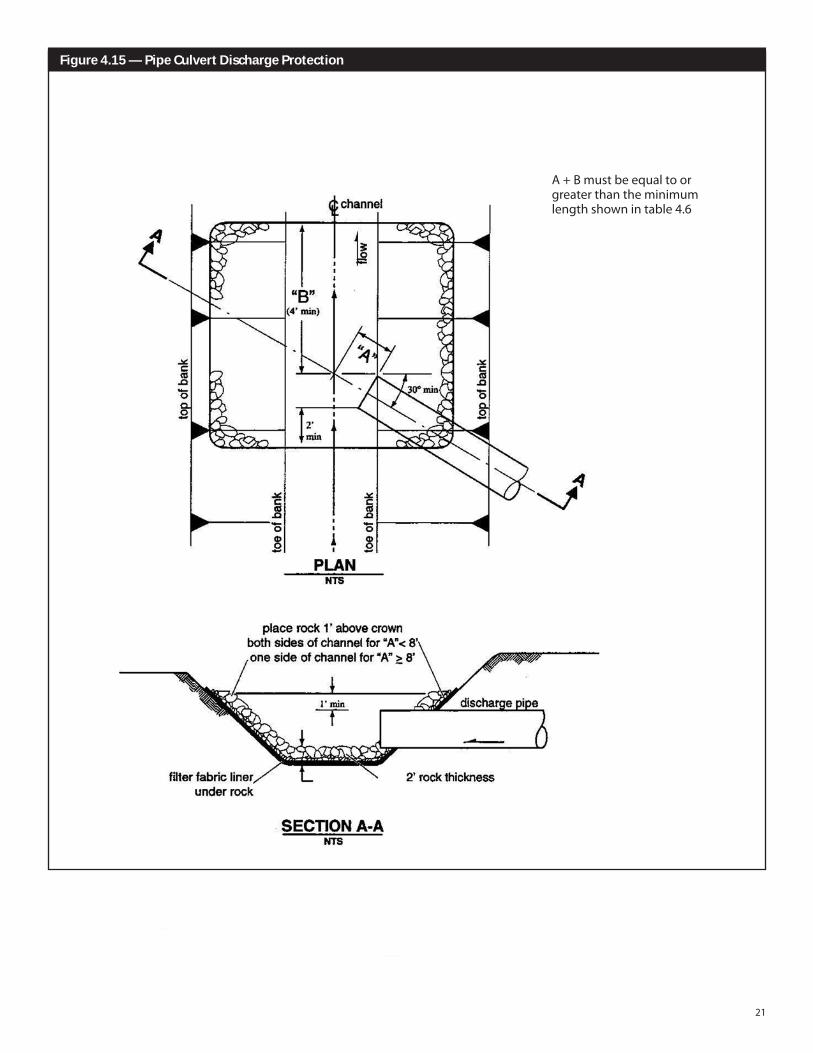
Figure 4.15 — Pipe Culvert Discharge Protection
A+Bmustbeequaltoorgreaterthantheminimumlengthshownintable4.6
22
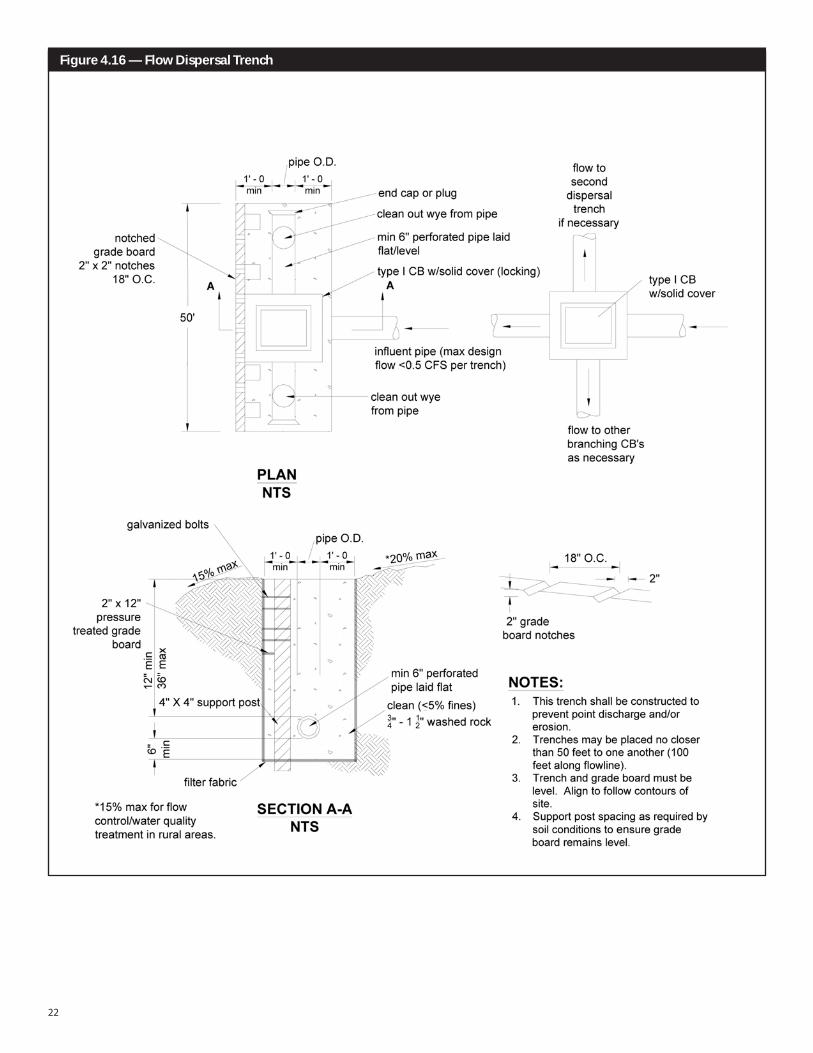
Figure 4.16 — Flow Dispersal Trench
23
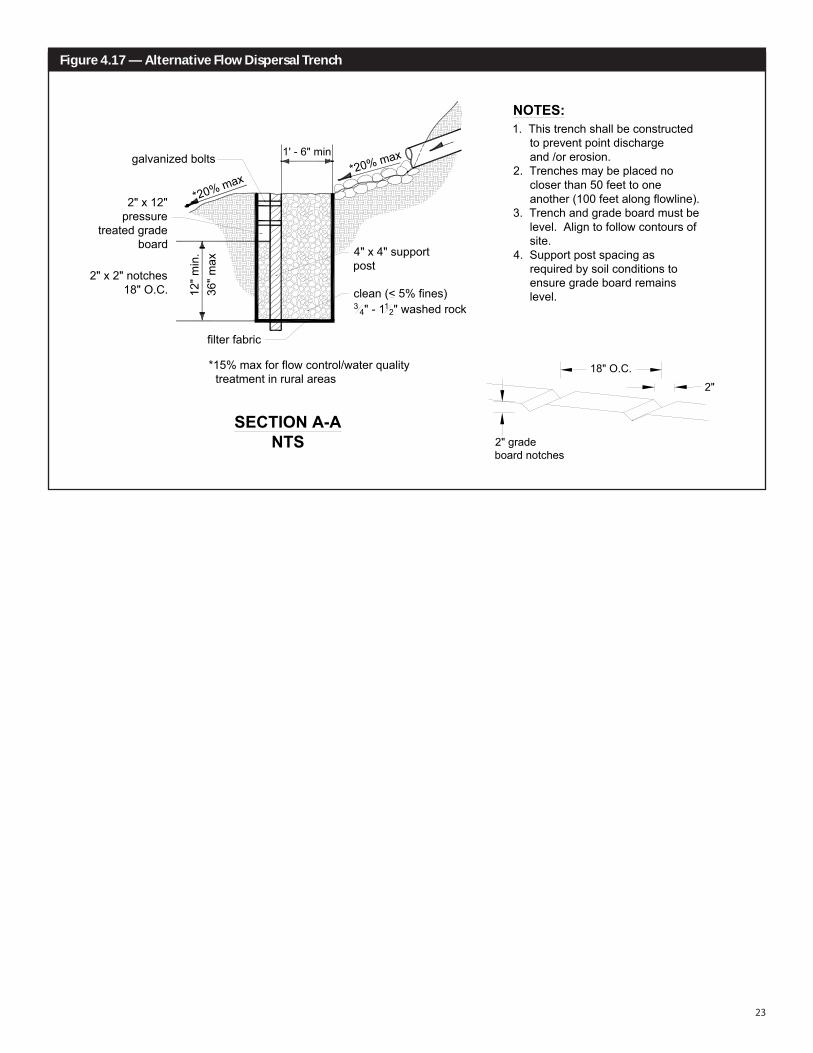
Figure 4.17 — Alternative Flow Dispersal Trench
1. This trench shall be constructed to prevent point discharge and /or erosion.2. Trenches may be placed no closer than 50 feet to one another (100 feet along flowline).3. Trench and grade board must be level. Align to follow contours of site.4. Support post spacing as required by soil conditions to ensure grade board remains level.
NOTES:
1' - 6" min
*20% max*20% maxgalvanized bolts
2" x 12"pressure
treated gradeboard
2" x 2" notches18" O.C. 36
" max
12" m
in. 4" x 4" support
post
clean (< 5% fines)3
4" - 112" washed rock
filter fabric
*15% max for flow control/water quality treatment in rural areas
SECTION A-ANTS
18" O.C.
2"
2" gradeboard notches
24
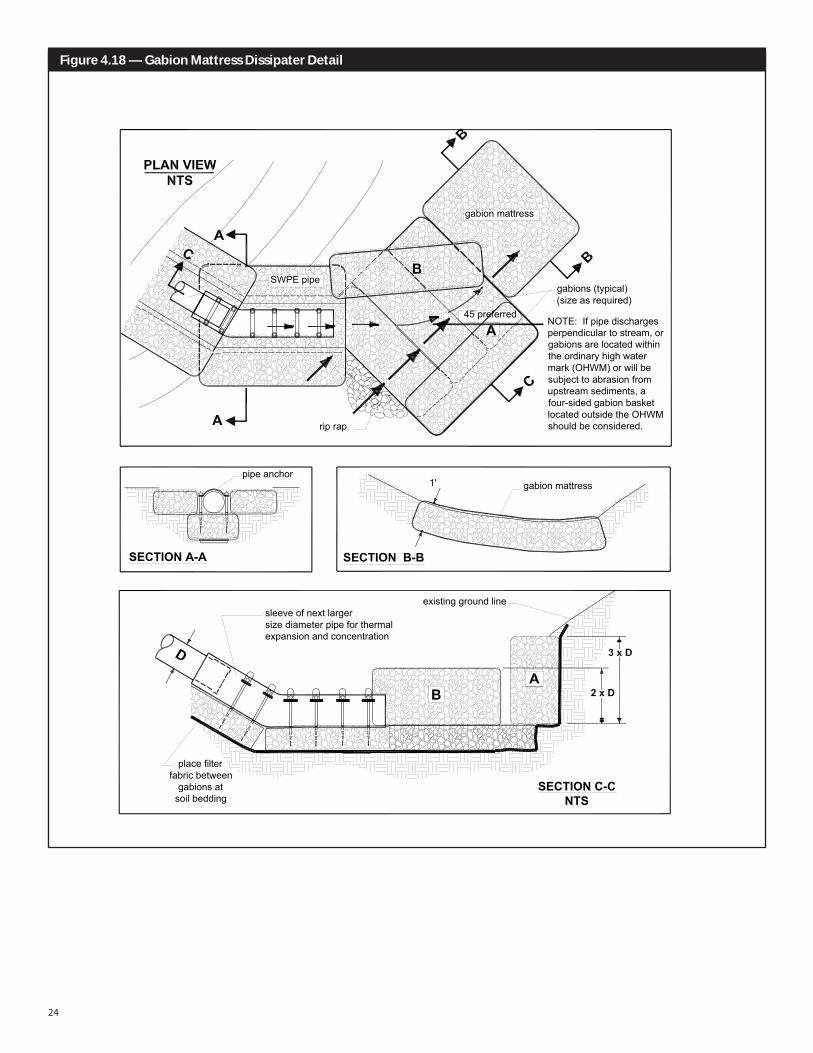
Figure 4.18 — Gabion Mattress Dissipater Detail
sleeve of next largersize diameter pipe for thermalexpansion and concentration
existing ground line
place filterfabric between
gabions at soil bedding
gabion mattresspipe anchor
1'
rip rap
NOTE: If pipe dischargesperpendicular to stream, orgabions are located withinthe ordinary high watermark (OHWM) or will besubject to abrasion fromupstream sediments, afour-sided gabion basketlocated outside the OHWMshould be considered.
gabions (typical)(size as required)
45 preferred
SWPE pipe
gabion mattress
SECTION C-CNTS
SECTION B-BSECTION A-A
25
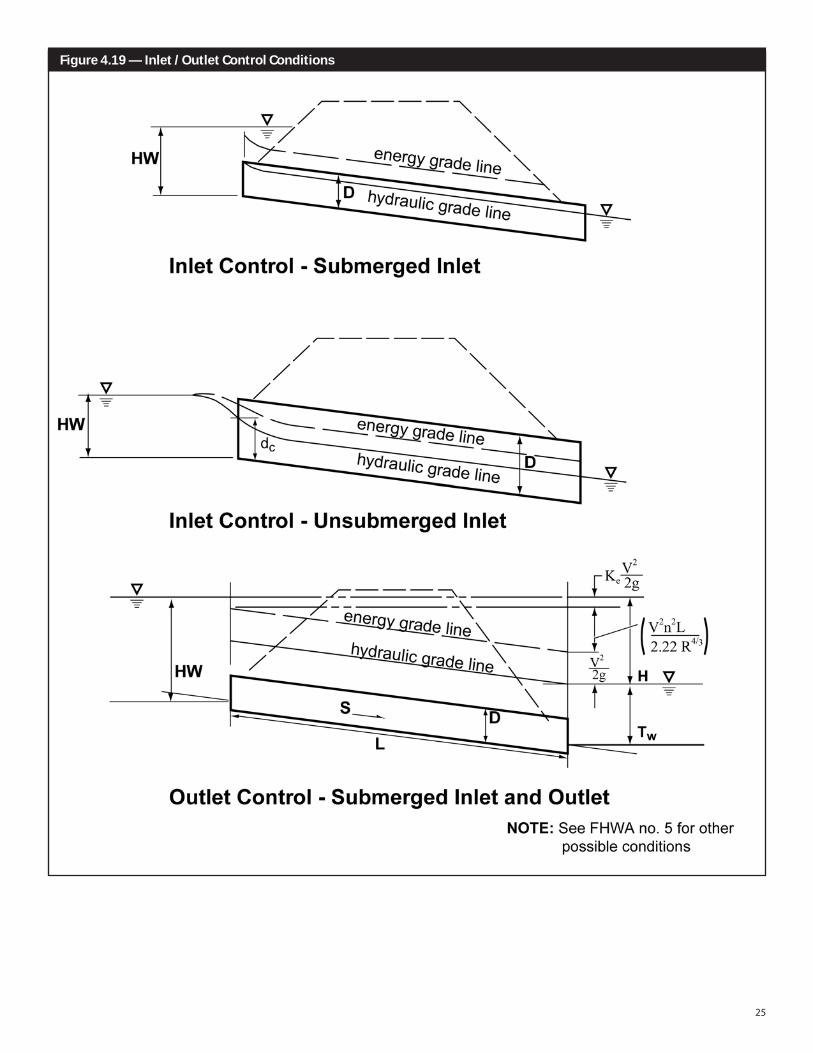
Figure 4.19 — Inlet / Outlet Control Conditions
26
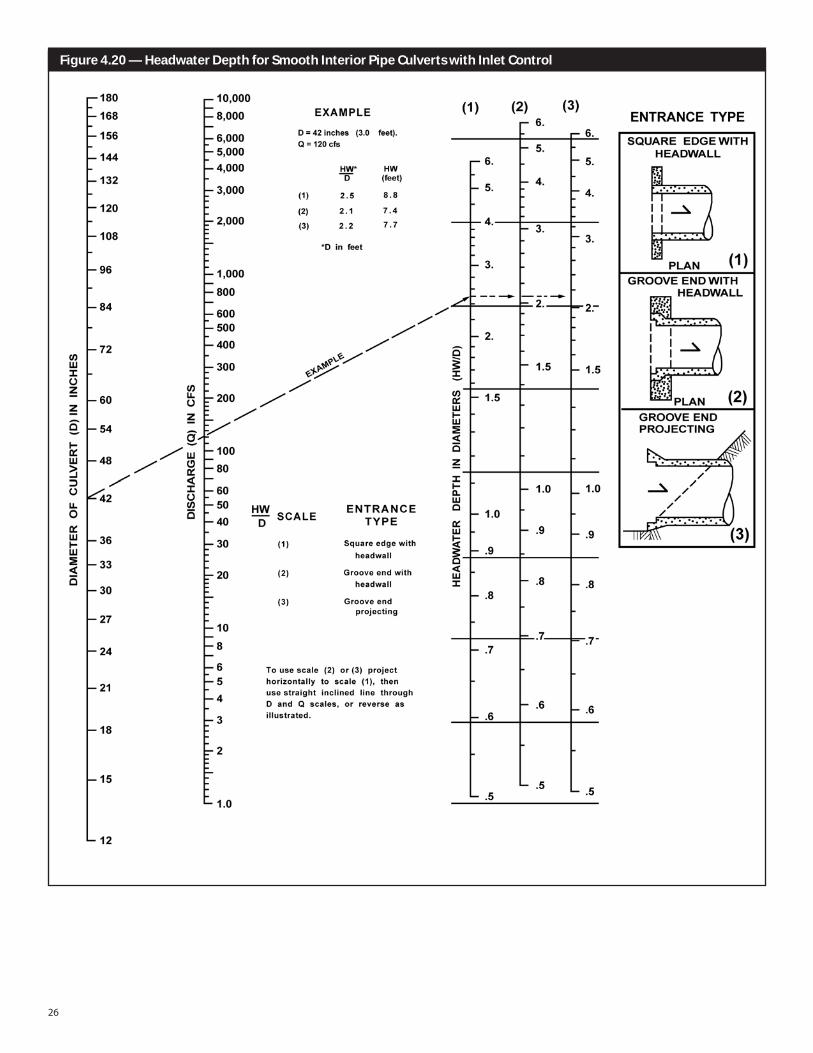
Figure 4.20 — Headwater Depth for Smooth Interior Pipe Culverts with Inlet Control
27
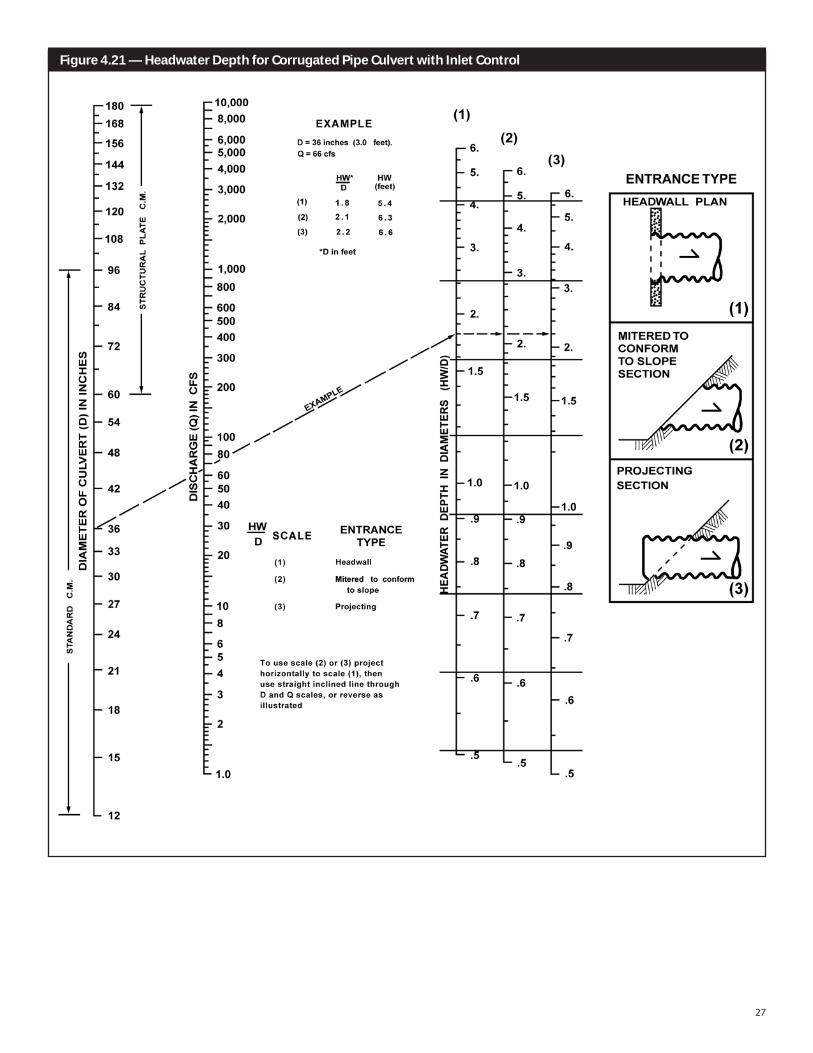
Figure 4.21 — Headwater Depth for Corrugated Pipe Culvert with Inlet Control
28
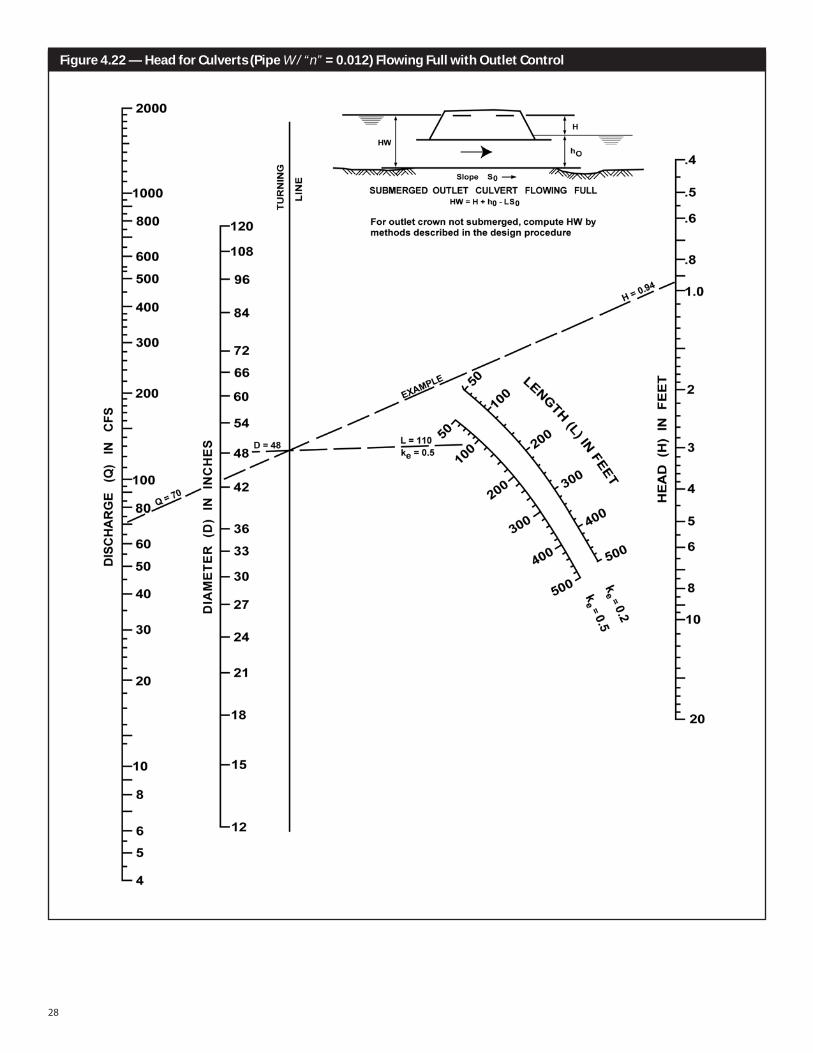
Figure 4.22 — Head for Culverts (Pipe W / “n” = 0.012) Flowing Full with Outlet Control
29
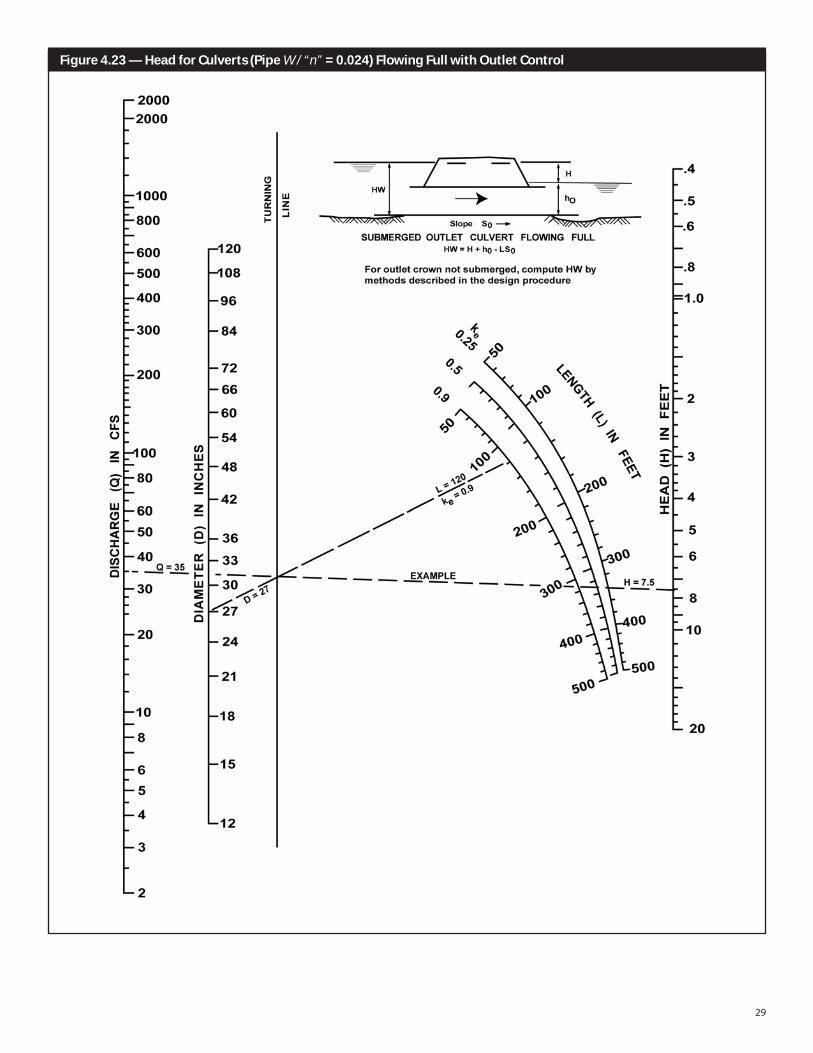
Figure 4.23 — Head for Culverts (Pipe W / “n” = 0.024) Flowing Full with Outlet Control
30
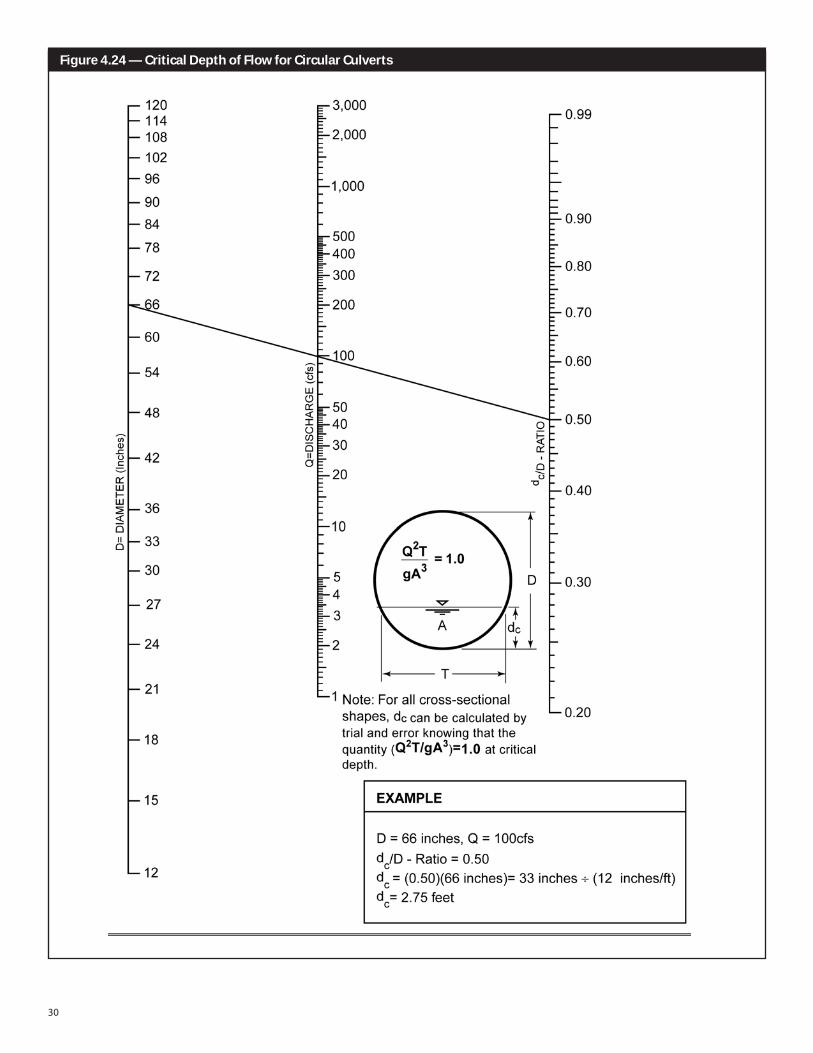
Figure 4.24 — Critical Depth of Flow for Circular Culverts
31
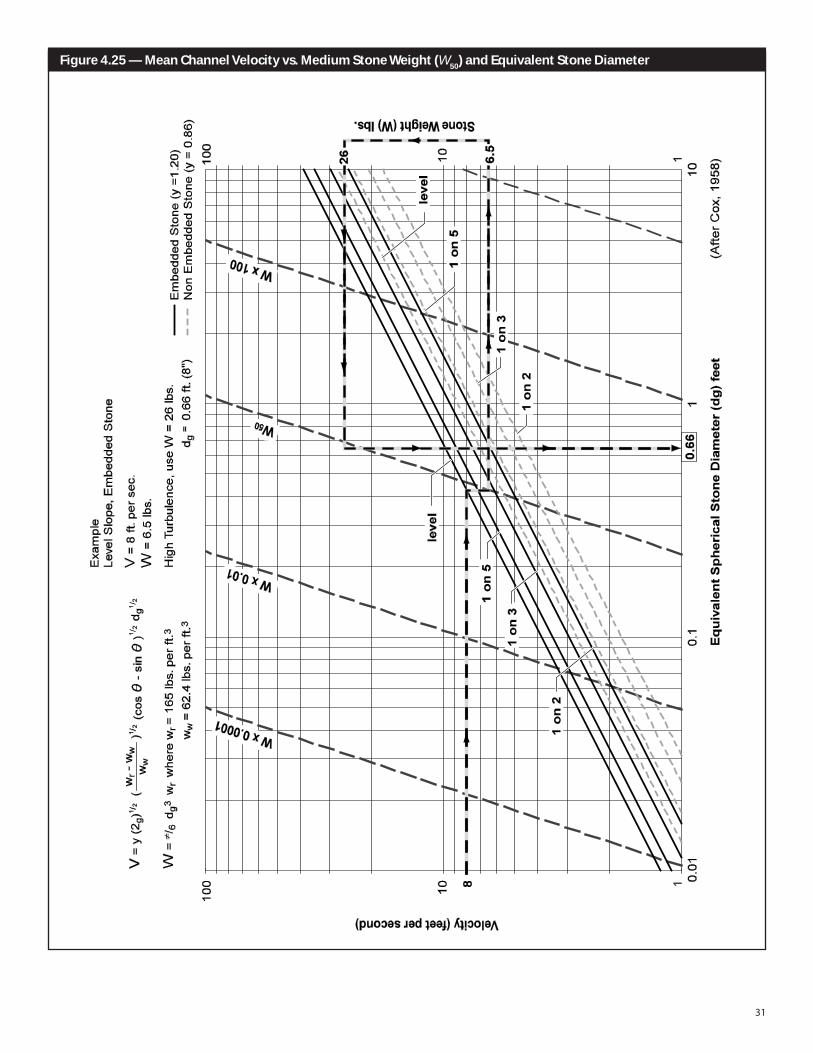
Figure 4.25 — Mean Channel Velocity vs. Medium Stone Weight (W50) and Equivalent Stone Diameter
32
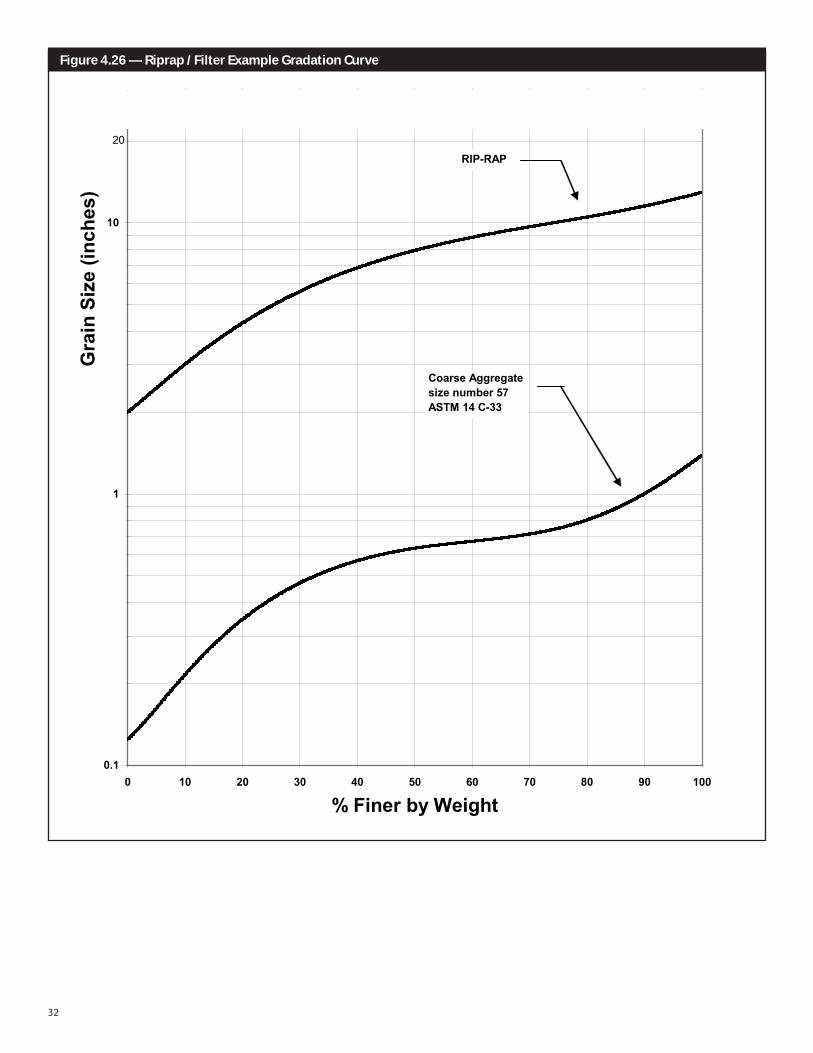
Figure 4.26 — Riprap / Filter Example Gradation Curve
0.1
1
10
100
0 10 20 30 40 50 60 70 80 90 100
% Finer by Weight
Gra
in S
ize
(inch
es)
20
RIP-RAP
Coarse Aggregate size number 57 ASTM 14 C-33
33
NO. SideSlopes B H W A WP R R(2/3)
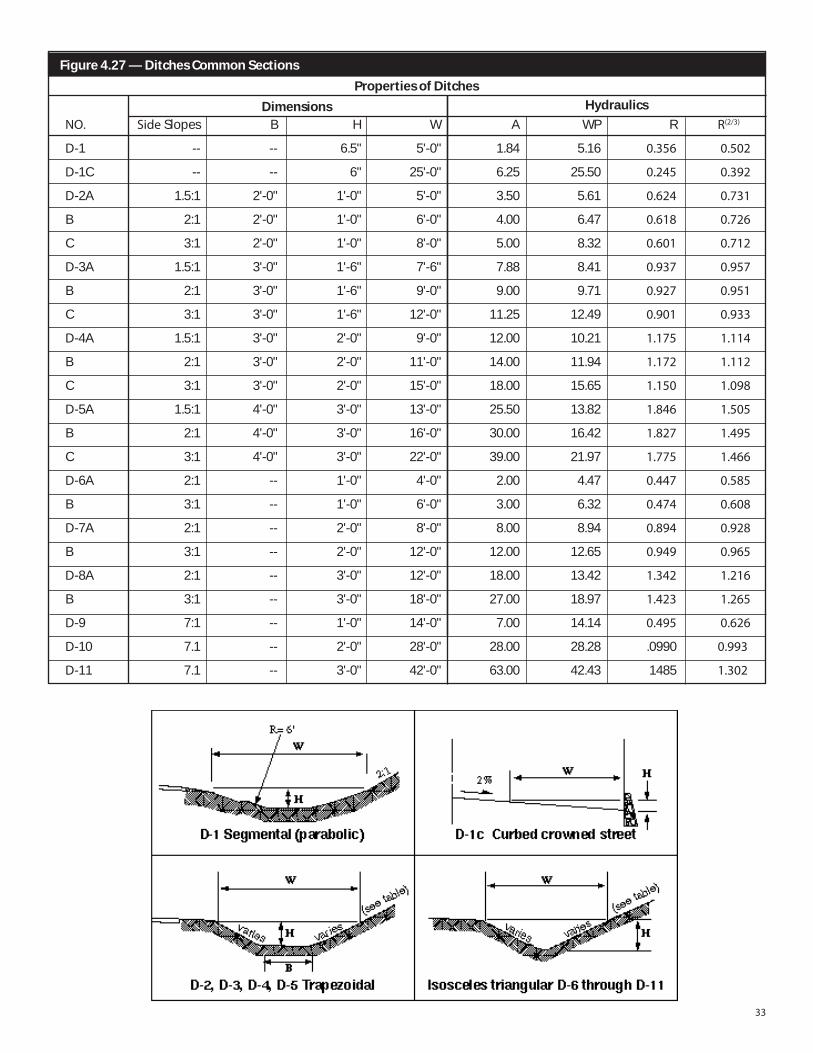
D-1 -- -- 6.5" 5'-0" 1.84 5.16 0.356 0.502
D-1C -- -- 6" 25'-0" 6.25 25.50 0.245 0.392
D-2A 1.5:1 2'-0" 1'-0" 5'-0" 3.50 5.61 0.624 0.731
B 2:1 2'-0" 1'-0" 6'-0" 4.00 6.47 0.618 0.726
C 3:1 2'-0" 1'-0" 8'-0" 5.00 8.32 0.601 0.712
D-3A 1.5:1 3'-0" 1'-6" 7'-6" 7.88 8.41 0.937 0.957
B 2:1 3'-0" 1'-6" 9'-0" 9.00 9.71 0.927 0.951
C 3:1 3'-0" 1'-6" 12'-0" 11.25 12.49 0.901 0.933
D-4A 1.5:1 3'-0" 2'-0" 9'-0" 12.00 10.21 1.175 1.114
B 2:1 3'-0" 2'-0" 11'-0" 14.00 11.94 1.172 1.112
C 3:1 3'-0" 2'-0" 15'-0" 18.00 15.65 1.150 1.098
D-5A 1.5:1 4'-0" 3'-0" 13'-0" 25.50 13.82 1.846 1.505
B 2:1 4'-0" 3'-0" 16'-0" 30.00 16.42 1.827 1.495
C 3:1 4'-0" 3'-0" 22'-0" 39.00 21.97 1.775 1.466
D-6A 2:1 -- 1'-0" 4'-0" 2.00 4.47 0.447 0.585
B 3:1 -- 1'-0" 6'-0" 3.00 6.32 0.474 0.608
D-7A 2:1 -- 2'-0" 8'-0" 8.00 8.94 0.894 0.928
B 3:1 -- 2'-0" 12'-0" 12.00 12.65 0.949 0.965
D-8A 2:1 -- 3'-0" 12'-0" 18.00 13.42 1.342 1.216
B 3:1 -- 3'-0" 18'-0" 27.00 18.97 1.423 1.265
D-9 7:1 -- 1'-0" 14'-0" 7.00 14.14 0.495 0.626
D-10 7.1 -- 2'-0" 28'-0" 28.00 28.28 .0990 0.993
D-11 7.1 -- 3'-0" 42'-0" 63.00 42.43 1485 1.302
Figure 4.27 — Ditches Common Sections
Dimensions HydraulicsProperties of Ditches
34
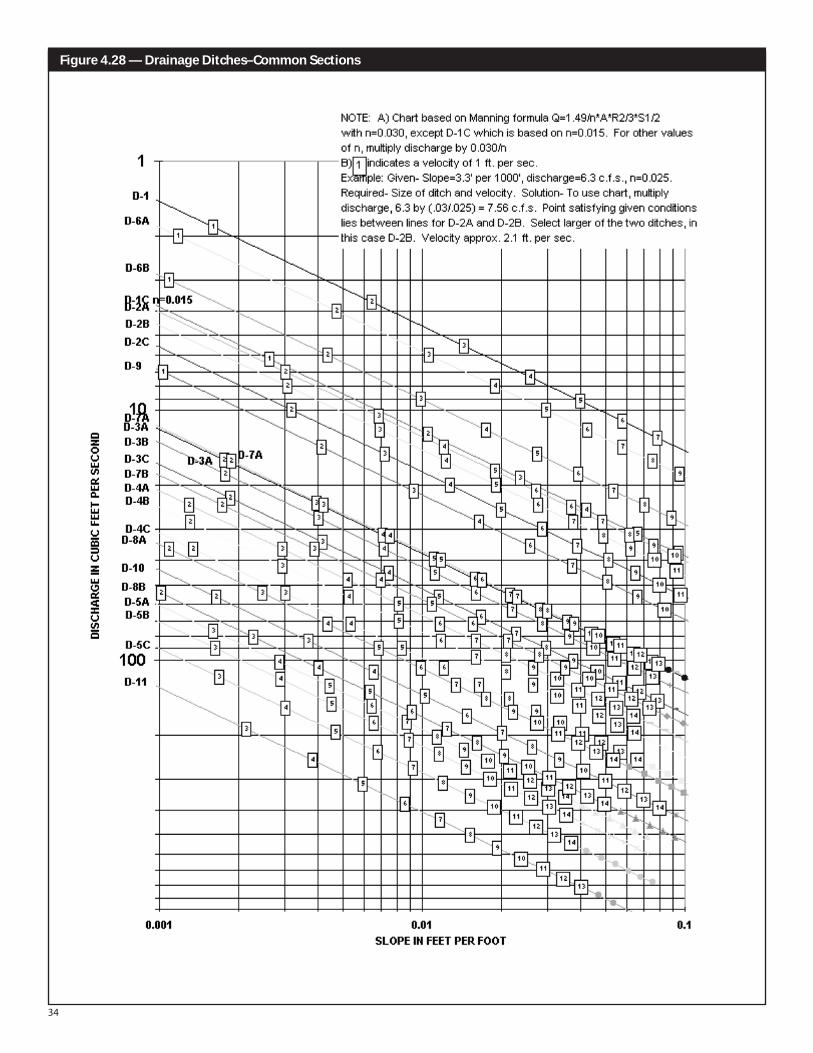
Figure 4.28 — Drainage Ditches–Common Sections
35
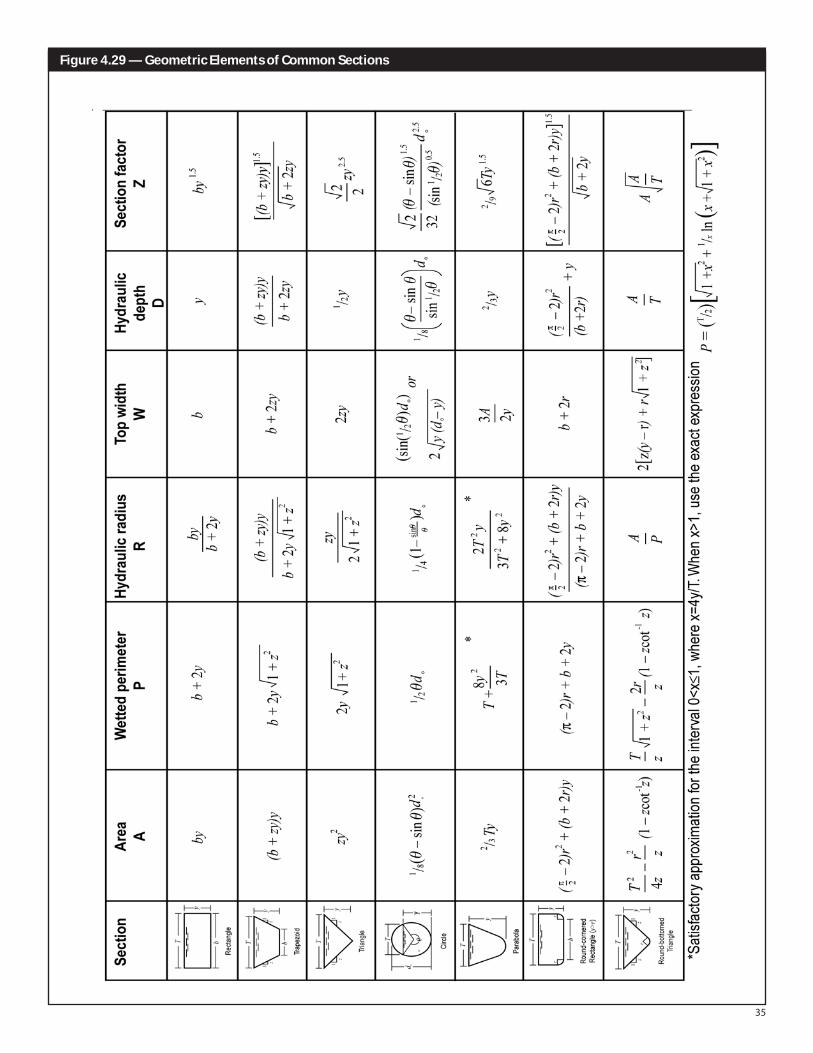
Figure 4.29 — Geometric Elements of Common Sections

36
Figure 4.30 — Open Channel Flow Profile Computation
Q = ____________ n = ____________ So = ____________ a = ____________ Yn=____________
y A R R4/3 V aV2 / 2g E ∆E Sf Sf So – Sf ∆x x
(1) (2) (3) (4) (5) (6) (7) (8) (9) (10) (11) (12) (13)
37
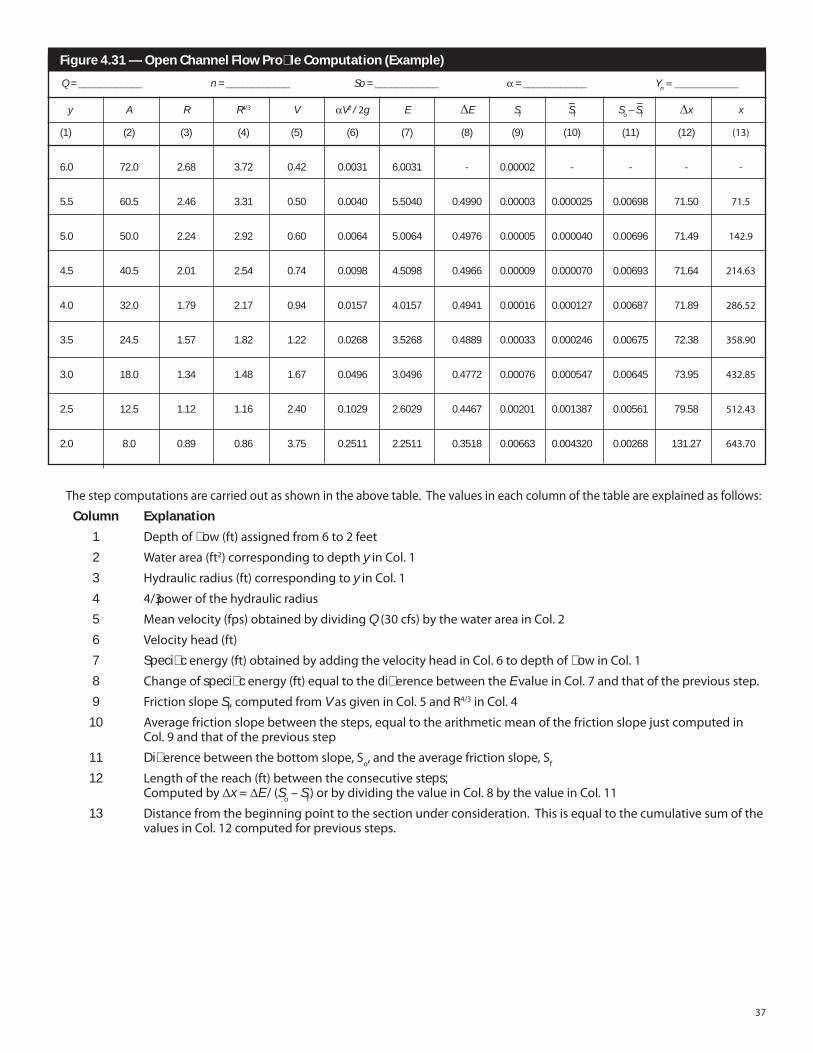
Figure 4.31 — Open Channel Flow Profile Computation (Example)
Q = ____________ n = ____________ So = ____________ a = ____________ Yn=____________
y A R R4/3 V aV2 / 2g E ∆E Sf Sf So – Sf ∆x x
(1) (2) (3) (4) (5) (6) (7) (8) (9) (10) (11) (12) (13)
6.0 72.0 2.68 3.72 0.42 0.0031 6.0031 - 0.00002 - - - -
5.5 60.5 2.46 3.31 0.50 0.0040 5.5040 0.4990 0.00003 0.000025 0.00698 71.50 71.5
5.0 50.0 2.24 2.92 0.60 0.0064 5.0064 0.4976 0.00005 0.000040 0.00696 71.49 142.9
4.5 40.5 2.01 2.54 0.74 0.0098 4.5098 0.4966 0.00009 0.000070 0.00693 71.64 214.63
4.0 32.0 1.79 2.17 0.94 0.0157 4.0157 0.4941 0.00016 0.000127 0.00687 71.89 286.52
3.5 24.5 1.57 1.82 1.22 0.0268 3.5268 0.4889 0.00033 0.000246 0.00675 72.38 358.90
3.0 18.0 1.34 1.48 1.67 0.0496 3.0496 0.4772 0.00076 0.000547 0.00645 73.95 432.85
2.5 12.5 1.12 1.16 2.40 0.1029 2.6029 0.4467 0.00201 0.001387 0.00561 79.58 512.43
2.0 8.0 0.89 0.86 3.75 0.2511 2.2511 0.3518 0.00663 0.004320 0.00268 131.27 643.70
Thestepcomputationsarecarriedoutasshownintheabovetable.Thevaluesineachcolumnofthetableareexplainedasfollows:
Column Explanation
1 Depthofflow(ft)assignedfrom6to2feet
2 Waterarea(ft2)correspondingtodepthyinCol.1
3 Hydraulicradius(ft)correspondingtoyinCol.1
4 4/3powerofthehydraulicradius
5 Meanvelocity(fps)obtainedbydividingQ(30cfs)bythewaterareainCol.2
6 Velocityhead(ft)
7 Specificenergy(ft)obtainedbyaddingthevelocityheadinCol.6todepthofflowinCol.1
8 Changeofspecificenergy(ft)equaltothedifferencebetweentheEvalueinCol.7andthatofthepreviousstep.
9 FrictionslopeSf,computedfromVasgiveninCol.5andR4/3inCol.4
10 Averagefrictionslopebetweenthesteps,equaltothearithmeticmeanofthefrictionslopejustcomputedin Col.9andthatofthepreviousstep
11 Differencebetweenthebottomslope,So,andtheaveragefrictionslope,S
f
12 Lengthofthereach(ft)betweentheconsecutivesteps; Computedby∆x=∆E /(S
o–S
f)orbydividingthevalueinCol.8bythevalueinCol.11
13 Distancefromthebeginningpointtothesectionunderconsideration.Thisisequaltothecumulativesumofthe valuesinCol.12computedforprevioussteps.
––
38
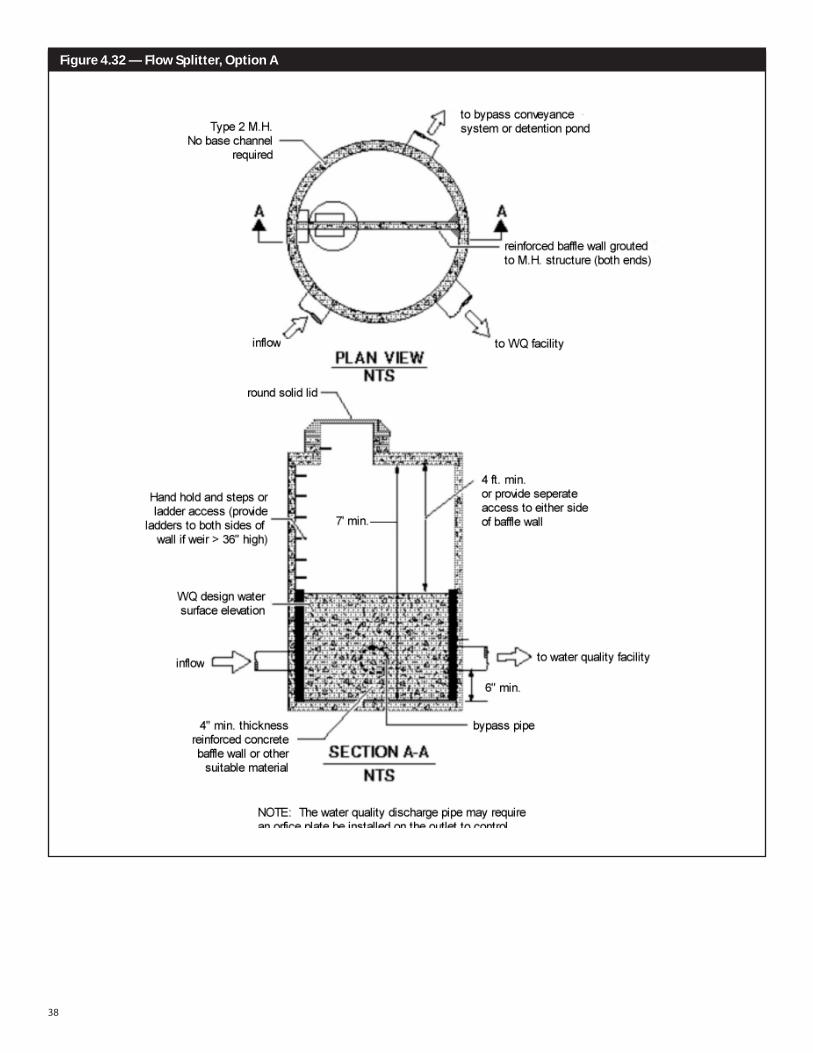
Figure 4.32 — Flow Splitter, Option A
39
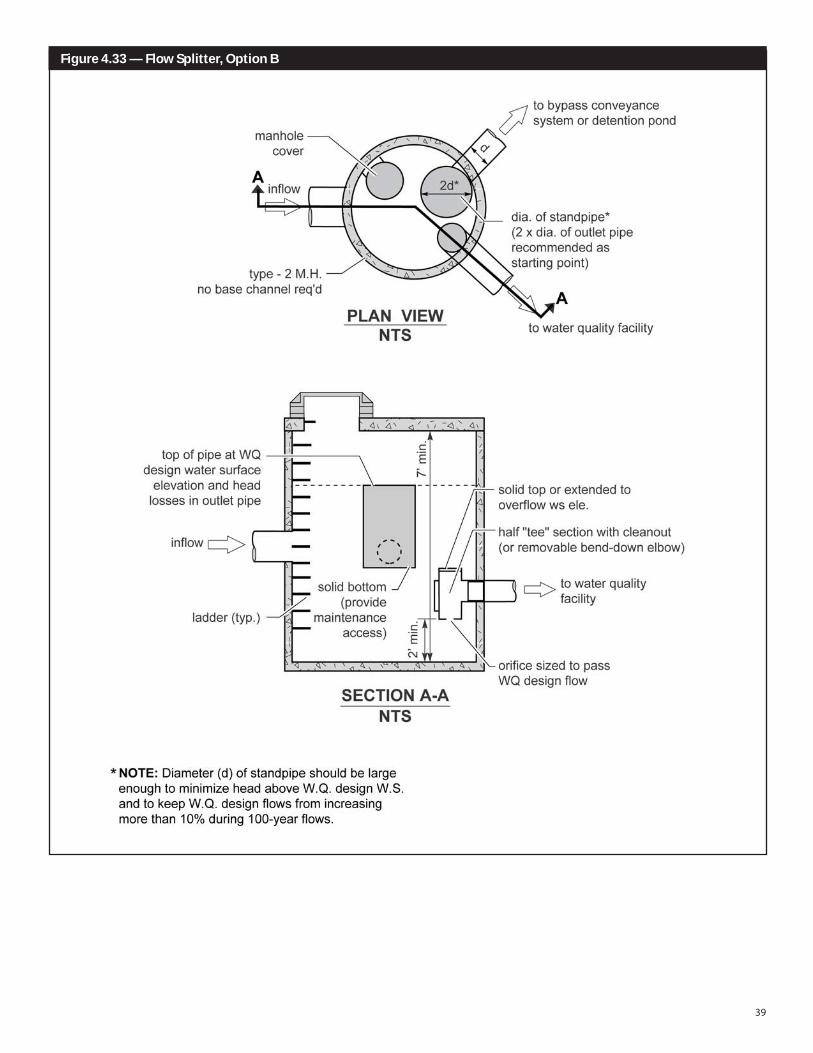
Figure 4.33 — Flow Splitter, Option B
40
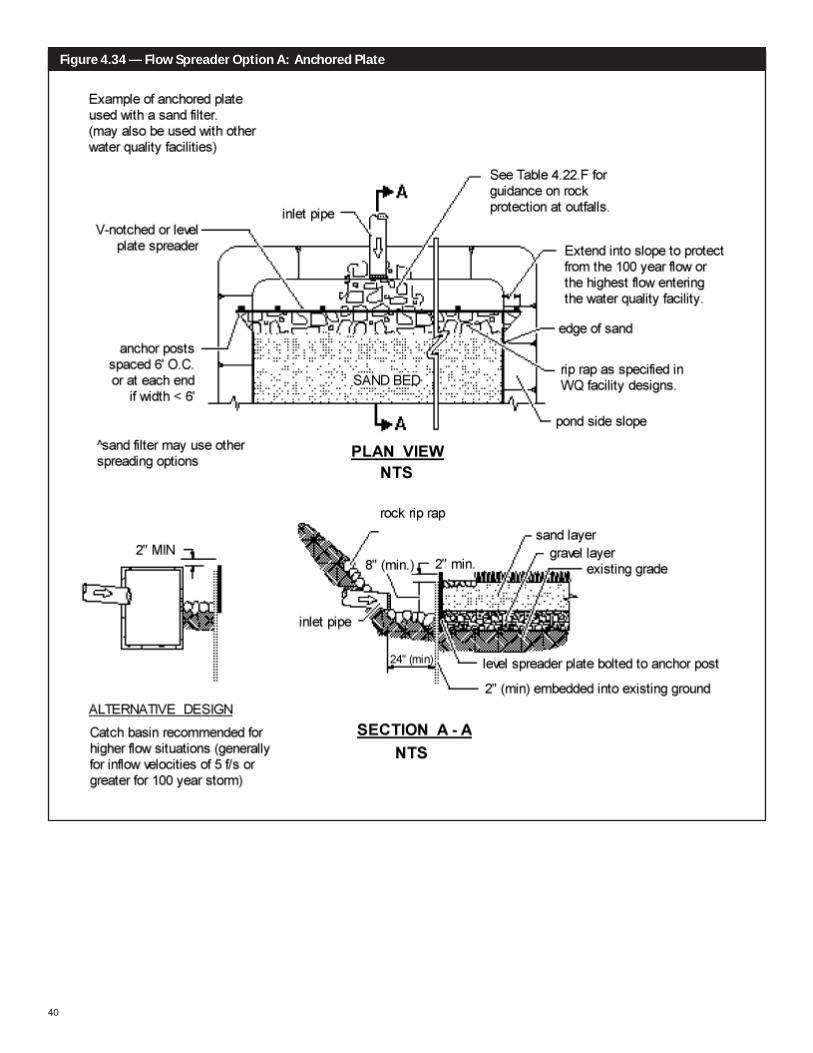
Figure 4.34 — Flow Spreader Option A: Anchored Plate
41
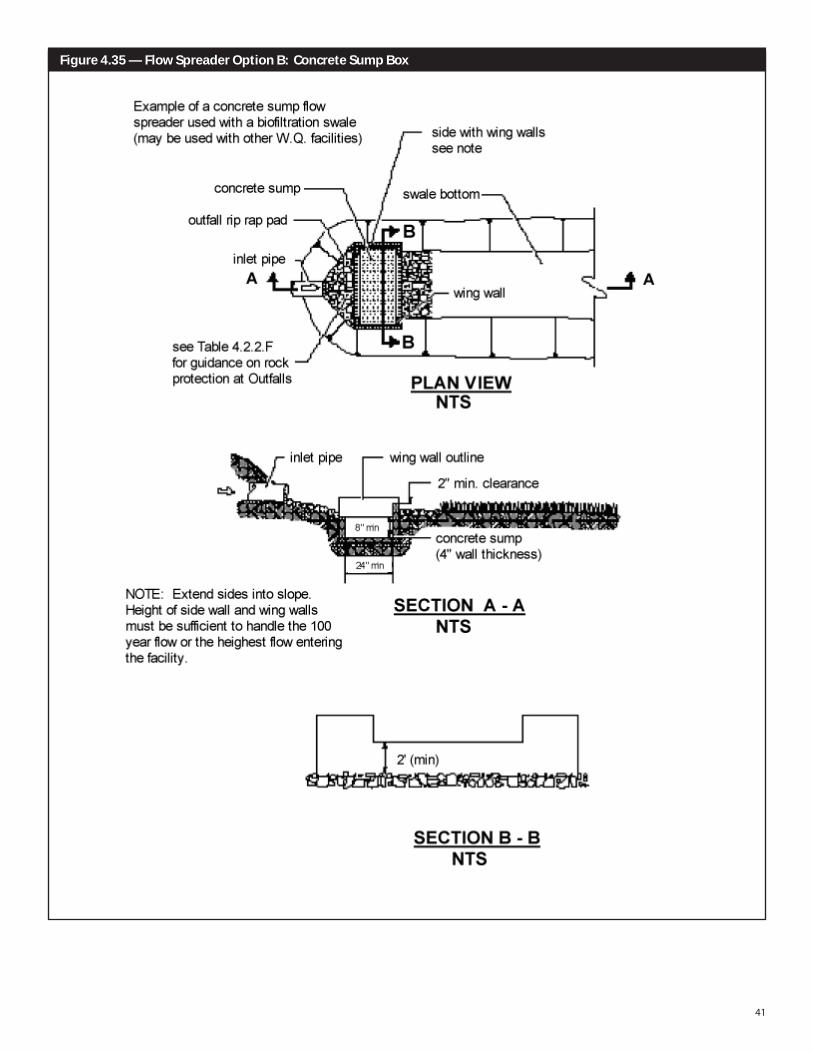
Figure 4.35 — Flow Spreader Option B: Concrete Sump Box
42
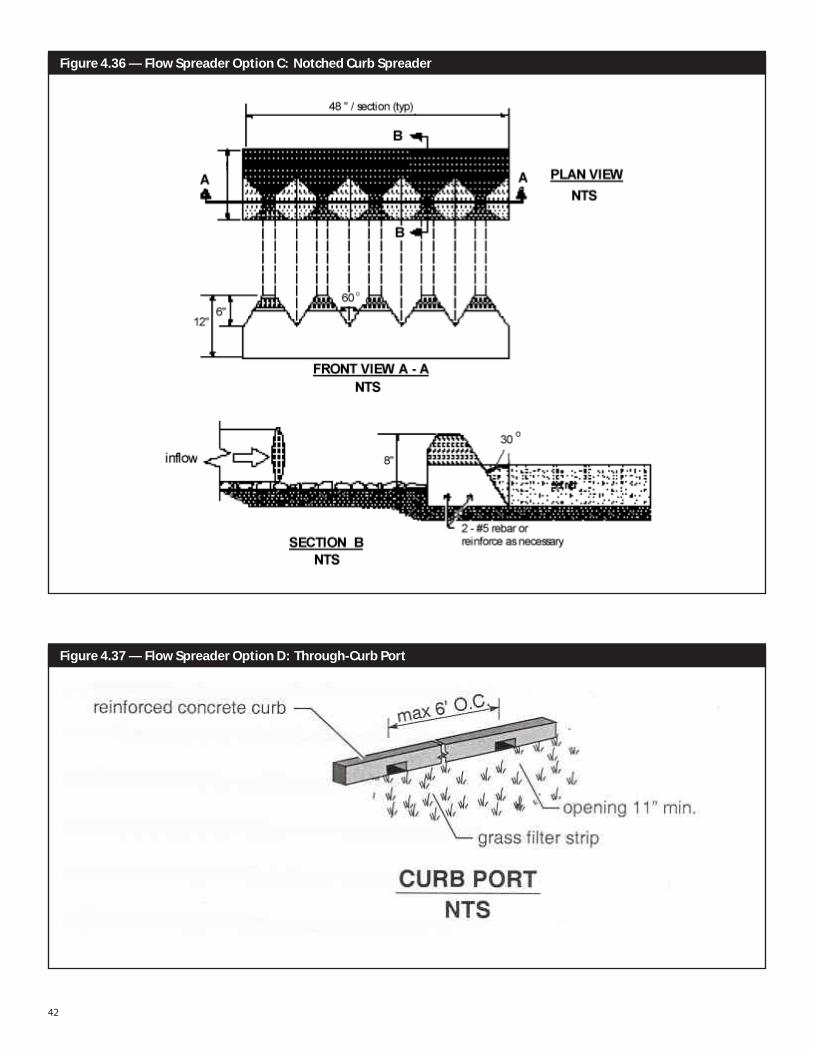
Figure 4.36 — Flow Spreader Option C: Notched Curb Spreader
Figure 4.37 — Flow Spreader Option D: Through-Curb Port

43
Kitsap CountyStormwater
DesignManual
CHAPTER 5–FIGURES

44
THIS PAGE LEFT BLANK INTENTIONALLY
45
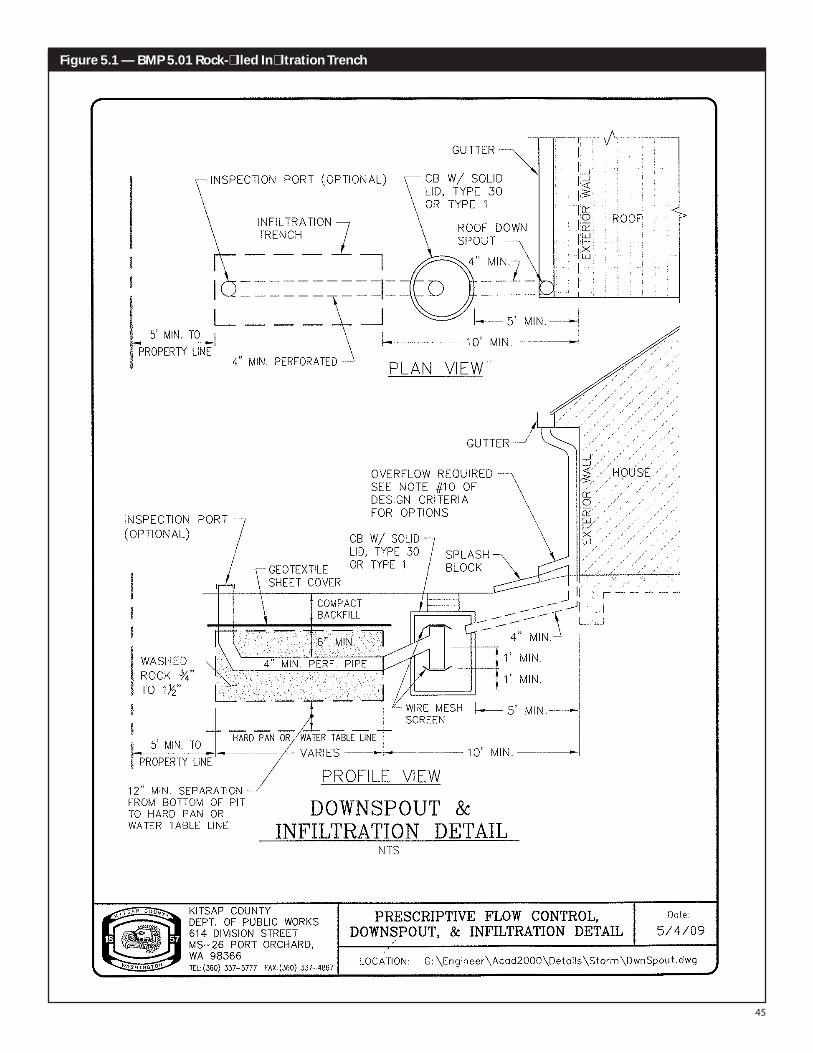
Figure 5.1 — BMP 5.01 Rock-filled Infiltration Trench
46
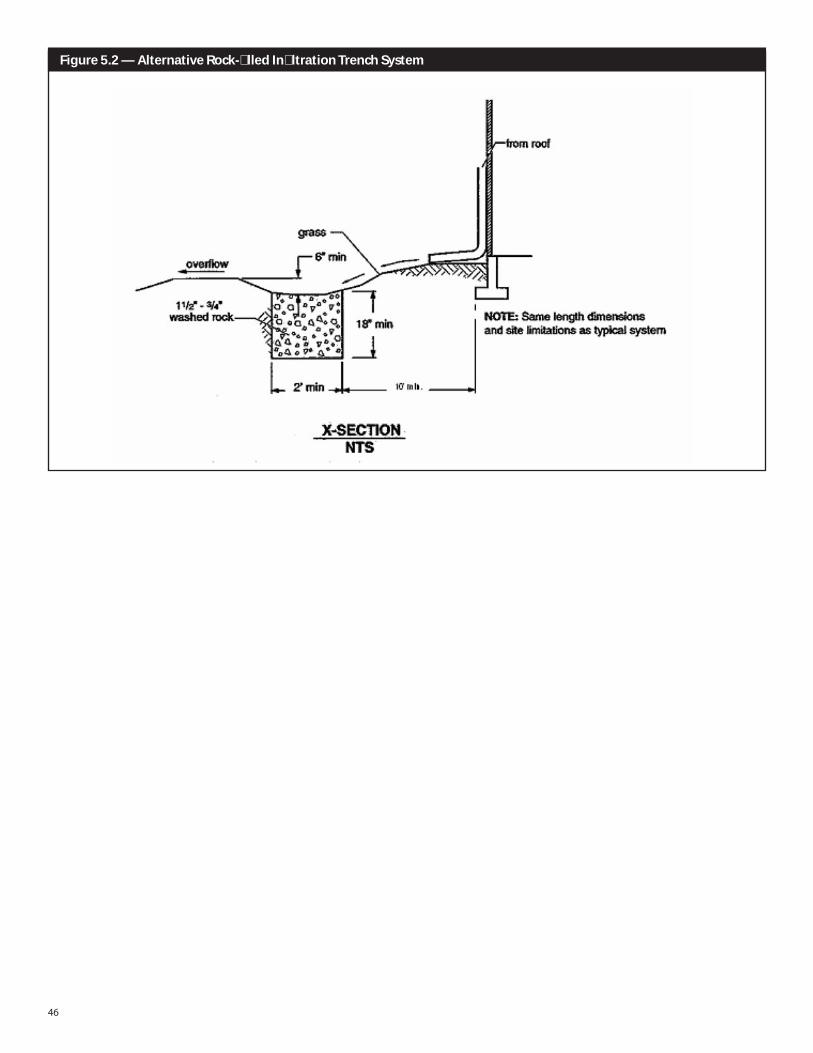
Figure 5.2 — Alternative Rock-filled Infiltration Trench System
47
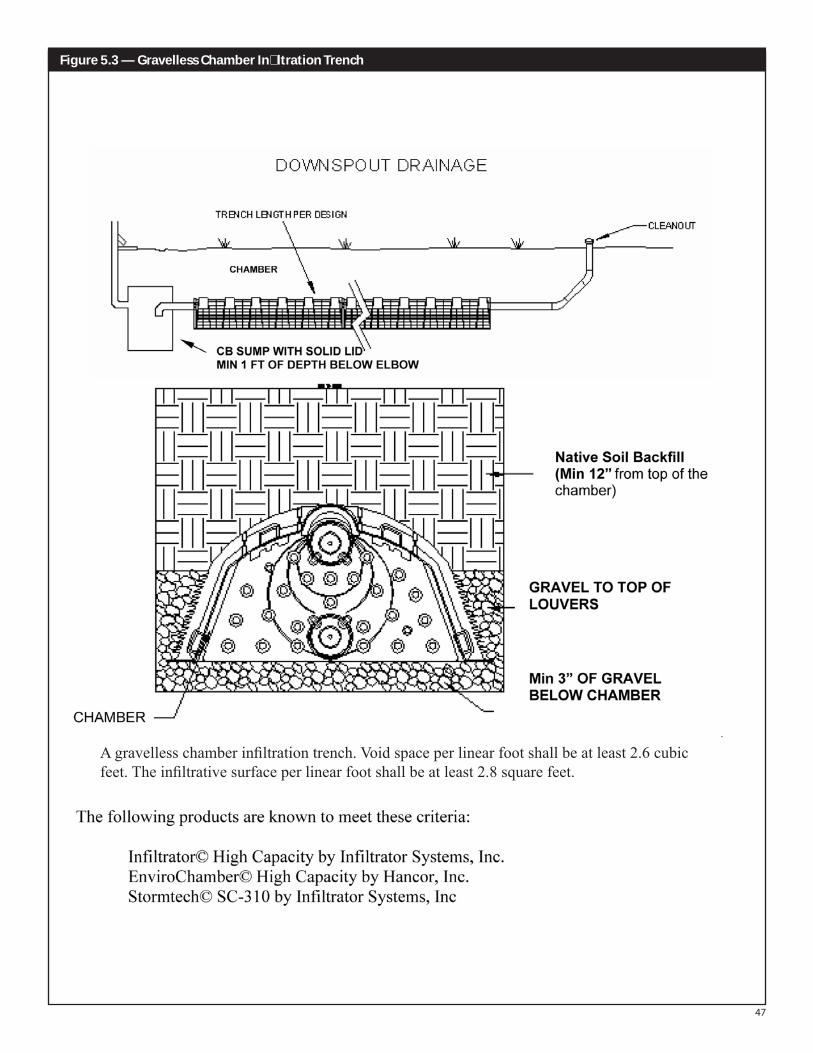
Figure 5.3 — Gravelless Chamber Infiltration Trench
A gravelless chamber infiltration trench. Void space per linear foot shall be at least 2.6 cubic feet. The infiltrative surface per linear foot shall be at least 2.8 square feet.
48
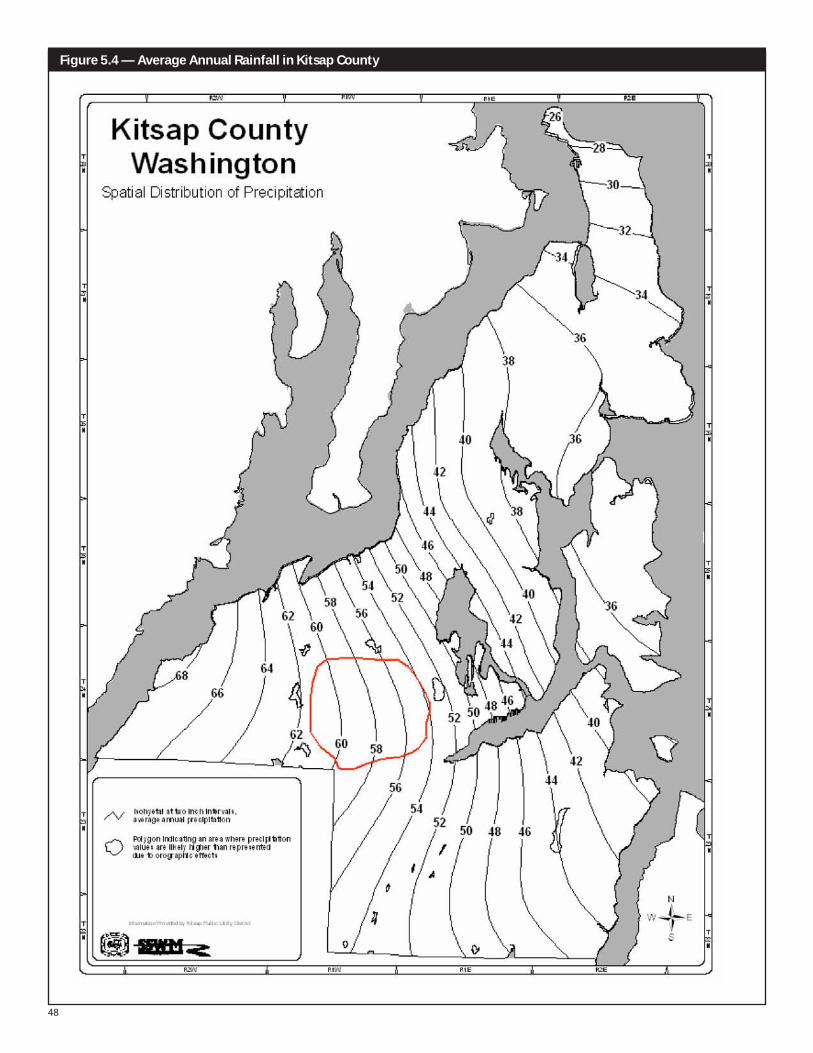
Figure 5.4 — Average Annual Rainfall in Kitsap County

49
Kitsap CountyStormwater
DesignManual
CHAPTER 6–FIGURES

50
THIS PAGE LEFT BLANK INTENTIONALLY
51
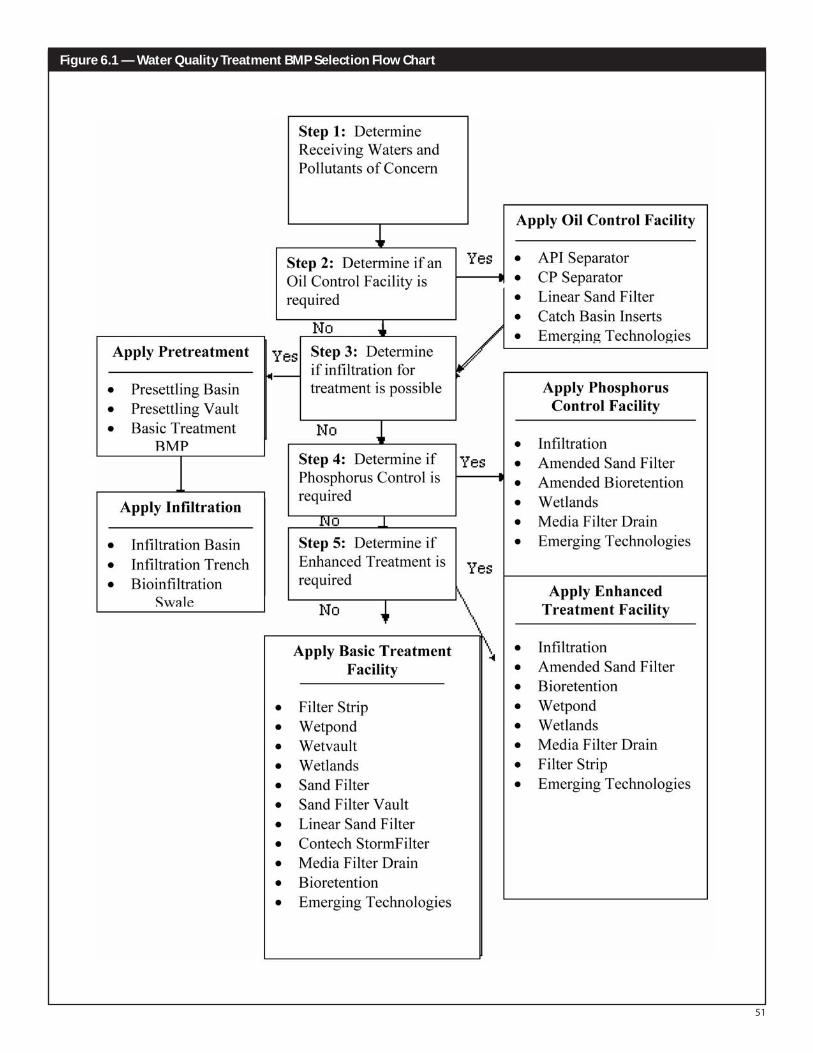
Figure 6.1 — Water Quality Treatment BMP Selection Flow Chart
52
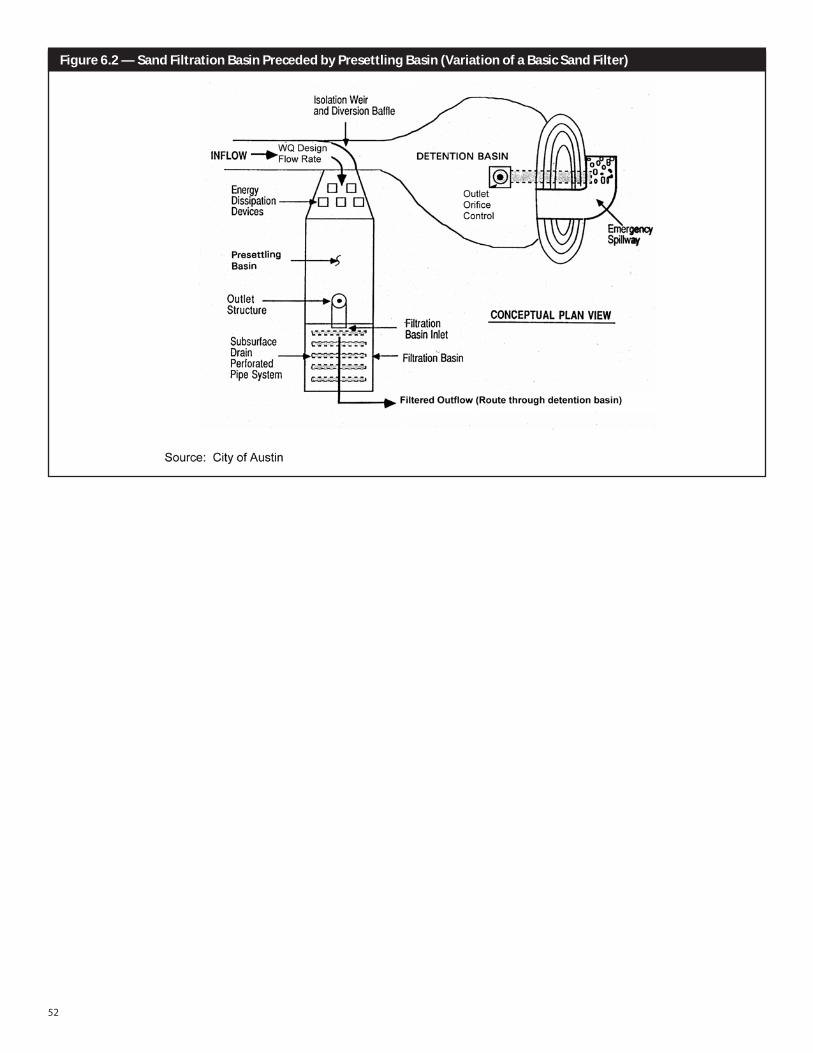
Figure 6.2 — Sand Filtration Basin Preceded by Presettling Basin (Variation of a Basic Sand Filter)
53
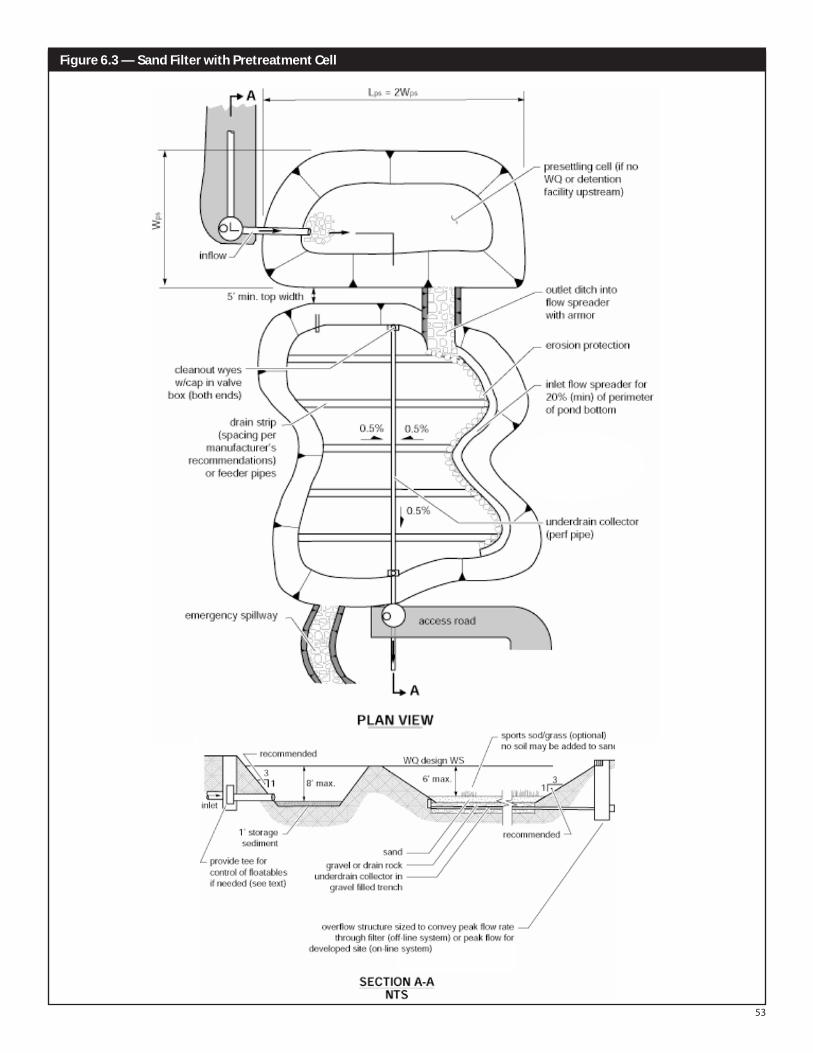
Figure 6.3 — Sand Filter with Pretreatment Cell
54
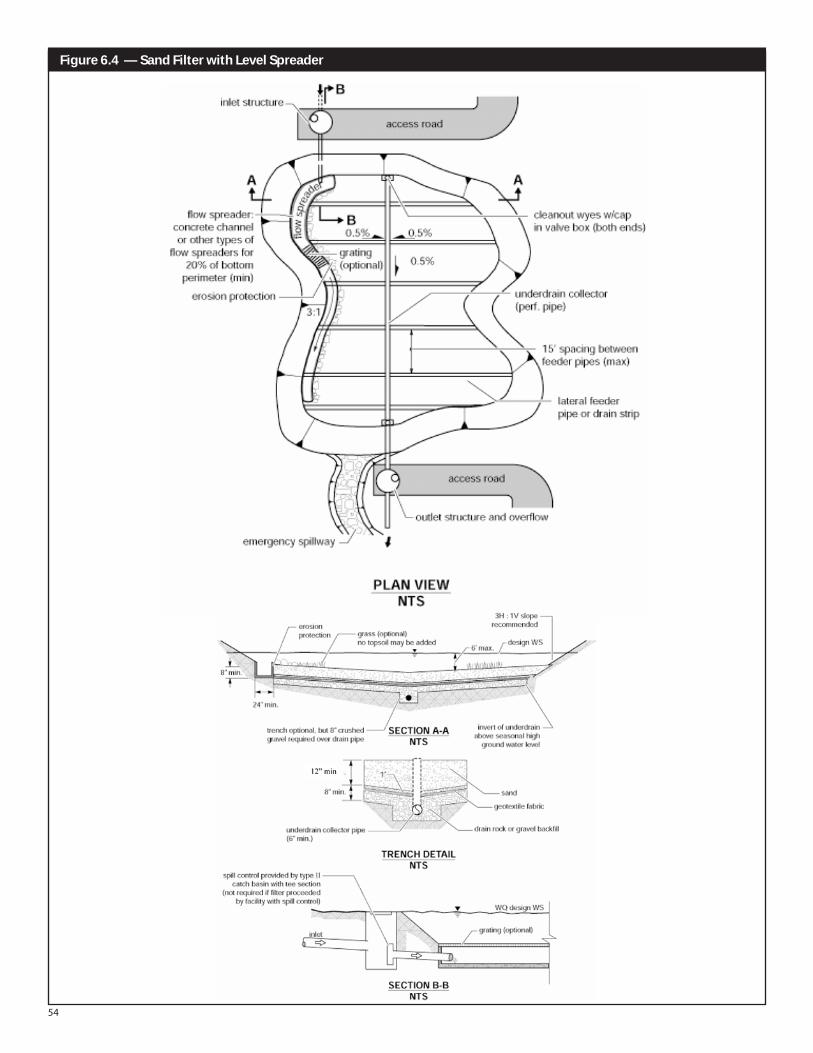
Figure 6.4 — Sand Filter with Level Spreader
55
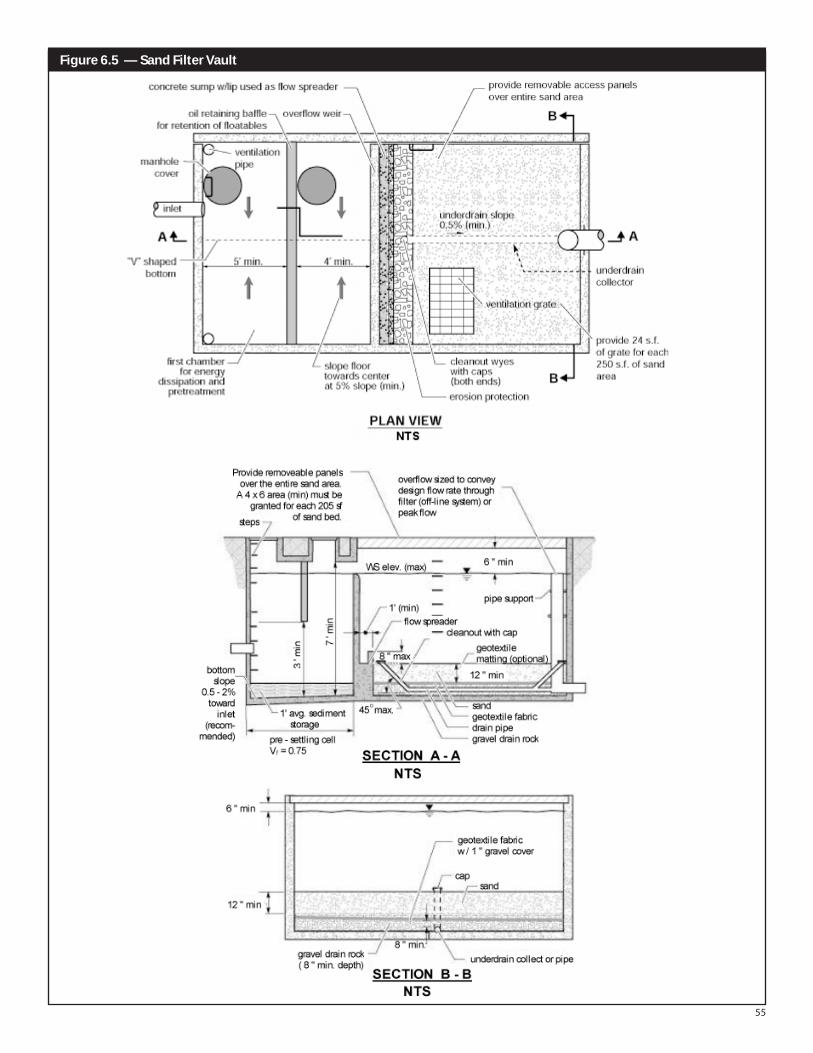
Figure 6.5 — Sand Filter Vault
56
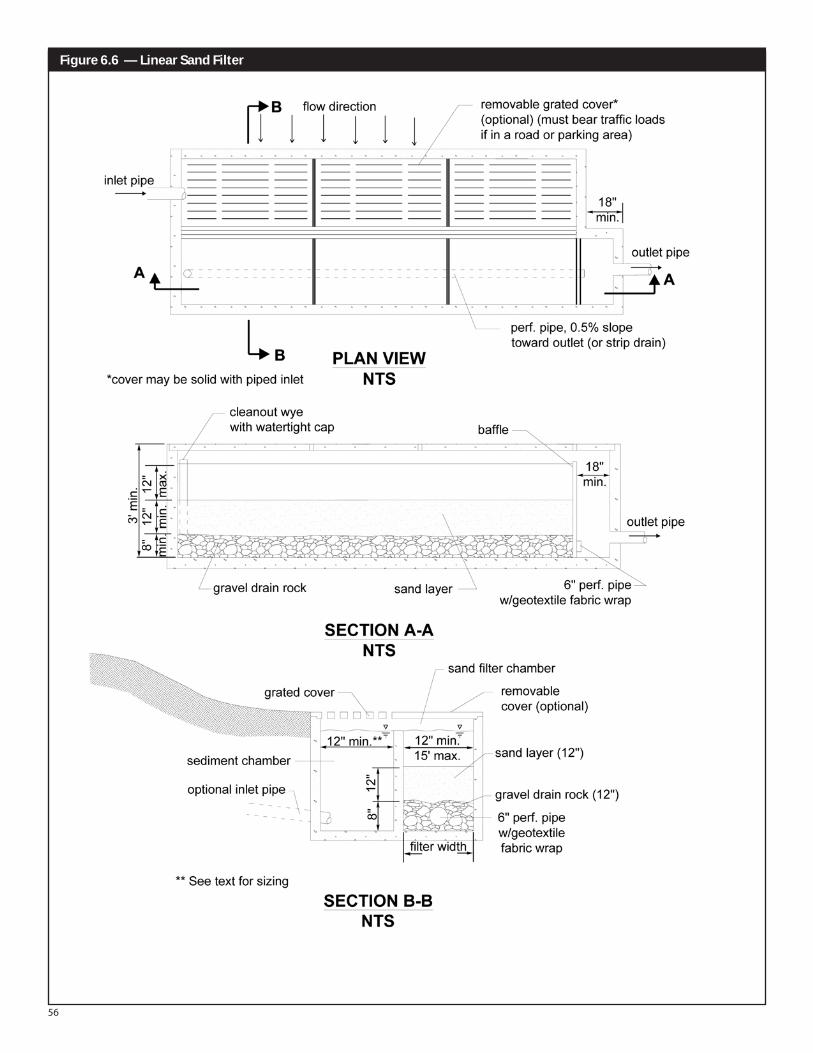
Figure 6.6 — Linear Sand Filter
57
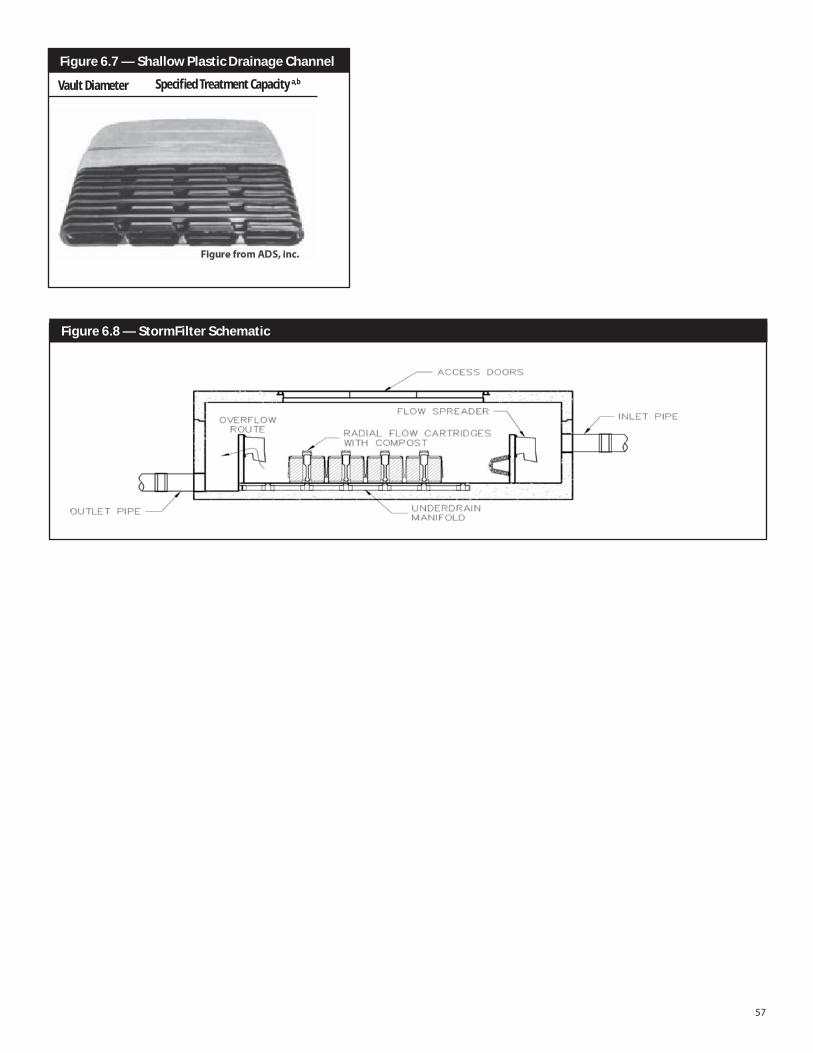
Figure 6.7 — Shallow Plastic Drainage Channel
Vault Diameter Specified Treatment Capacity a,b
Figure 6.8 — StormFilter Schematic
58
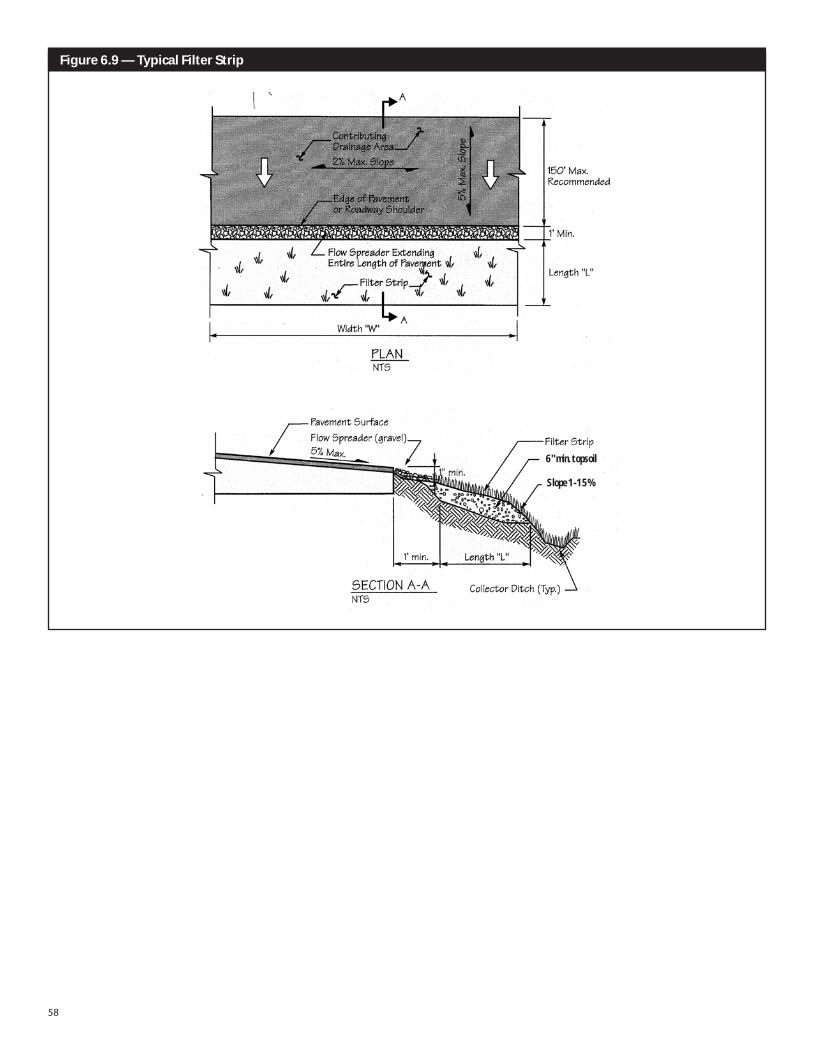
Figure 6.9 — Typical Filter Strip
6" min. topsoil
Slope 1-15%
59
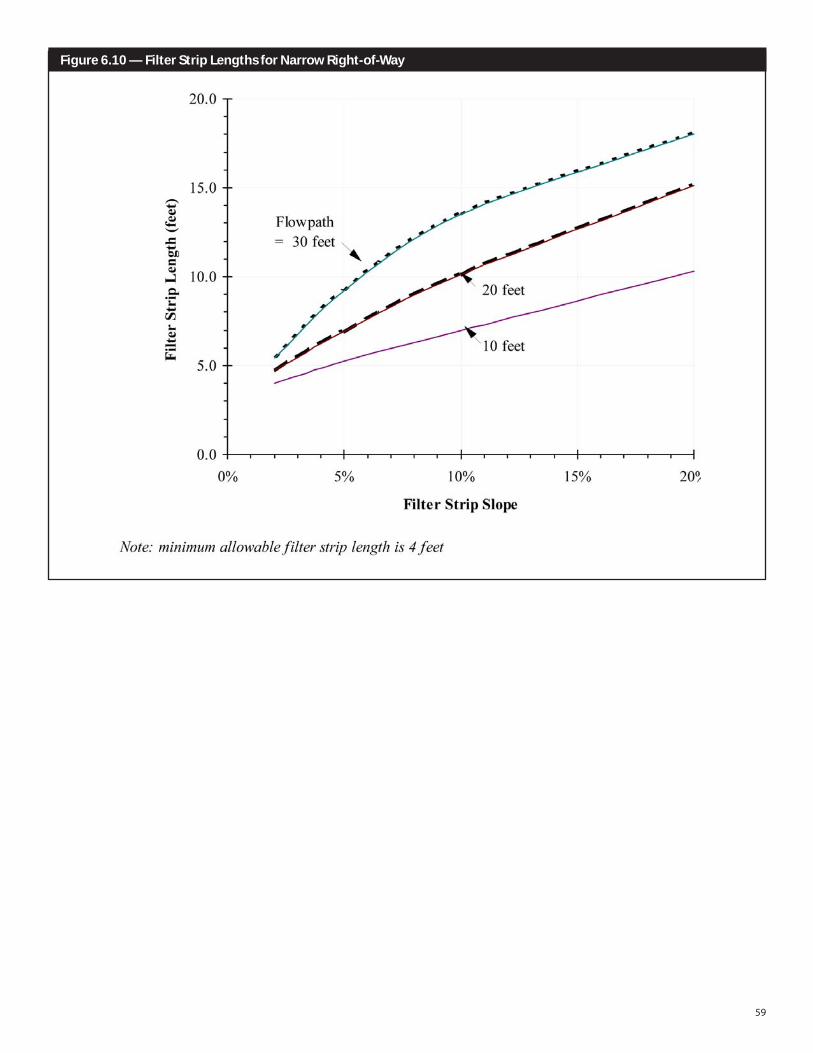
Figure 6.10 — Filter Strip Lengths for Narrow Right-of-Way
60
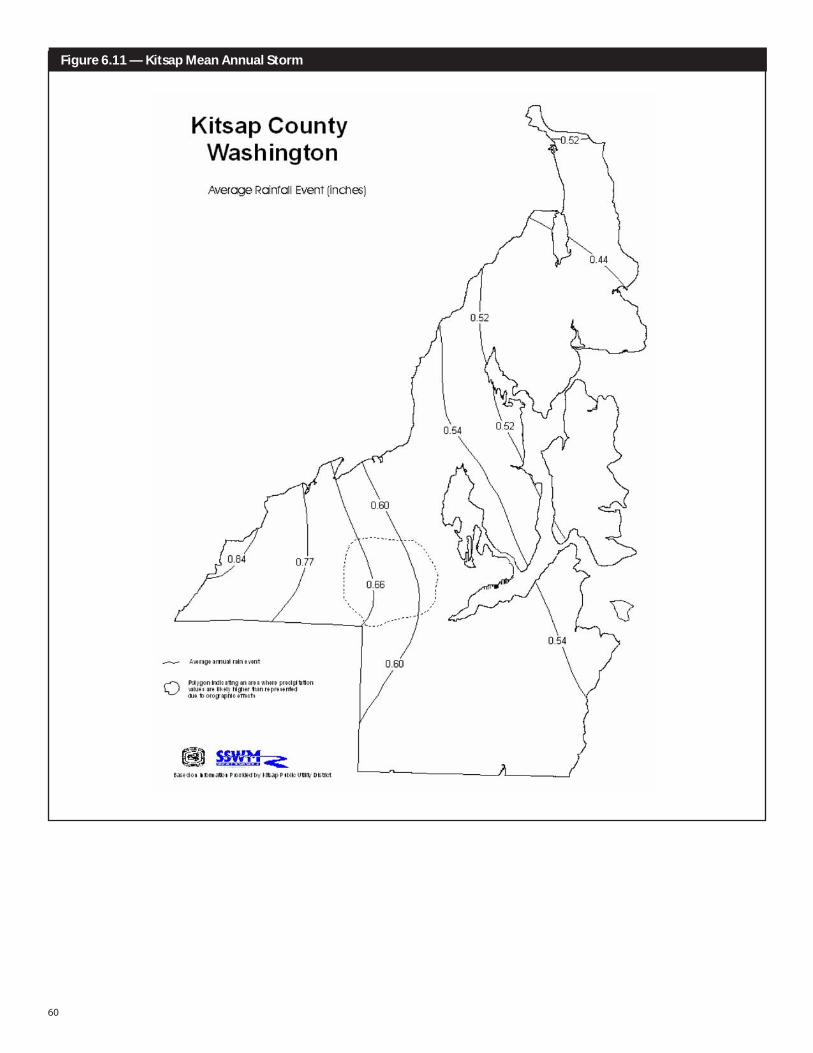
Figure 6.11 — Kitsap Mean Annual Storm
61
Figure 6.12 — Possible Wetpond Inlet / Outlet Configurations
62
Figure 6.13 — Wetpond
63
Figure 6.13 (continued) — Wetpond
64
Figure 6.14 — Wetvault
65
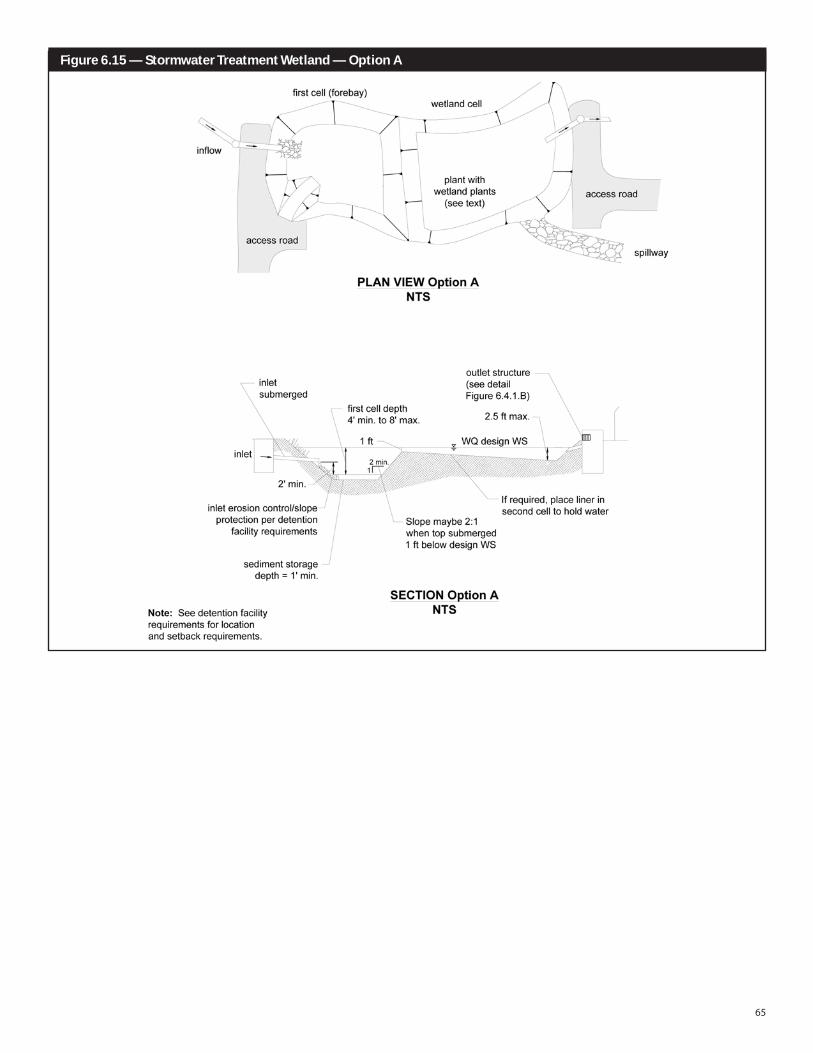
Figure 6.15 — Stormwater Treatment Wetland — Option A
66
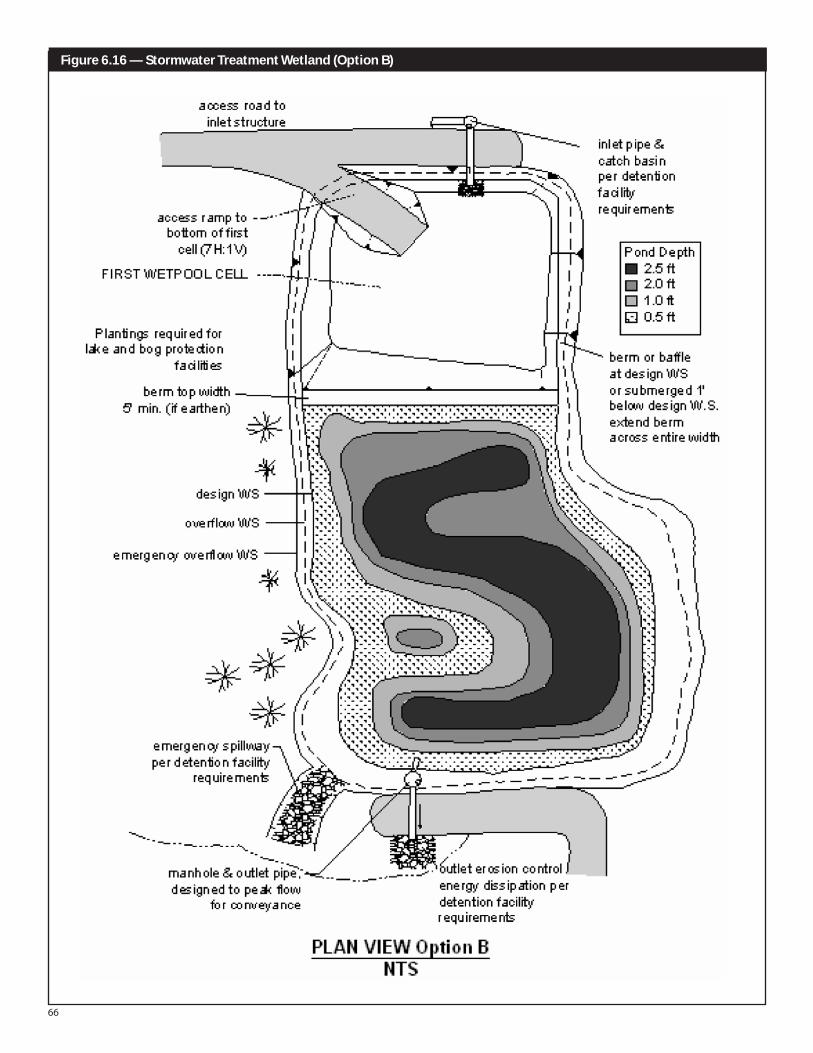
Figure 6.16 — Stormwater Treatment Wetland (Option B)
67
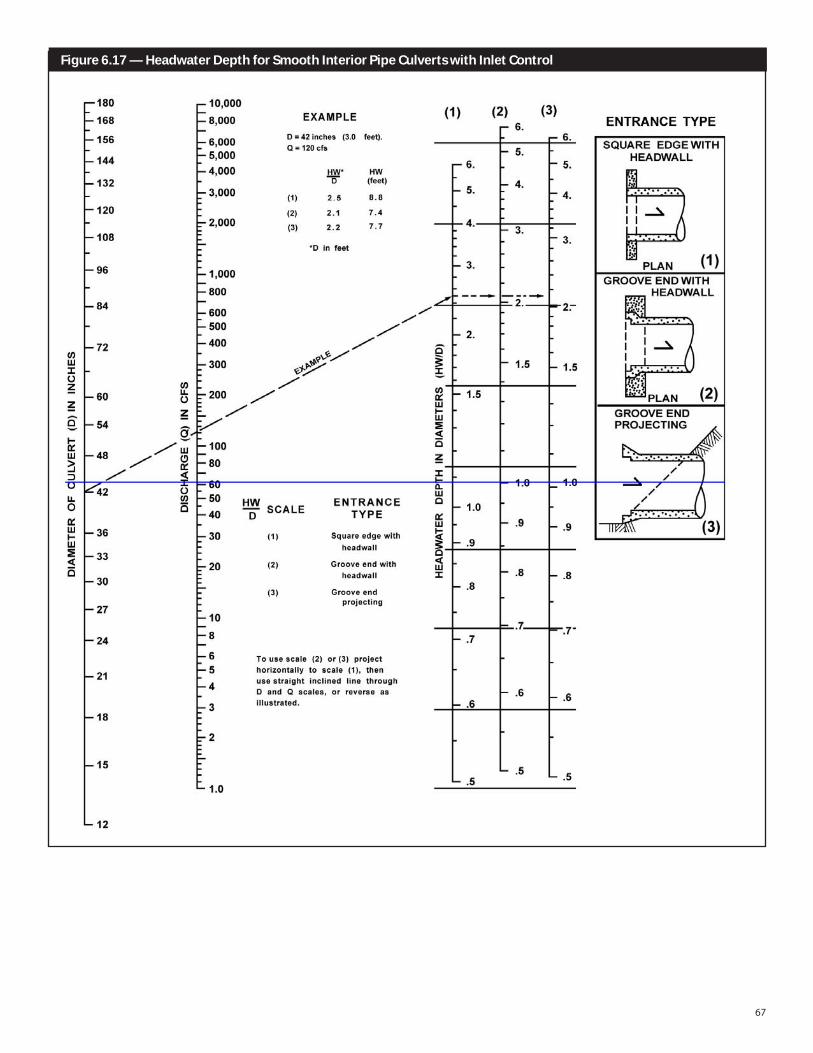
Figure 6.17 — Headwater Depth for Smooth Interior Pipe Culverts with Inlet Control
68
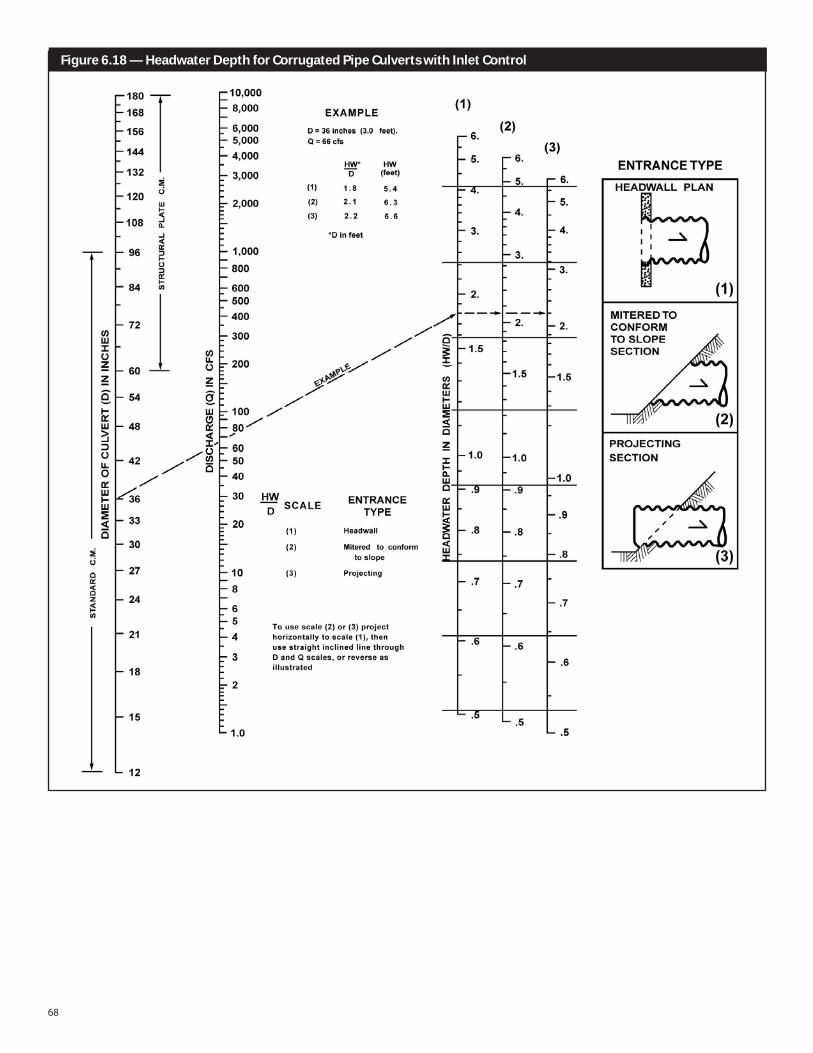
Figure 6.18 — Headwater Depth for Corrugated Pipe Culverts with Inlet Control
69
Figure 6.19 — Critical Depth of Flow for Circular Culverts
70
Figure 6.20 — Circular Channel Ratios
71
Figure 6.21 — Turbulence Factor Plot
Figure 6.22 — Effective Separation Surface vs. Flow Rate
72
Figure 6.23 — Projected Horizontal Plate Area for Coalescing Plate Oil / Water Separator
73
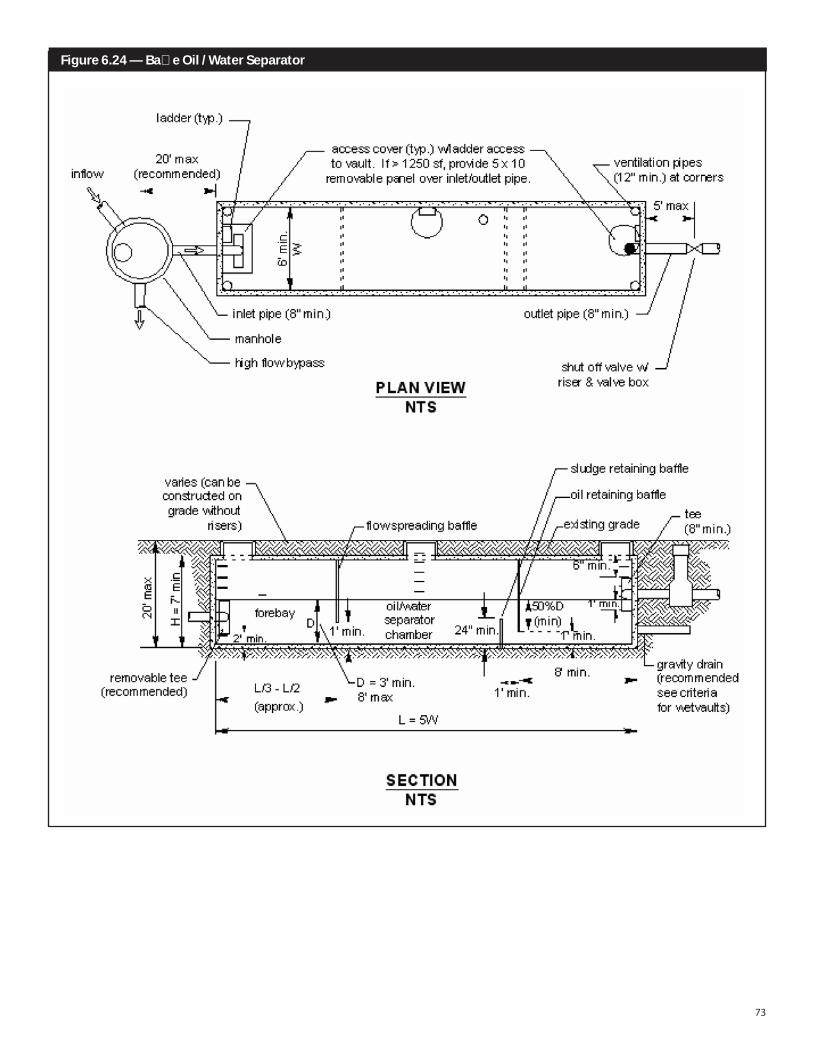
Figure 6.24 — Baffle Oil / Water Separator
74
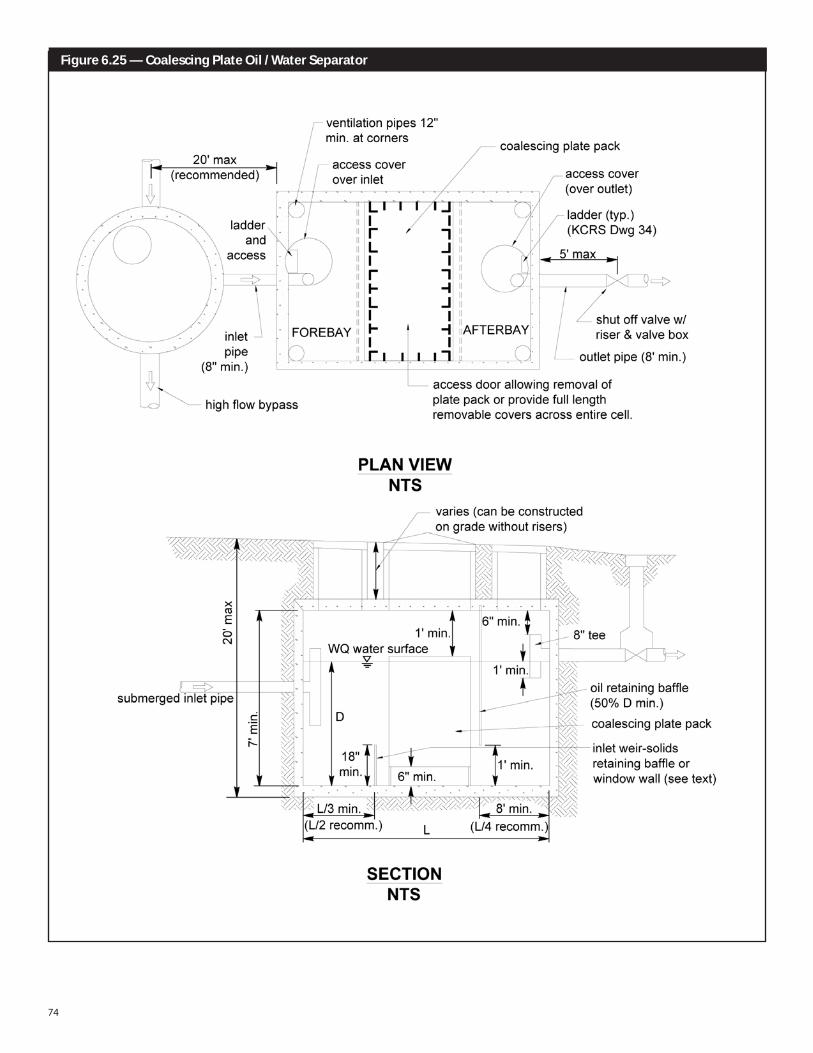
Figure 6.25 — Coalescing Plate Oil / Water Separator
75
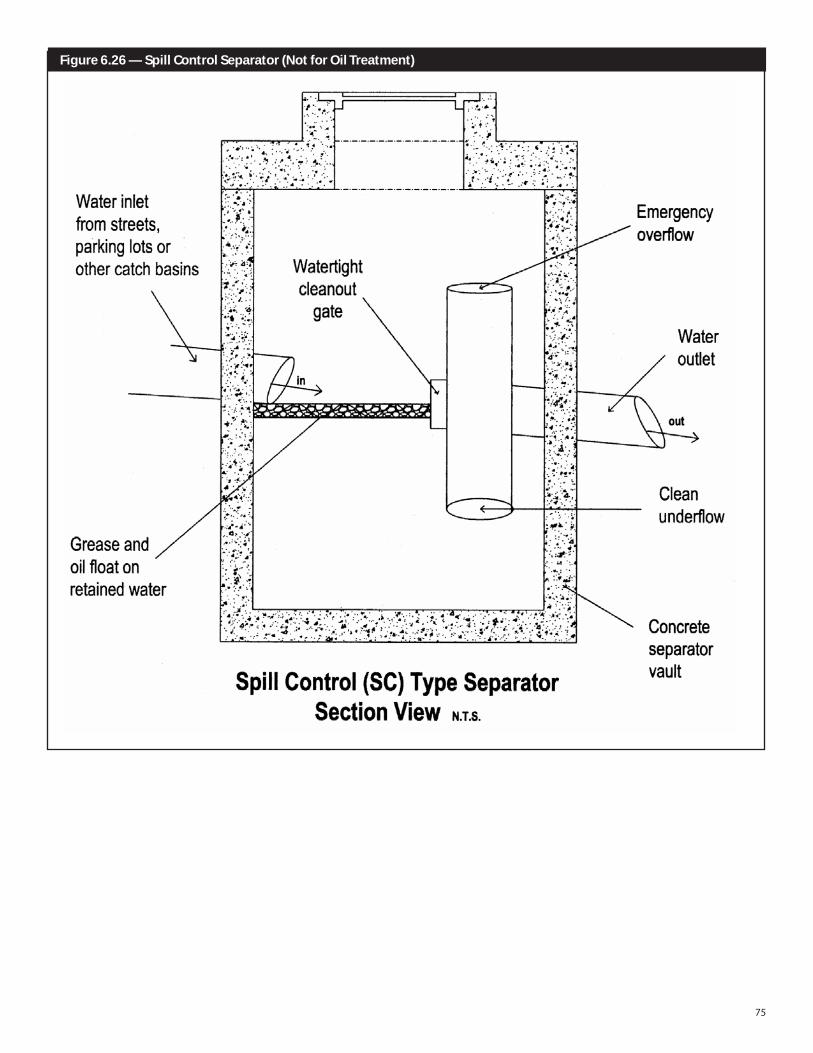
Figure 6.26 — Spill Control Separator (Not for Oil Treatment)

76
THIS PAGE LEFT BLANK INTENTIONALLY

77
Kitsap CountyStormwater
DesignManual
CHAPTER 7–FIGURES

78
THIS PAGE LEFT BLANK INTENTIONALLY
79
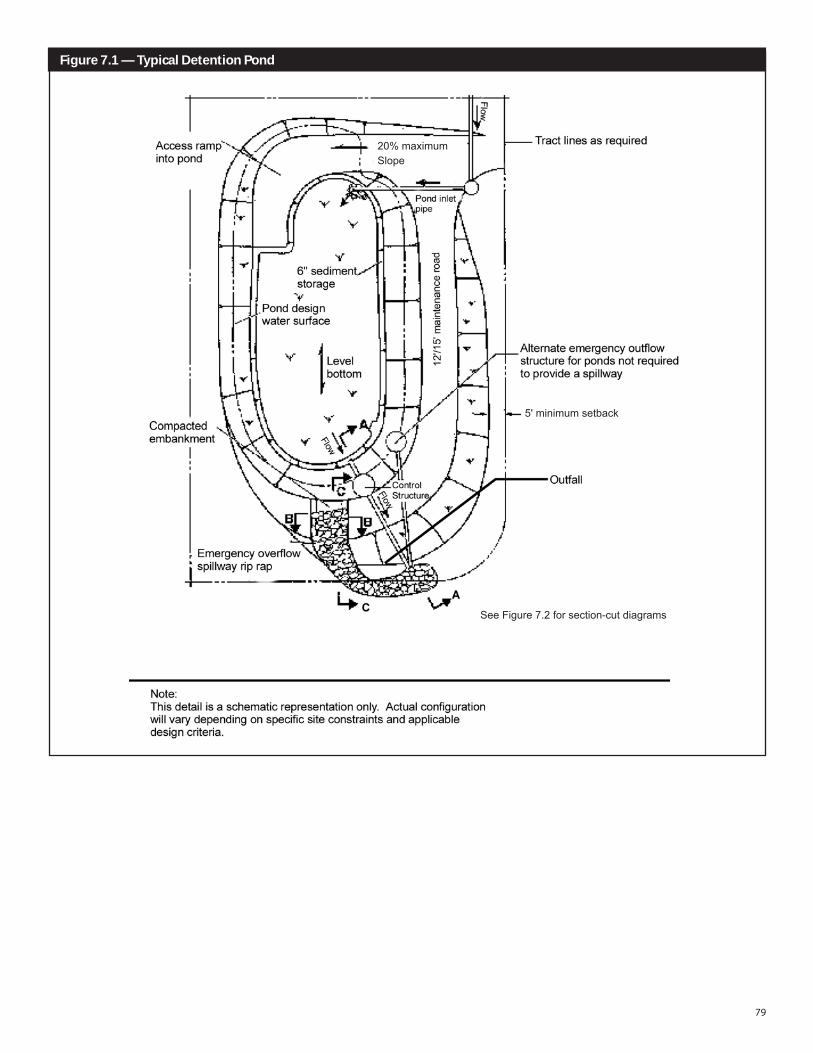
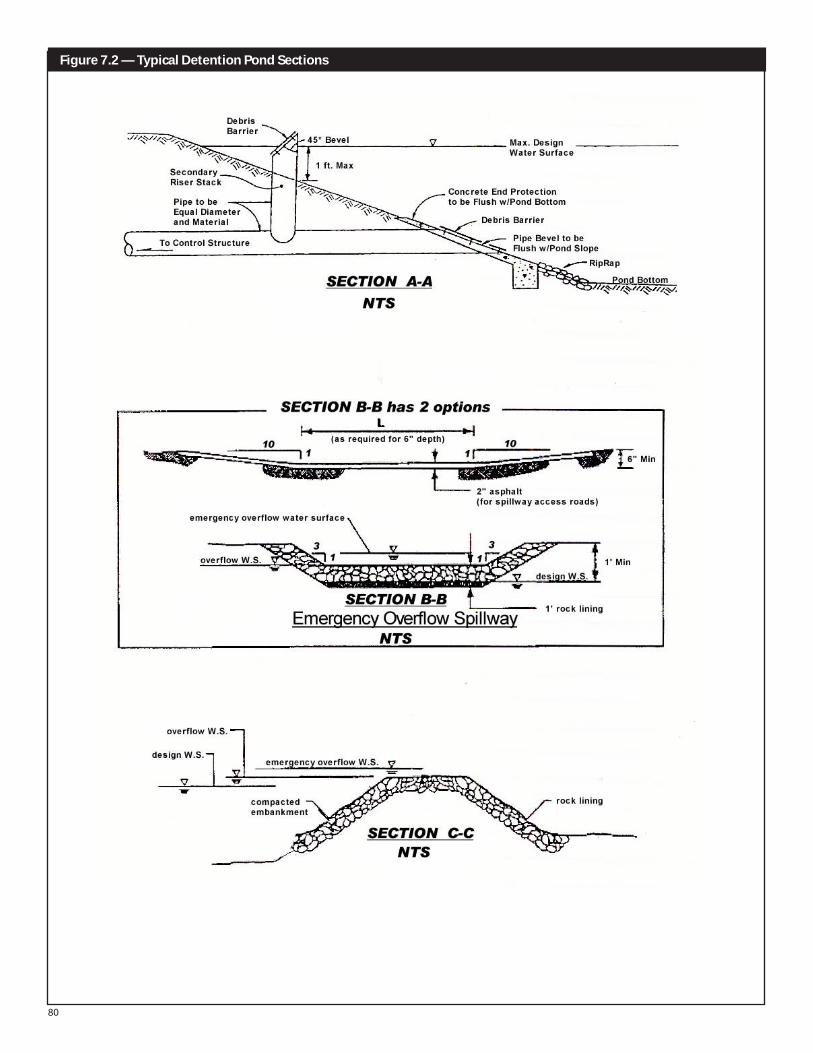
Figure 7.1 — Typical Detention Pond
20% maximumSlope
5' minimum setback
See Figure 7.2 for section-cut diagrams
80
Figure 7.2 — Typical Detention Pond Sections
81
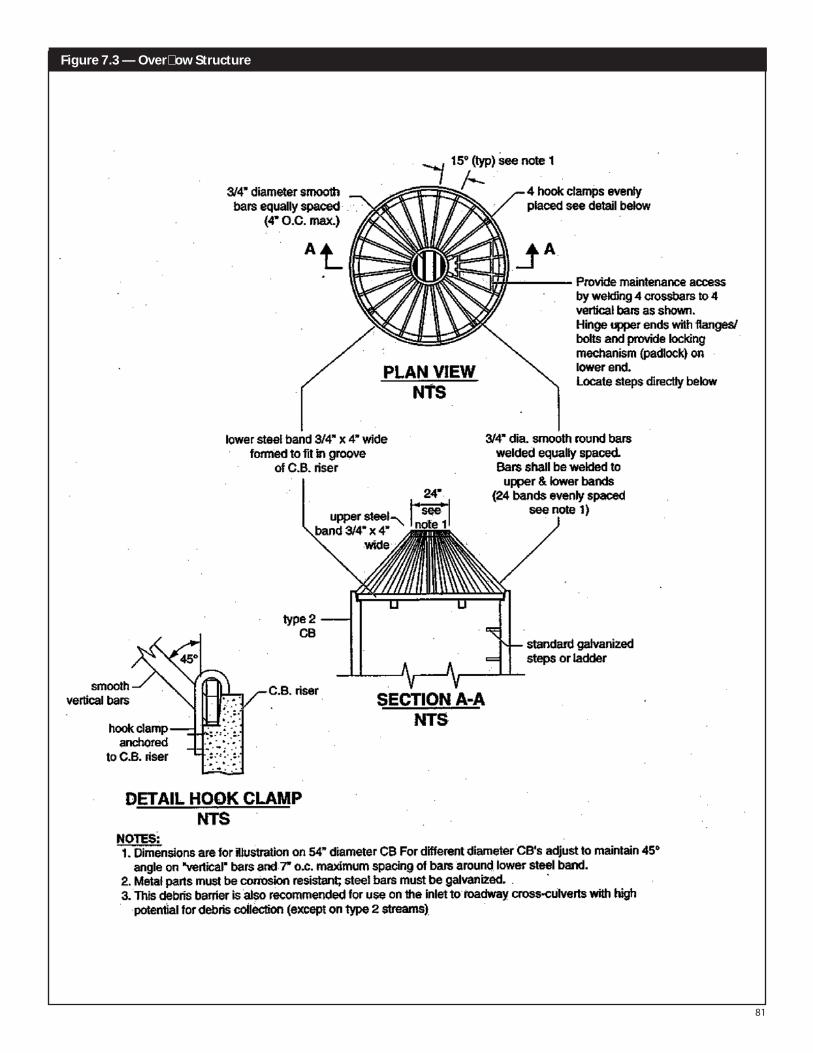
Figure 7.3 — Overflow Structure
82
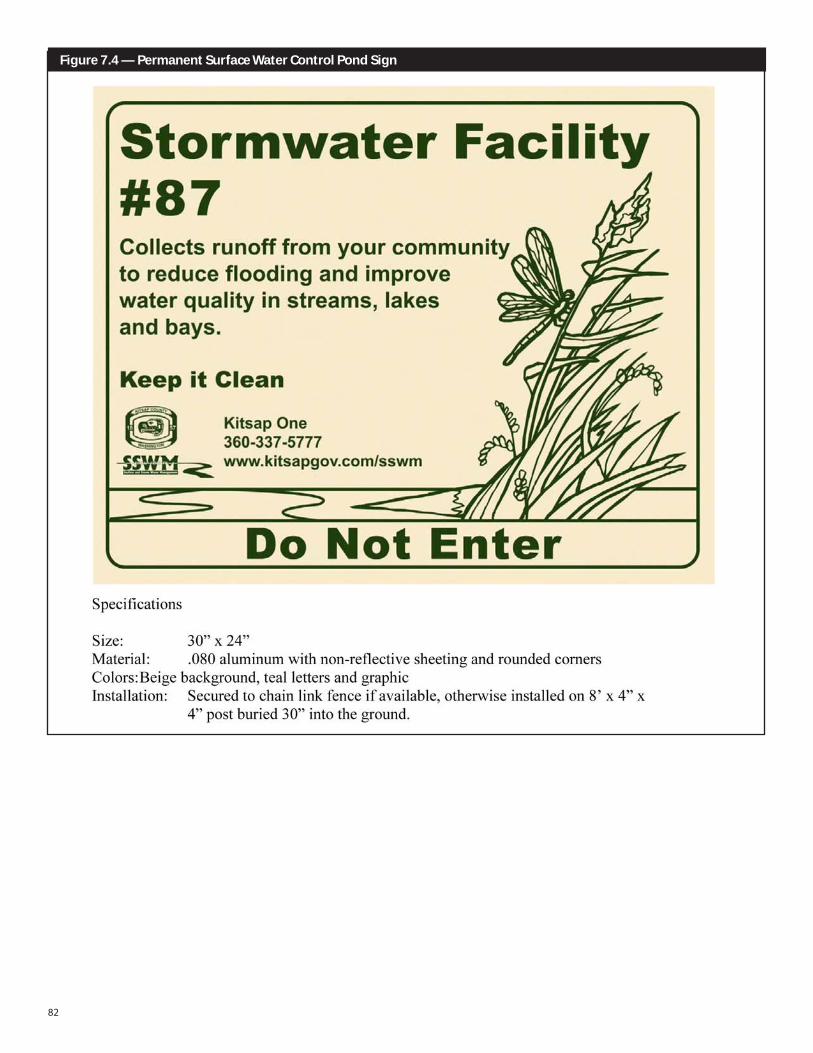
Figure 7.4 — Permanent Surface Water Control Pond Sign
83
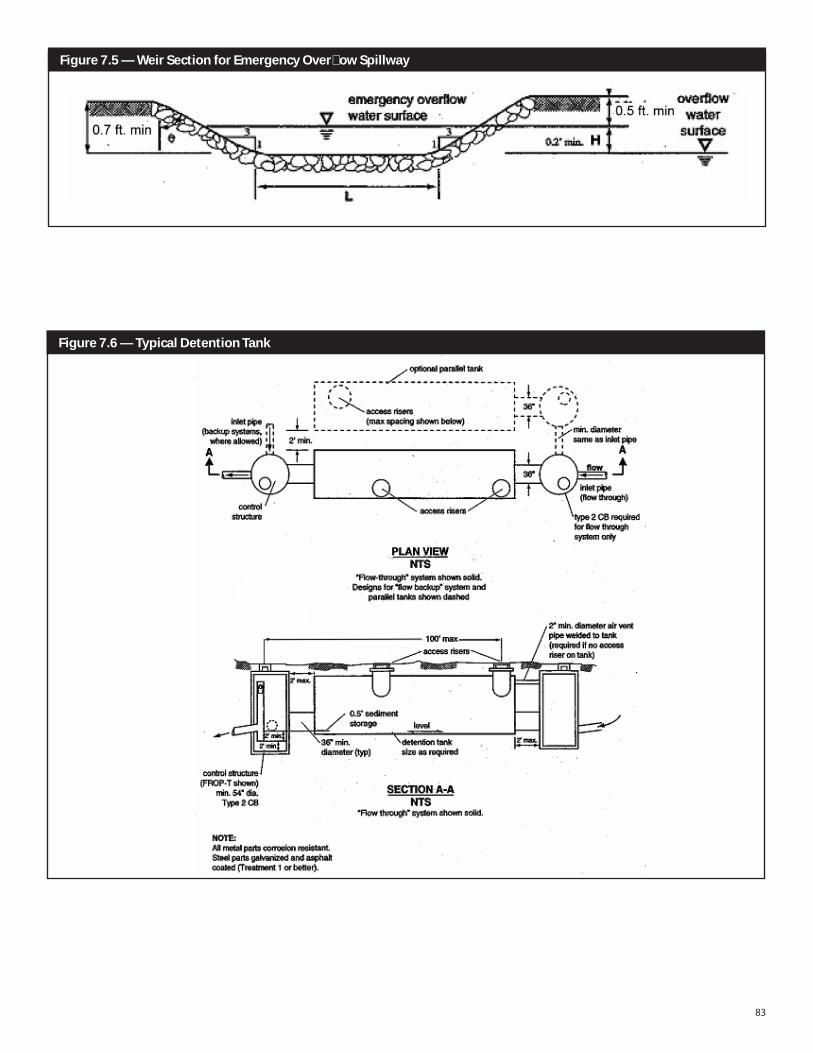
Figure 7.6 — Typical Detention Tank
Figure 7.5 — Weir Section for Emergency Overflow Spillway
84
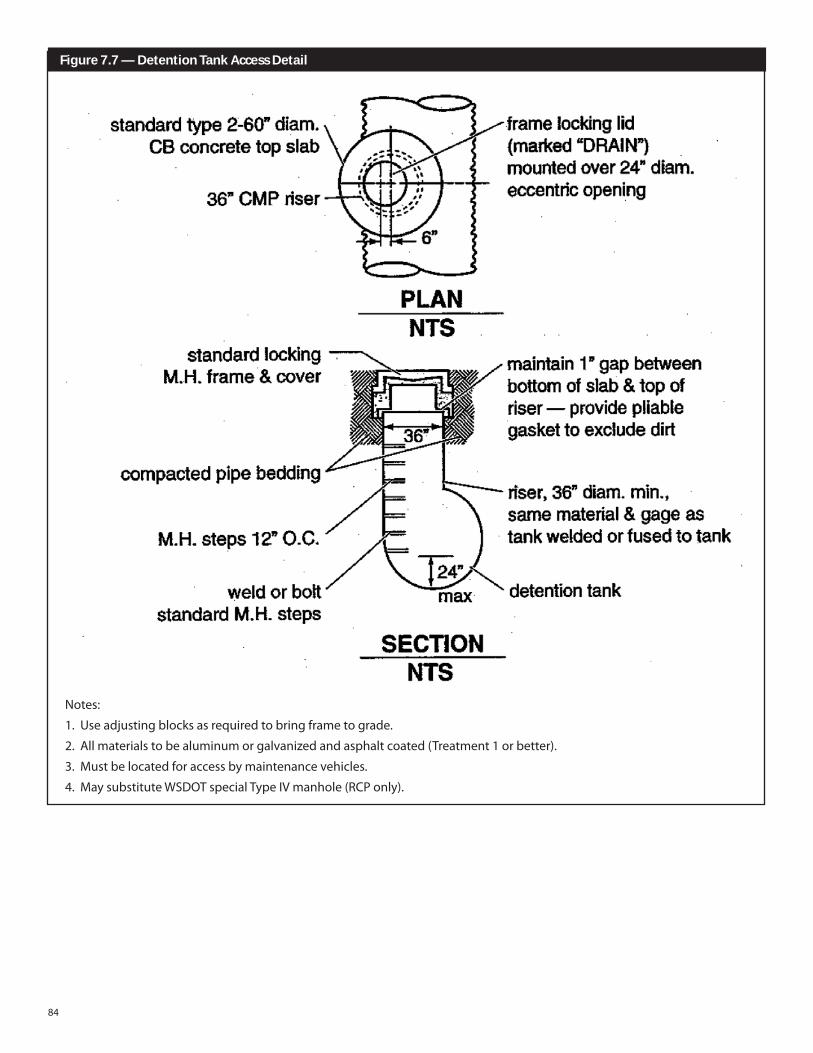
Figure 7.7 — Detention Tank Access Detail
Notes:
1.Useadjustingblocksasrequiredtobringframetograde.
2.Allmaterialstobealuminumorgalvanizedandasphaltcoated(Treatment1orbetter).
3.Mustbelocatedforaccessbymaintenancevehicles.
4.MaysubstituteWSDOTspecialTypeIVmanhole(RCPonly).
85
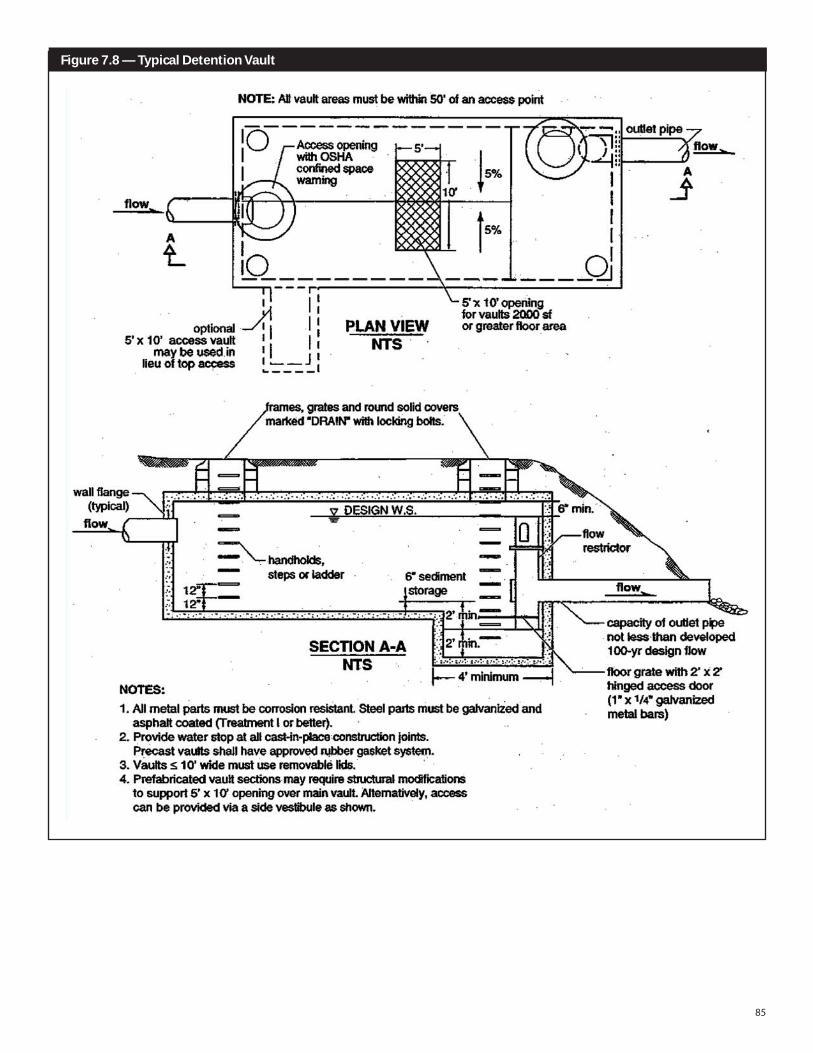
Figure 7.8 — Typical Detention Vault
86
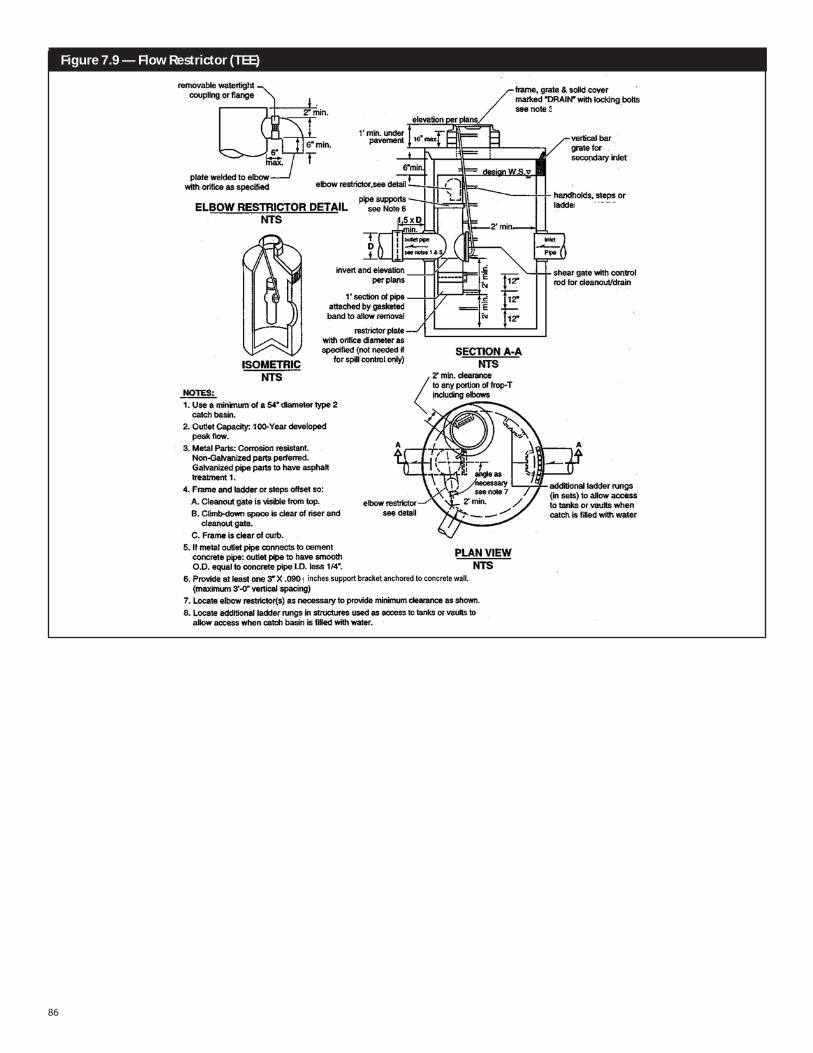
Figure 7.9 — Flow Restrictor (TEE)
87
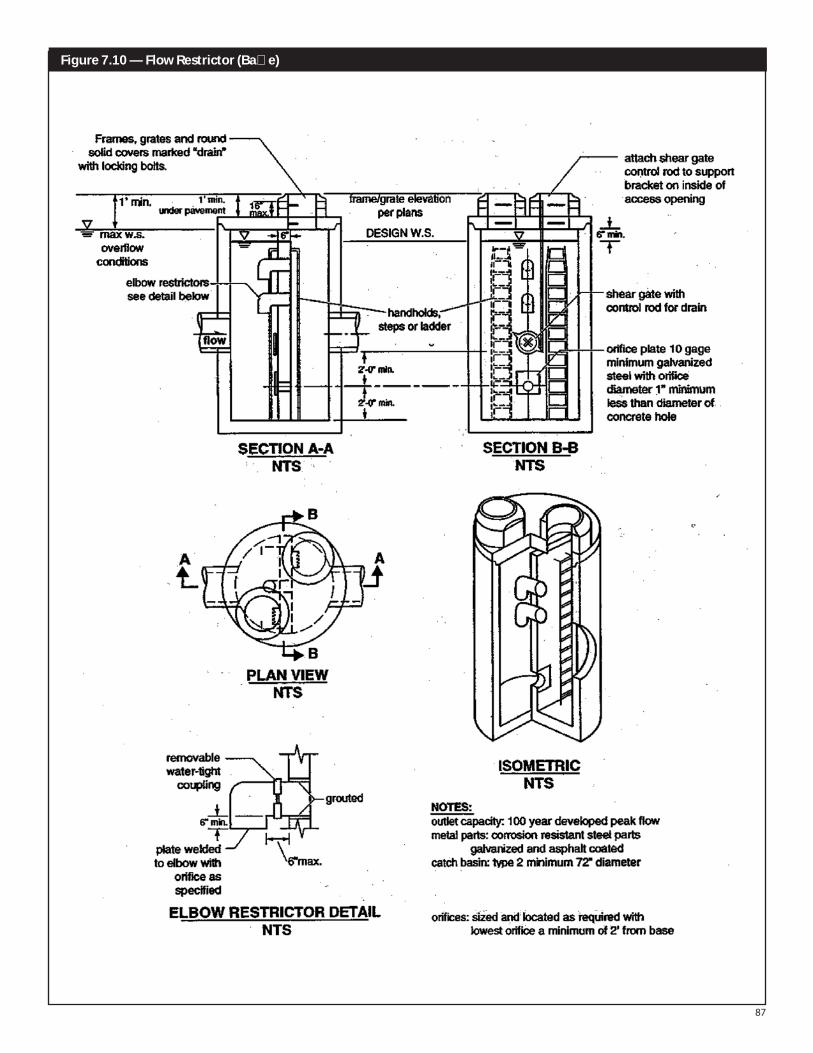
Figure 7.10 — Flow Restrictor (Baffle)
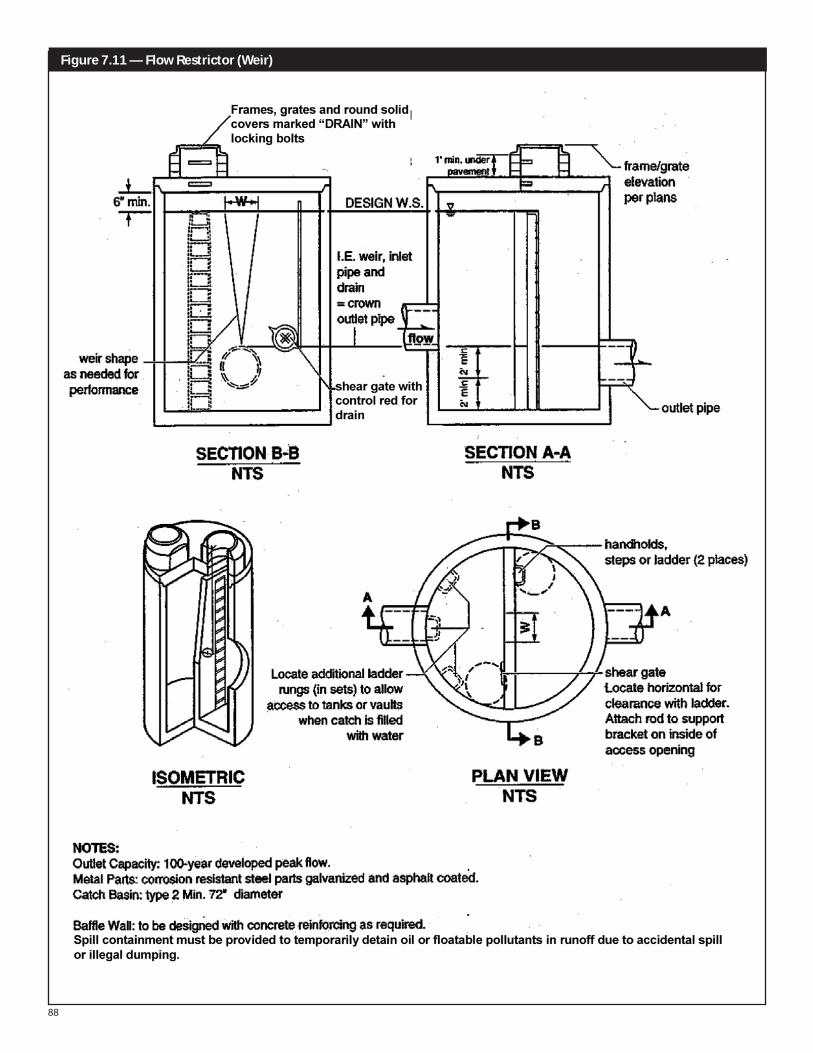
88
Figure 7.11 — Flow Restrictor (Weir)
89
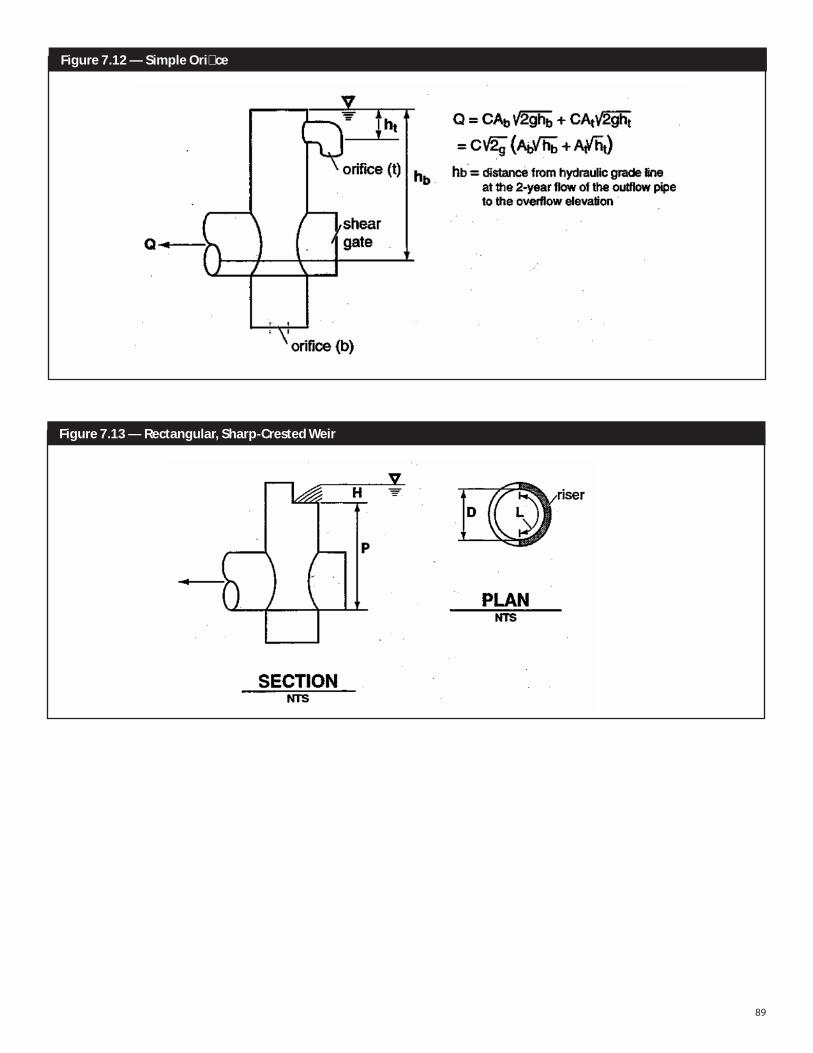
Figure 7.12 — Simple Orifice
Figure 7.13 — Rectangular, Sharp-Crested Weir
90
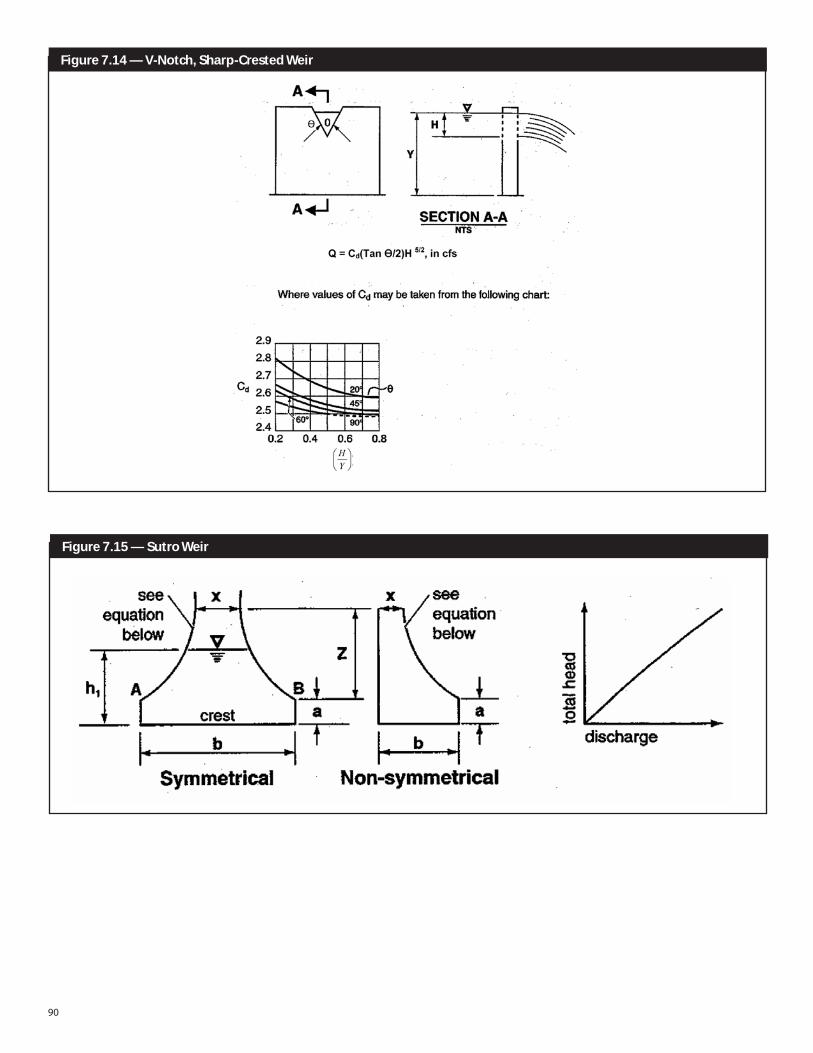
Figure 7.14 — V-Notch, Sharp-Crested Weir
Figure 7.15 — Sutro Weir
91
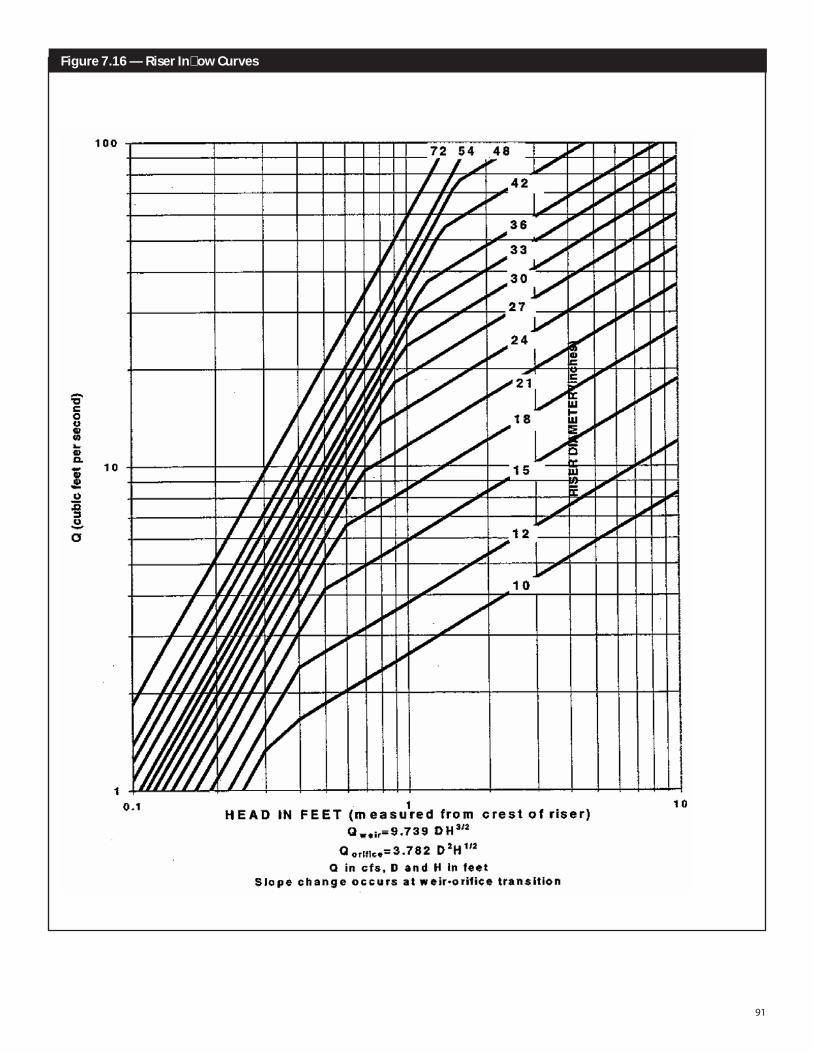
Figure 7.16 — Riser Inflow Curves
92
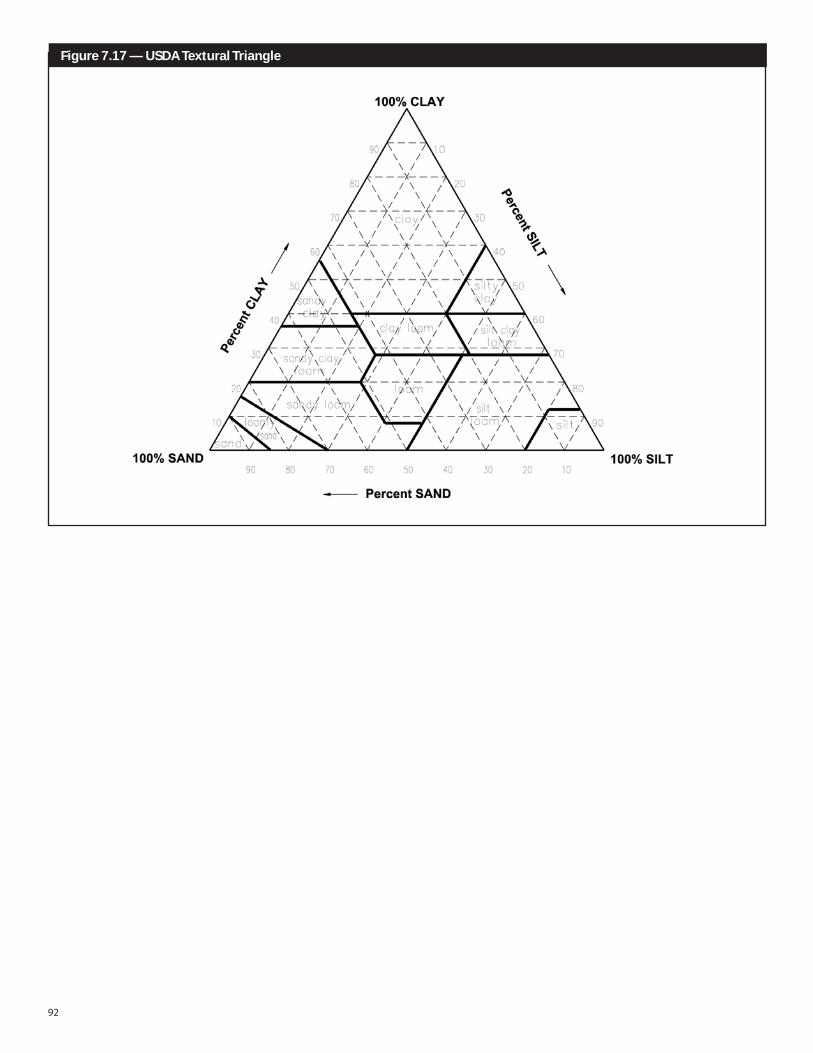
Figure 7.17 — USDA Textural Triangle
93
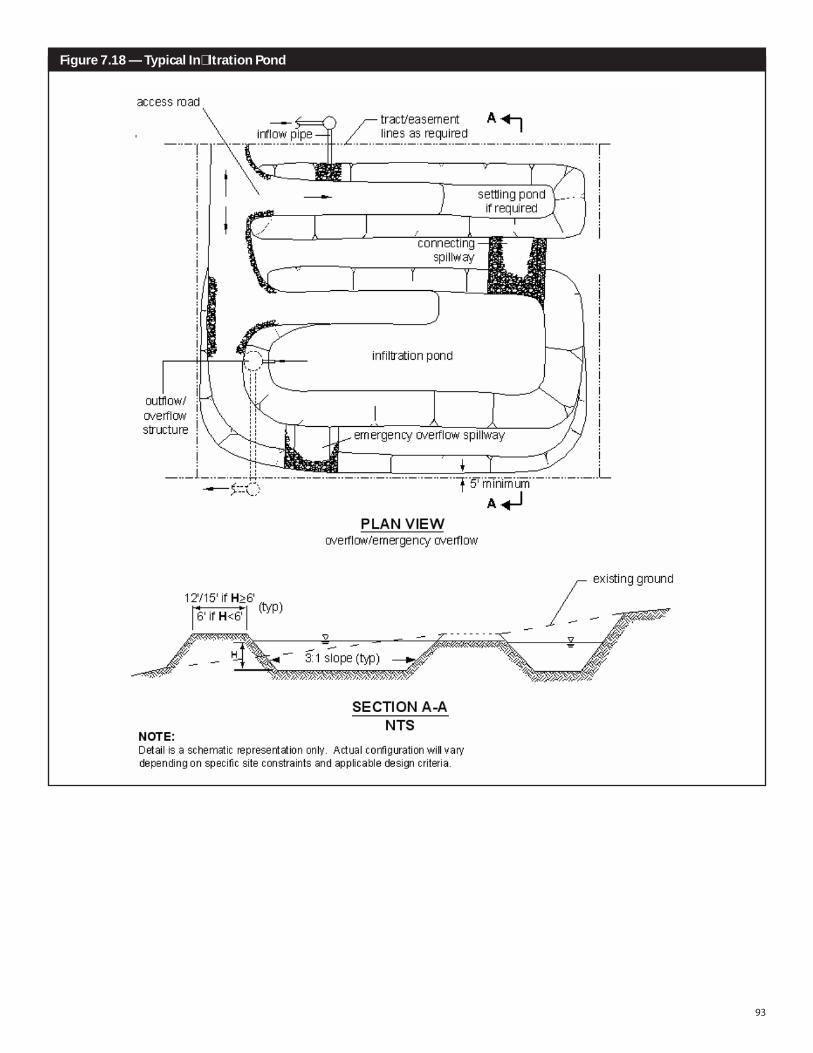
Figure 7.18 — Typical Infiltration Pond
94
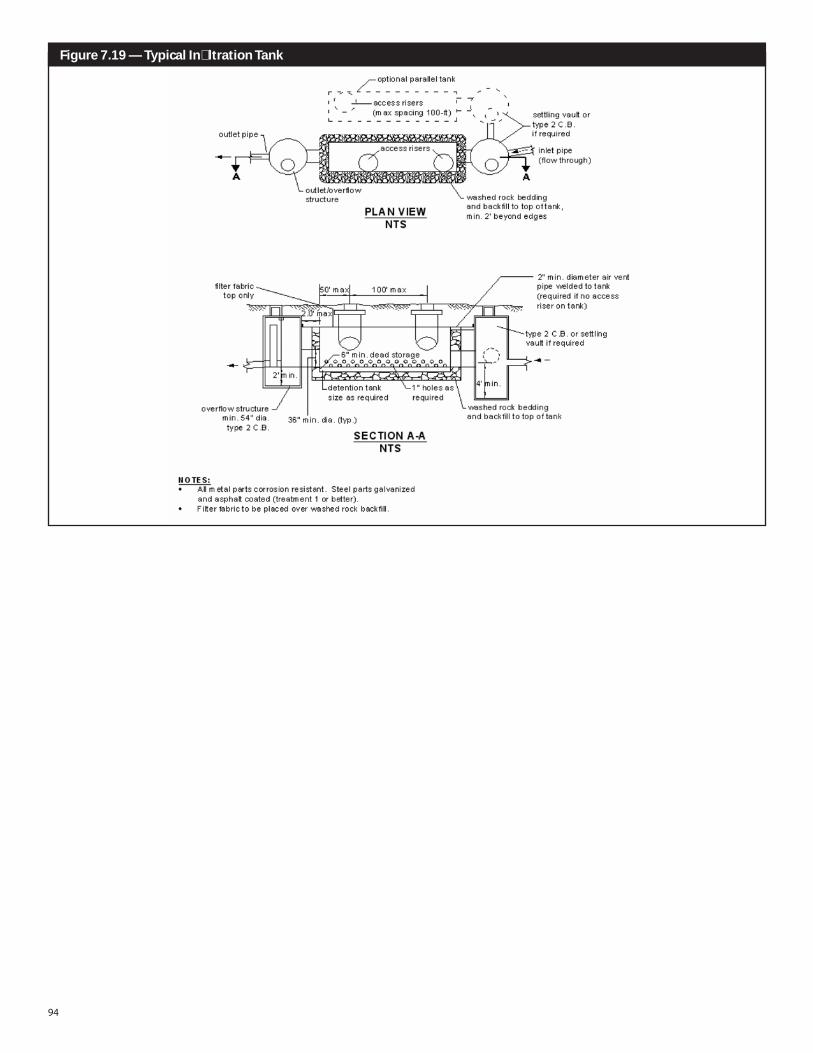
Figure 7.19 — Typical Infiltration Tank
95
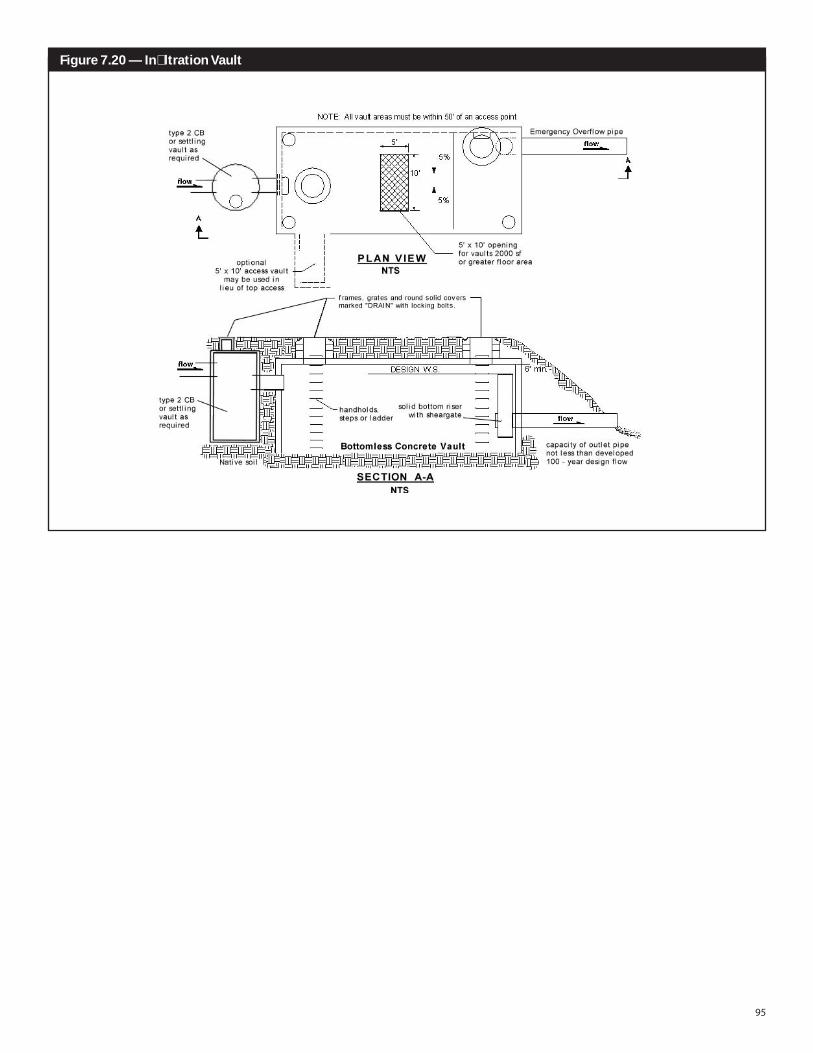
Figure 7.20 — Infiltration Vault
96
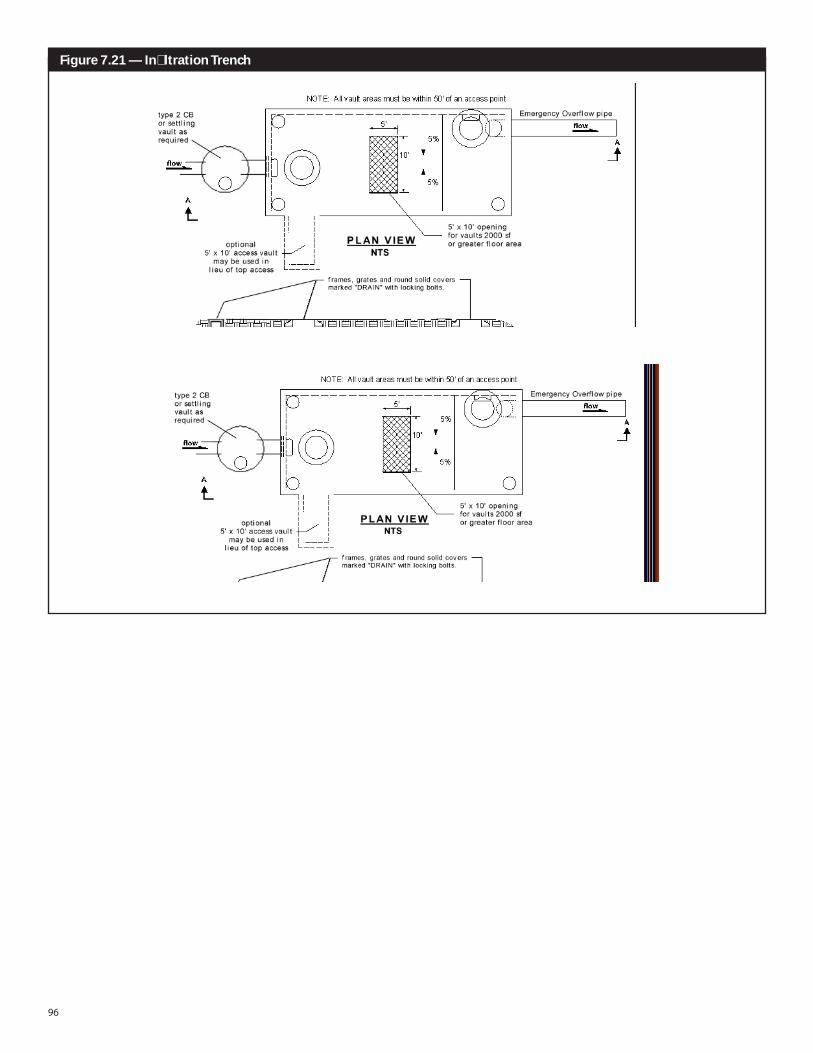
Figure 7.21 — Infiltration Trench
97
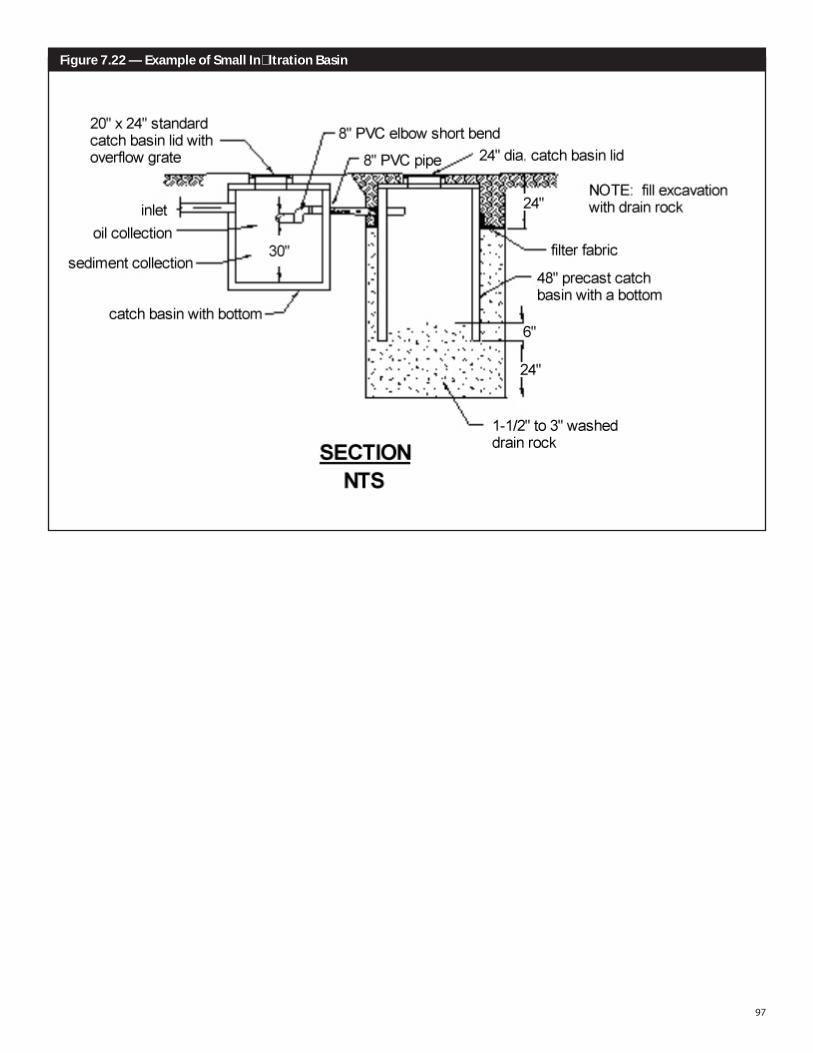
Figure 7.22 — Example of Small Infiltration Basin

98
THIS PAGE LEFT BLANK INTENTIONALLY

99
Kitsap CountyStormwater
DesignManual
APPENDIX 3B – TABLE

100
THIS PAGE LEFT BLANK INTENTIONALLY
101
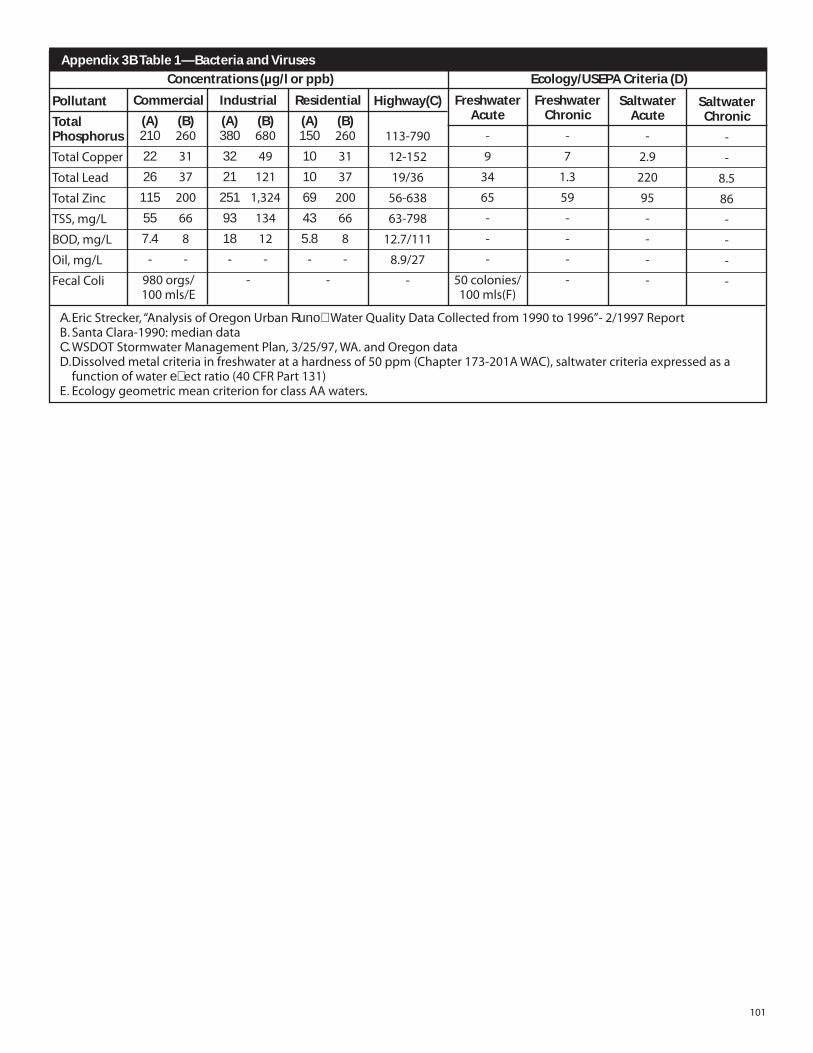
Appendix 3B Table 1—Bacteria and Viruses
Pollutant
Total Phosphorus
TotalCopper
TotalLead
TotalZinc
TSS,mg/L
BOD,mg/L
Oil,mg/L
FecalColi
Commercial
(A) (B) 210 260
22 31
26 37
115 200
55 66
7.4 8
- -
980orgs/100mls/E
Industrial
(A) (B) 380 680
32 49
21 121
251 1,324
93 134
18 12
- -
-
Residential
(A) (B) 150 260
10 31
10 37
69 200
43 66
5.8 8
- -
-
Highway(C)
113-790
12-152
19/36
56-638
63-798
12.7/111
8.9/27
-
FreshwaterAcute
-
9
34
65
-
-
-
50colonies/100mls(F)
FreshwaterChronic
-
7
1.3
59
-
-
-
-
SaltwaterAcute
-
2.9
220
95
-
-
-
-
SaltwaterChronic
-
-
8.5
86
-
-
-
-
Concentrations (µg/l or ppb) Ecology/USEPA Criteria (D)
A.EricStrecker,“AnalysisofOregonUrbanRunoffWaterQualityDataCollectedfrom1990to1996”-2/1997ReportB.SantaClara-1990:mediandataC.WSDOTStormwaterManagementPlan,3/25/97,WA.andOregondataD.Dissolvedmetalcriteriainfreshwateratahardnessof50ppm(Chapter173-201AWAC),saltwatercriteriaexpressedasafunctionofwatereffectratio(40CFRPart131)
E.EcologygeometricmeancriterionforclassAAwaters.

102
THIS PAGE LEFT BLANK INTENTIONALLY

103
Kitsap CountyStormwater
DesignManual
CHAPTER 4 – TABLES

104
THIS PAGE LEFT BLANK INTENTIONALLY
105
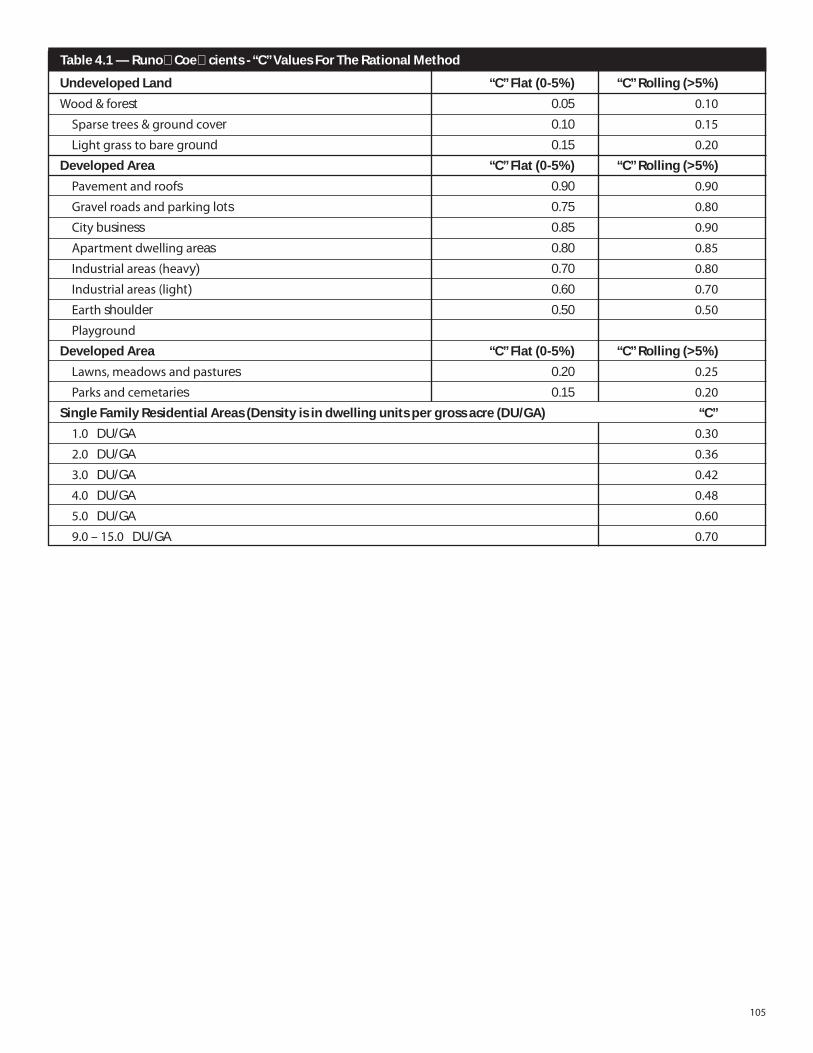
Table 4.1 — Runoff Coefficients - “C” Values For The Rational Method
Undeveloped Land “C” Flat (0-5%) “C” Rolling (>5%)
Wood&forest 0.05 0.10
Sparsetrees&groundcover 0.10 0.15
Lightgrasstobareground 0.15 0.20
Developed Area “C” Flat (0-5%) “C” Rolling (>5%)
Pavementandroofs 0.90 0.90
Gravelroadsandparkinglots 0.75 0.80
Citybusiness 0.85 0.90
Apartmentdwellingareas 0.80 0.85
Industrialareas(heavy) 0.70 0.80
Industrialareas(light) 0.60 0.70
Earthshoulder 0.50 0.50
Playground
Developed Area “C” Flat (0-5%) “C” Rolling (>5%)
Lawns,meadowsandpastures 0.20 0.25
Parksandcemetaries 0.15 0.20
Single Family Residential Areas (Density is in dwelling units per gross acre (DU/GA) “C”
1.0DU/GA 0.30
2.0DU/GA 0.36
3.0DU/GA 0.42
4.0DU/GA 0.48
5.0DU/GA 0.60
9.0–15.0DU/GA 0.70
106
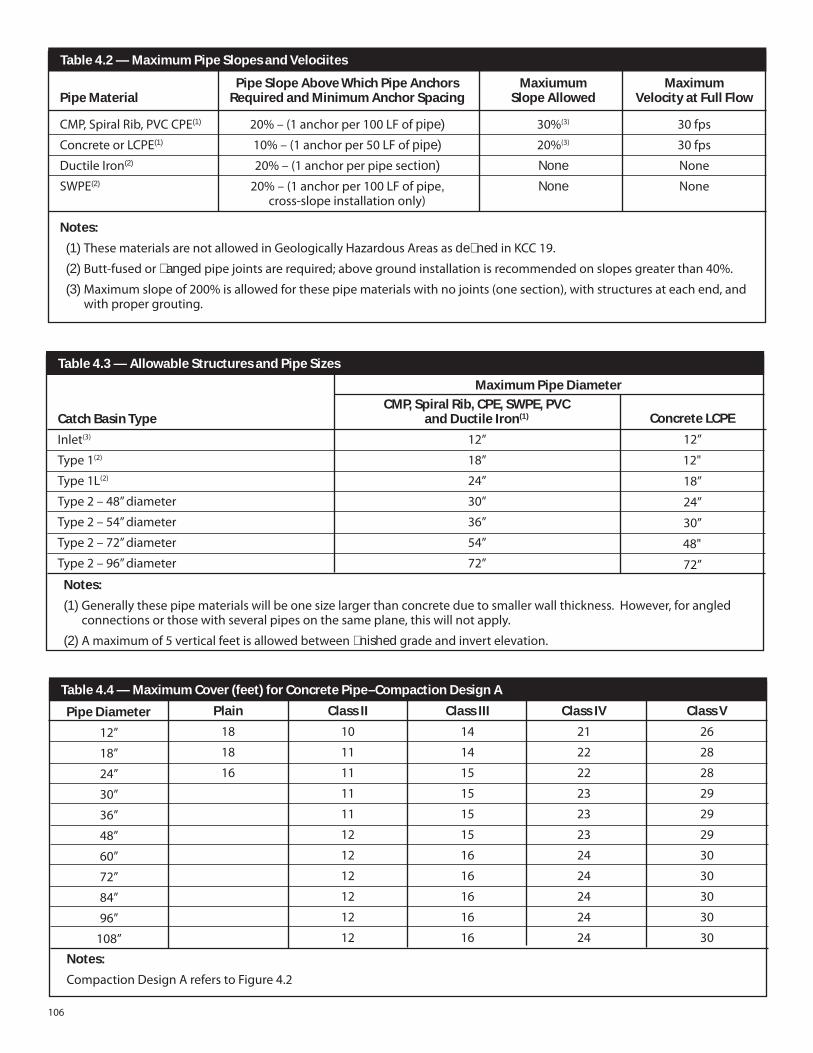
Table 4.2 — Maximum Pipe Slopes and Velociites
Pipe Slope Above Which Pipe Anchors Maxiumum MaximumPipe Material Required and Minimum Anchor Spacing Slope Allowed Velocity at Full Flow
CMP,SpiralRib,PVCCPE(1) 20%–(1anchorper100LFofpipe) 30%(3) 30fps
ConcreteorLCPE(1) 10%–(1anchorper50LFofpipe) 20%(3) 30fps
DuctileIron(2) 20%–(1anchorperpipesection) None None
SWPE(2) 20%–(1anchorper100LFofpipe, None None
cross-slopeinstallationonly)
Notes:
(1)ThesematerialsarenotallowedinGeologicallyHazardousAreasasdefinedinKCC19.
(2)Butt-fusedorflangedpipejointsarerequired;abovegroundinstallationisrecommendedonslopesgreaterthan40%.
(3)Maximumslopeof200%isallowedforthesepipematerialswithnojoints(onesection),withstructuresateachend,andwithpropergrouting.
Table 4.3 — Allowable Structures and Pipe Sizes
Catch Basin Type
Inlet(3)
Type1(2)
Type1L(2)
Type2–48”diameter
Type2–54”diameter
Type2–72”diameter
Type2–96”diameter
CMP, Spiral Rib, CPE, SWPE, PVCand Ductile Iron(1)
12”
18”
24”
30”
36”
54”
72”
Concrete LCPE
12”
12"
18”
24”
30”
48"
72”
Maximum Pipe Diameter
Notes:
(1)Generallythesepipematerialswillbeonesizelargerthanconcreteduetosmallerwallthickness.However,forangledconnectionsorthosewithseveralpipesonthesameplane,thiswillnotapply.
(2)Amaximumof5verticalfeetisallowedbetweenfinishedgradeandinvertelevation.
Table 4.4 — Maximum Cover (feet) for Concrete Pipe–Compaction Design A
Pipe Diameter
12”
18”
24”
30”
36”
48”
60”
72”
84”
96”
108”
Notes:
CompactionDesignAreferstoFigure4.2
Plain
18
18
16
Class II
10
11
11
11
11
12
12
12
12
12
12
Class III
14
14
15
15
15
15
16
16
16
16
16
Class IV
21
22
22
23
23
23
24
24
24
24
24
Class V
26
28
28
29
29
29
30
30
30
30
30
107
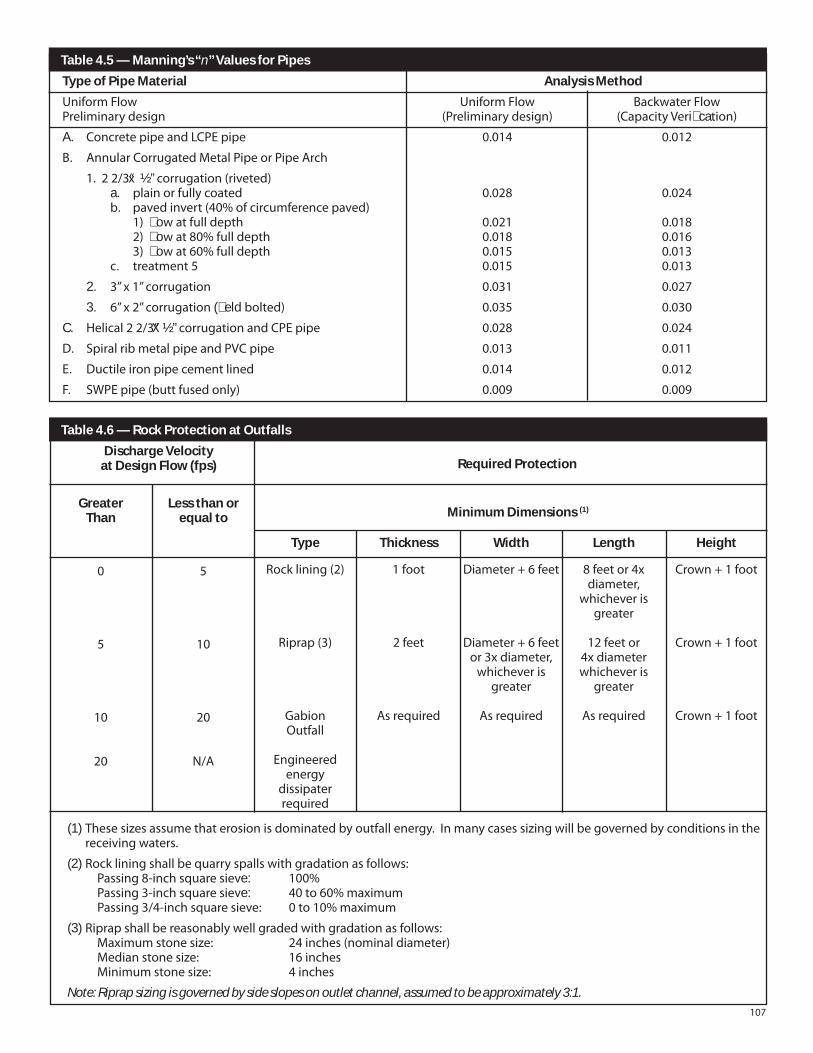
Table 4.5 — Manning’s “n” Values for Pipes
Type of Pipe Material
UniformFlowPreliminarydesign
A. ConcretepipeandLCPEpipe
B. AnnularCorrugatedMetalPipeorPipeArch
1.22/3“x1/2”corrugation(riveted) a. plainorfullycoated b. pavedinvert(40%ofcircumferencepaved) 1)flowatfulldepth 2)flowat80%fulldepth 3)flowat60%fulldepth c. treatment5
2. 3”x1”corrugation
3. 6”x2”corrugation(fieldbolted)
C. Helical22/3”X1/2”corrugationandCPEpipe
D. SpiralribmetalpipeandPVCpipe
E. Ductileironpipecementlined
F. SWPEpipe(buttfusedonly)
UniformFlow(Preliminarydesign)
0.014
0.028
0.0210.0180.0150.015
0.031
0.035
0.028
0.013
0.014
0.009
BackwaterFlow(CapacityVerification)
0.012
0.024
0.0180.0160.0130.013
0.027
0.030
0.024
0.011
0.012
0.009
Analysis Method
Table 4.6 — Rock Protection at Outfalls
Discharge Velocityat Design Flow (fps) Required Protection
GreaterThan
0
5
10
20
Less than or equal to
5
10
20
N/A
Type
Rocklining(2)
Riprap(3)
GabionOutfall
Engineeredenergy
dissipaterrequired
Thickness
1foot
2feet
Asrequired
Width
Diameter+6feet
Diameter+6feetor3xdiameter,whicheveris
greater
Asrequired
Length
8feetor4xdiameter,
whicheverisgreater
12feetor4xdiameterwhicheveris
greater
Asrequired
Height
Crown+1foot
Crown+1foot
Crown+1foot
Minimum Dimensions (1)
(1)Thesesizesassumethaterosionisdominatedbyoutfallenergy.Inmanycasessizingwillbegovernedbyconditionsinthereceivingwaters.
(2)Rockliningshallbequarryspallswithgradationasfollows: Passing8-inchsquaresieve: 100% Passing3-inchsquaresieve: 40to60%maximum Passing3/4-inchsquaresieve: 0to10%maximum
(3)Riprapshallbereasonablywellgradedwithgradationasfollows: Maximumstonesize: 24inches(nominaldiameter) Medianstonesize: 16inches Minimumstonesize: 4inches
Note: Riprap sizing is governed by side slopes on outlet channel, assumed to be approximately 3:1.
108
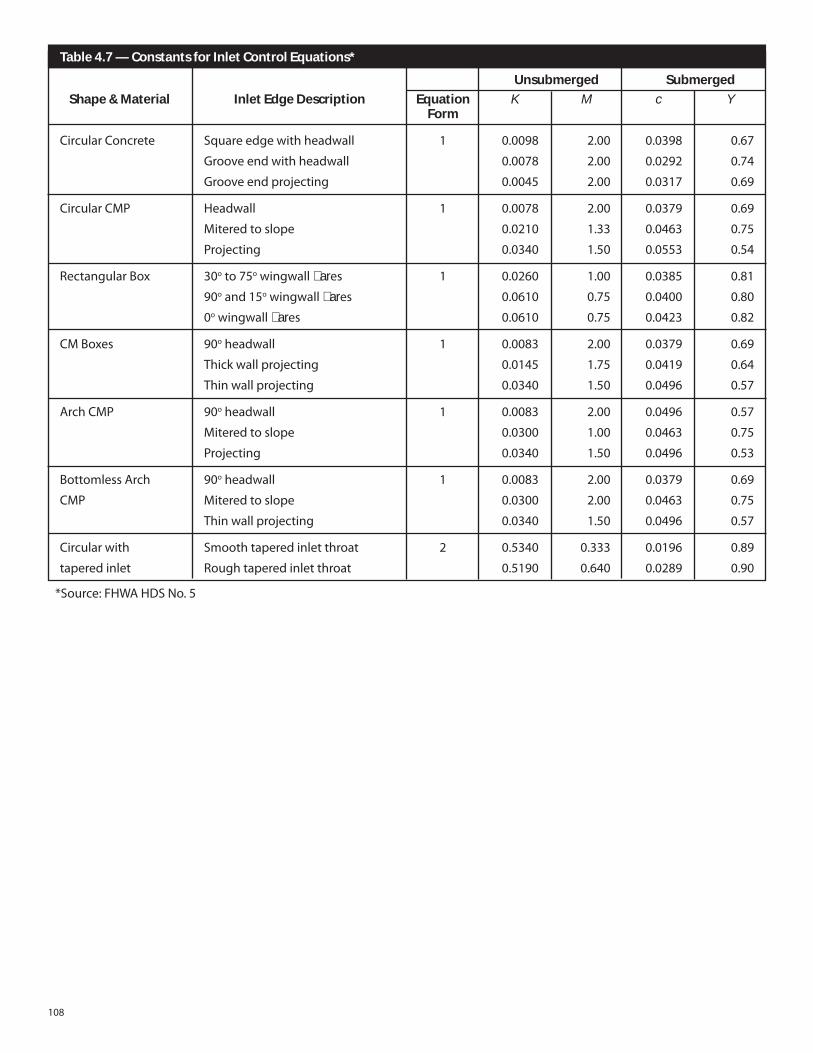
Table 4.7 — Constants for Inlet Control Equations*
SubmergedShape & Material
CircularConcrete
CircularCMP
RectangularBox
CMBoxes
ArchCMP
BottomlessArch
CMP
Circularwith
taperedinlet
UnsubmergedInlet Edge Description
Squareedgewithheadwall
Grooveendwithheadwall
Grooveendprojecting
Headwall
Miteredtoslope
Projecting
30oto75owingwallflares
90oand15owingwallflares
0owingwallflares
90oheadwall
Thickwallprojecting
Thinwallprojecting
90oheadwall
Miteredtoslope
Projecting
90oheadwall
Miteredtoslope
Thinwallprojecting
Smoothtaperedinletthroat
Roughtaperedinletthroat
EquationForm
1
1
1
1
1
1
2
K
0.0098
0.0078
0.0045
0.0078
0.0210
0.0340
0.0260
0.0610
0.0610
0.0083
0.0145
0.0340
0.0083
0.0300
0.0340
0.0083
0.0300
0.0340
0.5340
0.5190
M
2.00
2.00
2.00
2.00
1.33
1.50
1.00
0.75
0.75
2.00
1.75
1.50
2.00
1.00
1.50
2.00
2.00
1.50
0.333
0.640
c
0.0398
0.0292
0.0317
0.0379
0.0463
0.0553
0.0385
0.0400
0.0423
0.0379
0.0419
0.0496
0.0496
0.0463
0.0496
0.0379
0.0463
0.0496
0.0196
0.0289
Y
0.67
0.74
0.69
0.69
0.75
0.54
0.81
0.80
0.82
0.69
0.64
0.57
0.57
0.75
0.53
0.69
0.75
0.57
0.89
0.90
*Source:FHWAHDSNo.5
109
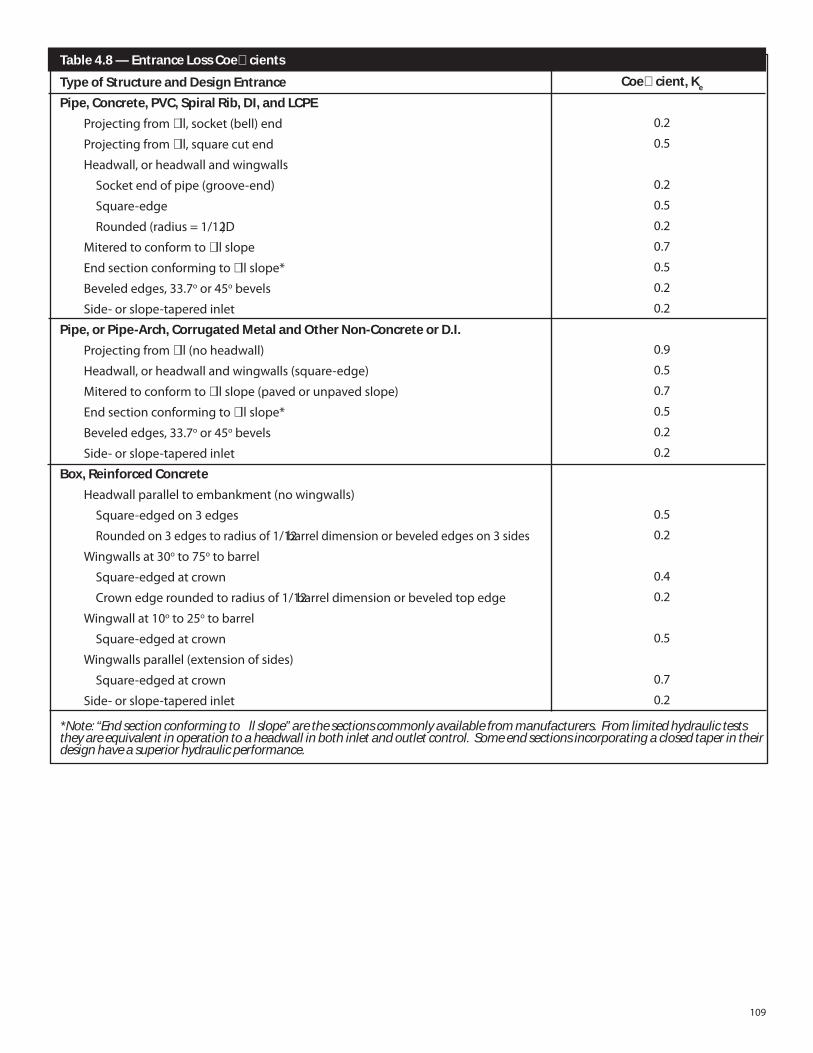
Table 4.8 — Entrance Loss Coefficients
Type of Structure and Design Entrance
Pipe, Concrete, PVC, Spiral Rib, DI, and LCPE
Projectingfromfill,socket(bell)end
Projectingfromfill,squarecutend
Headwall,orheadwallandwingwalls
Socketendofpipe(groove-end)
Square-edge
Rounded(radius=1/12D)
Miteredtoconformtofillslope
Endsectionconformingtofillslope*
Bevelededges,33.7oor45obevels
Side-orslope-taperedinlet
Pipe, or Pipe-Arch, Corrugated Metal and Other Non-Concrete or D.I.
Projectingfromfill(noheadwall)
Headwall,orheadwallandwingwalls(square-edge)
Miteredtoconformtofillslope(pavedorunpavedslope)
Endsectionconformingtofillslope*
Bevelededges,33.7oor45obevels
Side-orslope-taperedinlet
Box, Reinforced Concrete
Headwallparalleltoembankment(nowingwalls)
Square-edgedon3edges
Roundedon3edgestoradiusof1/12barreldimensionorbevelededgeson3sides
Wingwallsat30oto75otobarrel
Square-edgedatcrown
Crownedgeroundedtoradiusof1/12barreldimensionorbeveledtopedge
Wingwallat10oto25otobarrel
Square-edgedatcrown
Wingwallsparallel(extensionofsides)
Square-edgedatcrown
Side-orslope-taperedinlet
Coefficient, Ke
0.2
0.5
0.2
0.5
0.2
0.7
0.5
0.2
0.2
0.9
0.5
0.7
0.5
0.2
0.2
0.5
0.2
0.4
0.2
0.5
0.7
0.2
*Note: “End section conforming to fill slope” are the sections commonly available from manufacturers. From limited hydraulic tests they are equivalent in operation to a headwall in both inlet and outlet control. Some end sections incorporating a closed taper in their design have a superior hydraulic performance.
110
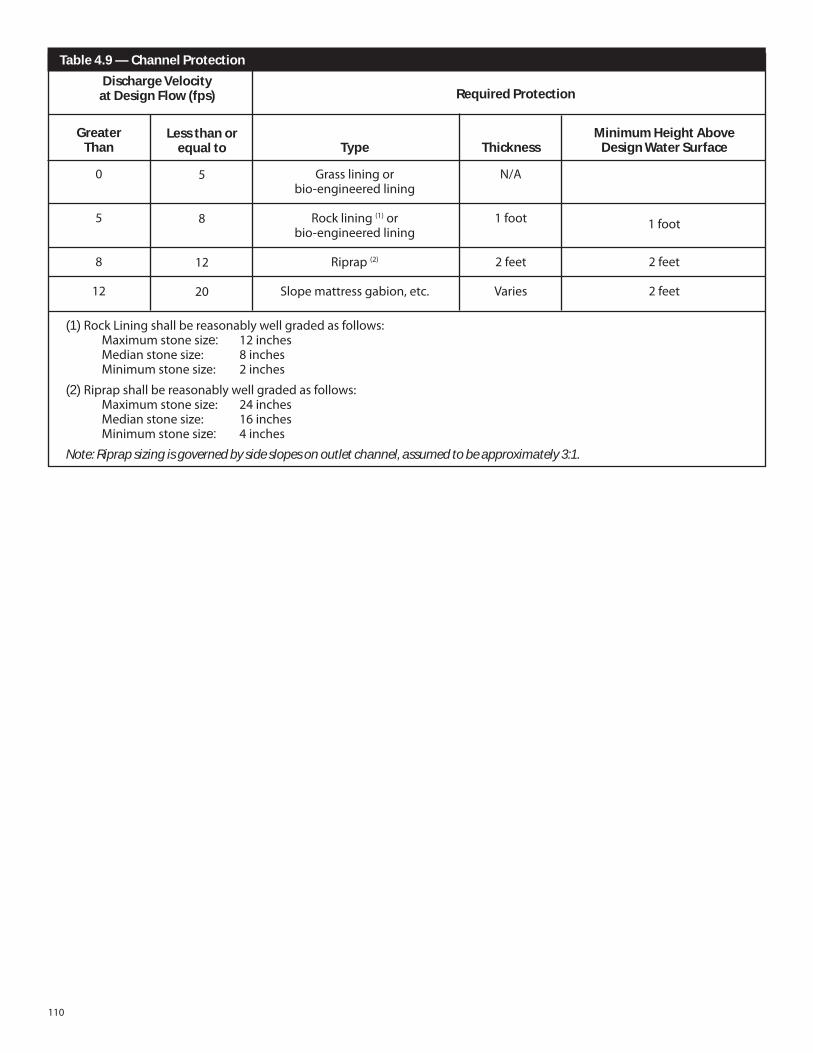
Table 4.9 — Channel Protection
Discharge Velocityat Design Flow (fps) Required Protection
GreaterThan
0
5
8
12
Less than or equal to
5
8
12
20
Type
Grassliningorbio-engineeredlining
Rocklining(1)orbio-engineeredlining
Riprap(2)
Slopemattressgabion,etc.
(1)RockLiningshallbereasonablywellgradedasfollows:Maximumstonesize: 12inchesMedianstonesize: 8inchesMinimumstonesize: 2inches
(2)Riprapshallbereasonablywellgradedasfollows:Maximumstonesize: 24inchesMedianstonesize: 16inchesMinimumstonesize: 4inches
Note: Riprap sizing is governed by side slopes on outlet channel, assumed to be approximately 3:1.
Minimum Height AboveDesign Water Surface
1foot
2feet
2feet
Thickness
N/A
1foot
2feet
Varies
111
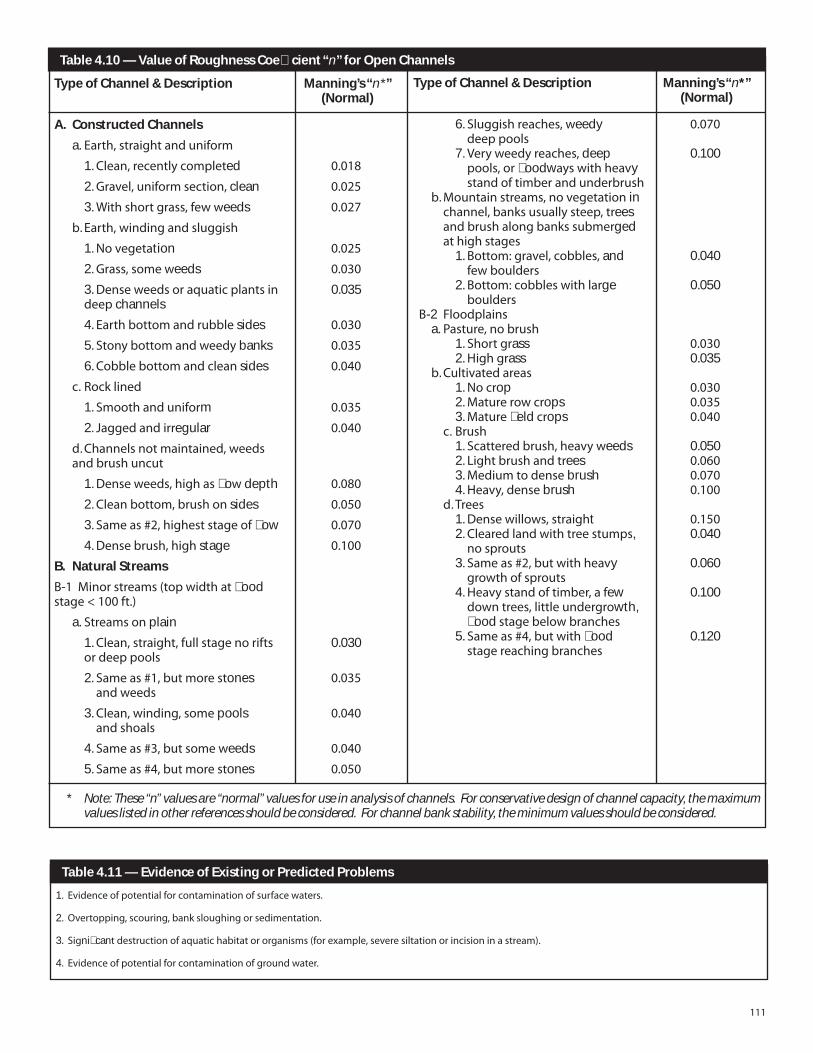
Table 4.10 — Value of Roughness Coefficient “n” for Open Channels
Type of Channel & Description Manning’s “n*” (Normal)
A. Constructed Channels
a.Earth,straightanduniform
1.Clean,recentlycompleted 0.018
2.Gravel,uniformsection,clean 0.025
3.Withshortgrass,fewweeds 0.027
b.Earth,windingandsluggish
1.Novegetation 0.025
2.Grass,someweeds 0.030
3.Denseweedsoraquaticplantsin 0.035 deepchannels
4.Earthbottomandrubblesides 0.030
5.Stonybottomandweedybanks 0.035
6.Cobblebottomandcleansides 0.040
c.Rocklined
1.Smoothanduniform 0.035
2.Jaggedandirregular 0.040
d.Channelsnotmaintained,weeds andbrushuncut
1.Denseweeds,highasflowdepth 0.080
2.Cleanbottom,brushonsides 0.050
3.Sameas#2,higheststageofflow 0.070
4.Densebrush,highstage 0.100
B. Natural Streams
B-1Minorstreams(topwidthatflood stage<100ft.)
a.Streamsonplain
1.Clean,straight,fullstagenorifts 0.030 ordeeppools
2.Sameas#1,butmorestones 0.035 andweeds
3.Clean,winding,somepools 0.040 andshoals
4.Sameas#3,butsomeweeds 0.040
5.Sameas#4,butmorestones 0.050
Type of Channel & Description Manning’s “n*” (Normal)
6.Sluggishreaches,weedy 0.070 deeppools 7.Veryweedyreaches,deep 0.100 pools,orfloodwayswithheavy standoftimberandunderbrush b.Mountainstreams,novegetationin channel,banksusuallysteep,trees andbrushalongbankssubmerged athighstages 1.Bottom:gravel,cobbles,and 0.040 fewboulders 2.Bottom:cobbleswithlarge 0.050 bouldersB-2 Floodplains a.Pasture,nobrush 1.Shortgrass 0.030 2.Highgrass 0.035 b.Cultivatedareas 1.Nocrop 0.030 2.Maturerowcrops 0.035 3.Maturefieldcrops 0.040 c.Brush 1.Scatteredbrush,heavyweeds 0.050 2.Lightbrushandtrees 0.060 3.Mediumtodensebrush 0.070 4.Heavy,densebrush 0.100 d.Trees 1.Densewillows,straight 0.150 2.Clearedlandwithtreestumps, 0.040 nosprouts 3.Sameas#2,butwithheavy 0.060 growthofsprouts 4.Heavystandoftimber,afew 0.100 downtrees,littleundergrowth, floodstagebelowbranches 5.Sameas#4,butwithflood 0.120 stagereachingbranches
* Note: These “n” values are “normal” values for use in analysis of channels. For conservative design of channel capacity, the maximum values listed in other references should be considered. For channel bank stability, the minimum values should be considered.
Table 4.11 — Evidence of Existing or Predicted Problems
1. Evidenceofpotentialforcontaminationofsurfacewaters.
2.Overtopping,scouring,banksloughingorsedimentation.
3. Significantdestructionofaquatichabitatororganisms(forexample,severesiltationorincisioninastream).
4. Evidenceofpotentialforcontaminationofgroundwater.

112
THIS PAGE LEFT BLANK INTENTIONALLY

113
Kitsap CountyStormwater
DesignManual
CHAPTER 5 –TABLE

114
THIS PAGE LEFT BLANK INTENTIONALLY
115
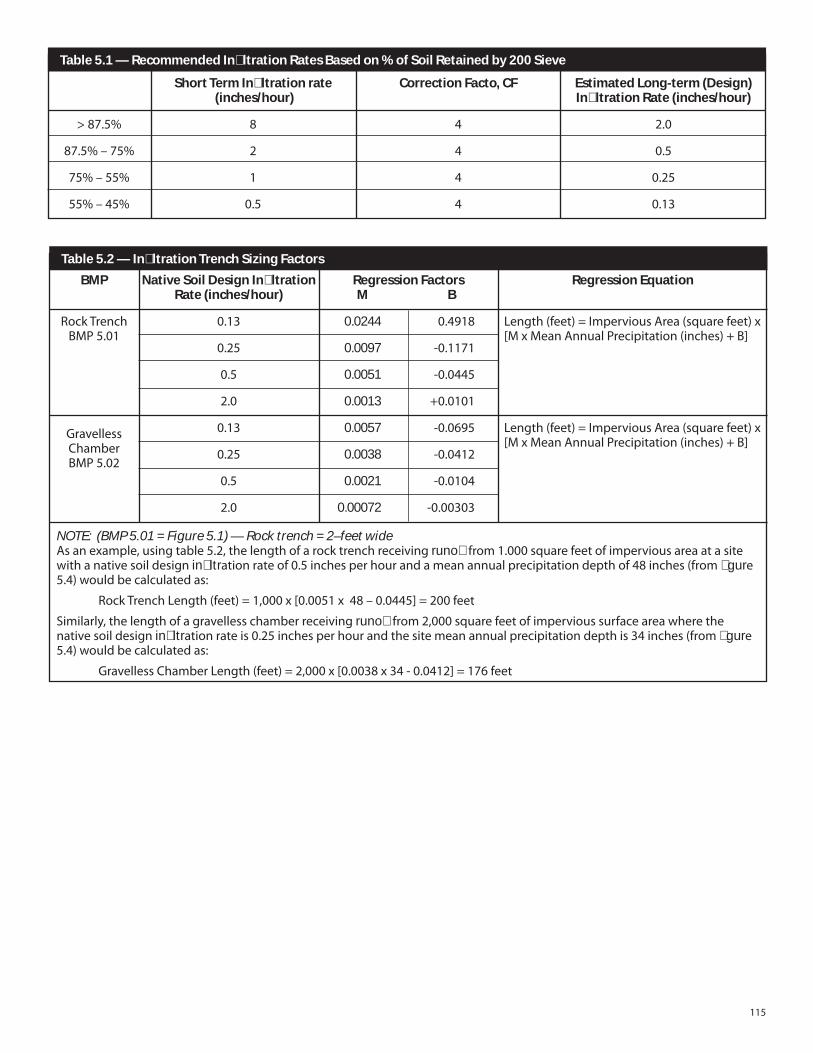
Table 5.1 — Recommended Infiltration Rates Based on % of Soil Retained by 200 Sieve
Short Term Infiltration rate (inches/hour)
8
2
1
0.5
Correction Facto, CF
4
4
4
4
Estimated Long-term (Design) Infiltration Rate (inches/hour)
2.0
0.5
0.25
0.13
>87.5%
87.5%–75%
75%–55%
55%–45%
Regression Equation
Length(feet)=ImperviousArea(squarefeet)x[MxMeanAnnualPrecipitation(inches)+B]
Length(feet)=ImperviousArea(squarefeet)x[MxMeanAnnualPrecipitation(inches)+B]
Table 5.2 — Infiltration Trench Sizing Factors
Native Soil Design Infiltration Rate (inches/hour)
0.13
0.25
0.5
2.0
0.13
0.25
0.5
2.0
Regression Factors M B
0.0244 0.4918
0.0097 -0.1171
0.0051 -0.0445
0.0013 +0.0101
0.0057 -0.0695
0.0038 -0.0412
0.0021 -0.0104
0.00072 -0.00303
BMP
RockTrenchBMP5.01
GravellessChamberBMP5.02
NOTE: (BMP 5.01 = Figure 5.1) — Rock trench = 2–feet wideAsanexample,usingtable5.2,thelengthofarocktrenchreceivingrunofffrom1.000squarefeetofimperviousareaatasitewithanativesoildesigninfiltrationrateof0.5inchesperhourandameanannualprecipitationdepthof48inches(fromfigure5.4)wouldbecalculatedas:
RockTrenchLength(feet)=1,000x[0.0051x48–0.0445]=200feet
Similarly,thelengthofagravellesschamberreceivingrunofffrom2,000squarefeetofimpervioussurfaceareawherethenativesoildesigninfiltrationrateis0.25inchesperhourandthesitemeanannualprecipitationdepthis34inches(fromfigure5.4)wouldbecalculatedas:
GravellessChamberLength(feet)=2,000x[0.0038x34-0.0412]=176feet
116
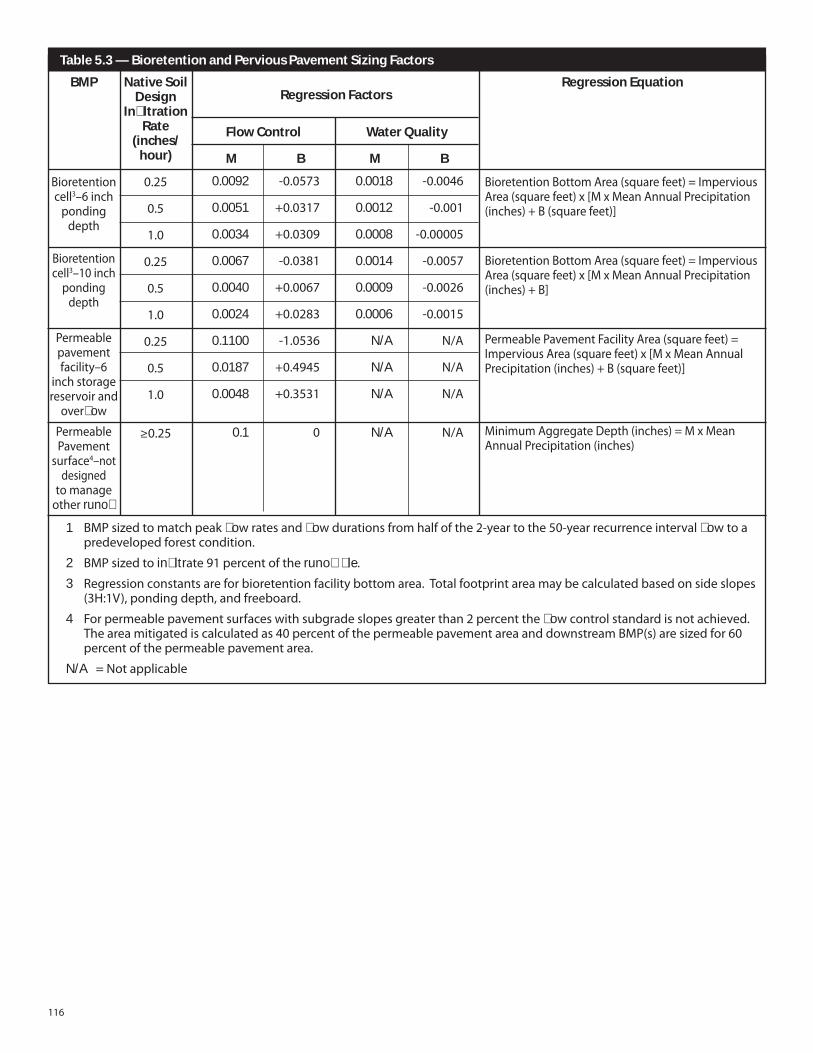
Table 5.3 — Bioretention and Pervious Pavement Sizing Factors
Native Soil Design
Infiltration Rate
(inches/hour)
0.25
0.5
1.0
0.25
0.5
1.0
0.25
0.5
1.0
≥0.25
Flow Control
M B
0.0092 -0.0573
0.0051 +0.0317
0.0034 +0.0309
0.0067 -0.0381
0.0040 +0.0067
0.0024 +0.0283
0.1100 -1.0536
0.0187 +0.4945
0.0048 +0.3531
0.1 0
BMP
Bioretentioncell3–6inchpondingdepth
Bioretentioncell3–10inchpondingdepth
Permeablepavementfacility–6
inchstoragereservoirandoverflow
PermeablePavementsurface4–notdesignedtomanageotherrunoff
Water Quality
M B
0.0018 -0.0046
0.0012 -0.001
0.0008 -0.00005
0.0014 -0.0057
0.0009 -0.0026
0.0006 -0.0015
N/A N/A
N/A N/A
N/A N/A
N/A N/A
Regression Equation
BioretentionBottomArea(squarefeet)=ImperviousArea(squarefeet)x[MxMeanAnnualPrecipitation(inches)+B(squarefeet)]
BioretentionBottomArea(squarefeet)=ImperviousArea(squarefeet)x[MxMeanAnnualPrecipitation(inches)+B]
PermeablePavementFacilityArea(squarefeet)=ImperviousArea(squarefeet)x[MxMeanAnnualPrecipitation(inches)+B(squarefeet)]
MinimumAggregateDepth(inches)=MxMeanAnnualPrecipitation(inches)
1 BMPsizedtomatchpeakflowratesandflowdurationsfromhalfofthe2-yeartothe50-yearrecurrenceintervalflowtoapredevelopedforestcondition.
2 BMPsizedtoinfiltrate91percentoftherunofffile.
3 Regressionconstantsareforbioretentionfacilitybottomarea.Totalfootprintareamaybecalculatedbasedonsideslopes(3H:1V),pondingdepth,andfreeboard.
4 Forpermeablepavementsurfaceswithsubgradeslopesgreaterthan2percenttheflowcontrolstandardisnotachieved.Theareamitigatediscalculatedas40percentofthepermeablepavementareaanddownstreamBMP(s)aresizedfor60percentofthepermeablepavementarea.
N/A =Notapplicable
Regression Factors

117
THIS PAGE LEFT BLANK INTENTIONALLY

118
Kitsap CountyStormwater
DesignManual
CHAPTER 6 –TABLES

119
THIS PAGE LEFT BLANK INTENTIONALLY
120
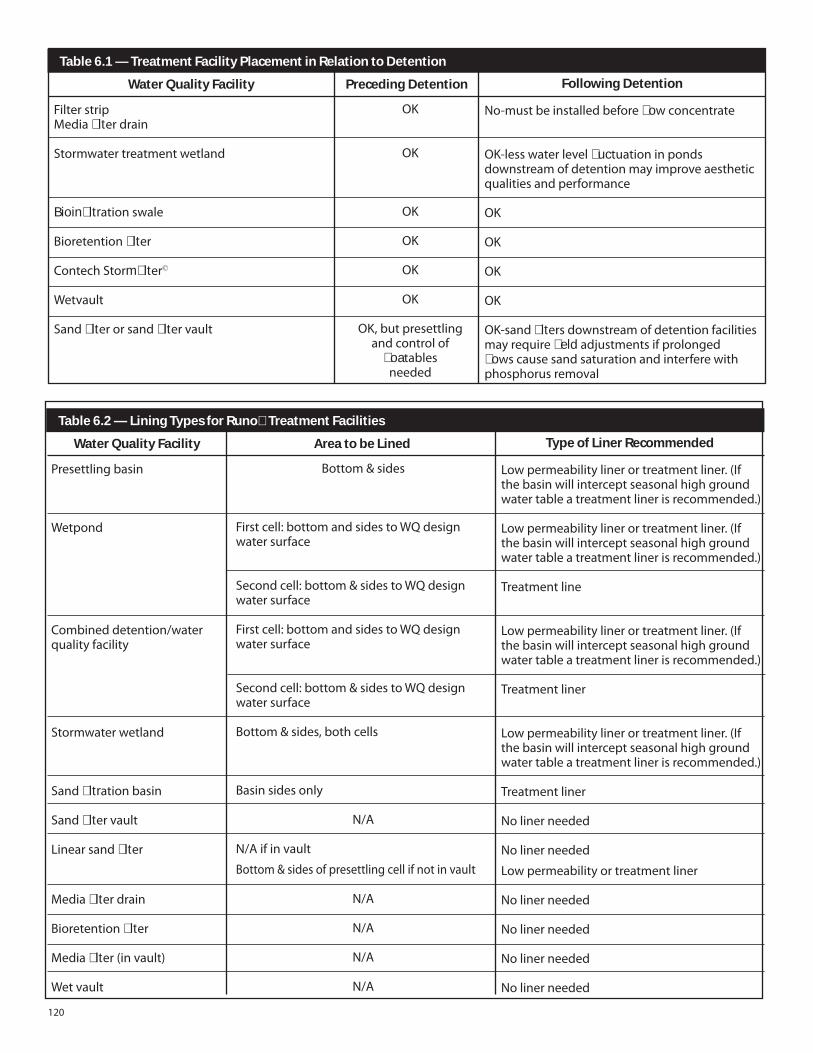
Bottom&sides
Firstcell:bottomandsidestoWQdesignwatersurface
Secondcell:bottom&sidestoWQdesignwatersurface
Firstcell:bottomandsidestoWQdesignwatersurface
Secondcell:bottom&sidestoWQdesignwatersurface
Bottom&sides,bothcells
Basinsidesonly
N/A
N/Aifinvault
Bottom&sidesofpresettlingcellifnotinvault
N/A
N/A
N/A
N/A
FilterstripMediafilterdrain
Stormwatertreatmentwetland
Bioinfiltrationswale
Bioretentionfilter
ContechStormfilter©
Wetvault
Sandfilterorsandfiltervault
OK
OK
OK
OK
OK
OK
OK,butpresettlingandcontrolof
floatablesneeded
No-mustbeinstalledbeforeflowconcentrate
OK-lesswaterlevelfluctuationinpondsdownstreamofdetentionmayimproveaestheticqualitiesandperformance
OK
OK
OK
OK
OK-sandfiltersdownstreamofdetentionfacilitiesmayrequirefieldadjustmentsifprolongedflowscausesandsaturationandinterferewithphosphorusremoval
Table 6.1 — Treatment Facility Placement in Relation to Detention
Water Quality Facility Preceding Detention Following Detention
Presettlingbasin
Wetpond
Combineddetention/waterqualityfacility
Stormwaterwetland
Sandfiltrationbasin
Sandfiltervault
Linearsandfilter
Mediafilterdrain
Bioretentionfilter
Mediafilter(invault)
Wetvault
Table 6.2 — Lining Types for Runoff Treatment Facilities
Water Quality Facility Area to be Lined Type of Liner Recommended
Lowpermeabilitylinerortreatmentliner.(Ifthebasinwillinterceptseasonalhighgroundwatertableatreatmentlinerisrecommended.)
Lowpermeabilitylinerortreatmentliner.(Ifthebasinwillinterceptseasonalhighgroundwatertableatreatmentlinerisrecommended.)
Treatmentline
Lowpermeabilitylinerortreatmentliner.(Ifthebasinwillinterceptseasonalhighgroundwatertableatreatmentlinerisrecommended.)
Treatmentliner
Lowpermeabilitylinerortreatmentliner.(Ifthebasinwillinterceptseasonalhighgroundwatertableatreatmentlinerisrecommended.)
Treatmentliner
Nolinerneeded
Nolinerneeded
Lowpermeabilityortreatmentliner
Nolinerneeded
Nolinerneeded
Nolinerneeded
Nolinerneeded
121
6-inch
4-inch
#4
#200
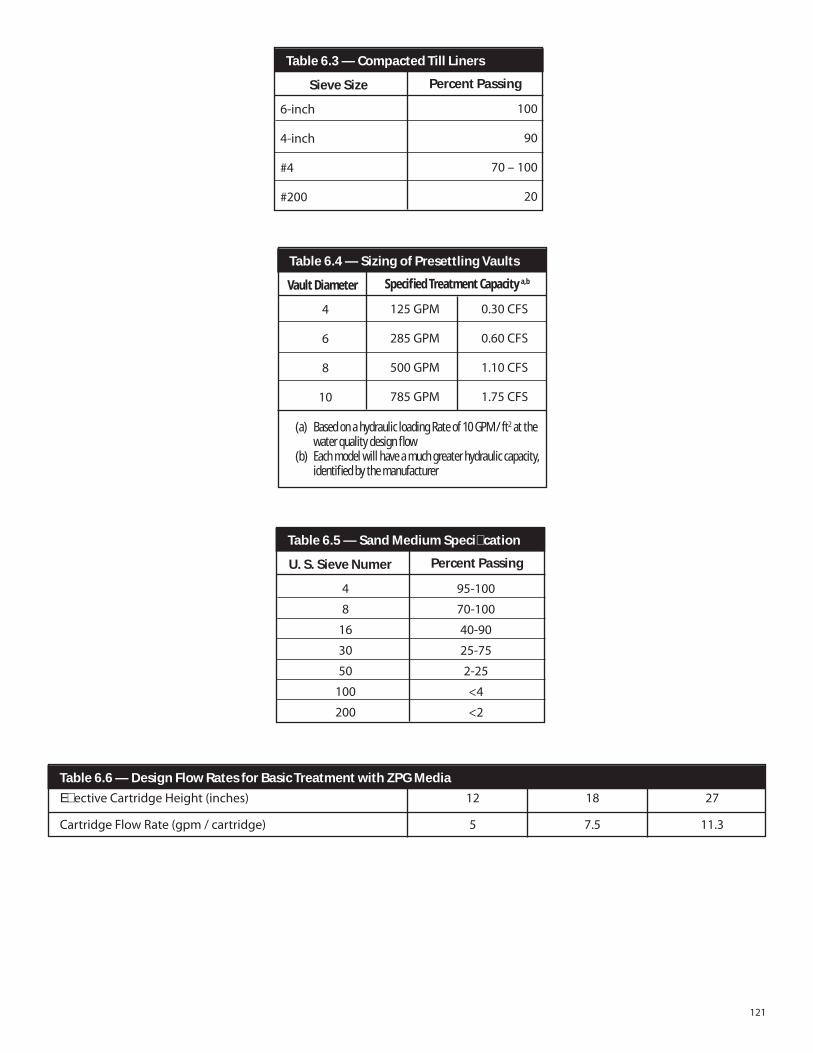
Table 6.3 — Compacted Till Liners
Sieve Size Percent Passing
100
90
70–100
20
4
6
8
10
Table 6.4 — Sizing of Presettling Vaults
Vault Diameter Specified Treatment Capacity a,b
125GPM
285GPM
500GPM
785GPM
0.30CFS
0.60CFS
1.10CFS
1.75CFS
(a) BasedonahydraulicloadingRateof10GPM/ft2atthewaterqualitydesignflow
(b) Eachmodelwillhaveamuchgreaterhydrauliccapacity,identifiedbythemanufacturer
4
8
16
30
50
100
200
Table 6.5 — Sand Medium Specification
U. S. Sieve Numer Percent Passing
95-100
70-100
40-90
25-75
2-25
<4
<2
Table 6.6 — Design Flow Rates for Basic Treatment with ZPG MediaEffectiveCartridgeHeight(inches)
CartridgeFlowRate(gpm/cartridge)
12
5
18
7.5
27
11.3
122
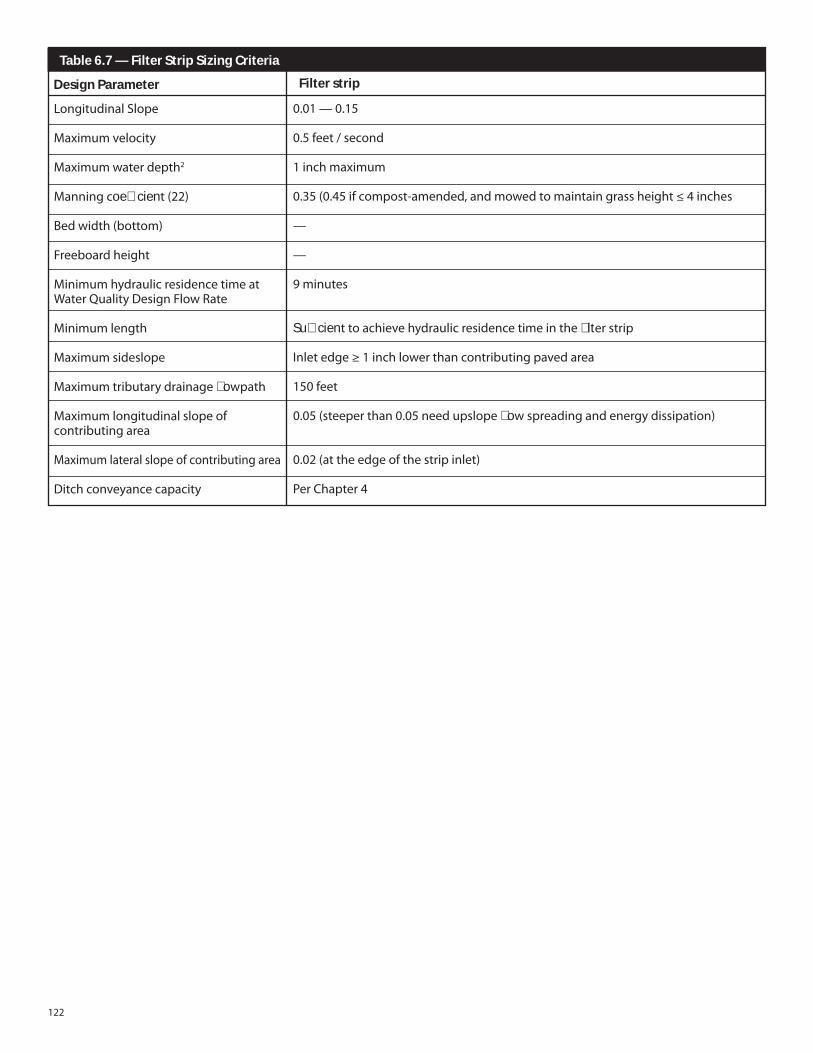
0.01—0.15
0.5feet/second
1inchmaximum
0.35(0.45ifcompost-amended,andmowedtomaintaingrassheight≤4inches
—
—
9minutes
Sufficienttoachievehydraulicresidencetimeinthefilterstrip
Inletedge≥1inchlowerthancontributingpavedarea
150feet
0.05(steeperthan0.05needupslopeflowspreadingandenergydissipation)
0.02(attheedgeofthestripinlet)
PerChapter4
LongitudinalSlope
Maximumvelocity
Maximumwaterdepth2
Manningcoefficient(22)
Bedwidth(bottom)
Freeboardheight
MinimumhydraulicresidencetimeatWaterQualityDesignFlowRate
Minimumlength
Maximumsideslope
Maximumtributarydrainageflowpath
Maximumlongitudinalslopeofcontributingarea
Maximumlateralslopeofcontributingarea
Ditchconveyancecapacity
Table 6.7 — Filter Strip Sizing Criteria
Design Parameter Filter strip
123
Agrostis exarata (1)
Carex stipata
Eleocharis palustris
Glyceria occidentalis
Juncus effusus
Juncus tenuis
Oenanthe sarmentosa
Scirpus atrocinctus(formerly S. cyperinus)
Scirpus microcarpus
Sagittaria latifolia
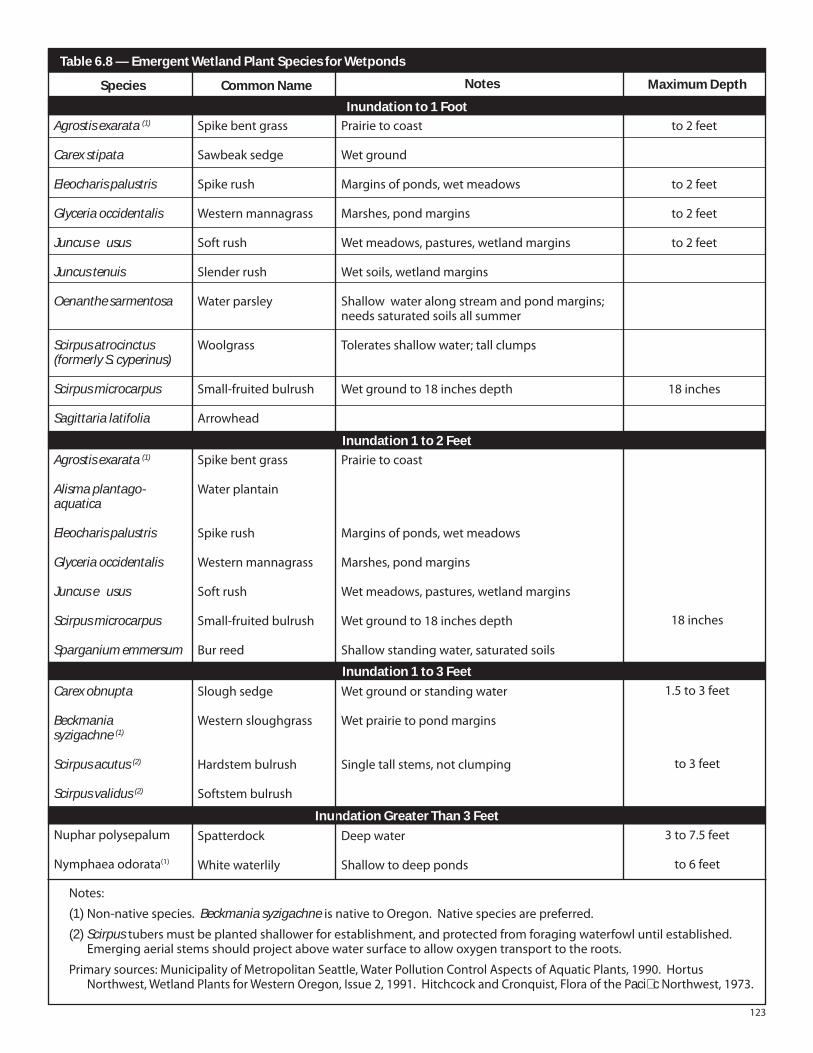
Table 6.8 — Emergent Wetland Plant Species for Wetponds
Species
Inundation to 1 Foot
Common Name
Inundation 1 to 2 FeetAgrostis exarata (1)
Alisma plantago-aquatica
Eleocharis palustris
Glyceria occidentalis
Juncus effusus
Scirpus microcarpus
Sparganium emmersum
Inundation 1 to 3 FeetCarex obnupta
Beckmania syzigachne (1)
Scirpus acutus (2)
Scirpus validus (2)
Inundation Greater Than 3 FeetNupharpolysepalum
Nymphaeaodorata(1)
Spikebentgrass
Sawbeaksedge
Spikerush
Westernmannagrass
Softrush
Slenderrush
Waterparsley
Woolgrass
Small-fruitedbulrush
Arrowhead
Notes
Prairietocoast
Wetground
Marginsofponds,wetmeadows
Marshes,pondmargins
Wetmeadows,pastures,wetlandmargins
Wetsoils,wetlandmargins
Shallowwateralongstreamandpondmargins;needssaturatedsoilsallsummer
Toleratesshallowwater;tallclumps
Wetgroundto18inchesdepth
Maximum Depth
to2feet
to2feet
to2feet
to2feet
18inches
Spikebentgrass
Waterplantain
Spikerush
Westernmannagrass
Softrush
Small-fruitedbulrush
Burreed
Prairietocoast
Marginsofponds,wetmeadows
Marshes,pondmargins
Wetmeadows,pastures,wetlandmargins
Wetgroundto18inchesdepth
Shallowstandingwater,saturatedsoils
18inches
Sloughsedge
Westernsloughgrass
Hardstembulrush
Softstembulrush
Wetgroundorstandingwater
Wetprairietopondmargins
Singletallstems,notclumping
1.5to3feet
to3feet
Spatterdock
Whitewaterlily
Deepwater
Shallowtodeepponds
3to7.5feet
to6feet
Notes:
(1)Non-nativespecies.Beckmania syzigachneisnativetoOregon.Nativespeciesarepreferred.
(2)Scirpustubersmustbeplantedshallowerforestablishment,andprotectedfromforagingwaterfowluntilestablished.Emergingaerialstemsshouldprojectabovewatersurfacetoallowoxygentransporttotheroots.
Primarysources:MunicipalityofMetropolitanSeattle,WaterPollutionControlAspectsofAquaticPlants,1990.HortusNorthwest,WetlandPlantsforWesternOregon,Issue2,1991.HitchcockandCronquist,FloraofthePacificNorthwest,1973.
124
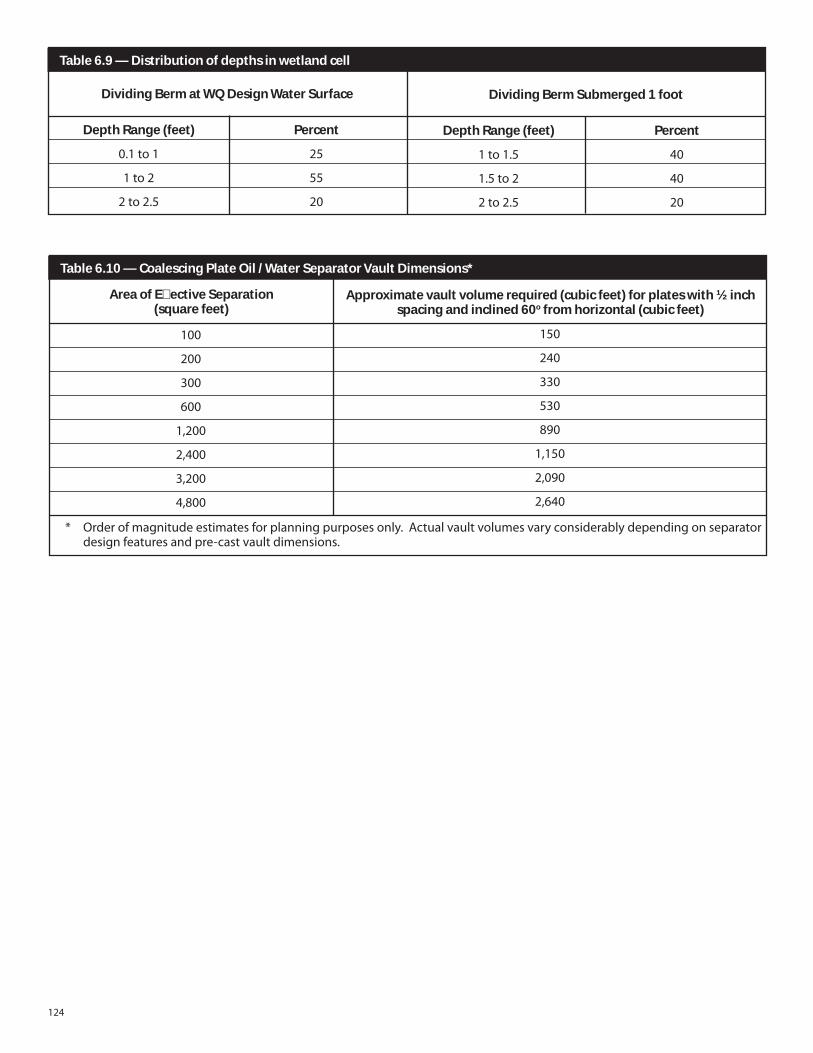
Depth Range (feet)
0.1to1
1to2
2to2.5
Table 6.9 — Distribution of depths in wetland cell
Dividing Berm at WQ Design Water Surface Dividing Berm Submerged 1 foot
100
200
300
600
1,200
2,400
3,200
4,800
Table 6.10 — Coalescing Plate Oil / Water Separator Vault Dimensions*
Area of Effective Separation(square feet)
Approximate vault volume required (cubic feet) for plates with ½ inch spacing and inclined 60o from horizontal (cubic feet)
150
240
330
530
890
1,150
2,090
2,640
* Orderofmagnitudeestimatesforplanningpurposesonly.Actualvaultvolumesvaryconsiderablydependingonseparatordesignfeaturesandpre-castvaultdimensions.
Percent
25
55
20
Depth Range (feet)
1to1.5
1.5to2
2to2.5
Percent
40
40
20

125
THIS PAGE LEFT BLANK INTENTIONALLY

126
Kitsap CountyStormwater
DesignManual
CHAPTER 7 – TABLES

127
THIS PAGE LEFT BLANK INTENTIONALLY
128
1.50
0.619
0.6175
0.614
0.612
0.610
0.6085
0.608
1.50
0.625
0.6235
0.620
0.618
0.616
0.6145
0.614
1.25
0.6185
0.617
0.6135
0.6115
0.6095
0.608
0.6075
1.25
0.6245
0.623
0.6195
0.6175
0.6155
0.614
0.635
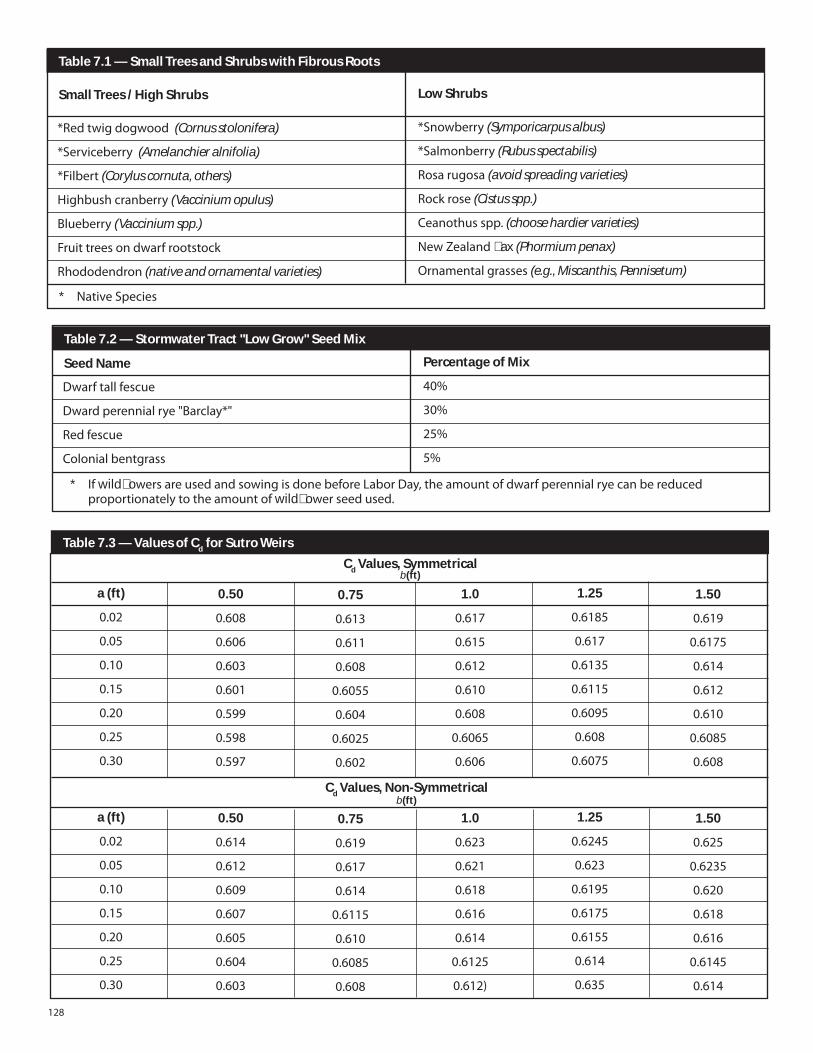
Dwarftallfescue
Dwardperennialrye"Barclay*"
Redfescue
Colonialbentgrass
Table 7.2 — Stormwater Tract "Low Grow" Seed Mix
Seed Name Percentage of Mix
40%
30%
25%
5%
* IfwildflowersareusedandsowingisdonebeforeLaborDay,theamountofdwarfperennialryecanbereducedproportionatelytotheamountofwildflowerseedused.
Table 7.3 — Values of Cd for Sutro Weirs
Cd Values, Symmetricalb(ft)
1.0
0.617
0.615
0.612
0.610
0.608
0.6065
0.606
1.0
0.623
0.621
0.618
0.616
0.614
0.6125
0.612)
0.75
0.613
0.611
0.608
0.6055
0.604
0.6025
0.602
0.75
0.619
0.617
0.614
0.6115
0.610
0.6085
0.608
0.50
0.608
0.606
0.603
0.601
0.599
0.598
0.597
0.50
0.614
0.612
0.609
0.607
0.605
0.604
0.603
a (ft)
0.02
0.05
0.10
0.15
0.20
0.25
0.30
a (ft)
0.02
0.05
0.10
0.15
0.20
0.25
0.30
Cd Values, Non-Symmetricalb(ft)
*Redtwigdogwood(Cornus stolonifera)
*Serviceberry(Amelanchier alnifolia)
*Filbert(Corylus cornuta, others)
Highbushcranberry(Vaccinium opulus)
Blueberry(Vaccinium spp.)
Fruittreesondwarfrootstock
Rhododendron(native and ornamental varieties)
Table 7.1 — Small Trees and Shrubs with Fibrous Roots
Small Trees / High Shrubs Low Shrubs
*Snowberry(Symporicarpus albus)
*Salmonberry(Rubus spectabilis)
Rosarugosa(avoid spreading varieties)
Rockrose(Cistus spp.)
Ceanothusspp.(choose hardier varieties)
NewZealandflax(Phormium penax)
Ornamentalgrasses(e.g., Miscanthis, Pennisetum)
* NativeSpecies