Embed Size (px)
Citation preview
Kodiak Management Area Salmon Catch and Escapement Sampling Operational Plan, 2013
by
Michelle L. Moore
April 2013 Alaska Department of Fish and Game Divisions of Sport Fish and Commercial Fisheries
Symbols and Abbreviations The following symbols and abbreviations, and others approved for the Système International d'Unités (SI), are used without definition in the following reports by the Divisions of Sport Fish and of Commercial Fisheries: Fishery Manuscripts, Fishery Data Series Reports, Fishery Management Reports, and Special Publications. All others, including deviations from definitions listed below, are noted in the text at first mention, as well as in the titles or footnotes of tables, and in figure or figure captions. Weights and measures (metric) centimeter cm deciliter dL gram g hectare ha kilogram kg kilometer km liter L meter m milliliter mL millimeter mm Weights and measures (English) cubic feet per second ft3/s foot ft gallon gal inch in mile mi nautical mile nmi ounce oz pound lb quart qt yard yd Time and temperature day d degrees Celsius °C degrees Fahrenheit °F degrees kelvin K hour h minute min second s Physics and chemistry all atomic symbols alternating current AC ampere A calorie cal direct current DC hertz Hz horsepower hp hydrogen ion activity pH (negative log of) parts per million ppm parts per thousand ppt, ‰ volts V watts W
General Alaska Administrative Code AAC all commonly accepted abbreviations e.g., Mr., Mrs.,
AM, PM, etc. all commonly accepted professional titles e.g., Dr., Ph.D., R.N., etc. at @ compass directions:
east E north N south S west W
copyright corporate suffixes:
Company Co. Corporation Corp. Incorporated Inc. Limited Ltd.
District of Columbia D.C. et alii (and others) et al. et cetera (and so forth) etc. exempli gratia (for example) e.g. Federal Information Code FIC id est (that is) i.e. latitude or longitude lat or long monetary symbols (U.S.) $, ¢ months (tables and figures): first three letters Jan,...,Dec registered trademark trademark United States (adjective) U.S. United States of America (noun) USA U.S.C. United States
Code U.S. state use two-letter
abbreviations (e.g., AK, WA)
Mathematics, statistics all standard mathematical signs, symbols and abbreviations alternate hypothesis HA base of natural logarithm e catch per unit effort CPUE coefficient of variation CV common test statistics (F, t, χ2, etc.) confidence interval CI correlation coefficient (multiple) R correlation coefficient (simple) r covariance cov degree (angular ) ° degrees of freedom df expected value E greater than > greater than or equal to ≥ harvest per unit effort HPUE less than < less than or equal to ≤ logarithm (natural) ln logarithm (base 10) log logarithm (specify base) log2, etc. minute (angular) ' not significant NS null hypothesis HO percent % probability P probability of a type I error (rejection of the null hypothesis when true) α probability of a type II error (acceptance of the null hypothesis when false) β second (angular) " standard deviation SD standard error SE variance population Var sample var
KODIAK MANAGEMENT AREA SALMON CATCH AND ESCAPEMENT SAMPLING OPERATIONAL PLAN, 2013
by
Michelle L. Moore Alaska Department of Fish and Game, Division of Commercial Fisheries, Kodiak
Alaska Department of Fish and Game Division of Sport Fish, Research and Technical Services 333 Raspberry Road, Anchorage, Alaska, 99518-1565
April 2013
The Regional Information Report Series was established in 1987 and was redefined in 2006 to meet the Division of Commercial Fisheries regional need for publishing and archiving information such as project operational plans, area management plans, budgetary information, staff comments and opinions to Board of Fisheries proposals, interim or preliminary data and grant agency reports, special meeting or minor workshop results and other regional information not generally reported elsewhere. Reports in this series may contain raw data and preliminary results. Reports in this series receive varying degrees of regional, biometric, and editorial review; information in this series may be subsequently finalized and published in a different department reporting series or in the formal literature. Please contact the author or the Division of Commercial Fisheries if in doubt of the level of review or preliminary nature of the data reported. Regional Information Reports are available through the Alaska State Library and on the Internet at: http://www.adfg.alaska.gov/sf/publications/.
Michelle L. Moore Alaska Department of Fish and Game, Division of Commercial Fisheries
351 Research Court, Kodiak, AK 99615, USA
This document should be cited as: Moore, M. L. 2013. Kodiak Management Area salmon catch and escapement sampling operational plan, 2013.
[In] Salmon research operational plans for the Kodiak area, 2013. Alaska Department of Fish and Game, Regional Information Report 4K13-04, Kodiak.
The Alaska Department of Fish and Game (ADF&G) administers all programs and activities free from discrimination based on race, color, national origin, age, sex, religion, marital status, pregnancy, parenthood, or disability. The department administers all programs and activities in compliance with Title VI of the Civil Rights Act of 1964, Section 504 of the Rehabilitation Act of 1973, Title II of the Americans with Disabilities Act (ADA) of 1990, the Age Discrimination Act of 1975, and Title IX of the Education Amendments of 1972.
If you believe you have been discriminated against in any program, activity, or facility please write: ADF&G ADA Coordinator, P.O. Box 115526, Juneau, AK 99811-5526
U.S. Fish and Wildlife Service, 4401 N. Fairfax Drive, MS 2042, Arlington, VA 22203 Office of Equal Opportunity, U.S. Department of the Interior, 1849 C Street NW MS 5230, Washington DC 20240
The department’s ADA Coordinator can be reached via phone at the following numbers: (VOICE) 907-465-6077, (Statewide Telecommunication Device for the Deaf) 1-800-478-3648, (Juneau TDD) 907-
465-3646, or (FAX) 907-465-6078 For information on alternative formats and questions on this publication, please contact:
ADF&G Division of Sport Fish, Research and Technical Services, 333 Raspberry Road, Anchorage AK 99518 (907) 267-2375.
TABLE OF CONTENTS Page
LIST OF TABLES......................................................................................................................................................... ii
LIST OF FIGURES ....................................................................................................................................................... ii
LIST OF APPENDICES ............................................................................................................................................... ii
ABSTRACT .................................................................................................................................................................. 1
INTRODUCTION ......................................................................................................................................................... 1 GOAL ............................................................................................................................................................................ 2
OBJECTIVES ................................................................................................................................................................ 2
TASK ............................................................................................................................................................................. 2
SUPERVISION ............................................................................................................................................................. 2
PROCEDURES ............................................................................................................................................................. 3
Escapement Sampling ............................................................................................................................................... 3 Catch Sampling ......................................................................................................................................................... 4
DATA REPORTING ..................................................................................................................................................... 4
ACKNOWLEDGEMENTS ........................................................................................................................................... 5
REFERENCES CITED ................................................................................................................................................. 6
TABLES AND FIGURES ............................................................................................................................................. 9
APPENDIX A. ADULT SALMON SAMPLING ....................................................................................................... 21
i
LIST OF TABLES Table Page 1. Kodiak Management Area sockeye salmon escapement sampling schedule, 2013. ..................................... 10 2. Kodiak Management Area salmon catch sampling schedule, 2013. ............................................................. 11
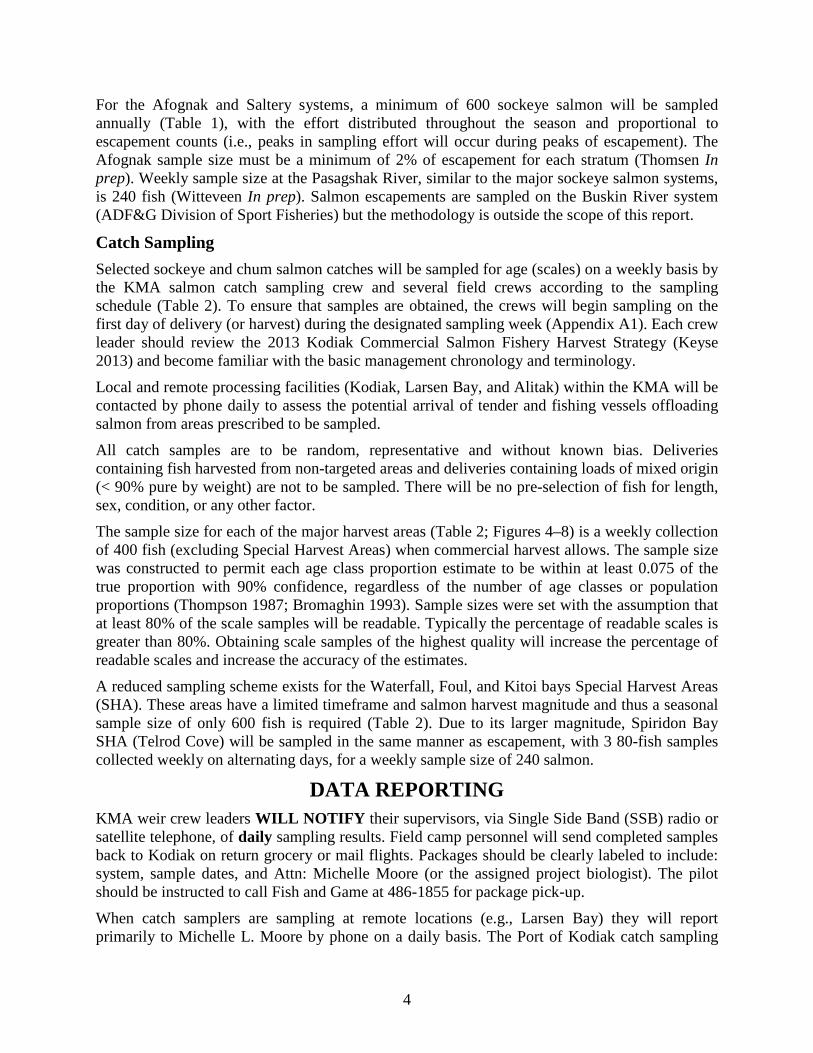
LIST OF FIGURES Figure Page 1. Map depicting the Kodiak Island Group and the Kodiak Management Area commercial salmon fishery
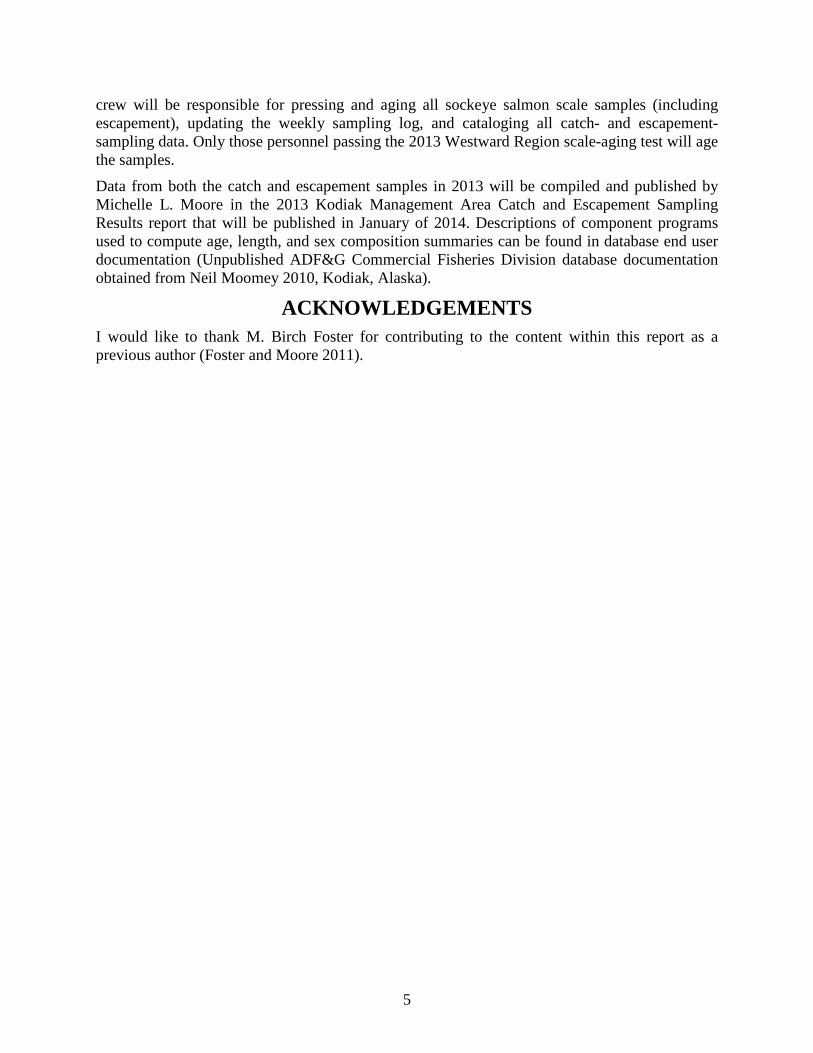
districts, 2013. ............................................................................................................................................... 12 2. Kodiak Management Area salmon weirs, special harvest areas, and salmon processing facility
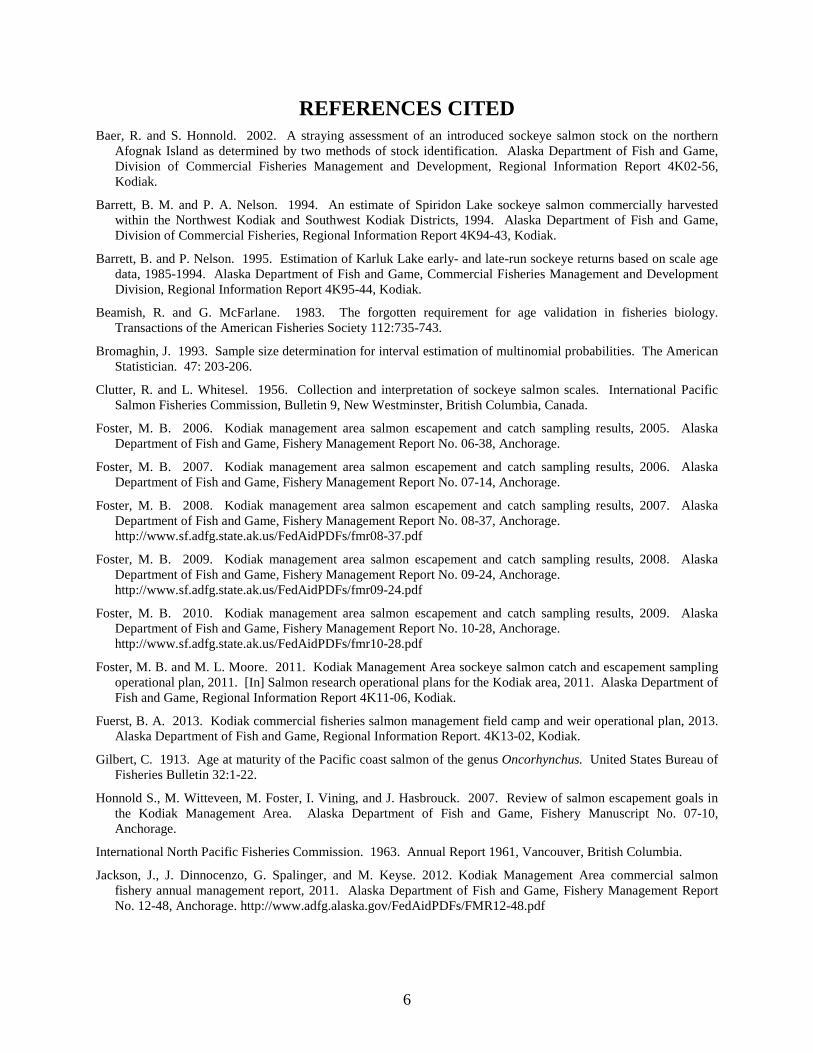
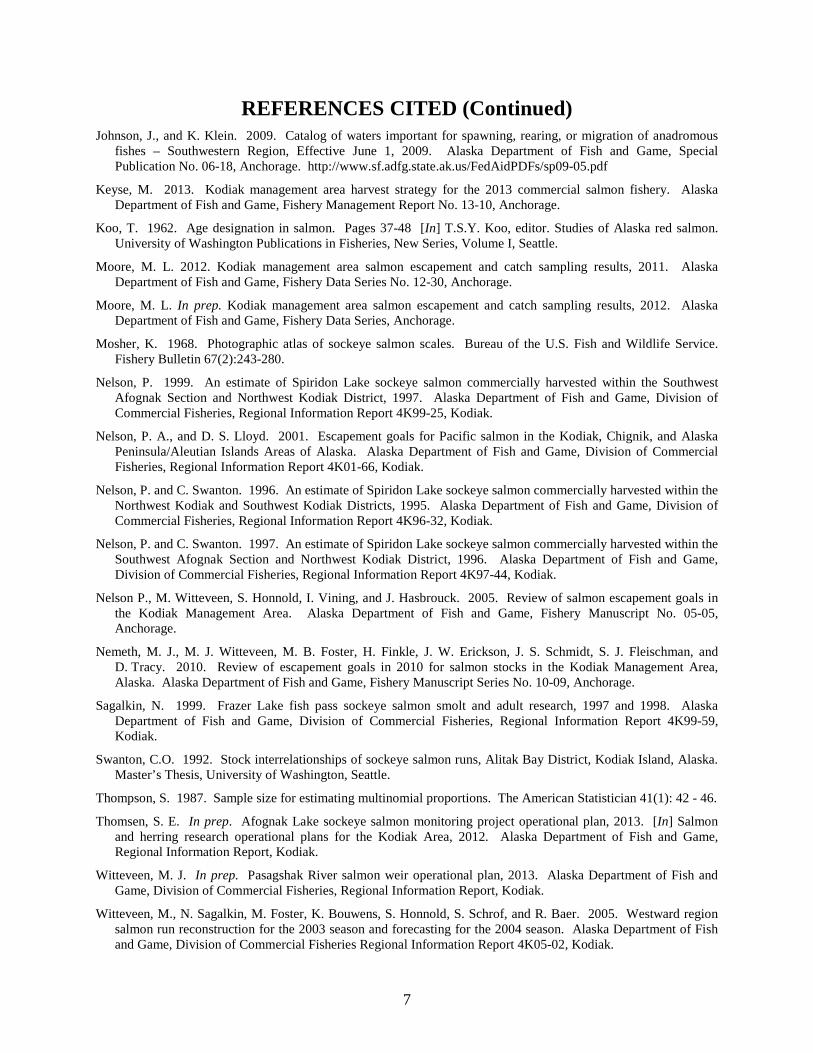
locations during 2013. ................................................................................................................................... 13 3. The “Scott” 6-panel adult salmon live box trap (photo taken at Upper Station weir). .................................. 14 4. Kodiak Management Area commercial salmon statistical areas sampled to represent Uyak Bay harvest. ... 15 5. Kodiak Management Area commercial salmon statistical areas sampled to represent Uganik/
Viekoda/Kupreanof harvest. .......................................................................................................................... 16 6. Kodiak Management Area commercial salmon statistical areas sampled to represent Moser/Olga
gillnet (dotted) and Alitak seine area harvest. ............................................................................................... 17 7. Kodiak Management Area commercial salmon statistical areas sampled to represent the Southwest
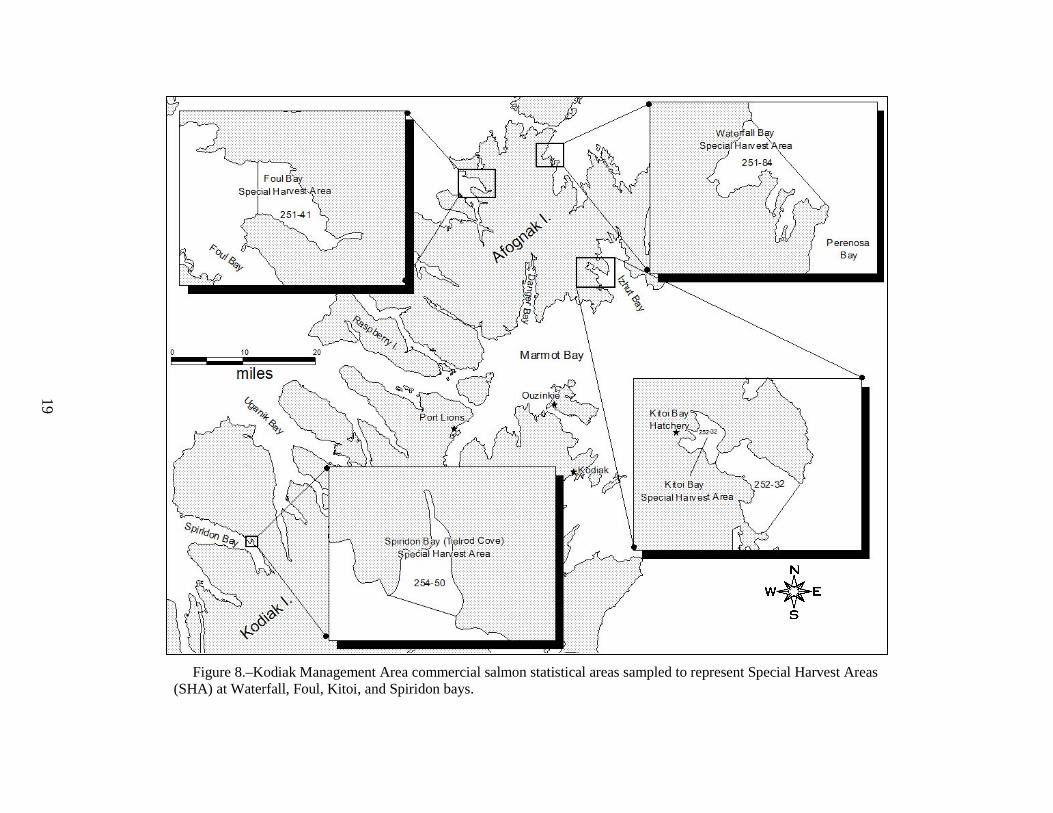
Kodiak District (Karluk/Sturgeon, Halibut/Gurney bays, and Ayakulik areas) harvests. ............................. 18 8. Kodiak Management Area commercial salmon statistical areas sampled to represent Special Harvest
Areas (SHA) at Waterfall, Foul, Kitoi, and Spiridon bays. ........................................................................... 19
LIST OF APPENDICES Appendix Page A1. Statistical (sampling) weeks and associated calendar dates. ......................................................................... 22 A2. Procedure for sampling adult salmon age, length, and sex. ........................................................................... 23
ii
ABSTRACT The Alaska Department of Fish and Game Division of Commercial Fisheries annually samples sockeye salmon escapements and catches in the Kodiak Management Area (KMA). Weirs are the primary mode of enumeration for sockeye salmon Oncorhynchus nerka escapements into streams. Biological information such as age, sex, and length are collected from escapements in the Karluk, Ayakulik, Upper Station, Frazer, Afognak, Saltery, and Pasagshak systems. In 1985, an expanded commercial salmon harvest (catch) sampling operation was initiated in the KMA that, in combination with the escapement sampling, provides the foundation for preseason run forecasts, escapement goal evaluation, and assignment of the run to stock of origin (run reconstruction). Commercial sockeye salmon catch in the KMA will be sampled for age from individual districts and sections throughout the 2013 season. The overall goal of the projects is to provide data to assist with the inseason and long-term management of the KMA sockeye salmon runs.
Key words: Kodiak, weirs, sockeye salmon, Oncorhynchus nerka, escapement, sampling, age, length, sex, catch, scales, operational plan.
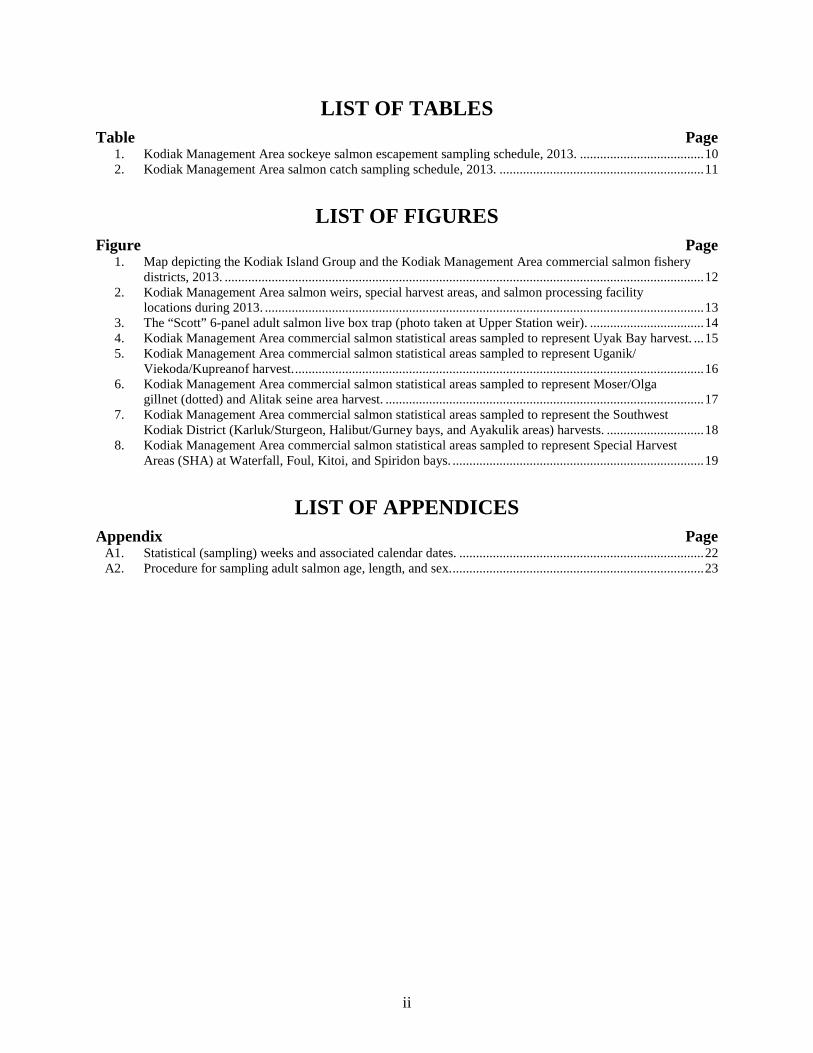
INTRODUCTION The western portion of Gulf of Alaska waters surrounding the Kodiak Island Archipelago and waters adjacent to the Alaska Peninsula from Cape Douglas to Kilokak Rocks comprise the Kodiak Management Area (KMA; Figure 1).
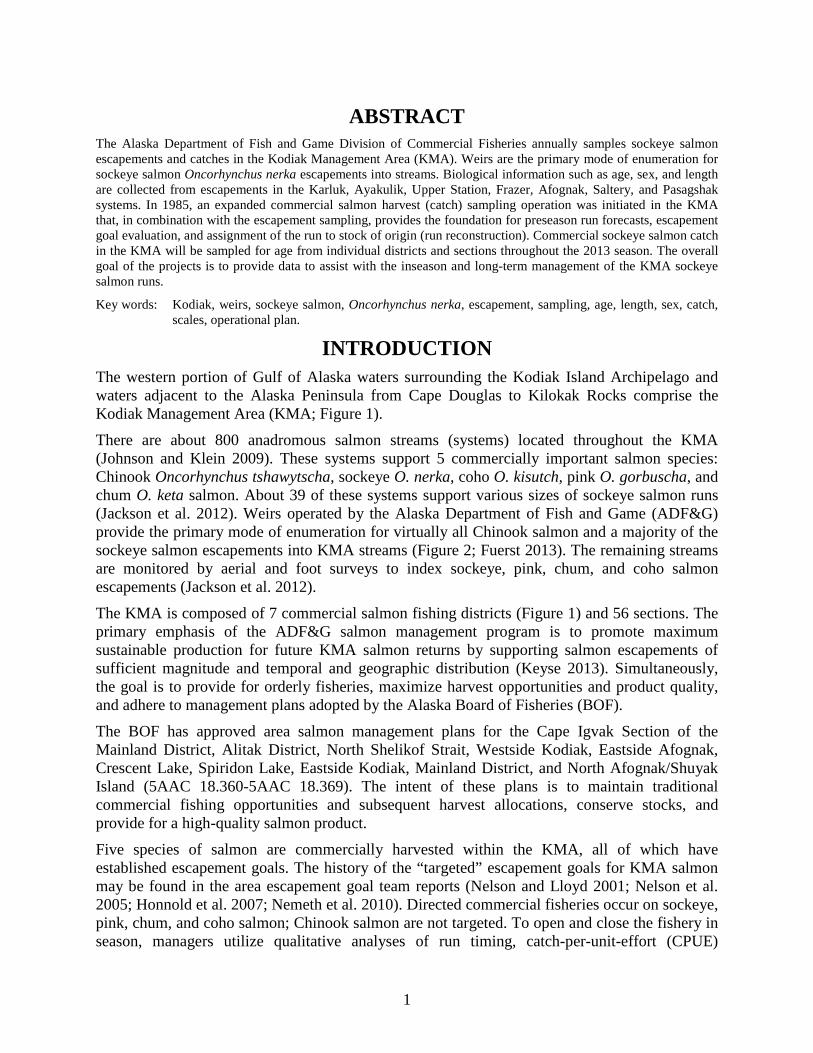
There are about 800 anadromous salmon streams (systems) located throughout the KMA (Johnson and Klein 2009). These systems support 5 commercially important salmon species: Chinook Oncorhynchus tshawytscha, sockeye O. nerka, coho O. kisutch, pink O. gorbuscha, and chum O. keta salmon. About 39 of these systems support various sizes of sockeye salmon runs (Jackson et al. 2012). Weirs operated by the Alaska Department of Fish and Game (ADF&G) provide the primary mode of enumeration for virtually all Chinook salmon and a majority of the sockeye salmon escapements into KMA streams (Figure 2; Fuerst 2013). The remaining streams are monitored by aerial and foot surveys to index sockeye, pink, chum, and coho salmon escapements (Jackson et al. 2012).
The KMA is composed of 7 commercial salmon fishing districts (Figure 1) and 56 sections. The primary emphasis of the ADF&G salmon management program is to promote maximum sustainable production for future KMA salmon returns by supporting salmon escapements of sufficient magnitude and temporal and geographic distribution (Keyse 2013). Simultaneously, the goal is to provide for orderly fisheries, maximize harvest opportunities and product quality, and adhere to management plans adopted by the Alaska Board of Fisheries (BOF).
The BOF has approved area salmon management plans for the Cape Igvak Section of the Mainland District, Alitak District, North Shelikof Strait, Westside Kodiak, Eastside Afognak, Crescent Lake, Spiridon Lake, Eastside Kodiak, Mainland District, and North Afognak/Shuyak Island (5AAC 18.360-5AAC 18.369). The intent of these plans is to maintain traditional commercial fishing opportunities and subsequent harvest allocations, conserve stocks, and provide for a high-quality salmon product.
Five species of salmon are commercially harvested within the KMA, all of which have established escapement goals. The history of the “targeted” escapement goals for KMA salmon may be found in the area escapement goal team reports (Nelson and Lloyd 2001; Nelson et al. 2005; Honnold et al. 2007; Nemeth et al. 2010). Directed commercial fisheries occur on sockeye, pink, chum, and coho salmon; Chinook salmon are not targeted. To open and close the fishery in season, managers utilize qualitative analyses of run timing, catch-per-unit-effort (CPUE)
1
statistics, species composition estimates, regulatory management plans, aerial survey estimates, test fishery numbers, and weir escapement counts (Jackson et al.2012).
Age, sex, and length (ASL) composition data of KMA sockeye salmon escapements and catches have been collected under the direction of various researchers and agencies since the mid 1920s. In 1985, ADF&G Division of Commercial Fisheries initiated an expanded commercial harvest (catch) and escapement sampling program focusing on sockeye salmon. The purpose of this program was to collect representative ASL data from major sockeye salmon systems as well as representative age data from selected commercial sockeye salmon catches. These data continue to expand the KMA salmon baseline ASL database. The data has been used to reconstruct numerous sockeye salmon runs by employing age marker analysis, scale pattern analysis (SPA), and historical harvest proportions to estimate specific stock contributions to commercial fisheries in the KMA (Swanton 1992; Barrett and Nelson 1994, 1995; Nelson and Swanton 1996, 1997; Nelson 1999; Sagalkin 1999; Baer and Honnold 2002; Witteveen et al. 2005; Foster 2006–2010; Moore 2012; Moore In Prep). Accordingly, ASL data collected provides the foundation for preseason run forecasting and escapement goal evaluation.
GOAL The goal of this project is to provide biological data from the KMA commercial salmon catch and escapements to assist with the inseason and long-term management of the KMA salmon harvest.
OBJECTIVES Data derived from sampling of the KMA commercial salmon catch and escapement will be used to achieve five primary objectives:
1. Estimate the age (from scales), sex, and length composition of sockeye salmon escapements into systems in the KMA.
2. Estimate the age composition of weekly sockeye salmon catch in major KMA harvest areas.
3. Construct accurate brood tables.
4. Develop accurate run forecasts.
5. Evaluate escapement goals and run timing.
TASK Collect and record data from representative samples of scales (for age determination), measure length, and record sex from select sockeye salmon catch and escapements within the KMA.
SUPERVISION Westward Region finfish research biologist Michelle L. Moore will act as overall project leader and supervise inseason progress. KMA research and management biologists will supervise escapement sampling crews (Table 1). The Kodiak catch sampling crew leader, will monitor weekly escapement sampling and review incoming data for quality, quantity, and timeliness. A digital logbook will be maintained by the weir crew leader to track weekly samples. Crew leaders will be given periodic feedback regarding data quality.
2
PROCEDURES The standard procedures for collecting and recording salmon ASL data are defined in Appendix A. During the 2013 season, data recording will be accomplished using rugged-digital-assistant data loggers (hereafter referred to as RDAs). All field crews will be provided new equipment and sampling protocols as new hardware and software become available. Until that time, Appendix A will serve as the standard.
The accuracy of the data and scale-sample quality will be the responsibility of the crew leaders. Because it is essential that all samples be representative, bias will be avoided by NOT pre-selecting fish based upon size, sex, condition, or any other factor. If questions or problems arise, the project leader should be contacted immediately for clarification or assistance.
All scales, when possible, will be collected from the preferred area of each fish following the methods described by International North Pacific Fish Commission (1963). Scales will be mounted on scale “gum” cards and impressions made on acetate/diacetate cards (Clutter and Whitesel 1956). Fish ages will be assigned by examining scale impressions for annual growth increments using a microfiche reader fitted with a 48X lens following designation criteria established by Mosher (1968).
The most common method of age determination in Pacific salmon is the analysis of the concentric rings (circuli) on the scale and is the method to be used by this project. Fast summer growth results in wide spacing between circuli, whereas slow winter growth results in closer-spaced circuli; age is determined by enumerating the number of winters observed on the scale (Gilbert 1913). This method of age determination is ideal because the scale can be collected, processed, and aged rapidly. Problems encountered using scales for age determination include variable scale growth, scale regeneration, scale reabsorption, and age validation difficulties (Beamish and McFarlane 1983). While no true age validation will be performed, a subsample of catch and escapement salmon scales will be aged by separate readers for corroboration of age estimates.
Ages will be recorded using European notation (Koo 1962), with a decimal separating the number of winters spent in fresh water (after emergence) from the number of winters spent in salt water. All age data will be recorded directly into the database via the Kodiak intranet salmon aging utility using a programmable keyboard (X-keys).
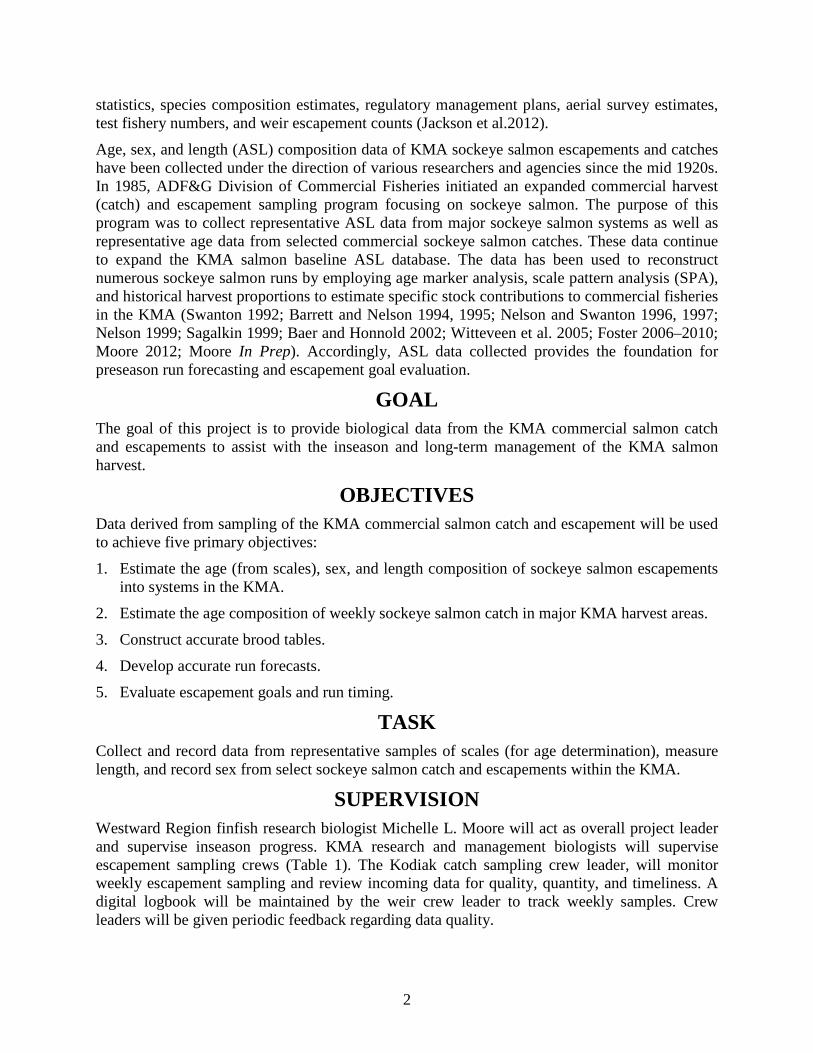
Escapement Sampling At major sockeye salmon systems (Karluk, Ayakulik, Upper Station, and Frazer; Table 1), weekly sockeye salmon escapement sampling for ASL will be conducted. Samples will be collected at most systems using a “Scott” 6-panel live box trap (Figure 3) incorporated into the weir. Three 80-fish samples will be collected weekly (sample or “statistical” week) on alternating days if possible (i.e., Monday, Wednesday, and Friday), to provide a better representation of weekly escapement (Table 1). The weekly minimum sample size is 240 fish (Thompson 1987). If escapement numbers decline and there is concern that the minimum sample size will not be achieved, sampling efforts will be adjusted to meet the weekly goal of 240 fish. Conversely, the number of fish below the weir should be estimated to anticipate large pulses of escapement; sampling intensity should be highest during large pulses of escapement. During 2013, the sampling week will start on Friday and end on Thursday. Sampling weeks and corresponding calendar dates are listed in Appendix A1.
3
For the Afognak and Saltery systems, a minimum of 600 sockeye salmon will be sampled annually (Table 1), with the effort distributed throughout the season and proportional to escapement counts (i.e., peaks in sampling effort will occur during peaks of escapement). The Afognak sample size must be a minimum of 2% of escapement for each stratum (Thomsen In prep). Weekly sample size at the Pasagshak River, similar to the major sockeye salmon systems, is 240 fish (Witteveen In prep). Salmon escapements are sampled on the Buskin River system (ADF&G Division of Sport Fisheries) but the methodology is outside the scope of this report.
Catch Sampling Selected sockeye and chum salmon catches will be sampled for age (scales) on a weekly basis by the KMA salmon catch sampling crew and several field crews according to the sampling schedule (Table 2). To ensure that samples are obtained, the crews will begin sampling on the first day of delivery (or harvest) during the designated sampling week (Appendix A1). Each crew leader should review the 2013 Kodiak Commercial Salmon Fishery Harvest Strategy (Keyse 2013) and become familiar with the basic management chronology and terminology.
Local and remote processing facilities (Kodiak, Larsen Bay, and Alitak) within the KMA will be contacted by phone daily to assess the potential arrival of tender and fishing vessels offloading salmon from areas prescribed to be sampled.
All catch samples are to be random, representative and without known bias. Deliveries containing fish harvested from non-targeted areas and deliveries containing loads of mixed origin (< 90% pure by weight) are not to be sampled. There will be no pre-selection of fish for length, sex, condition, or any other factor.
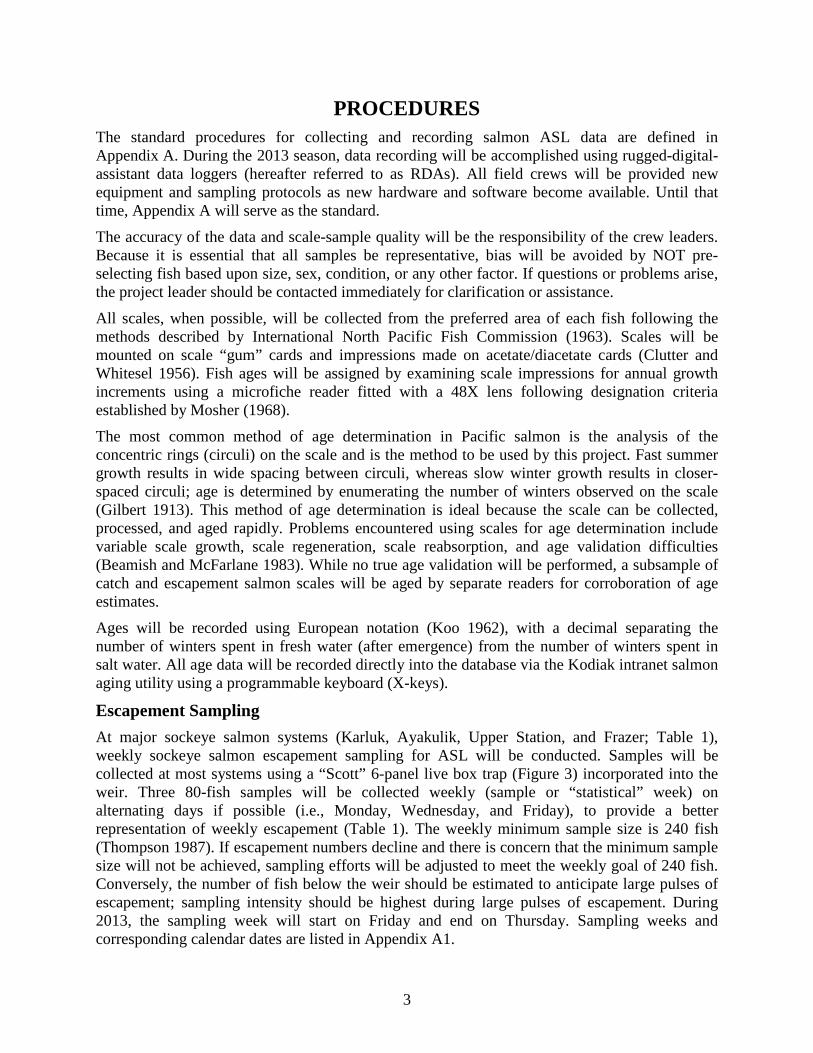
The sample size for each of the major harvest areas (Table 2; Figures 4–8) is a weekly collection of 400 fish (excluding Special Harvest Areas) when commercial harvest allows. The sample size was constructed to permit each age class proportion estimate to be within at least 0.075 of the true proportion with 90% confidence, regardless of the number of age classes or population proportions (Thompson 1987; Bromaghin 1993). Sample sizes were set with the assumption that at least 80% of the scale samples will be readable. Typically the percentage of readable scales is greater than 80%. Obtaining scale samples of the highest quality will increase the percentage of readable scales and increase the accuracy of the estimates.
A reduced sampling scheme exists for the Waterfall, Foul, and Kitoi bays Special Harvest Areas (SHA). These areas have a limited timeframe and salmon harvest magnitude and thus a seasonal sample size of only 600 fish is required (Table 2). Due to its larger magnitude, Spiridon Bay SHA (Telrod Cove) will be sampled in the same manner as escapement, with 3 80-fish samples collected weekly on alternating days, for a weekly sample size of 240 salmon.
DATA REPORTING KMA weir crew leaders WILL NOTIFY their supervisors, via Single Side Band (SSB) radio or satellite telephone, of daily sampling results. Field camp personnel will send completed samples back to Kodiak on return grocery or mail flights. Packages should be clearly labeled to include: system, sample dates, and Attn: Michelle Moore (or the assigned project biologist). The pilot should be instructed to call Fish and Game at 486-1855 for package pick-up.
When catch samplers are sampling at remote locations (e.g., Larsen Bay) they will report primarily to Michelle L. Moore by phone on a daily basis. The Port of Kodiak catch sampling
4
crew will be responsible for pressing and aging all sockeye salmon scale samples (including escapement), updating the weekly sampling log, and cataloging all catch- and escapement-sampling data. Only those personnel passing the 2013 Westward Region scale-aging test will age the samples.
Data from both the catch and escapement samples in 2013 will be compiled and published by Michelle L. Moore in the 2013 Kodiak Management Area Catch and Escapement Sampling Results report that will be published in January of 2014. Descriptions of component programs used to compute age, length, and sex composition summaries can be found in database end user documentation (Unpublished ADF&G Commercial Fisheries Division database documentation obtained from Neil Moomey 2010, Kodiak, Alaska).
ACKNOWLEDGEMENTS I would like to thank M. Birch Foster for contributing to the content within this report as a previous author (Foster and Moore 2011).
5
REFERENCES CITED Baer, R. and S. Honnold. 2002. A straying assessment of an introduced sockeye salmon stock on the northern
Afognak Island as determined by two methods of stock identification. Alaska Department of Fish and Game, Division of Commercial Fisheries Management and Development, Regional Information Report 4K02-56, Kodiak.
Barrett, B. M. and P. A. Nelson. 1994. An estimate of Spiridon Lake sockeye salmon commercially harvested within the Northwest Kodiak and Southwest Kodiak Districts, 1994. Alaska Department of Fish and Game, Division of Commercial Fisheries, Regional Information Report 4K94-43, Kodiak.
Barrett, B. and P. Nelson. 1995. Estimation of Karluk Lake early- and late-run sockeye returns based on scale age data, 1985-1994. Alaska Department of Fish and Game, Commercial Fisheries Management and Development Division, Regional Information Report 4K95-44, Kodiak.
Beamish, R. and G. McFarlane. 1983. The forgotten requirement for age validation in fisheries biology. Transactions of the American Fisheries Society 112:735-743.
Bromaghin, J. 1993. Sample size determination for interval estimation of multinomial probabilities. The American Statistician. 47: 203-206.
Clutter, R. and L. Whitesel. 1956. Collection and interpretation of sockeye salmon scales. International Pacific Salmon Fisheries Commission, Bulletin 9, New Westminster, British Columbia, Canada.
Foster, M. B. 2006. Kodiak management area salmon escapement and catch sampling results, 2005. Alaska Department of Fish and Game, Fishery Management Report No. 06-38, Anchorage.
Foster, M. B. 2007. Kodiak management area salmon escapement and catch sampling results, 2006. Alaska Department of Fish and Game, Fishery Management Report No. 07-14, Anchorage.
Foster, M. B. 2008. Kodiak management area salmon escapement and catch sampling results, 2007. Alaska Department of Fish and Game, Fishery Management Report No. 08-37, Anchorage. http://www.sf.adfg.state.ak.us/FedAidPDFs/fmr08-37.pdf
Foster, M. B. 2009. Kodiak management area salmon escapement and catch sampling results, 2008. Alaska Department of Fish and Game, Fishery Management Report No. 09-24, Anchorage. http://www.sf.adfg.state.ak.us/FedAidPDFs/fmr09-24.pdf
Foster, M. B. 2010. Kodiak management area salmon escapement and catch sampling results, 2009. Alaska Department of Fish and Game, Fishery Management Report No. 10-28, Anchorage. http://www.sf.adfg.state.ak.us/FedAidPDFs/fmr10-28.pdf
Foster, M. B. and M. L. Moore. 2011. Kodiak Management Area sockeye salmon catch and escapement sampling operational plan, 2011. [In] Salmon research operational plans for the Kodiak area, 2011. Alaska Department of Fish and Game, Regional Information Report 4K11-06, Kodiak.
Fuerst, B. A. 2013. Kodiak commercial fisheries salmon management field camp and weir operational plan, 2013. Alaska Department of Fish and Game, Regional Information Report. 4K13-02, Kodiak.
Gilbert, C. 1913. Age at maturity of the Pacific coast salmon of the genus Oncorhynchus. United States Bureau of Fisheries Bulletin 32:1-22.
Honnold S., M. Witteveen, M. Foster, I. Vining, and J. Hasbrouck. 2007. Review of salmon escapement goals in the Kodiak Management Area. Alaska Department of Fish and Game, Fishery Manuscript No. 07-10, Anchorage.
International North Pacific Fisheries Commission. 1963. Annual Report 1961, Vancouver, British Columbia.
Jackson, J., J. Dinnocenzo, G. Spalinger, and M. Keyse. 2012. Kodiak Management Area commercial salmon fishery annual management report, 2011. Alaska Department of Fish and Game, Fishery Management Report No. 12-48, Anchorage. http://www.adfg.alaska.gov/FedAidPDFs/FMR12-48.pdf
6
REFERENCES CITED (Continued) Johnson, J., and K. Klein. 2009. Catalog of waters important for spawning, rearing, or migration of anadromous
fishes – Southwestern Region, Effective June 1, 2009. Alaska Department of Fish and Game, Special Publication No. 06-18, Anchorage. http://www.sf.adfg.state.ak.us/FedAidPDFs/sp09-05.pdf
Keyse, M. 2013. Kodiak management area harvest strategy for the 2013 commercial salmon fishery. Alaska Department of Fish and Game, Fishery Management Report No. 13-10, Anchorage.
Koo, T. 1962. Age designation in salmon. Pages 37-48 [In] T.S.Y. Koo, editor. Studies of Alaska red salmon. University of Washington Publications in Fisheries, New Series, Volume I, Seattle.
Moore, M. L. 2012. Kodiak management area salmon escapement and catch sampling results, 2011. Alaska Department of Fish and Game, Fishery Data Series No. 12-30, Anchorage.
Moore, M. L. In prep. Kodiak management area salmon escapement and catch sampling results, 2012. Alaska Department of Fish and Game, Fishery Data Series, Anchorage.
Mosher, K. 1968. Photographic atlas of sockeye salmon scales. Bureau of the U.S. Fish and Wildlife Service. Fishery Bulletin 67(2):243-280.
Nelson, P. 1999. An estimate of Spiridon Lake sockeye salmon commercially harvested within the Southwest Afognak Section and Northwest Kodiak District, 1997. Alaska Department of Fish and Game, Division of Commercial Fisheries, Regional Information Report 4K99-25, Kodiak.
Nelson, P. A., and D. S. Lloyd. 2001. Escapement goals for Pacific salmon in the Kodiak, Chignik, and Alaska Peninsula/Aleutian Islands Areas of Alaska. Alaska Department of Fish and Game, Division of Commercial Fisheries, Regional Information Report 4K01-66, Kodiak.
Nelson, P. and C. Swanton. 1996. An estimate of Spiridon Lake sockeye salmon commercially harvested within the Northwest Kodiak and Southwest Kodiak Districts, 1995. Alaska Department of Fish and Game, Division of Commercial Fisheries, Regional Information Report 4K96-32, Kodiak.
Nelson, P. and C. Swanton. 1997. An estimate of Spiridon Lake sockeye salmon commercially harvested within the Southwest Afognak Section and Northwest Kodiak District, 1996. Alaska Department of Fish and Game, Division of Commercial Fisheries, Regional Information Report 4K97-44, Kodiak.
Nelson P., M. Witteveen, S. Honnold, I. Vining, and J. Hasbrouck. 2005. Review of salmon escapement goals in the Kodiak Management Area. Alaska Department of Fish and Game, Fishery Manuscript No. 05-05, Anchorage.
Nemeth, M. J., M. J. Witteveen, M. B. Foster, H. Finkle, J. W. Erickson, J. S. Schmidt, S. J. Fleischman, and D. Tracy. 2010. Review of escapement goals in 2010 for salmon stocks in the Kodiak Management Area, Alaska. Alaska Department of Fish and Game, Fishery Manuscript Series No. 10-09, Anchorage.
Sagalkin, N. 1999. Frazer Lake fish pass sockeye salmon smolt and adult research, 1997 and 1998. Alaska Department of Fish and Game, Division of Commercial Fisheries, Regional Information Report 4K99-59, Kodiak.
Swanton, C.O. 1992. Stock interrelationships of sockeye salmon runs, Alitak Bay District, Kodiak Island, Alaska. Master’s Thesis, University of Washington, Seattle.
Thompson, S. 1987. Sample size for estimating multinomial proportions. The American Statistician 41(1): 42 - 46.
Thomsen, S. E. In prep. Afognak Lake sockeye salmon monitoring project operational plan, 2013. [In] Salmon and herring research operational plans for the Kodiak Area, 2012. Alaska Department of Fish and Game, Regional Information Report, Kodiak.
Witteveen, M. J. In prep. Pasagshak River salmon weir operational plan, 2013. Alaska Department of Fish and Game, Division of Commercial Fisheries, Regional Information Report, Kodiak.
Witteveen, M., N. Sagalkin, M. Foster, K. Bouwens, S. Honnold, S. Schrof, and R. Baer. 2005. Westward region salmon run reconstruction for the 2003 season and forecasting for the 2004 season. Alaska Department of Fish and Game, Division of Commercial Fisheries Regional Information Report 4K05-02, Kodiak.
7

8

TABLES AND FIGURES
9
10
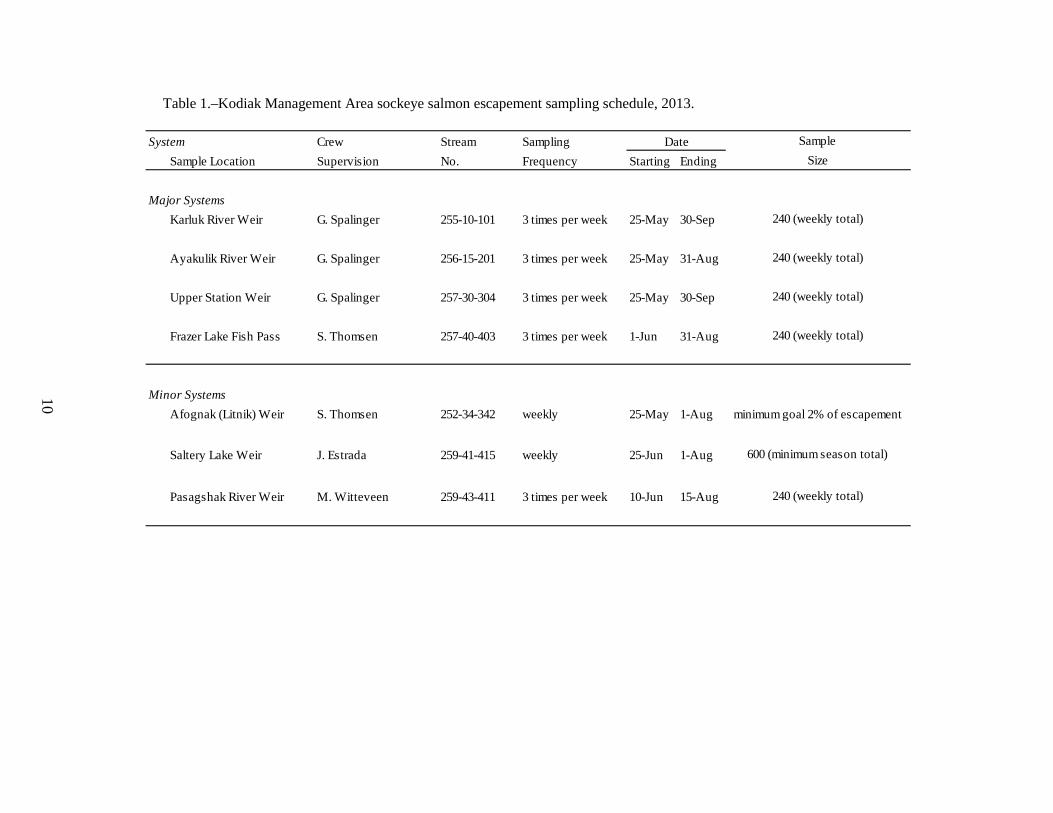
Table 1.–Kodiak Management Area sockeye salmon escapement sampling schedule, 2013.
System Crew Stream Sampling SampleSample Location Supervision No. Frequency Starting Ending Size
Major SystemsKarluk River Weir G. Spalinger 255-10-101 3 times per week 25-May 30-Sep 240 (weekly total)
Ayakulik River Weir G. Spalinger 256-15-201 3 times per week 25-May 31-Aug 240 (weekly total)
Upper Station Weir G. Spalinger 257-30-304 3 times per week 25-May 30-Sep 240 (weekly total)
Frazer Lake Fish Pass S. Thomsen 257-40-403 3 times per week 1-Jun 31-Aug 240 (weekly total)
Minor SystemsAfognak (Litnik) Weir S. Thomsen 252-34-342 weekly 25-May 1-Aug minimum goal 2% of escapement
Saltery Lake Weir J. Estrada 259-41-415 weekly 25-Jun 1-Aug 600 (minimum season total)
Pasagshak River Weir M. Witteveen 259-43-411 3 times per week 10-Jun 15-Aug 240 (weekly total)
Date
11
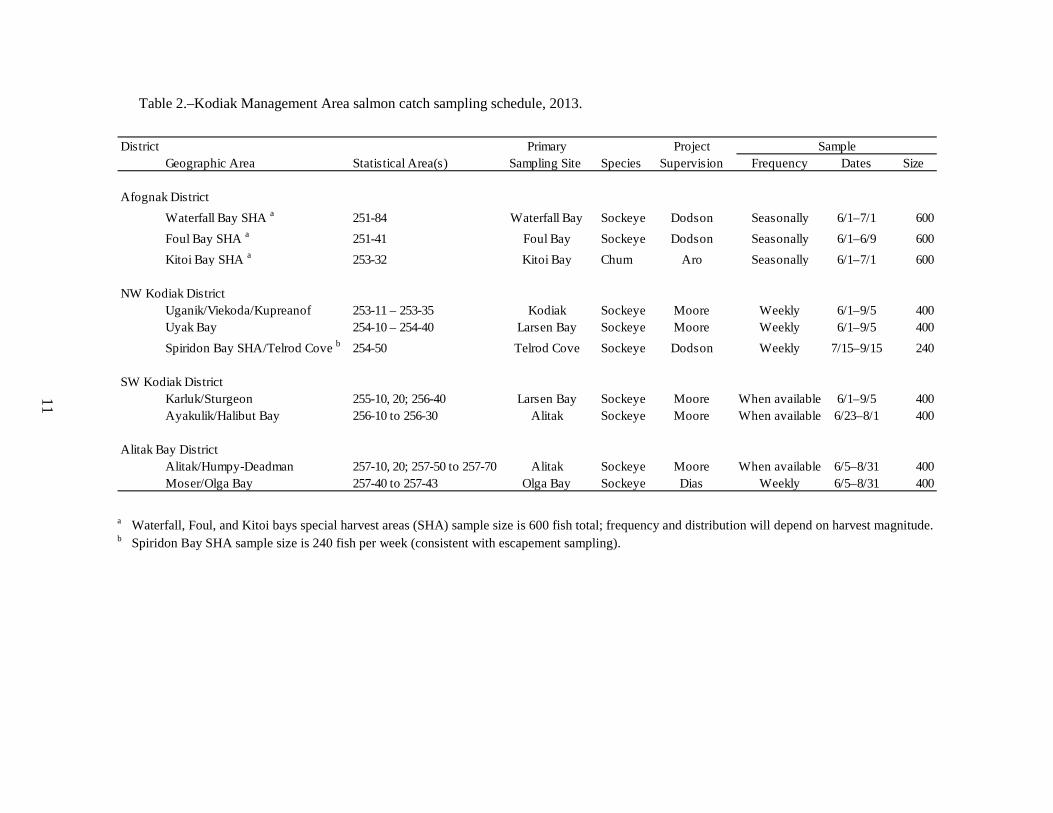
Table 2.–Kodiak Management Area salmon catch sampling schedule, 2013.
a Waterfall, Foul, and Kitoi bays special harvest areas (SHA) sample size is 600 fish total; frequency and distribution will depend on harvest magnitude. b Spiridon Bay SHA sample size is 240 fish per week (consistent with escapement sampling).
District Primary Project SampleGeographic Area Statistical Area(s) Sampling Site Species Supervision Frequency Dates Size
Afognak DistrictWaterfall Bay SHA a 251-84 Waterfall Bay Sockeye Dodson Seasonally 6/1–7/1 600Foul Bay SHA a 251-41 Foul Bay Sockeye Dodson Seasonally 6/1–6/9 600Kitoi Bay SHA a 253-32 Kitoi Bay Chum Aro Seasonally 6/1–7/1 600
NW Kodiak DistrictUganik/Viekoda/Kupreanof 253-11 – 253-35 Kodiak Sockeye Moore Weekly 6/1–9/5 400Uyak Bay 254-10 – 254-40 Larsen Bay Sockeye Moore Weekly 6/1–9/5 400Spiridon Bay SHA/Telrod Cove b 254-50 Telrod Cove Sockeye Dodson Weekly 7/15–9/15 240
SW Kodiak DistrictKarluk/Sturgeon 255-10, 20; 256-40 Larsen Bay Sockeye Moore When available 6/1–9/5 400Ayakulik/Halibut Bay 256-10 to 256-30 Alitak Sockeye Moore When available 6/23–8/1 400
Alitak Bay DistrictAlitak/Humpy-Deadman 257-10, 20; 257-50 to 257-70 Alitak Sockeye Moore When available 6/5–8/31 400Moser/Olga Bay 257-40 to 257-43 Olga Bay Sockeye Dias Weekly 6/5–8/31 400
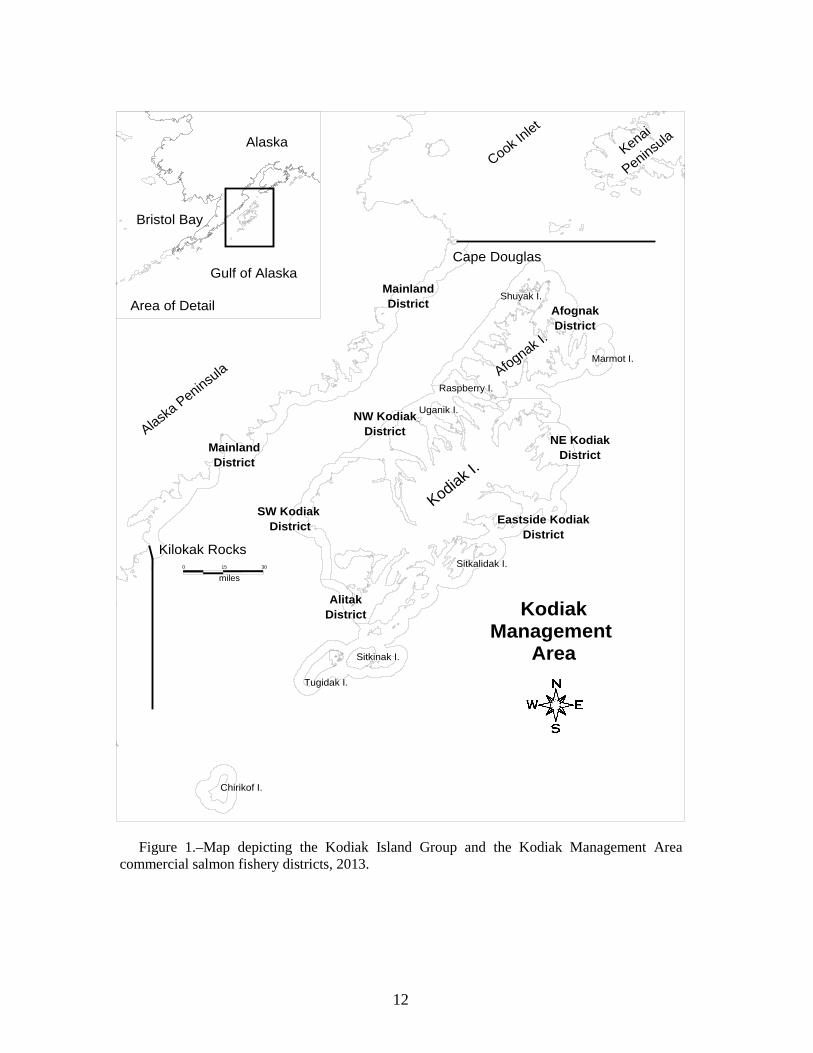
Figure 1.–Map depicting the Kodiak Island Group and the Kodiak Management Area
commercial salmon fishery districts, 2013.
15
miles0 30
Gulf of Alaska
KodiakManagement
Area
Alaska Peninsula
Alaska Peninsula
Alaska Peninsula
Alaska Peninsula
Alaska Peninsula
Alaska Peninsula
Alaska Peninsula
Alaska Peninsula
Alaska Peninsula
AlaskaAlaskaAlaskaAlaskaAlaskaAlaskaAlaskaAlaskaAlaska
Kilokak Rocks
Cape Douglas
Kodiak I.
Kodiak I.
Kodiak I.
Kodiak I.
Kodiak I.
Kodiak I.
Kodiak I.
Kodiak I.
Kodiak I.
Bristol BayBristol BayBristol BayBristol BayBristol BayBristol BayBristol BayBristol BayBristol Bay
Cook Inlet
Cook Inlet
Cook Inlet
Cook Inlet
Cook Inlet
Cook Inlet
Cook Inlet
Cook Inlet
Cook Inlet
Afognak I.
Afognak I.
Afognak I.
Afognak I.
Afognak I.
Afognak I.
Afognak I.
Afognak I.
Afognak I.
Sitkalidak I.Sitkalidak I.Sitkalidak I.Sitkalidak I.Sitkalidak I.Sitkalidak I.Sitkalidak I.Sitkalidak I.Sitkalidak I.
Sitkinak I.Sitkinak I.Sitkinak I.Sitkinak I.Sitkinak I.Sitkinak I.Sitkinak I.Sitkinak I.Sitkinak I.
Raspberry I.Raspberry I.Raspberry I.Raspberry I.Raspberry I.Raspberry I.Raspberry I.Raspberry I.Raspberry I.
Shuyak I.Shuyak I.Shuyak I.Shuyak I.Shuyak I.Shuyak I.Shuyak I.Shuyak I.Shuyak I.
Tugidak I.Tugidak I.Tugidak I.Tugidak I.Tugidak I.Tugidak I.Tugidak I.Tugidak I.Tugidak I.
Chirikof I.Chirikof I.Chirikof I.Chirikof I.Chirikof I.Chirikof I.Chirikof I.Chirikof I.Chirikof I.
Uganik I.Uganik I.Uganik I.Uganik I.Uganik I.Uganik I.Uganik I.Uganik I.Uganik I.
Marmot I.Marmot I.Marmot I.Marmot I.Marmot I.Marmot I.Marmot I.Marmot I.Marmot I.
Kenai Kenai Kenai Kenai
Kenai Kenai Kenai Kenai Kenai
Peninsula
Peninsula
Peninsula
Peninsula
Peninsula
Peninsula
Peninsula
Peninsula
Peninsula
Area of Detail AfognakAfognakAfognakAfognakAfognakAfognakAfognakAfognakAfognakDistrictDistrictDistrictDistrictDistrictDistrictDistrictDistrictDistrict
NE KodiakNE KodiakNE KodiakNE KodiakNE KodiakNE KodiakNE KodiakNE KodiakNE KodiakDistrictDistrictDistrictDistrictDistrictDistrictDistrictDistrictDistrict
Eastside KodiakEastside KodiakEastside KodiakEastside KodiakEastside KodiakEastside KodiakEastside KodiakEastside KodiakEastside KodiakDistrictDistrictDistrictDistrictDistrictDistrictDistrictDistrictDistrict
AlitakAlitakAlitakAlitakAlitakAlitakAlitakAlitakAlitakDistrictDistrictDistrictDistrictDistrictDistrictDistrictDistrictDistrict
SW KodiakSW KodiakSW KodiakSW KodiakSW KodiakSW KodiakSW KodiakSW KodiakSW Kodiak District District District District District District District District District
NW KodiakNW KodiakNW KodiakNW KodiakNW KodiakNW KodiakNW KodiakNW KodiakNW KodiakDistrictDistrictDistrictDistrictDistrictDistrictDistrictDistrictDistrict
MainlandMainlandMainlandMainlandMainlandMainlandMainlandMainlandMainlandDistrictDistrictDistrictDistrictDistrictDistrictDistrictDistrictDistrict
MainlandMainlandMainlandMainlandMainlandMainlandMainlandMainlandMainlandDistrictDistrictDistrictDistrictDistrictDistrictDistrictDistrictDistrict
12
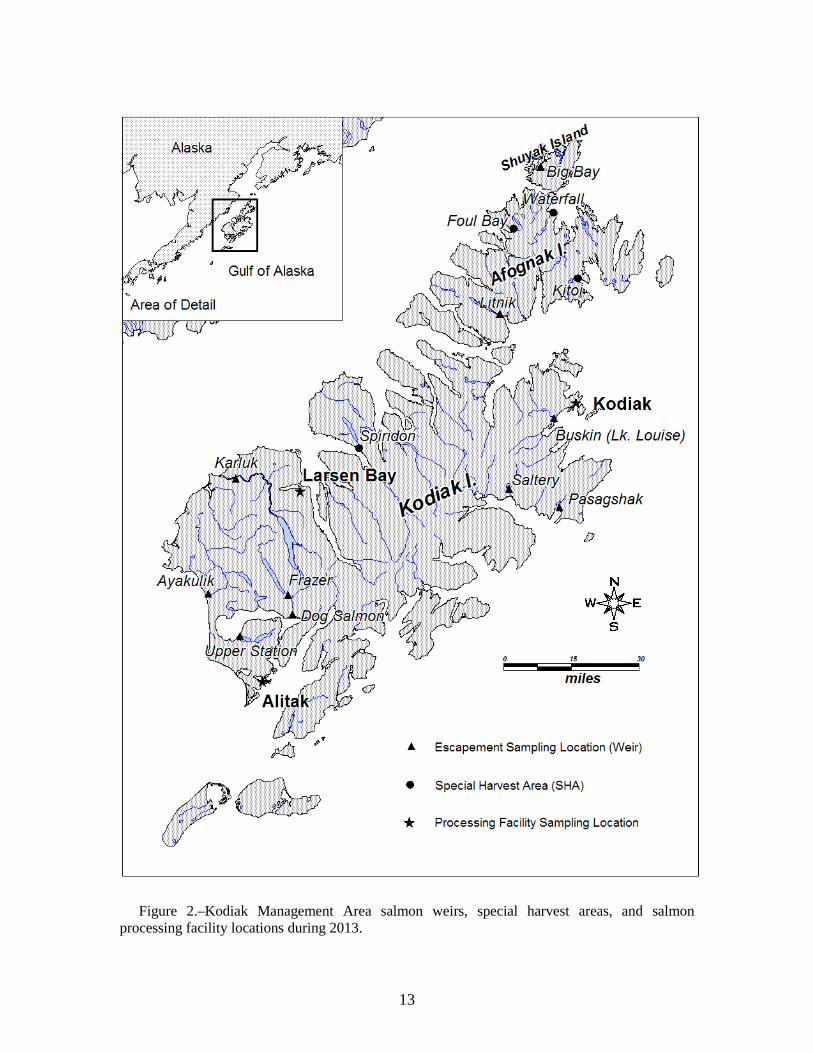
Figure 2.–Kodiak Management Area salmon weirs, special harvest areas, and salmon
processing facility locations during 2013.
13
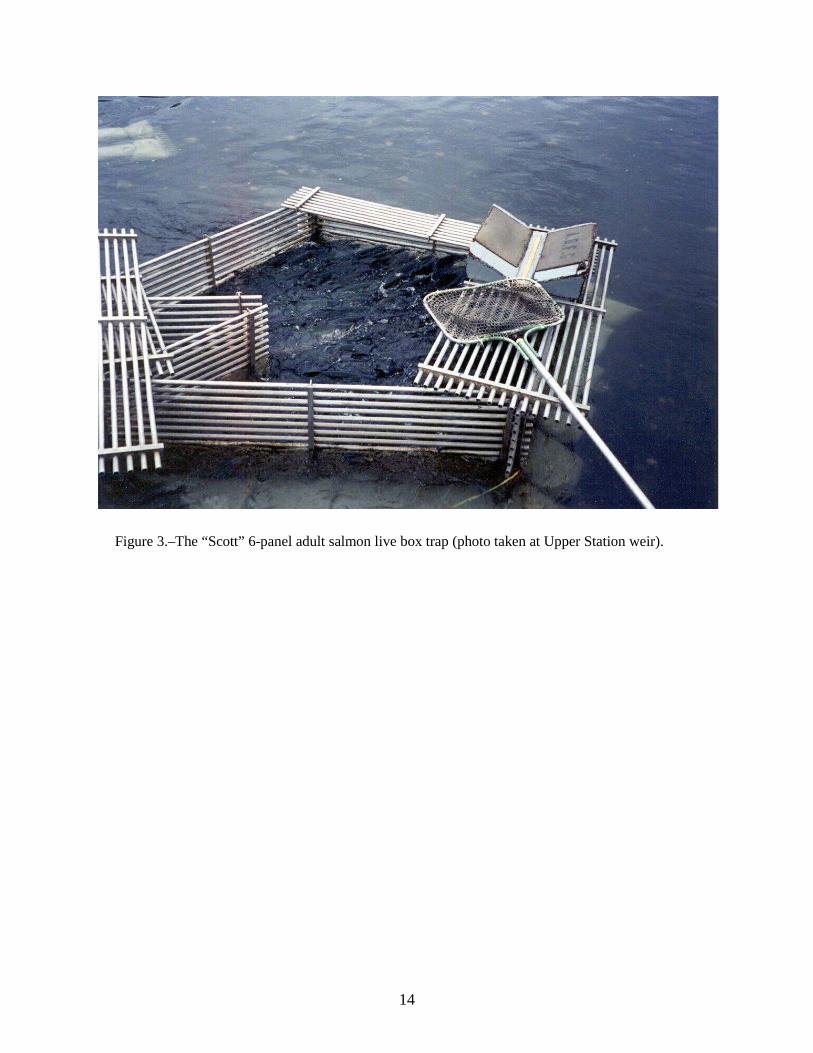
Figure 3.–The “Scott” 6-panel adult salmon live box trap (photo taken at Upper Station weir).
14
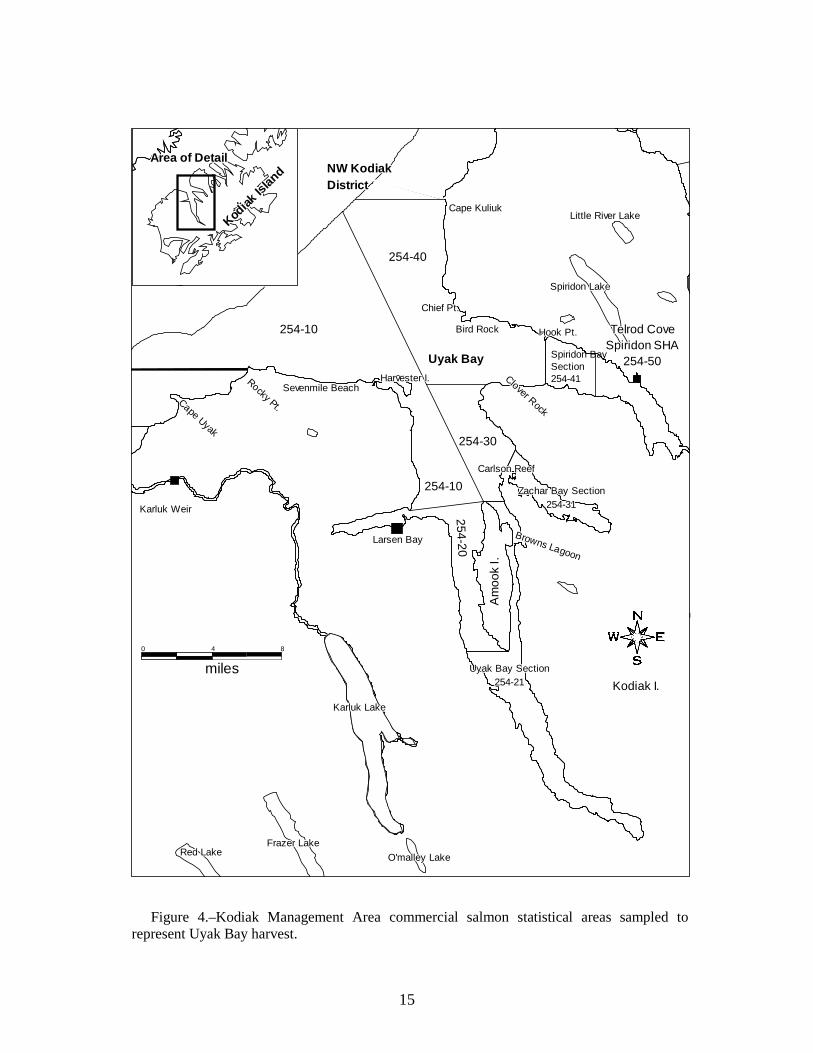
Figure 4.–Kodiak Management Area commercial salmon statistical areas sampled to
represent Uyak Bay harvest.
000000000
milesmilesmilesmilesmilesmilesmilesmilesmiles444444444 888888888
254-10
254-40
254-30
254-20
Am
ook
I.A
moo
k I.
Am
ook
I.A
moo
k I.
Am
ook
I.A
moo
k I.
Am
ook
I.A
moo
k I.
Am
ook
I.
Chief Pt.Chief Pt.Chief Pt.Chief Pt.Chief Pt.Chief Pt.Chief Pt.Chief Pt.Chief Pt.
Hook Pt.Hook Pt.Hook Pt.Hook Pt.Hook Pt.Hook Pt.Hook Pt.Hook Pt.Hook Pt.
Rocky Pt.
Rocky Pt.
Rocky Pt.
Rocky Pt.
Rocky Pt.
Rocky Pt.
Rocky Pt.
Rocky Pt.
Rocky Pt.
Cape KuliukCape KuliukCape KuliukCape KuliukCape KuliukCape KuliukCape KuliukCape KuliukCape Kuliuk
Larsen BayLarsen BayLarsen BayLarsen BayLarsen BayLarsen BayLarsen BayLarsen BayLarsen Bay
Spiridon LakeSpiridon LakeSpiridon LakeSpiridon LakeSpiridon LakeSpiridon LakeSpiridon LakeSpiridon LakeSpiridon Lake
Harvester I.Harvester I.Harvester I.Harvester I.Harvester I.Harvester I.Harvester I.Harvester I.Harvester I.
Karluk LakeKarluk LakeKarluk LakeKarluk LakeKarluk LakeKarluk LakeKarluk LakeKarluk LakeKarluk Lake
Karluk WeirKarluk WeirKarluk WeirKarluk WeirKarluk WeirKarluk WeirKarluk WeirKarluk WeirKarluk Weir
Frazer LakeFrazer LakeFrazer LakeFrazer LakeFrazer LakeFrazer LakeFrazer LakeFrazer LakeFrazer LakeRed LakeRed LakeRed LakeRed LakeRed LakeRed LakeRed LakeRed LakeRed Lake
Zachar Bay SectionZachar Bay SectionZachar Bay SectionZachar Bay SectionZachar Bay SectionZachar Bay SectionZachar Bay SectionZachar Bay SectionZachar Bay Section254-31254-31254-31254-31254-31254-31254-31254-31254-31
Telrod CoveTelrod CoveTelrod CoveTelrod CoveTelrod CoveTelrod CoveTelrod CoveTelrod CoveTelrod CoveSpiridon SHASpiridon SHASpiridon SHASpiridon SHASpiridon SHASpiridon SHASpiridon SHASpiridon SHASpiridon SHA
254-50254-50254-50254-50254-50254-50254-50254-50254-50
Little River LakeLittle River LakeLittle River LakeLittle River LakeLittle River LakeLittle River LakeLittle River LakeLittle River LakeLittle River Lake
Uyak BayUyak BayUyak BayUyak BayUyak BayUyak BayUyak BayUyak BayUyak Bay
Uyak Bay SectionUyak Bay SectionUyak Bay SectionUyak Bay SectionUyak Bay SectionUyak Bay SectionUyak Bay SectionUyak Bay SectionUyak Bay Section254-21254-21254-21254-21254-21254-21254-21254-21254-21
Spiridon Bay Section254-41
254-10
Browns Lagoon
Browns Lagoon
Browns Lagoon
Browns Lagoon
Browns Lagoon
Browns Lagoon
Browns Lagoon
Browns Lagoon
Browns Lagoon
Kodiak
Islan
d
Kodiak
Islan
d
Kodiak
Islan
d
Kodiak
Islan
d
Kodiak
Islan
d
Kodiak
Islan
d
Kodiak
Islan
d
Kodiak
Islan
d
Kodiak
Islan
dArea of DetailArea of DetailArea of DetailArea of DetailArea of DetailArea of DetailArea of DetailArea of DetailArea of Detail
Sevenmile BeachSevenmile BeachSevenmile BeachSevenmile BeachSevenmile BeachSevenmile BeachSevenmile BeachSevenmile BeachSevenmile BeachClover Rock
Clover Rock
Clover Rock
Clover Rock
Clover Rock
Clover Rock
Clover Rock
Clover Rock
Clover Rock
Bird RockBird RockBird RockBird RockBird RockBird RockBird RockBird RockBird Rock
Cape Uyak
Cape Uyak
Cape Uyak
Cape Uyak
Cape Uyak
Cape Uyak
Cape Uyak
Cape Uyak
Cape Uyak
Carlson ReefCarlson ReefCarlson ReefCarlson ReefCarlson ReefCarlson ReefCarlson ReefCarlson ReefCarlson Reef
O'malley Lake O'malley Lake O'malley Lake O'malley Lake O'malley Lake O'malley Lake O'malley Lake O'malley Lake O'malley Lake
Kodiak I.Kodiak I.Kodiak I.Kodiak I.Kodiak I.Kodiak I.Kodiak I.Kodiak I.Kodiak I.
NW Kodiak NW Kodiak NW Kodiak NW Kodiak NW Kodiak NW Kodiak NW Kodiak NW Kodiak NW Kodiak DistrictDistrictDistrictDistrictDistrictDistrictDistrictDistrictDistrict
15
16
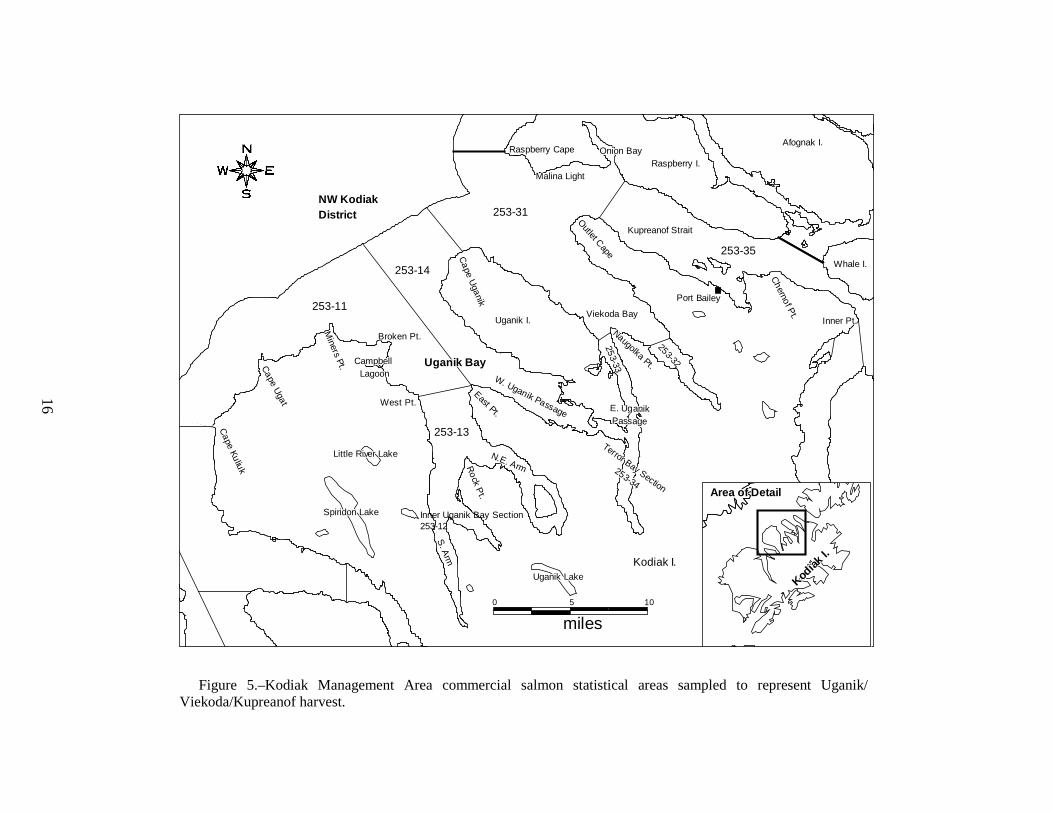
Figure 5.–Kodiak Management Area commercial salmon statistical areas sampled to represent Uganik/
Viekoda/Kupreanof harvest.
000000000 555555555
milesmilesmilesmilesmilesmilesmilesmilesmiles101010101010101010
253-11
253-13
Inner Uganik Bay Section253-12
253-14
253-31
253-35
253-32
253-33
Kupreanof StraitKupreanof StraitKupreanof StraitKupreanof StraitKupreanof StraitKupreanof StraitKupreanof StraitKupreanof StraitKupreanof Strait
Onion BayOnion BayOnion BayOnion BayOnion BayOnion BayOnion BayOnion BayOnion Bay
Cape Kuliuk
Cape Kuliuk
Cape Kuliuk
Cape Kuliuk
Cape Kuliuk
Cape Kuliuk
Cape Kuliuk
Cape Kuliuk
Cape Kuliuk
Cape Ugat
Cape Ugat
Cape Ugat
Cape Ugat
Cape Ugat
Cape Ugat
Cape Ugat
Cape Ugat
Cape Ugat
Miners Pt.
Miners Pt.
Miners Pt.
Miners Pt.
Miners Pt.
Miners Pt.
Miners Pt.
Miners Pt.
Miners Pt.
Broken Pt.Broken Pt.Broken Pt.Broken Pt.Broken Pt.Broken Pt.Broken Pt.Broken Pt.Broken Pt.
Uganik BayUganik BayUganik BayUganik BayUganik BayUganik BayUganik BayUganik BayUganik Bay
Uganik I.Uganik I.Uganik I.Uganik I.Uganik I.Uganik I.Uganik I.Uganik I.Uganik I.
Raspberry I.Raspberry I.Raspberry I.Raspberry I.Raspberry I.Raspberry I.Raspberry I.Raspberry I.Raspberry I.
Afognak I.Afognak I.Afognak I.Afognak I.Afognak I.Afognak I.Afognak I.Afognak I.Afognak I.
Kodiak I.Kodiak I.Kodiak I.Kodiak I.Kodiak I.Kodiak I.Kodiak I.Kodiak I.Kodiak I.
West Pt.West Pt.West Pt.West Pt.West Pt.West Pt.West Pt.West Pt.West Pt.East Pt.
East Pt.
East Pt.
East Pt.
East Pt.
East Pt.
East Pt.
East Pt.
East Pt.
Uganik LakeUganik LakeUganik LakeUganik LakeUganik LakeUganik LakeUganik LakeUganik LakeUganik Lake
Viekoda BayViekoda BayViekoda BayViekoda BayViekoda BayViekoda BayViekoda BayViekoda BayViekoda Bay
Terror Bay Section
Terror Bay Section
Terror Bay Section
Terror Bay Section
Terror Bay Section
Terror Bay Section
Terror Bay Section
Terror Bay Section
Terror Bay Section
253-34253-34253-34253-34253-34253-34253-34253-34253-34
Raspberry CapeRaspberry CapeRaspberry CapeRaspberry CapeRaspberry CapeRaspberry CapeRaspberry CapeRaspberry CapeRaspberry Cape
Outlet Cape
Outlet Cape
Outlet Cape
Outlet Cape
Outlet Cape
Outlet Cape
Outlet Cape
Outlet Cape
Outlet CapeCape Uganik
Cape Uganik
Cape Uganik
Cape Uganik
Cape Uganik
Cape Uganik
Cape Uganik
Cape Uganik
Cape Uganik
Spiridon LakeSpiridon LakeSpiridon LakeSpiridon LakeSpiridon LakeSpiridon LakeSpiridon LakeSpiridon LakeSpiridon Lake
Little River LakeLittle River LakeLittle River LakeLittle River LakeLittle River LakeLittle River LakeLittle River LakeLittle River LakeLittle River Lake
Area of DetailArea of DetailArea of DetailArea of DetailArea of DetailArea of DetailArea of DetailArea of DetailArea of Detail
Kodiak
I.
Kodiak
I.
Kodiak
I.
Kodiak
I.
Kodiak
I.
Kodiak
I.
Kodiak
I.
Kodiak
I.
Kodiak
I.
Port BaileyPort BaileyPort BaileyPort BaileyPort BaileyPort BaileyPort BaileyPort BaileyPort Bailey
W. Uganik Passage
W. Uganik Passage
W. Uganik Passage
W. Uganik Passage
W. Uganik Passage
W. Uganik Passage
W. Uganik Passage
W. Uganik Passage
W. Uganik Passage
S. ArmS. ArmS. ArmS. ArmS. ArmS. ArmS. ArmS. ArmS. Arm
N.E. ArmN.E. ArmN.E. ArmN.E. ArmN.E. ArmN.E. ArmN.E. ArmN.E. ArmN.E. ArmRock Pt.
Rock Pt.Rock Pt.Rock Pt.Rock Pt.Rock Pt.Rock Pt.Rock Pt.Rock Pt.
Campbell Campbell Campbell Campbell Campbell Campbell Campbell Campbell Campbell LagoonLagoonLagoonLagoonLagoonLagoonLagoonLagoonLagoon
Whale I.Whale I.Whale I.Whale I.Whale I.Whale I.Whale I.Whale I.Whale I.Chernof Pt.
Chernof Pt.
Chernof Pt.
Chernof Pt.
Chernof Pt.
Chernof Pt.
Chernof Pt.
Chernof Pt.
Chernof Pt. Inner Pt.Inner Pt.Inner Pt.Inner Pt.Inner Pt.Inner Pt.Inner Pt.Inner Pt.Inner Pt.
Malina LightMalina LightMalina LightMalina LightMalina LightMalina LightMalina LightMalina LightMalina Light
E. UganikE. UganikE. UganikE. UganikE. UganikE. UganikE. UganikE. UganikE. UganikPassagePassagePassagePassagePassagePassagePassagePassagePassage
Chernof Pt.
Chernof Pt.
Chernof Pt.
Chernof Pt.
Chernof Pt.
Chernof Pt.
Chernof Pt.
Chernof Pt.
Chernof Pt.
Naugolka Pt.
Naugolka Pt.
Naugolka Pt.
Naugolka Pt.
Naugolka Pt.
Naugolka Pt.
Naugolka Pt.
Naugolka Pt.
Naugolka Pt.
NW KodiakNW KodiakNW KodiakNW KodiakNW KodiakNW KodiakNW KodiakNW KodiakNW KodiakDistrictDistrictDistrictDistrictDistrictDistrictDistrictDistrictDistrict
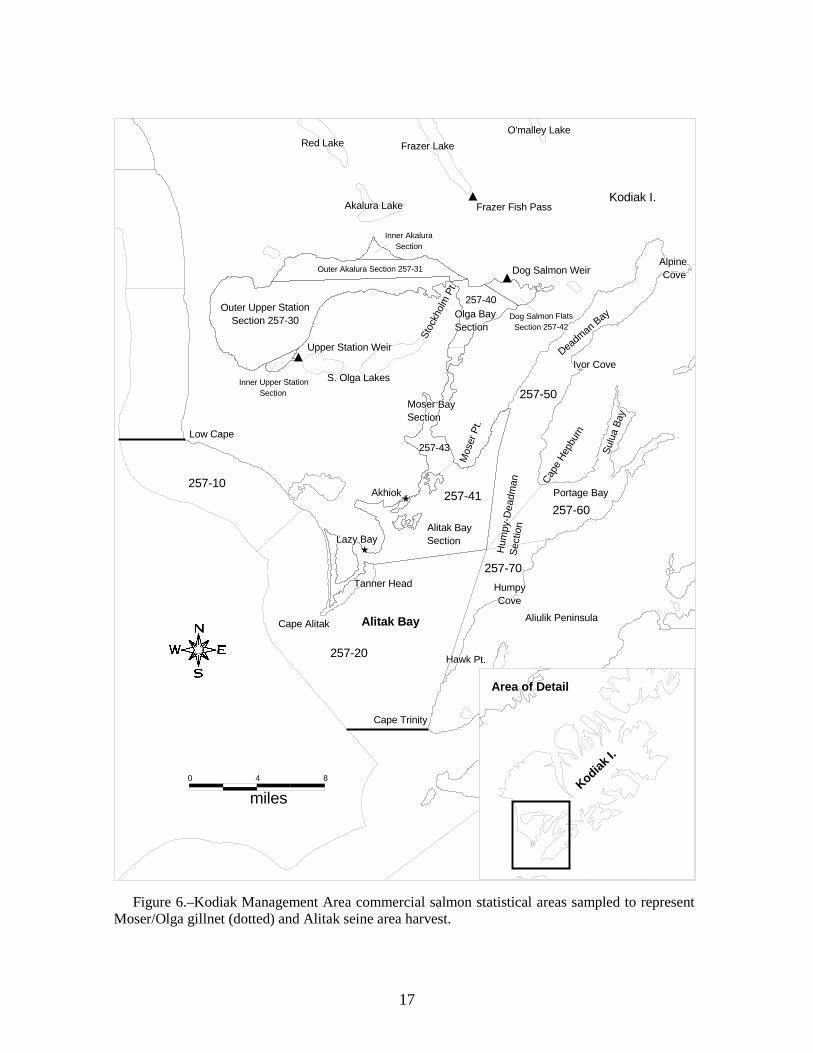
Figure 6.–Kodiak Management Area commercial salmon statistical areas sampled to represent
Moser/Olga gillnet (dotted) and Alitak seine area harvest.
0 8
miles4
257-10
257-20
257-41
257-70
257-50
257-60
257-43
257-40
Alitak BayAlitak BayAlitak BayAlitak BayAlitak BayAlitak BayAlitak BayAlitak BayAlitak BayCape AlitakCape AlitakCape AlitakCape AlitakCape AlitakCape AlitakCape AlitakCape AlitakCape Alitak
Lazy BayLazy BayLazy BayLazy BayLazy BayLazy BayLazy BayLazy BayLazy Bay
Cape TrinityCape TrinityCape TrinityCape TrinityCape TrinityCape TrinityCape TrinityCape TrinityCape Trinity
Aliulik PeninsulaAliulik PeninsulaAliulik PeninsulaAliulik PeninsulaAliulik PeninsulaAliulik PeninsulaAliulik PeninsulaAliulik PeninsulaAliulik Peninsula
Portage BayPortage BayPortage BayPortage BayPortage BayPortage BayPortage BayPortage BayPortage Bay
Sulu
a Ba
ySu
lua
Bay
Sulu
a Ba
ySu
lua
Bay
Sulu
a Ba
ySu
lua
Bay
Sulu
a Ba
ySu
lua
Bay
Sulu
a Ba
y
Deadman Bay
Deadman Bay
Deadman Bay
Deadman Bay
Deadman Bay
Deadman Bay
Deadman Bay
Deadman Bay
Deadman Bay
Hum
py-D
eadm
an
Hum
py-D
eadm
an
Hum
py-D
eadm
an
Hum
py-D
eadm
an
Hum
py-D
eadm
an
Hum
py-D
eadm
an
Hum
py-D
eadm
an
Hum
py-D
eadm
an
Hum
py-D
eadm
an
Sect
ion
Sect
ion
Sect
ion
Sect
ion
Sect
ion
Sect
ion
Sect
ion
Sect
ion
Sect
ion
S. Olga LakesS. Olga LakesS. Olga LakesS. Olga LakesS. Olga LakesS. Olga LakesS. Olga LakesS. Olga LakesS. Olga Lakes
Akalura LakeAkalura LakeAkalura LakeAkalura LakeAkalura LakeAkalura LakeAkalura LakeAkalura LakeAkalura Lake
Red LakeRed LakeRed LakeRed LakeRed LakeRed LakeRed LakeRed LakeRed Lake Frazer LakeFrazer LakeFrazer LakeFrazer LakeFrazer LakeFrazer LakeFrazer LakeFrazer LakeFrazer LakeO'malley Lake O'malley Lake O'malley Lake O'malley Lake O'malley Lake O'malley Lake O'malley Lake O'malley Lake O'malley Lake
Olga BayOlga BayOlga BayOlga BayOlga BayOlga BayOlga BayOlga BayOlga BaySectionSectionSectionSectionSectionSectionSectionSectionSection
Moser Bay Moser Bay Moser Bay Moser Bay Moser Bay Moser Bay Moser Bay Moser Bay Moser Bay SectionSectionSectionSectionSectionSectionSectionSectionSection
Dog Salmon FlatsDog Salmon FlatsDog Salmon FlatsDog Salmon FlatsDog Salmon FlatsDog Salmon FlatsDog Salmon FlatsDog Salmon FlatsDog Salmon FlatsSection 257-42Section 257-42Section 257-42Section 257-42Section 257-42Section 257-42Section 257-42Section 257-42Section 257-42
Outer Upper StationOuter Upper StationOuter Upper StationOuter Upper StationOuter Upper StationOuter Upper StationOuter Upper StationOuter Upper StationOuter Upper StationSection 257-30Section 257-30Section 257-30Section 257-30Section 257-30Section 257-30Section 257-30Section 257-30Section 257-30
Inner AkaluraInner AkaluraInner AkaluraInner AkaluraInner AkaluraInner AkaluraInner AkaluraInner AkaluraInner AkaluraSectionSectionSectionSectionSectionSectionSectionSectionSection
Outer Akalura Section 257-31Outer Akalura Section 257-31Outer Akalura Section 257-31Outer Akalura Section 257-31Outer Akalura Section 257-31Outer Akalura Section 257-31Outer Akalura Section 257-31Outer Akalura Section 257-31Outer Akalura Section 257-31
Inner Upper StationInner Upper StationInner Upper StationInner Upper StationInner Upper StationInner Upper StationInner Upper StationInner Upper StationInner Upper StationSection Section Section Section Section Section Section Section Section
Upper Station WeirUpper Station WeirUpper Station WeirUpper Station WeirUpper Station WeirUpper Station WeirUpper Station WeirUpper Station WeirUpper Station Weir
Dog Salmon WeirDog Salmon WeirDog Salmon WeirDog Salmon WeirDog Salmon WeirDog Salmon WeirDog Salmon WeirDog Salmon WeirDog Salmon Weir
Frazer Fish PassFrazer Fish PassFrazer Fish PassFrazer Fish PassFrazer Fish PassFrazer Fish PassFrazer Fish PassFrazer Fish PassFrazer Fish Pass
Area of DetailArea of DetailArea of DetailArea of DetailArea of DetailArea of DetailArea of DetailArea of DetailArea of Detail
Kodiak I.
Kodiak I.
Kodiak I.
Kodiak I.
Kodiak I.
Kodiak I.
Kodiak I.
Kodiak I.
Kodiak I.
Alitak Bay Alitak Bay Alitak Bay Alitak Bay Alitak Bay Alitak Bay Alitak Bay Alitak Bay Alitak Bay SectionSectionSectionSectionSectionSectionSectionSectionSection
HumpyHumpyHumpyHumpyHumpyHumpyHumpyHumpyHumpyCoveCoveCoveCoveCoveCoveCoveCoveCove
Tanner HeadTanner HeadTanner HeadTanner HeadTanner HeadTanner HeadTanner HeadTanner HeadTanner Head
AkhiokAkhiokAkhiokAkhiokAkhiokAkhiokAkhiokAkhiokAkhiok
Mos
er P
t.M
oser
Pt.
Mos
er P
t.M
oser
Pt.
Mos
er P
t.M
oser
Pt.
Mos
er P
t.M
oser
Pt.
Mos
er P
t.
Cape
Hep
burn
Cape
Hep
burn
Cape
Hep
burn
Cape
Hep
burn
Cape
Hep
burn
Cape
Hep
burn
Cape
Hep
burn
Cape
Hep
burn
Cape
Hep
burn
Hawk Pt.Hawk Pt.Hawk Pt.Hawk Pt.Hawk Pt.Hawk Pt.Hawk Pt.Hawk Pt.Hawk Pt.
Stoc
khol
m P
t.
Stoc
khol
m P
t.
Stoc
khol
m P
t.
Stoc
khol
m P
t.
Stoc
khol
m P
t.
Stoc
khol
m P
t.
Stoc
khol
m P
t.
Stoc
khol
m P
t.
Stoc
khol
m P
t.
Alpine Alpine Alpine Alpine Alpine Alpine Alpine Alpine Alpine CoveCoveCoveCoveCoveCoveCoveCoveCove
Ivor CoveIvor CoveIvor CoveIvor CoveIvor CoveIvor CoveIvor CoveIvor CoveIvor Cove
Low CapeLow CapeLow CapeLow CapeLow CapeLow CapeLow CapeLow CapeLow Cape
Kodiak I.Kodiak I.Kodiak I.Kodiak I.Kodiak I.Kodiak I.Kodiak I.Kodiak I.Kodiak I.
17
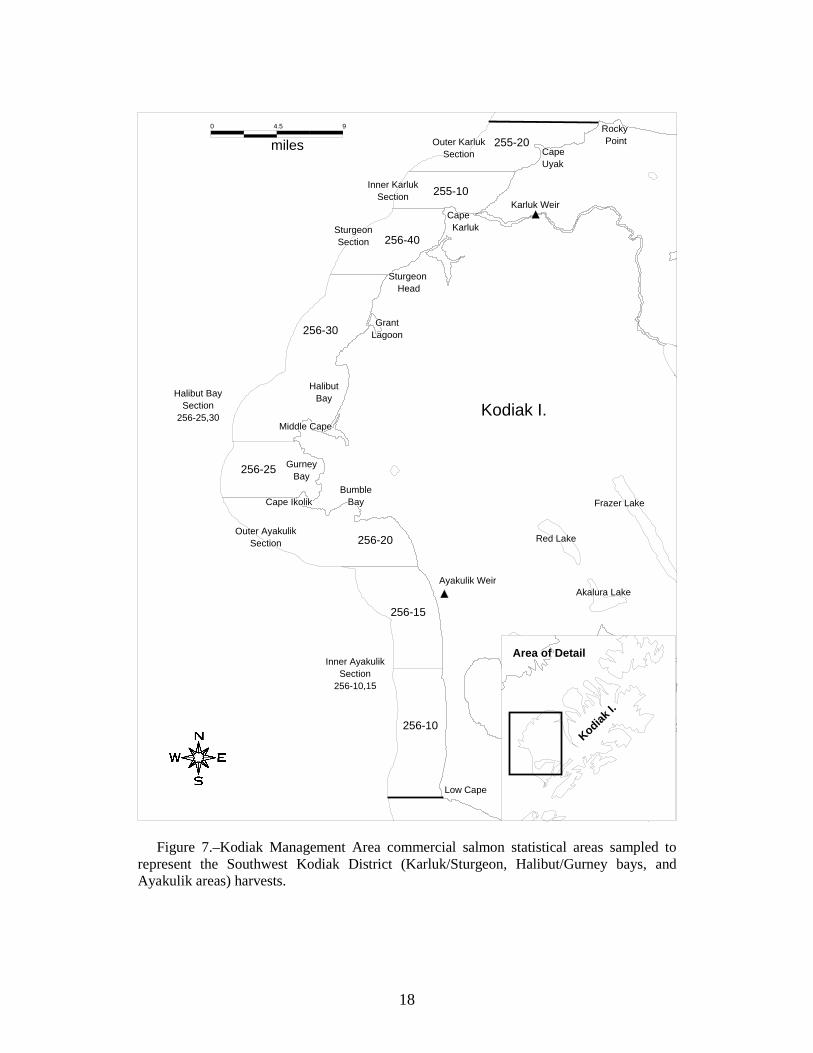
Figure 7.–Kodiak Management Area commercial salmon statistical areas sampled to
represent the Southwest Kodiak District (Karluk/Sturgeon, Halibut/Gurney bays, and Ayakulik areas) harvests.
000000000
milesmilesmilesmilesmilesmilesmilesmilesmiles4.54.54.54.54.54.54.54.54.5 999999999
256-25
256-30
256-20
256-15
256-10
256-40
255-10
255-20
Inner AyakulikInner AyakulikInner AyakulikInner AyakulikInner AyakulikInner AyakulikInner AyakulikInner AyakulikInner AyakulikSectionSectionSectionSectionSectionSectionSectionSectionSection
256-10,15256-10,15256-10,15256-10,15256-10,15256-10,15256-10,15256-10,15256-10,15
Outer AyakulikOuter AyakulikOuter AyakulikOuter AyakulikOuter AyakulikOuter AyakulikOuter AyakulikOuter AyakulikOuter AyakulikSectionSectionSectionSectionSectionSectionSectionSectionSection
Halibut BayHalibut BayHalibut BayHalibut BayHalibut BayHalibut BayHalibut BayHalibut BayHalibut BaySectionSectionSectionSectionSectionSectionSectionSectionSection
256-25,30256-25,30256-25,30256-25,30256-25,30256-25,30256-25,30256-25,30256-25,30
SturgeonSturgeonSturgeonSturgeonSturgeonSturgeonSturgeonSturgeonSturgeonSectionSectionSectionSectionSectionSectionSectionSectionSection
Inner KarlukInner KarlukInner KarlukInner KarlukInner KarlukInner KarlukInner KarlukInner KarlukInner KarlukSectionSectionSectionSectionSectionSectionSectionSectionSection
Outer KarlukOuter KarlukOuter KarlukOuter KarlukOuter KarlukOuter KarlukOuter KarlukOuter KarlukOuter KarlukSectionSectionSectionSectionSectionSectionSectionSectionSection
Kodiak I.Kodiak I.Kodiak I.Kodiak I.Kodiak I.Kodiak I.Kodiak I.Kodiak I.Kodiak I.
Frazer LakeFrazer LakeFrazer LakeFrazer LakeFrazer LakeFrazer LakeFrazer LakeFrazer LakeFrazer Lake
Red LakeRed LakeRed LakeRed LakeRed LakeRed LakeRed LakeRed LakeRed Lake
Akalura LakeAkalura LakeAkalura LakeAkalura LakeAkalura LakeAkalura LakeAkalura LakeAkalura LakeAkalura Lake
Low CapeLow CapeLow CapeLow CapeLow CapeLow CapeLow CapeLow CapeLow Cape
Cape IkolikCape IkolikCape IkolikCape IkolikCape IkolikCape IkolikCape IkolikCape IkolikCape IkolikBumbleBumbleBumbleBumbleBumbleBumbleBumbleBumbleBumble
BayBayBayBayBayBayBayBayBay
Karluk WeirKarluk WeirKarluk WeirKarluk WeirKarluk WeirKarluk WeirKarluk WeirKarluk WeirKarluk Weir
Ayakulik WeirAyakulik WeirAyakulik WeirAyakulik WeirAyakulik WeirAyakulik WeirAyakulik WeirAyakulik WeirAyakulik Weir
GurneyGurneyGurneyGurneyGurneyGurneyGurneyGurneyGurneyBayBayBayBayBayBayBayBayBay
HalibutHalibutHalibutHalibutHalibutHalibutHalibutHalibutHalibutBayBayBayBayBayBayBayBayBay
Middle CapeMiddle CapeMiddle CapeMiddle CapeMiddle CapeMiddle CapeMiddle CapeMiddle CapeMiddle Cape
GrantGrantGrantGrantGrantGrantGrantGrantGrantLagoonLagoonLagoonLagoonLagoonLagoonLagoonLagoonLagoon
SturgeonSturgeonSturgeonSturgeonSturgeonSturgeonSturgeonSturgeonSturgeon Head Head Head Head Head Head Head Head Head
RockyRockyRockyRockyRockyRockyRockyRockyRocky Point Point Point Point Point Point Point Point Point
CapeCapeCapeCapeCapeCapeCapeCapeCape Karluk Karluk Karluk Karluk Karluk Karluk Karluk Karluk Karluk
CapeCapeCapeCapeCapeCapeCapeCapeCapeUyakUyakUyakUyakUyakUyakUyakUyakUyak
Kodiak I.
Kodiak I.
Kodiak I.
Kodiak I.
Kodiak I.
Kodiak I.
Kodiak I.
Kodiak I.
Kodiak I.
Area of DetailArea of DetailArea of DetailArea of DetailArea of DetailArea of DetailArea of DetailArea of DetailArea of Detail
18
19
Figure 8.–Kodiak Management Area commercial salmon statistical areas sampled to represent Special Harvest Areas
(SHA) at Waterfall, Foul, Kitoi, and Spiridon bays.

20
APPENDIX A. ADULT SALMON SAMPLING
21
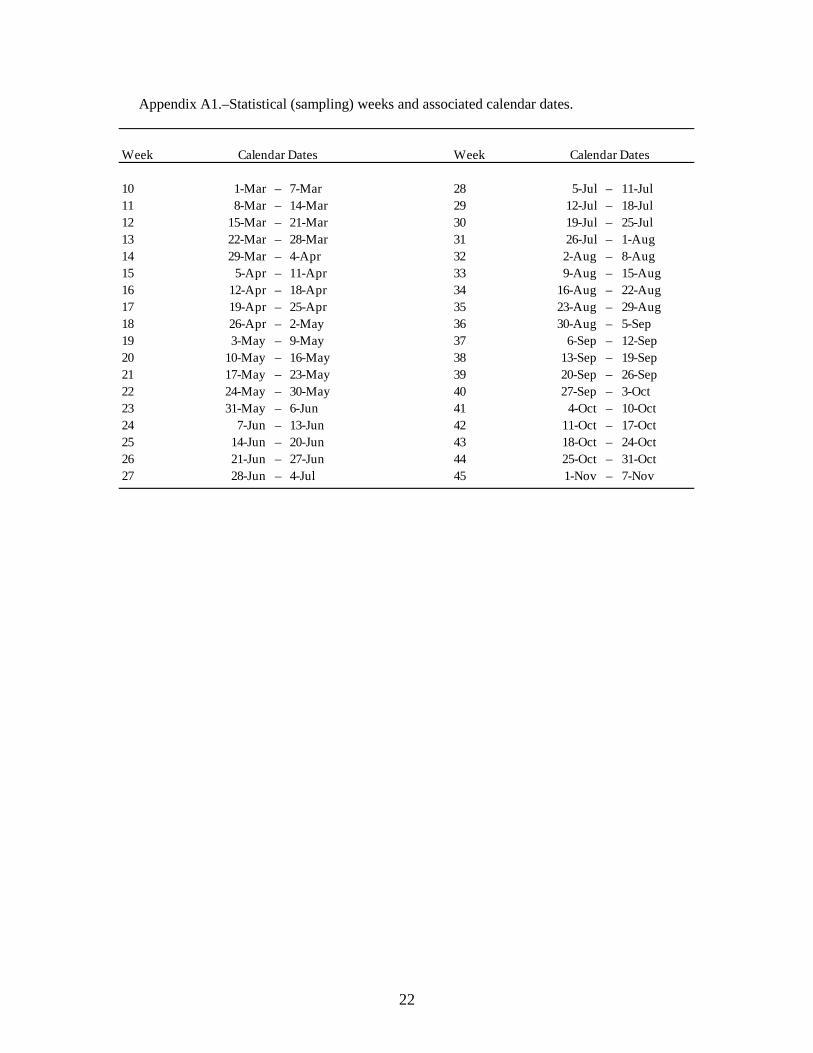
Appendix A1.–Statistical (sampling) weeks and associated calendar dates.
Week Week
10 1-Mar – 7-Mar 28 5-Jul – 11-Jul11 8-Mar – 14-Mar 29 12-Jul – 18-Jul12 15-Mar – 21-Mar 30 19-Jul – 25-Jul13 22-Mar – 28-Mar 31 26-Jul – 1-Aug14 29-Mar – 4-Apr 32 2-Aug – 8-Aug15 5-Apr – 11-Apr 33 9-Aug – 15-Aug16 12-Apr – 18-Apr 34 16-Aug – 22-Aug17 19-Apr – 25-Apr 35 23-Aug – 29-Aug18 26-Apr – 2-May 36 30-Aug – 5-Sep19 3-May – 9-May 37 6-Sep – 12-Sep20 10-May – 16-May 38 13-Sep – 19-Sep21 17-May – 23-May 39 20-Sep – 26-Sep22 24-May – 30-May 40 27-Sep – 3-Oct23 31-May – 6-Jun 41 4-Oct – 10-Oct24 7-Jun – 13-Jun 42 11-Oct – 17-Oct25 14-Jun – 20-Jun 43 18-Oct – 24-Oct26 21-Jun – 27-Jun 44 25-Oct – 31-Oct27 28-Jun – 4-Jul 45 1-Nov – 7-Nov
Calendar Dates Calendar Dates
22
Appendix A2.–Procedure for sampling adult salmon age, length, and sex.
SAMPLING PROCEDURES Place the salmon flat on its right side (the head should be toward the left).
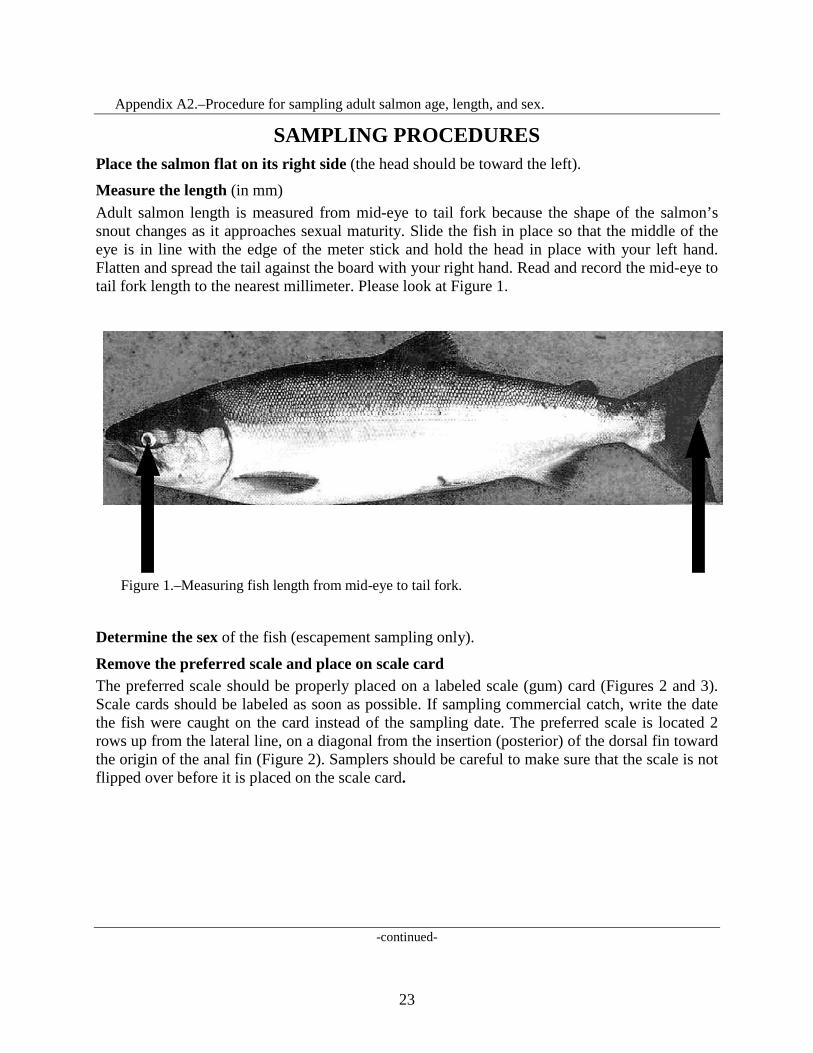
Measure the length (in mm) Adult salmon length is measured from mid-eye to tail fork because the shape of the salmon’s snout changes as it approaches sexual maturity. Slide the fish in place so that the middle of the eye is in line with the edge of the meter stick and hold the head in place with your left hand. Flatten and spread the tail against the board with your right hand. Read and record the mid-eye to tail fork length to the nearest millimeter. Please look at Figure 1.
Figure 1.–Measuring fish length from mid-eye to tail fork.
Determine the sex of the fish (escapement sampling only).
Remove the preferred scale and place on scale card The preferred scale should be properly placed on a labeled scale (gum) card (Figures 2 and 3). Scale cards should be labeled as soon as possible. If sampling commercial catch, write the date the fish were caught on the card instead of the sampling date. The preferred scale is located 2 rows up from the lateral line, on a diagonal from the insertion (posterior) of the dorsal fin toward the origin of the anal fin (Figure 2). Samplers should be careful to make sure that the scale is not flipped over before it is placed on the scale card.
-continued-
23
Appendix A2.–Page 2 of 11.
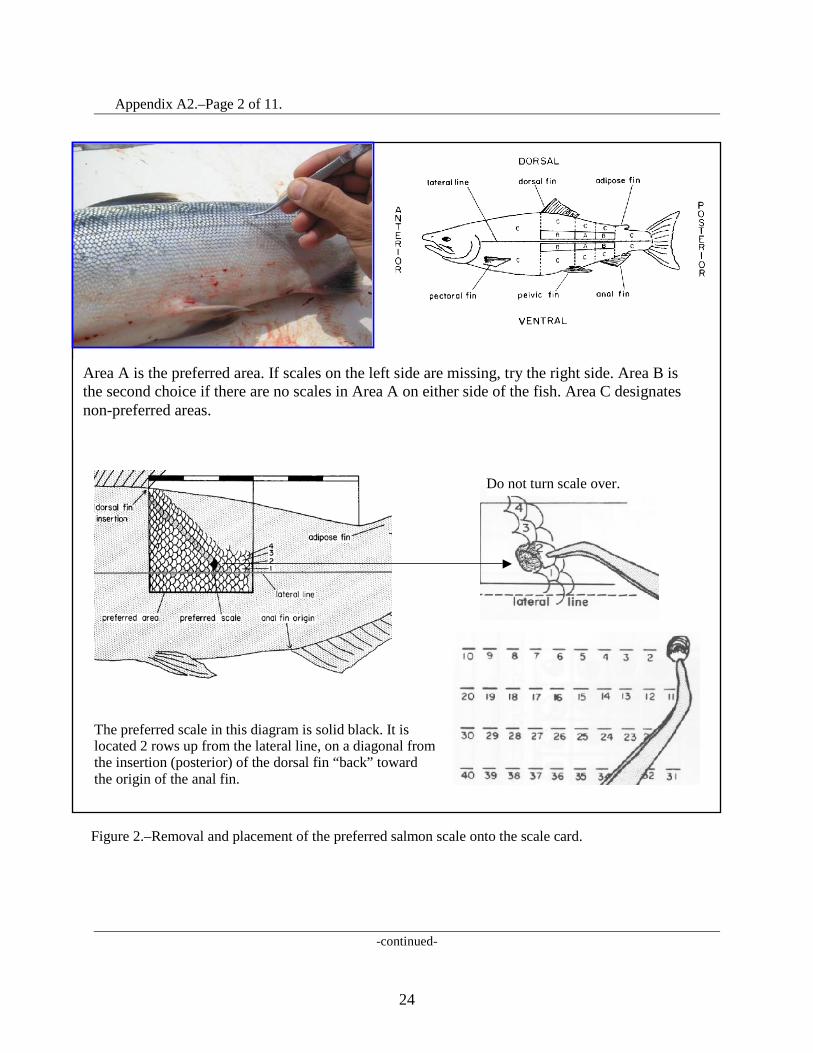
Figure 2.–Removal and placement of the preferred salmon scale onto the scale card.
-continued-
The preferred scale in this diagram is solid black. It is located 2 rows up from the lateral line, on a diagonal from the insertion (posterior) of the dorsal fin “back” toward the origin of the anal fin.
Do not turn scale over.
Area A is the preferred area. If scales on the left side are missing, try the right side. Area B is the second choice if there are no scales in Area A on either side of the fish. Area C designates non-preferred areas.
24
Appendix A2.–Page 3 of 11.
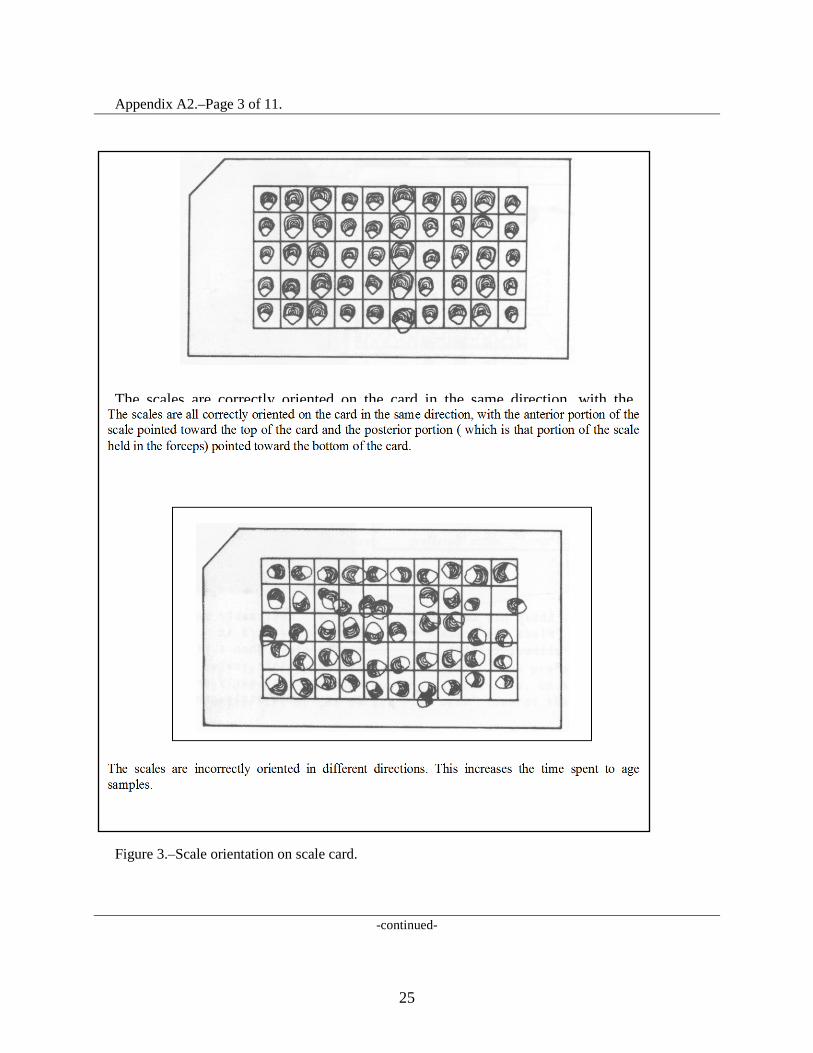
Figure 3.–Scale orientation on scale card.
-continued-
The scales are correctly oriented on the card in the same direction, with the anterior portion of the scale pointed toward the top of the card and the posterior portion (the portion of the scale held in the forceps) pointed toward the bottom of the card.
The scales are incorrectly oriented in different directions. This increases the time spend to age samples.
25
Appendix A2.–Page 4 of 11.
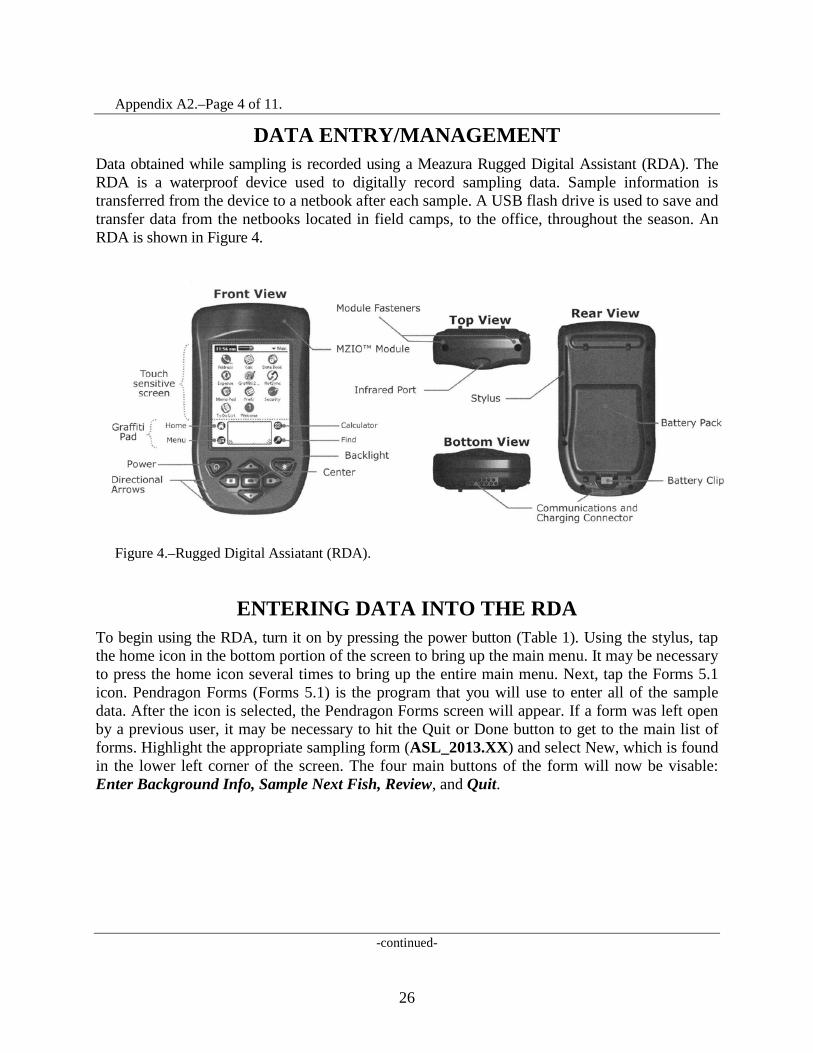
DATA ENTRY/MANAGEMENT Data obtained while sampling is recorded using a Meazura Rugged Digital Assistant (RDA). The RDA is a waterproof device used to digitally record sampling data. Sample information is transferred from the device to a netbook after each sample. A USB flash drive is used to save and transfer data from the netbooks located in field camps, to the office, throughout the season. An RDA is shown in Figure 4.
Figure 4.–Rugged Digital Assiatant (RDA).
ENTERING DATA INTO THE RDA To begin using the RDA, turn it on by pressing the power button (Table 1). Using the stylus, tap the home icon in the bottom portion of the screen to bring up the main menu. It may be necessary to press the home icon several times to bring up the entire main menu. Next, tap the Forms 5.1 icon. Pendragon Forms (Forms 5.1) is the program that you will use to enter all of the sample data. After the icon is selected, the Pendragon Forms screen will appear. If a form was left open by a previous user, it may be necessary to hit the Quit or Done button to get to the main list of forms. Highlight the appropriate sampling form (ASL_2013.XX) and select New, which is found in the lower left corner of the screen. The four main buttons of the form will now be visable: Enter Background Info, Sample Next Fish, Review, and Quit.
-continued-
26
Appendix A2.–Page 5 of 11.
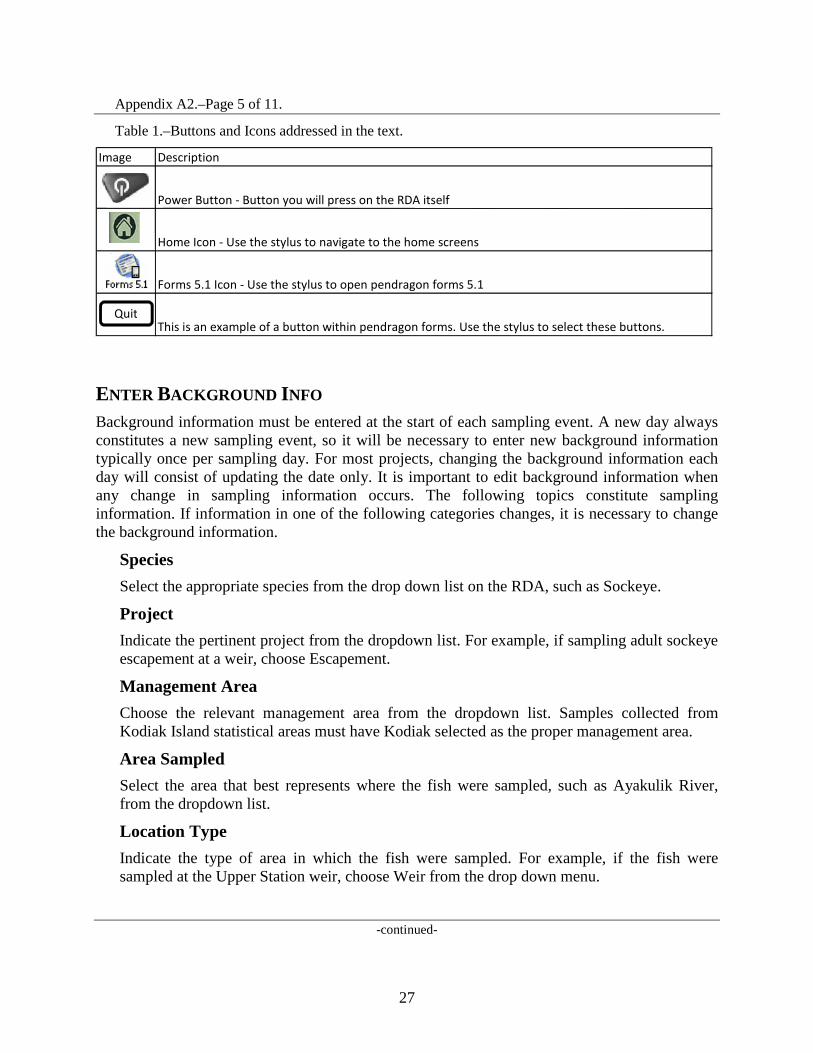
Table 1.–Buttons and Icons addressed in the text.
ENTER BACKGROUND INFO Background information must be entered at the start of each sampling event. A new day always constitutes a new sampling event, so it will be necessary to enter new background information typically once per sampling day. For most projects, changing the background information each day will consist of updating the date only. It is important to edit background information when any change in sampling information occurs. The following topics constitute sampling information. If information in one of the following categories changes, it is necessary to change the background information.
Species Select the appropriate species from the drop down list on the RDA, such as Sockeye.
Project Indicate the pertinent project from the dropdown list. For example, if sampling adult sockeye escapement at a weir, choose Escapement.
Management Area Choose the relevant management area from the dropdown list. Samples collected from Kodiak Island statistical areas must have Kodiak selected as the proper management area.
Area Sampled Select the area that best represents where the fish were sampled, such as Ayakulik River, from the dropdown list.
Location Type Indicate the type of area in which the fish were sampled. For example, if the fish were sampled at the Upper Station weir, choose Weir from the drop down menu.
-continued-
Image Description
Power Button - Button you will press on the RDA itself
Home Icon - Use the stylus to navigate to the home screens
Forms 5.1 Icon - Use the stylus to open pendragon forms 5.1
This is an example of a button within pendragon forms. Use the stylus to select these buttons. Quit
27
Appendix A2.–Page 6 of 11.
Gear Select the type of gear in which the fish were caught, such as Trap.
Type of Length Measurement Designate the type of length measurement taken. Adult salmon lengths are typically measured from mid-eye to tail fork.
Date of Sample Escapement sampling: Use the date the fish are sampled.
Catch sampling: Use the date the fish were caught, even if this differs from the sample date.
Sampler Initials Enter the initials of the sampling crew (up to 3 persons). This can be done by writing in the box on the bottom of the screen, or by using the pop up keyboard.
Notes 1. When entering text, tap on the dot by the abc icon to bring up a keyboard. 2. To delete a character, place the stylus in the text box and draw a small straight line from
right to left.
SAMPLE NEXT FISH: After entering background information, the RDA is ready to collect individual fish data. The Sample Next Fish button is used to enter the details of each fish sampled. It is not necessary to click on the Sample Next Fish button when entering the first fish of a new sample. After entering the background information, the form automatically knows to go to the sample next fish section of the form. As you continue to sample, simply tap Sample Next Fish or Next to enter individual fish data. This option is used when continuing to the next fish of a sample where no background information has changed. Fish data that is entered here is associated with the current background information logged. The following constitute fish data and should be entered for each fish.
Scale Card Number Scale (gum) cards are numbered sequentially by date throughout the season starting with 1. A separate numbering sequence will be used for each species or major location change. Consult your crew leader for the current card number. It is crucial to make sure the number written on the scale card matches the scale card number entered into the RDA. The Scale card number will automatically advance to the next number after fish number 40 is recorded.
Fish Number The fish number is the number of the fish on a particular scale card. This must be a number between 1 and 40. By default, the fish number in the RDA will automatically advance after each fish is sampled. It will also automatically go from 40 to 1.
-continued-
28
Appendix A2.–Page 7 of 11.
Sex Select the sex of the fish.
Length in mm Enter the length of the fish from mid-eye to tail fork in millimeters (i.e., 534). If for some reason you do not collect a length measurement, enter 999.
Fin Clip and Tag Color Select the Skip Fin Clip and Tag Color button if appropriate. If sampling involves fin clips or tags you can enter the optional fin clip and tag information. Indicate the type of fin clip (e.g., axillary process) or tag color using the drop down menus.
Sample Next Fish Select Sample Next Fish to continue sampling.
REVIEW The review button can be a very useful tool during sampling. It can be used to ensure data being entered is accurate, or it can be used for editing fish data during a sample. The review portion of the form displays card number, fish number, sex, and length. The most recently sampled fish appear first. To enter the review screen, tap on the Review button on the main screen of the form. After the data has been reviewed and edited, tap the Done button on the bottom right of the screen to return to the main screen of the form. If Sample Next Fish is selected after leaving the review screen, the auto-increment will continue as if the review screen was never entered.
Reviewing Data To review the last data entered, tap the Review button on the main screen of the form. Use the scroll bar on the right side of the screen to look at the fish that have been entered.
Editing Data If fish data needs to be edited, tap on it using the stylus. Tap on the Sample Next Fish button to go through the fish data that was previously entered for that fish. Changes can be made as needed. Buttons chosen prior to the review are highlighted with asterisks. After a fish has been edited, the main review screen appears. If a fish is accidently selected from the main review screen, click the button that has the Card#-Fish# to return to the main review screen without going through the fish data. As mentioned above, tap Done to exit the review portion of the form and return to the main screen.
QUIT When sampling is complete, tap Quit to exit the form.
-continued-
29
Appendix A2.–Page 8 of 11.
DATA MANAGEMENT After sampling is done for the day, it is required that the data be backed up on the RDA itself, and then transferred (by HotSync) to the netbook.
BACKING UP DATA After each sample the RDA should be backed up so that data is stored on both of the compact flash drives. Turn the RDA on and tap the home icon in the bottom portion of the screen to bring up the main menu. Tap the CardBkup icon if it is present and then the Backup Now button at the top left of the screen. The data will now be on both flash drives. If the RDA does not have a CardBkup icon, it will back up automatically.
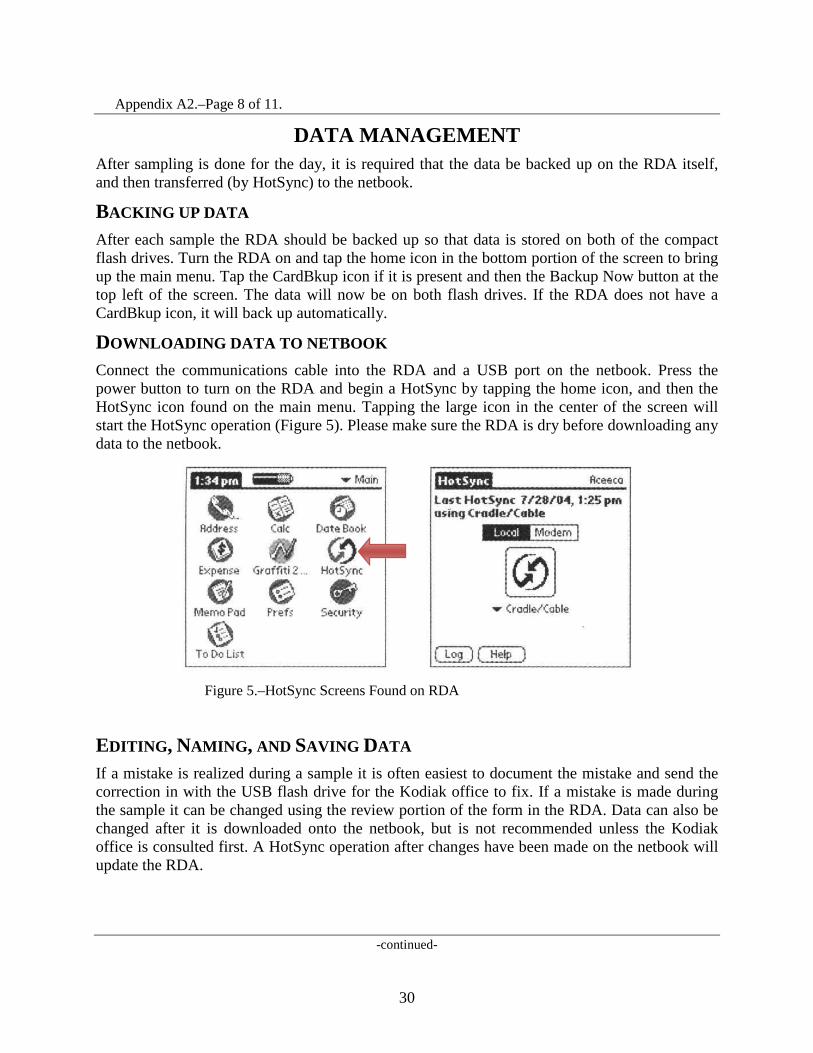
DOWNLOADING DATA TO NETBOOK Connect the communications cable into the RDA and a USB port on the netbook. Press the power button to turn on the RDA and begin a HotSync by tapping the home icon, and then the HotSync icon found on the main menu. Tapping the large icon in the center of the screen will start the HotSync operation (Figure 5). Please make sure the RDA is dry before downloading any data to the netbook.
Figure 5.–HotSync Screens Found on RDA
EDITING, NAMING, AND SAVING DATA If a mistake is realized during a sample it is often easiest to document the mistake and send the correction in with the USB flash drive for the Kodiak office to fix. If a mistake is made during the sample it can be changed using the review portion of the form in the RDA. Data can also be changed after it is downloaded onto the netbook, but is not recommended unless the Kodiak office is consulted first. A HotSync operation after changes have been made on the netbook will update the RDA.
-continued-
30
Appendix A2.–Page 9 of 11.
To view data, HotSync the RDA and open Pendragon Forms Manager (a shortcut should be located to the right of the start menu) on the netbook. Select the form (ASL_2013.XX), and click Edit/View under Data Functions on the right side of the window. All data will now be visible. Make the necessary changes here and exit out of the window to save. It is important to correct the numbers under the proper column and consult the Kodiak office. Hotsync the RDA to the netbook after any changes are made on the netbook to update the RDA with all changes.
After data has been edited and verified, a copy of the database will need to be exported from the Pendragon software and saved on the netbook. In Pendragon Forms Manager, under Data Functions on the right side of the window, click To ASCII. Navigate to the folder in which the data is being saved. Type in the file name and then save. The file name should follow this format: Area_Sampled_YYYYMMDD.csv (e.g., Afognak_River_20130614.csv). After saving, a window will pop up stating the file has been created. Each .csv file will contain all of the data that has been collected up to that point in the season. Do not edit or save the .csv file as an Excel file or it will be difficult or impossible to upload the data into the database.
TRANSFERRING DATA FROM NETBOOK ONTO USB FLASH DRIVE Up to date data should be sent into the main office as often as possible (e.g., with the grocery plane). Insert a USB flash drive into an appropriate port on the netbook. Double click on MyComputer, which is found on the desktop of the netbook. Navigate to the folder where your data is saved and highlight the most recent file (determined by the date) by single clicking. With the file highlighted, click on edit at the top of the window and then copy. Open up MyComputer and double click on the USB flash drive (often called Removable Disk) found under the heading Devices with Removable Storage. Click on edit at the top of the window, and then paste. The .csv file that was copied earlier will appear in the window indicating it was copied to the flash drive. Exit out of all windows and single click on the safely remove hardware button on the bottom right corner of the desktop in the quick start menu. Click on Safely remove USB Mass Storage Device. A pop-up will verify that it is now safe to remove the flash drive from the system.
POWERING THE NETBOOK AND RDA 1. The RDA can be charged with either the AC or DC powering options. It is the crew leaders
responsibility to keep it charged 2. The netbook can only be charged with the AC power adaptor, therefore plan accordingly for
generator use. The charging light on the netbook is red when charging, and green when fully charged.
3. If there are powering problems, please contact the office immediately.
-continued-
31
Appendix A2.–Page 10 of 11.
SOME NOTES AND REMINDERS 1. Connect the AC adaptor to the bottom of the communications cable to charge the RDA
batteries. If using the DC charger, connect the charger into the communications port.
2. If a mistake is noticed before moving onto the next fish, the previous button can be used to make changes in the RDA without having to go to the review screen or alter the data on the netbook.
3. Each length, sex, and scale must correspond to a single fish! It is the responsibility of the crew leader to be sure the data has been entered correctly.
4. For greater efficiency in scale reading, mount scales with anterior end toward top of gum card (Figure 3).
5. Never put data from different dates onto one gum card, and always enter new background information. Even if only one scale is collected that day, enter new background information and begin a new gum card the next day.
6. Be careful when collecting and mounting scales in wet conditions (rain, high humidity, etc.). If glue dries on top of the scale, it often obscures scale features, resulting in an unreadable scale. In addition, scales frequently adhere poorly to a wet gum card. Protect the cards and keep them dry to avoid having to remount the scales on a new card. If the cards get wet, try to dry them in a protected area or remount if necessary. Use a pencil when filling out gum cards, because ink will come off during pressing.
7. Responsibility for accuracy lies first with the primary data collector(s) and finally with the crew leader. Sloppy or incomplete data or gum cards will be returned to individual collectors for correction.
8. Ensure that all equipment is well kept. Electronics should be stored in a clean safe place. Dry off the RDA with a paper towel after sampling events. The RDA must be dry before transferring data to the netbook. RDA batteries must be charged to make certain sampling is not hampered. It is the responsibility of the crew leader to make sure that all data is carefully examined and edited before returning it to their supervisor.
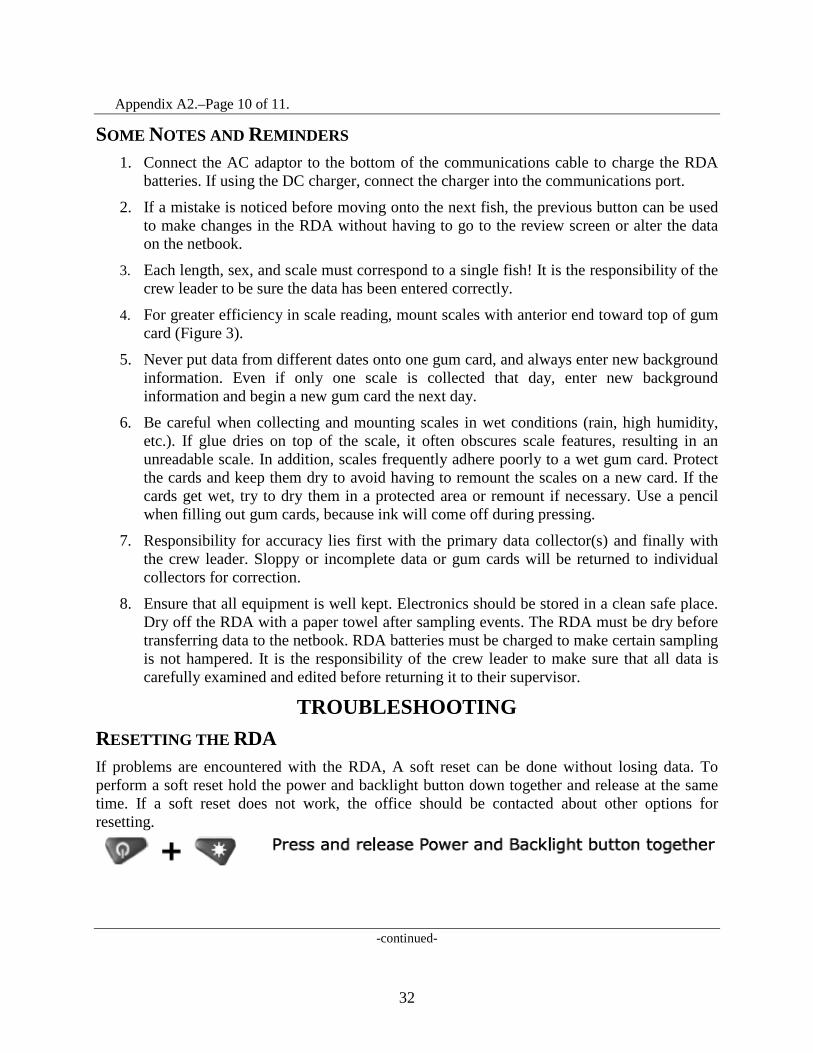
TROUBLESHOOTING RESETTING THE RDA If problems are encountered with the RDA, A soft reset can be done without losing data. To perform a soft reset hold the power and backlight button down together and release at the same time. If a soft reset does not work, the office should be contacted about other options for resetting.
-continued-
32
Appendix A2.–Page 11 of 11.
HOTSYNC ERROR MESSAGE HotSync message includes "Exceeded user storage space limit of 500KB in form 'ASL_ #.##'
1. Open Pendragon Forms Manager 2. Under Form Function click on "Properties" 3. Click on "Advanced Properties" 4. Click on the "Synchronization Tab" 5. Change the Storage Limit (KB) to 5000 instead of 500. 6. Click "OK" 7. Under Form Functions Click on "Distribute" 8. Hotsync the RDA and the Netbook
33