Embed Size (px)
Citation preview
Water Quality monitoring program and activities inMyanmar
1. INTRODUCTIONToday many countries over the world face the crisis of having decreasing water resources, shortage of drinking water, and impact on natural environment. Water is vital to the existence of all living organisms, but this valued resource is increasingly being threatened as human populations grow and demand more water of high quality for domestic purposes and economic activities. Water abstraction for domestic use, agricultural production, mining, industrial production, power generation, and forestry practices can lead to deterioration in water quality. The international community has recognized the important links between ecosystem and human health and well- being, particularly as human populations expand and place ever greater pressures on natural environments.
2. STUDY AREA
LocationYangon city is situated between Latitude at 16°48' North, 96°09' East . The area of Yangon city ; urban is 231.18 sq mi (598.75 km2), metro is 3,930 sq mi (10,170 km2). The population of Yangon city is about 11,207, 500 in 2013 estimate.Topography
Yangon is located in Lower Myanmar at the convergence of the Yangon and Bago Rivers about 30 km(19 mi)away from the Gu lf of M artab a n .Its standard time zone is UTC/GMT +6:30 hours.
Name of site SiteClassification
Latitude Longitude site Category
Yangon (Kaba-Aye) Urban 16.5˚ N 96.11˚ E Wet Depositionand Dry
Deposition
3.WATER QUALITY MONITORING, MYANMAR
Existing Laws and PoliciesPolicy for:(1) Agricultural Sector(2) Irrigation development and efficient utilization of nation’s water resources(3) Watershed conservation(4) National Environment policy(5) Environmental health(6) Water resources management
Law for;
The first law on water pollution, the penal code was enacted in 1860
Most of existing laws and legislations were enacted before the year 2000
Conservation of Water Resources and River Law was enacted in October 2006 and Environmental ConservationLaw was enacted in March 2012
No specific Water Law – Myanmar water professionals are drafting at present
Existing Institutional Structure
Sr Agency1 Department of Meteorology and
Hydrology (DMH
2 Irrigation Department (ID)
3 Department of HydroelectricPower (DHP)
4 Factories5 Department of Health
6 City Development committee
7 Department of DevelopmentAffairs( DDA)
8 Water Resources Utilization Department (WRUD)
9 DWIR10 Forest Department
11 Myanmar Fishery Enterprise
12 Department of Human Settlementand Housing Development
13 Myanmar Engineering Society
14 Technology University15 Department of Environmental
conservation16 The township
Ministry
Ministry of transport
Ministry of Agriculture andIrrigationMinistry of Electric Power
Ministry of IndustryMinistry of Health
Yangon/ Mandalay/ Napyitaw City Development committee Ministry of Progress of BorderAreas and National Races and Development AffairsMinistry of Agriculture andIrrigationMinistry of Transport Ministry of Environmentalconservation and forestoryMinistry of Livestock Breedingand FisheriesMinistry of Construction
Ministry of Construction
Ministry of Science and TechnologyMinistry of Environmentalconservation and Forestry
FunctionsWater assessment of major rivers,Data collotion & analysing, Monitoring Acid Deposition Provision of Irrigation water to FarmlandHydropower Generation
Industrial use, water treatment Environmental Health, Water QualityAssessment and Control, Monitoring Water QualityCity water supply and sanitation,Water conservation and protection worksDomestic and rural water supply and sanitation
Pump Irrigation and Rural water supply
River training and Navigation Reforestation and Conservation of Forest,aforestation and watershed management Fishery works, monitoring and controllingwater bodyDomestic Water Supply
Water resources management related activities, especially consultation Training and Research Environmental conservation andmanagementOrganizing the water needs, Conservancyneeds
In Department of Meteorology and Hydrology(DMH)The rapid industrialization in the East Asian countries has helped in achieving economic growth. Along withindustrialization, energy consumption such as coal, oil and natural gas has also rapidly increased in East Asia.The combustion of these fossil fuels is the main source of air pollutants such as HNO
3, H
2SO
4. The emission
of air pollutants will increase, if there is no proper management to control it efficiently. For this reason there is aneed for a better understanding in these problems in Myanmar. To protect the country from the acid depositionproblem, it is required to monitor the state of acid deposition in the country. So, Myanmar had joined AcidDeposition Monitoring Network in East Asia (EANET) in November 2005. After Myanmar became membercountry of EANET, Department of Meteorology and Hydrology (DMH) is designated as National Center forEANET.
Monitoring Parameters and Method for wet deposition and Dry Deposition
Monitoring Parameters MethodWet Deposition Dry Deposition
Electric Conductivity(EC) - Conductivity cell MethodpH - Glass electrode MethodCl-, NO
3 -, SO
42- Cl-, NO
3 -, SO
42- Ion chromatography
(preferably with suppressor)NH
4+, Na+, K+, Ca2+, Mg2+ NH
4+, Na+, K+, Ca2+, Mg2+ Ion chromatography
3.1. In other departmentsApart from DMH, there are some governmental agencies such as: Yangon/ Mandalay City DevelopmentCommittee, Department of Health, Department of Atomic Energy, Irrigation Department, Water ResourcesUtilization Department etc., which monitor water and air qualities. Environmental ConservationDepartment also installed the PM
2.5 for air concentration in 2014. Regarding acid deposition monitoring,
wet and dry deposition have been monitored. The National Center will seek the possible opportunitiesto extend the inland aquatic monitoring to follow the examples of other participating countries of EANET.
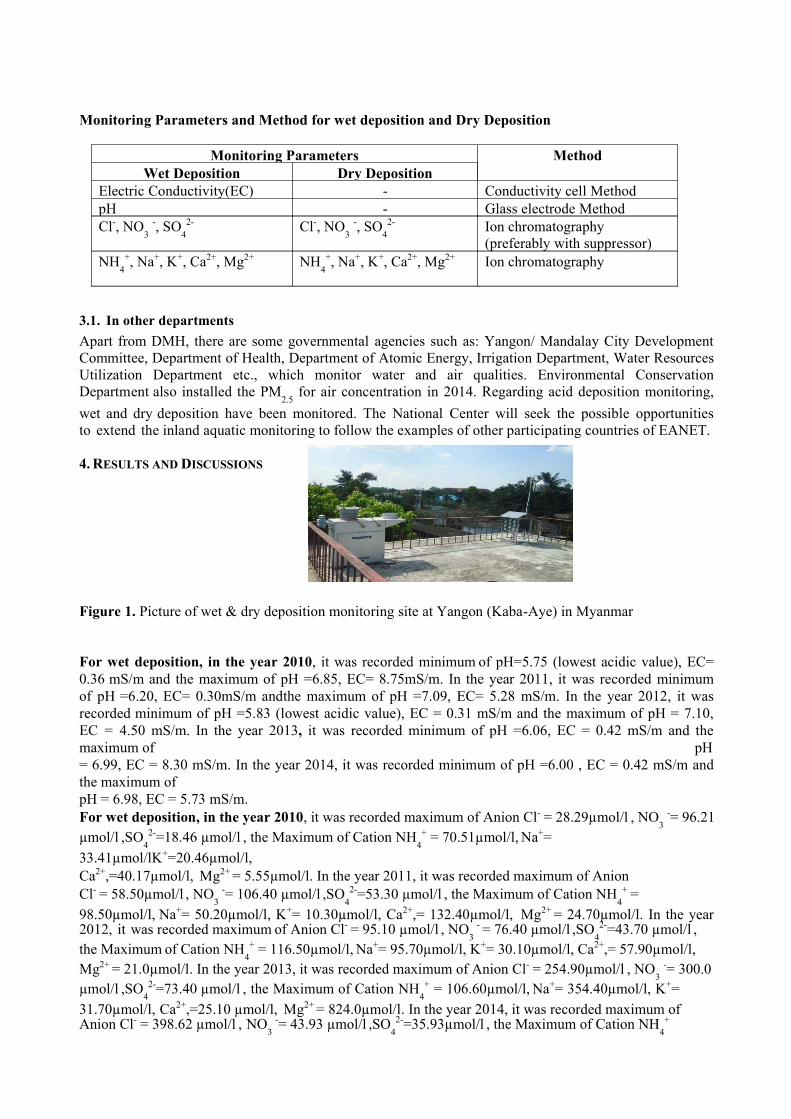
4. RESULTS AND DISCUSSIONS
Figure 1. Picture of wet & dry deposition monitoring site at Yangon (Kaba-Aye) in Myanmar
For wet deposition, in the year 2010, it was recorded minimum of pH=5.75 (lowest acidic value), EC=0.36 mS/m and the maximum of pH =6.85, EC= 8.75mS/m. In the year 2011, it was recorded minimumof pH =6.20, EC= 0.30mS/m andthe maximum of pH =7.09, EC= 5.28 mS/m. In the year 2012, it wasrecorded minimum of pH =5.83 (lowest acidic value), EC = 0.31 mS/m and the maximum of pH = 7.10,EC = 4.50 mS/m. In the year 2013, it was recorded minimum of pH =6.06, EC = 0.42 mS/m and themaximum of pH= 6.99, EC = 8.30 mS/m. In the year 2014, it was recorded minimum of pH =6.00 , EC = 0.42 mS/m andthe maximum ofpH = 6.98, EC = 5.73 mS/m.For wet deposition, in the year 2010, it was recorded maximum of Anion Cl- = 28.29µmol/l , NO
3 -= 96.21
µmol/l ,SO4
2-=18.46 µmol/l , the Maximum of Cation NH4+ = 70.51µmol/l, Na+=
33.41µmol/lK+=20.46µmol/l,Ca2+,=40.17µmol/l, Mg2+ = 5.55µmol/l. In the year 2011, it was recorded maximum of AnionCl- = 58.50µmol/l , NO
3 -= 106.40 µmol/l ,SO
42-=53.30 µmol/l , the Maximum of Cation NH
4+ =
98.50µmol/l, Na+= 50.20µmol/l, K+= 10.30µmol/l, Ca2+,= 132.40µmol/l, Mg2+ = 24.70µmol/l. In the year2012, it was recorded maximum of Anion Cl- = 95.10 µmol/l , NO
3 - = 76.40 µmol/l ,SO
42-=43.70 µmol/l ,
the Maximum of Cation NH4+ = 116.50µmol/l, Na+= 95.70µmol/l, K+= 30.10µmol/l, Ca2+,= 57.90µmol/l,
Mg2+ = 21.0µmol/l. In the year 2013, it was recorded maximum of Anion Cl- = 254.90µmol/l , NO3
-= 300.0 µmol/l ,SO
42-=73.40 µmol/l , the Maximum of Cation NH
4+ = 106.60µmol/l, Na+= 354.40µmol/l, K+=
31.70µmol/l, Ca2+,=25.10 µmol/l, Mg2+ = 824.0µmol/l. In the year 2014, it was recorded maximum of Anion Cl- = 398.62 µmol/l , NO
3 -= 43.93 µmol/l ,SO
42-=35.93µmol/l , the Maximum of Cation NH
4+

=304.82 µmol/l, Na+= 47.24 µmol/l, K+=527.70 µmol/l, Ca2+,=197.48 µmol/l, Mg2+ = 38.26 µmol/l
For dry deposition, in the year 2012, it was recorded maximum of Anion Cl- = 41.nmole/m3 , NO3
- =56.0nmole/m3,SO
42-=118.68 nmole/m3, the Maximum of Cation NH
4+ = 75.17 nmole/m3, Na+= 79.64
nmole/m3, K+= 65.30 nmole/m3, Ca2+,= 80.4 nmole/m3 5, Mg2+ = 13.06 nmole/m3. In the year 2013, itwas recorded maximum of Anion Cl- = 44.29 nmole/m3, NO
3 -= 23.00 nmole/m3 ,SO
42-=90.17 nmole/m3
, the Maximum of Cation NH4+ = 90.42 nmole/m3, Na+= 54.76 nmole/m3, K+= 23.02 nmole/m3,
Ca2+,=24.69 nmole/m3, Mg2+ = 6.94 nmole/m3. In the year 2014, it was recorded maximum of Anion Cl- =68.62 nmole/m3 , NO
3 -= 10.35 nmole/m3 ,SO
42-=210.75 nmole/m3 , the Maximum of Cation NH
4+ =167.68
nmole/m3, Na+= 59.46 nmole/m3, K+=123.64 nmole/m3, Ca2+,=171.83 nmole/m3, Mg2+ = 33.10 nmole/m3.
By the analysis of water quality monitoring in Myanmar, among the observed data (rain water sample)from Yangon (Kaba-Aye) urban site, minimum pH value for 2010 and 2012 were 5.75 and 5.83respectively; most of the measured pH values throughout the year were between 6 and 7, which is withinthe desirable range for drinking water from national drinking water quality standard (6.5 -8.5) andMaximum permissible range of WHO standard (6.5 -9.2).Regarding the value of EC, the maximum of8.75 mS/m was recorded on 27 May 2010 but it is under the acceptable level. It was the early monsoonseason in 2010, and there could be some contaminants in that rain water sample. Meteorological datasuch as wind direction, wind speed, temperature, humidity and sunshine hours are also observed togetherwith precipitation at the site. From the data recorded in 2010 to 2014, the overall analysis describes theaverage concentrations of pH and EC receptivity, which are still within the acceptable levels. Most of theanalysis ions values throughout the year were under maximum permissible value which are also still withinthe acceptable level.
5. CONCLUSIONS
Hence, it can be generally concluded that acid deposition is not significant in Myanmar. Based onmonitoring results of Acid deposition from 2010 to 2014, the status of Yangon rain is not acidic andits negative impacts have not yet been identified in Myanmar.
AcknowledgementsI would like to express my sincere thanks to The UNESCO-IHP international Initiative on Water Quality, who invited me to attend the IHP Scientific Meeting on Water Quality in Kyoto and Dr. Hrin Nei Thiam, Director General of Department of Meteorology and Hydrology (D.M.H) for her kind permission to attend this meeting and their encouragement support to prepare this paper in partial fulfillment for UNESCO International Scientific Symposium.
REFERENCES:1. Acid Deposition Monitoring Network in East Asia: 2000, Technical Documents for Acid Deposition
Monitoring in East Asia.2. Network Center for EANET: Periodic Report on the State of Acid Deposition in East Asia3. Network Center for EANET: 2002, Data Reporting, Data Quality Assessment, and Data Treatment of
Wet Deposition Monitoring for EANET Textbook.4. Acid Deposition Monitoring Network in East Asia: FACT SHEETS5. Water Quality for human Ecosystem and Human Health
APPENDIX A. METEOROLOGICAL DATA
Monthly means Meteorological Data at Yangon (Kaba-Aye) in 2010 -2014
A.1. PH, EC, IONS ANALYSIS DATA
Ms KHin Sein KyiIn charge of laboratory, Water Quality DivisionDepartment of Meteorology and Hydrology ,Ministry of Transport, Nay Pay Taw.