Embed Size (px)
Citation preview
ADS Fundamentals - 2009
LAB 4: AC Simulations
Overview‐Thislabcontinuestheamp_1900projectandusesthesamesub‐circuitasthepreviouslab.ThisexerciseteachesthebasicsofACsimulation,includingsmallsignalgainandnoise.Italsoshowsmanydetailedfeaturesofthedatadisplayforcontrollingandmanipulatingdata.
OBJECTIVES • PerformACsmallsignalandnoisesimulations.
• Adjustpin/wirelabels.
• Sweepvariablesandwriteequations.
• Controlplots,traces,datasets,andACsources.
©CopyrightAgilentTechnologies2009
Lab 4: AC Simulations
4‐2©CopyrightAgilentTechnologies2009
Table of Contents
1. Copy & Paste (Ctrl+C / Ctrl+V) from one design to another. ...............................3
2. Modify the copied circuit and pin labels. ..............................................................4
3. Push and pop to verify the sub circuit..................................................................5
4. Set up an AC simulation with Noise. ...................................................................5
5. Simulate and list the noise data...........................................................................5
6. Control the output of equations and node voltages. ............................................6
7. Simulate without noise.........................................................................................7
8. Write a data display equation using a measurement equation............................7
9. Work with measurement and data display equations. .........................................8
10. Plot the phase and group delay for the ac analysis data .................................9
11. Variable Info and the what function................................................................10
12. OPTIONAL - Sweep Vcc (as if the battery voltage is decreasing).................11
Lab 4: AC Simulations
4‐3©CopyrightAgilentTechnologies2009
PROCEDURE
1. Copy&Paste(Ctrl+C/Ctrl+V)fromonedesigntoanother.
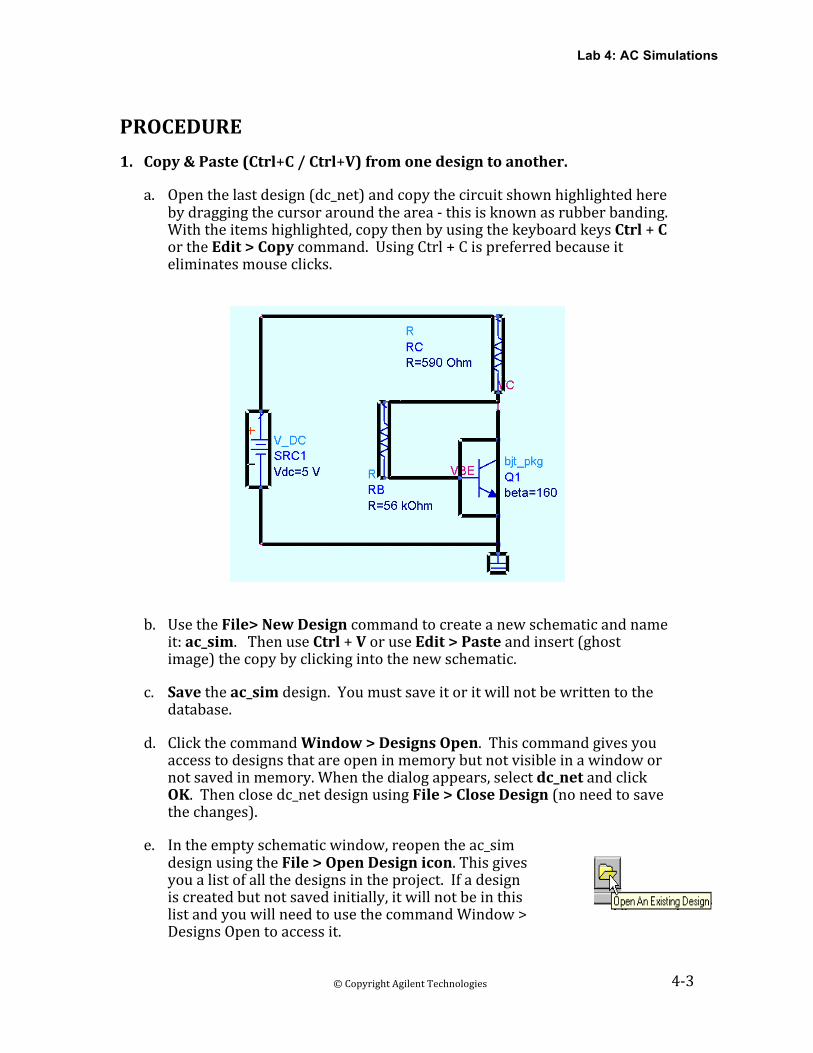
a. Openthelastdesign(dc_net)andcopythecircuitshownhighlightedherebydraggingthecursoraroundthearea‐thisisknownasrubberbanding.Withtheitemshighlighted,copythenbyusingthekeyboardkeysCtrl+CortheEdit>Copycommand.UsingCtrl+Cispreferredbecauseiteliminatesmouseclicks.
b. UsetheFile>NewDesigncommandtocreateanewschematicandnameit:ac_sim.ThenuseCtrl+VoruseEdit>Pasteandinsert(ghostimage)thecopybyclickingintothenewschematic.
c. Savetheac_simdesign.Youmustsaveitoritwillnotbewrittentothedatabase.
d. ClickthecommandWindow>DesignsOpen.Thiscommandgivesyouaccesstodesignsthatareopeninmemorybutnotvisibleinawindowornotsavedinmemory.Whenthedialogappears,selectdc_netandclickOK.Thenclosedc_netdesignusingFile>CloseDesign(noneedtosavethechanges).
e. Intheemptyschematicwindow,reopentheac_simdesignusingtheFile>OpenDesignicon.Thisgivesyoualistofallthedesignsintheproject.Ifadesigniscreatedbutnotsavedinitially,itwillnotbeinthislistandyouwillneedtousethecommandWindow>DesignsOpentoaccessit.
Lab 4: AC Simulations
4‐4©CopyrightAgilentTechnologies2009
2. Modifythecopiedcircuitandpinlabels.
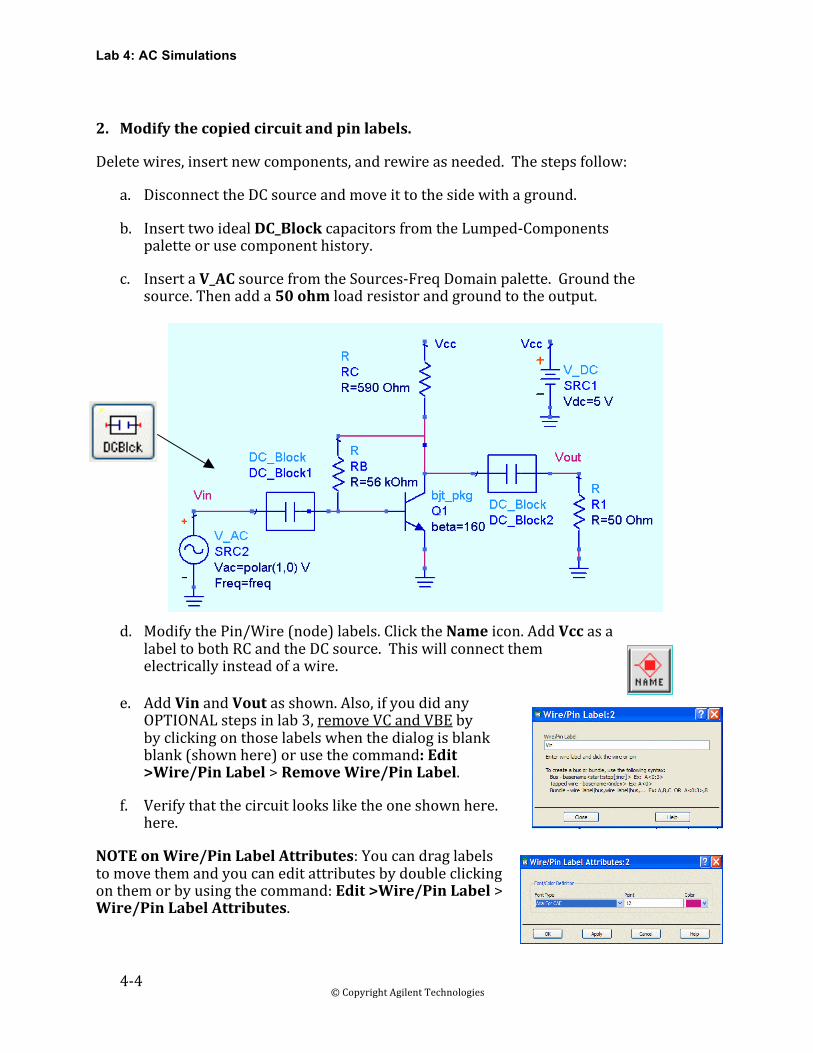
Deletewires,insertnewcomponents,andrewireasneeded.Thestepsfollow:
a. DisconnecttheDCsourceandmoveittothesidewithaground.
b. InserttwoidealDC_BlockcapacitorsfromtheLumped‐Componentspaletteorusecomponenthistory.
c. InsertaV_ACsourcefromtheSources‐FreqDomainpalette.Groundthesource.Thenadda50ohmloadresistorandgroundtotheoutput.
d. ModifythePin/Wire(node)labels.ClicktheNameicon.AddVccasalabeltobothRCandtheDCsource.Thiswillconnectthemelectricallyinsteadofawire.
e. AddVinandVoutasshown.Also,ifyoudidanyOPTIONALstepsinlab3,removeVCandVBEbybyclickingonthoselabelswhenthedialogisblankblank(shownhere)orusethecommand:Edit>Wire/PinLabel>RemoveWire/PinLabel.
f. Verifythatthecircuitlooksliketheoneshownhere.here.
NOTEonWire/PinLabelAttributes:Youcandraglabelstomovethemandyoucaneditattributesbydoubleclickingonthemorbyusingthecommand:Edit>Wire/PinLabel>Wire/PinLabelAttributes.
Lab 4: AC Simulations
4‐5©CopyrightAgilentTechnologies2009
3. Pushandpoptoverifythesubcircuit.
a. Selectthebjt_pkgandpushintothesub‐circuit(usetheicons)totocheckyoursubcircuit,andthenpopoutagain.
4. SetupanACsimulationwithNoise.
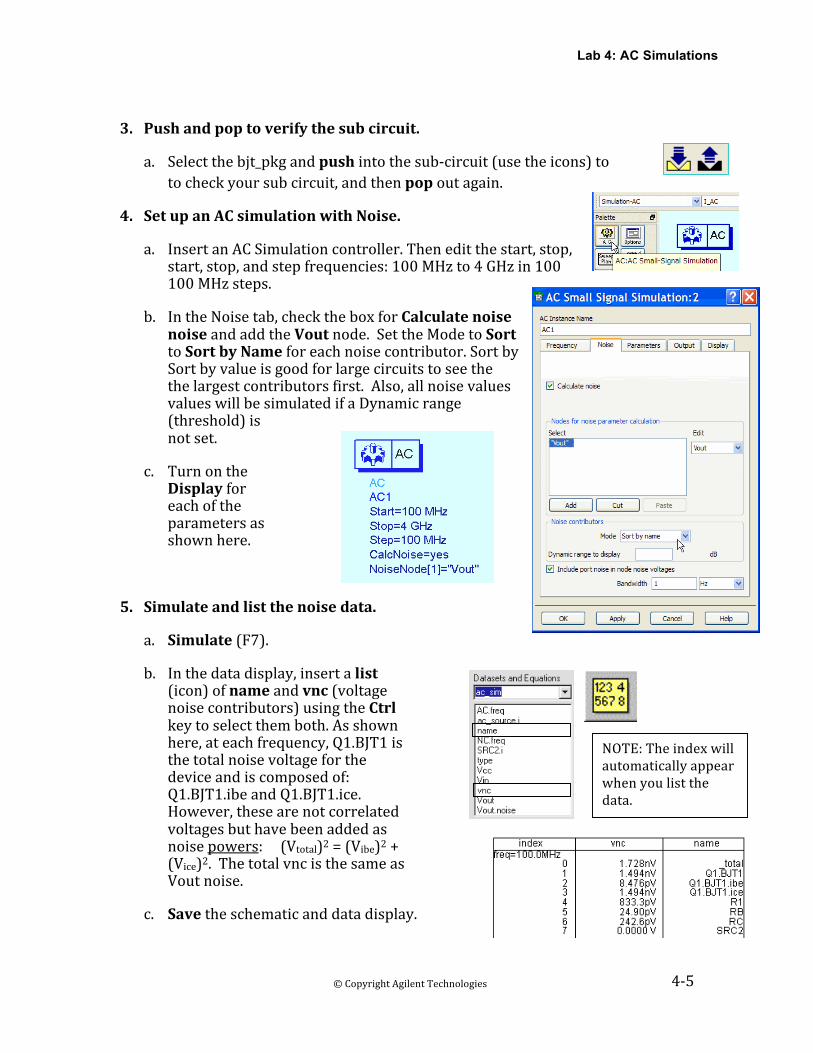
a. InsertanACSimulationcontroller.Theneditthestart,stop,start,stop,andstepfrequencies:100MHzto4GHzin100100MHzsteps.
b. IntheNoisetab,checktheboxforCalculatenoisenoiseandaddtheVoutnode.SettheModetoSorttoSortbyNameforeachnoisecontributor.SortbySortbyvalueisgoodforlargecircuitstoseethethelargestcontributorsfirst.Also,allnoisevaluesvalueswillbesimulatedifaDynamicrange(threshold)isnotset.
c. TurnontheDisplayforeachoftheparametersasshownhere.
5. Simulateandlistthenoisedata.
a. Simulate(F7).
b. Inthedatadisplay,insertalist(icon)ofnameandvnc(voltagenoisecontributors)usingtheCtrlkeytoselectthemboth.Asshownhere,ateachfrequency,Q1.BJT1isthetotalnoisevoltageforthedeviceandiscomposedof:Q1.BJT1.ibeandQ1.BJT1.ice.However,thesearenotcorrelatedvoltagesbuthavebeenaddedasnoisepowers:(Vtotal)2=(Vibe)2+(Vice)2.ThetotalvncisthesameasVoutnoise.
c. Savetheschematicanddatadisplay.
NOTE:Theindexwillautomaticallyappearwhenyoulistthedata.
Lab 4: AC Simulations
4‐6©CopyrightAgilentTechnologies2009
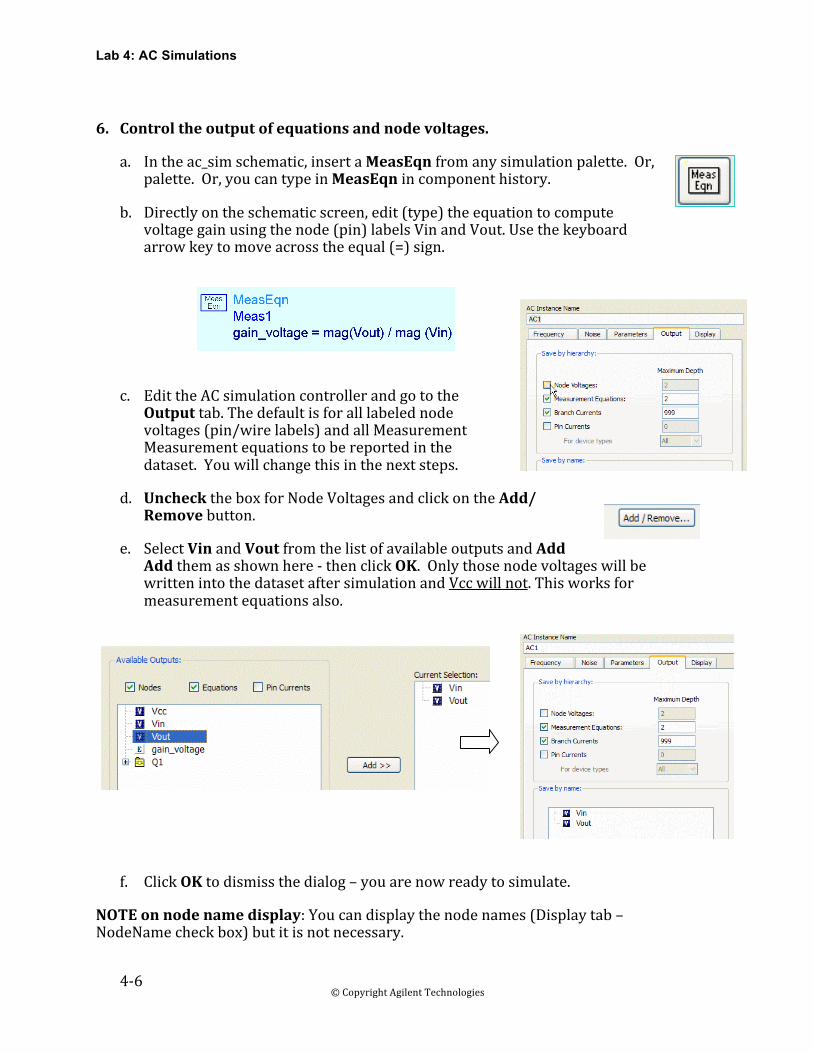
6. Controltheoutputofequationsandnodevoltages.
a. Intheac_simschematic,insertaMeasEqnfromanysimulationpalette.Or,palette.Or,youcantypeinMeasEqnincomponenthistory.
b. Directlyontheschematicscreen,edit(type)theequationtocomputevoltagegainusingthenode(pin)labelsVinandVout.Usethekeyboardarrowkeytomoveacrosstheequal(=)sign.
c. EdittheACsimulationcontrollerandgototheOutputtab.Thedefaultisforalllabelednodevoltages(pin/wirelabels)andallMeasurementMeasurementequationstobereportedinthedataset.Youwillchangethisinthenextsteps.
d. UnchecktheboxforNodeVoltagesandclickontheAdd/Removebutton.
e. SelectVinandVoutfromthelistofavailableoutputsandAddAddthemasshownhere‐thenclickOK.OnlythosenodevoltageswillbewrittenintothedatasetaftersimulationandVccwillnot.Thisworksformeasurementequationsalso.
f. ClickOKtodismissthedialog–youarenowreadytosimulate.
NOTEonnodenamedisplay:Youcandisplaythenodenames(Displaytab–NodeNamecheckbox)butitisnotnecessary.
Lab 4: AC Simulations
4‐7©CopyrightAgilentTechnologies2009
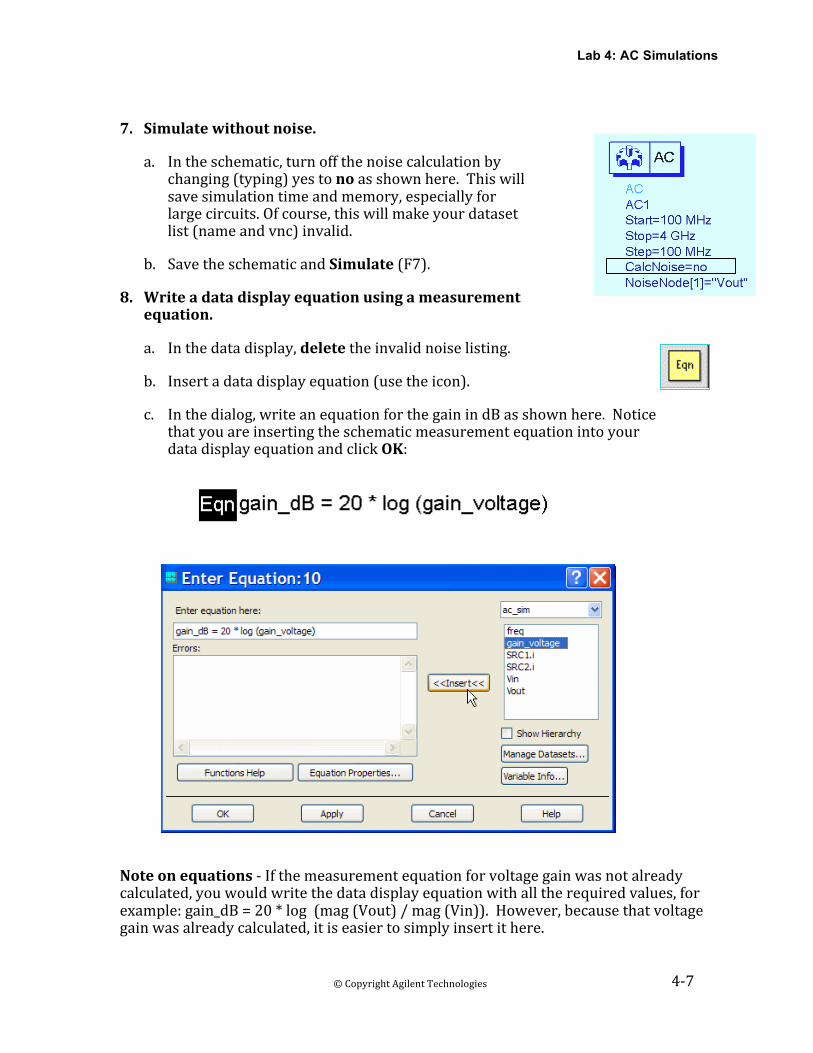
7. Simulatewithoutnoise.
a. Intheschematic,turnoffthenoisecalculationbychanging(typing)yestonoasshownhere.Thiswillsavesimulationtimeandmemory,especiallyforlargecircuits.Ofcourse,thiswillmakeyourdatasetlist(nameandvnc)invalid.
b. SavetheschematicandSimulate(F7).
8. Writeadatadisplayequationusingameasurementequation.
a. Inthedatadisplay,deletetheinvalidnoiselisting.
b. Insertadatadisplayequation(usetheicon).
c. Inthedialog,writeanequationforthegainindBasshownhere.NoticethatyouareinsertingtheschematicmeasurementequationintoyourdatadisplayequationandclickOK:
Noteonequations‐Ifthemeasurementequationforvoltagegainwasnotalreadycalculated,youwouldwritethedatadisplayequationwithalltherequiredvalues,forexample:gain_dB=20*log(mag(Vout)/mag(Vin)).However,becausethatvoltagegainwasalreadycalculated,itiseasiertosimplyinsertithere.
Lab 4: AC Simulations
4‐8©CopyrightAgilentTechnologies2009
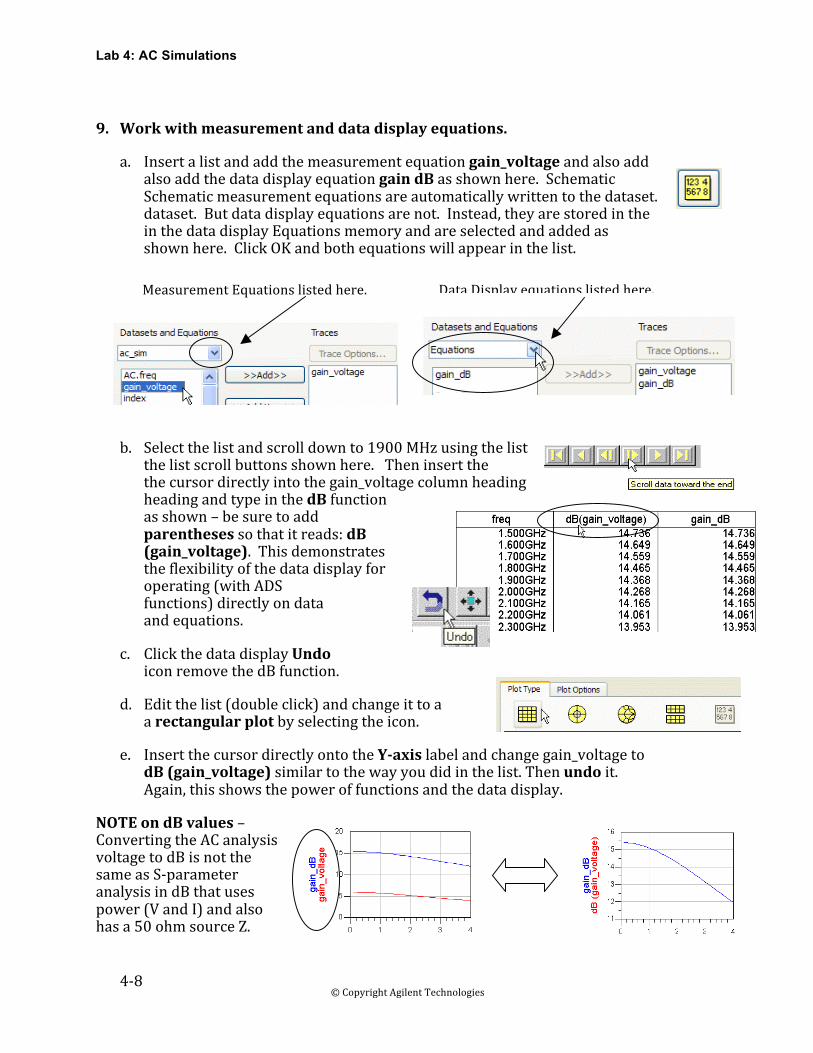
9. Workwithmeasurementanddatadisplayequations.
a. Insertalistandaddthemeasurementequationgain_voltageandalsoaddalsoaddthedatadisplayequationgaindBasshownhere.SchematicSchematicmeasurementequationsareautomaticallywrittentothedataset.dataset.Butdatadisplayequationsarenot.Instead,theyarestoredintheinthedatadisplayEquationsmemoryandareselectedandaddedasshownhere.ClickOKandbothequationswillappearinthelist.
b. Selectthelistandscrolldownto1900MHzusingthelistthelistscrollbuttonsshownhere.Theninsertthethecursordirectlyintothegain_voltagecolumnheadingheadingandtypeinthedBfunctionasshown–besuretoaddparenthesessothatitreads:dB(gain_voltage).Thisdemonstratestheflexibilityofthedatadisplayforoperating(withADSfunctions)directlyondataandequations.
c. ClickthedatadisplayUndoiconremovethedBfunction.
d. Editthelist(doubleclick)andchangeittoaarectangularplotbyselectingtheicon.
e. InsertthecursordirectlyontotheYaxislabelandchangegain_voltagetodB(gain_voltage)similartothewayyoudidinthelist.Thenundoit.Again,thisshowsthepoweroffunctionsandthedatadisplay.
NOTEondBvalues–ConvertingtheACanalysisvoltagetodBisnotthesameasS‐parameteranalysisindBthatusespower(VandI)andalsohasa50ohmsourceZ.
MeasurementEquationslistedhere. DataDisplayequationslistedhere.
Lab 4: AC Simulations
4‐9©CopyrightAgilentTechnologies2009
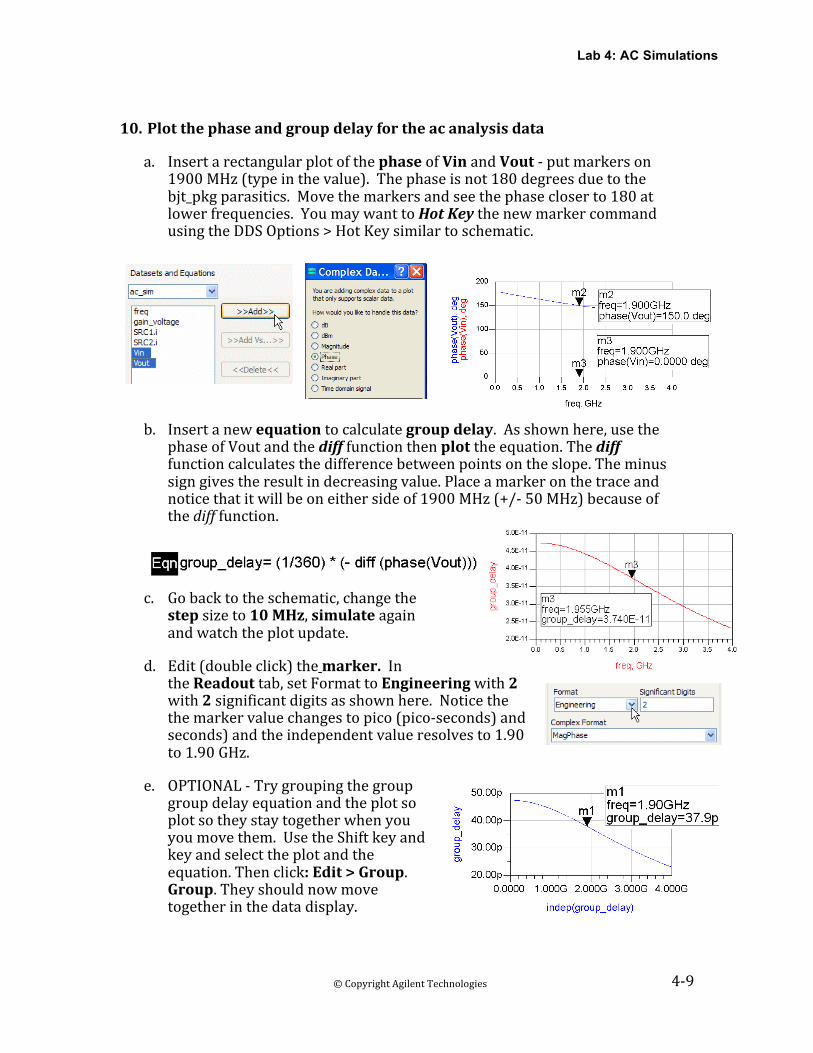
10. Plotthephaseandgroupdelayfortheacanalysisdata
a. InsertarectangularplotofthephaseofVinandVout‐putmarkerson1900MHz(typeinthevalue).Thephaseisnot180degreesduetothebjt_pkgparasitics.Movethemarkersandseethephasecloserto180atlowerfrequencies.YoumaywanttoHotKeythenewmarkercommandusingtheDDSOptions>HotKeysimilartoschematic.
b. Insertanewequationtocalculategroupdelay.Asshownhere,usethephaseofVoutandthedifffunctionthenplottheequation.Thedifffunctioncalculatesthedifferencebetweenpointsontheslope.Theminussigngivestheresultindecreasingvalue.Placeamarkeronthetraceandnoticethatitwillbeoneithersideof1900MHz(+/‐50MHz)becauseofthedifffunction.
c. Gobacktotheschematic,changethestepsizeto10MHz,simulateagainandwatchtheplotupdate.
d. Edit(doubleclick)themarker.IntheReadouttab,setFormattoEngineeringwith2with2significantdigitsasshownhere.Noticethethemarkervaluechangestopico(pico‐seconds)andseconds)andtheindependentvalueresolvesto1.90to1.90GHz.
e. OPTIONAL‐Trygroupingthegroupgroupdelayequationandtheplotsoplotsotheystaytogetherwhenyouyoumovethem.UsetheShiftkeyandkeyandselecttheplotandtheequation.Thenclick:Edit>Group.Group.Theyshouldnowmovetogetherinthedatadisplay.
Lab 4: AC Simulations
4‐10©CopyrightAgilentTechnologies2009
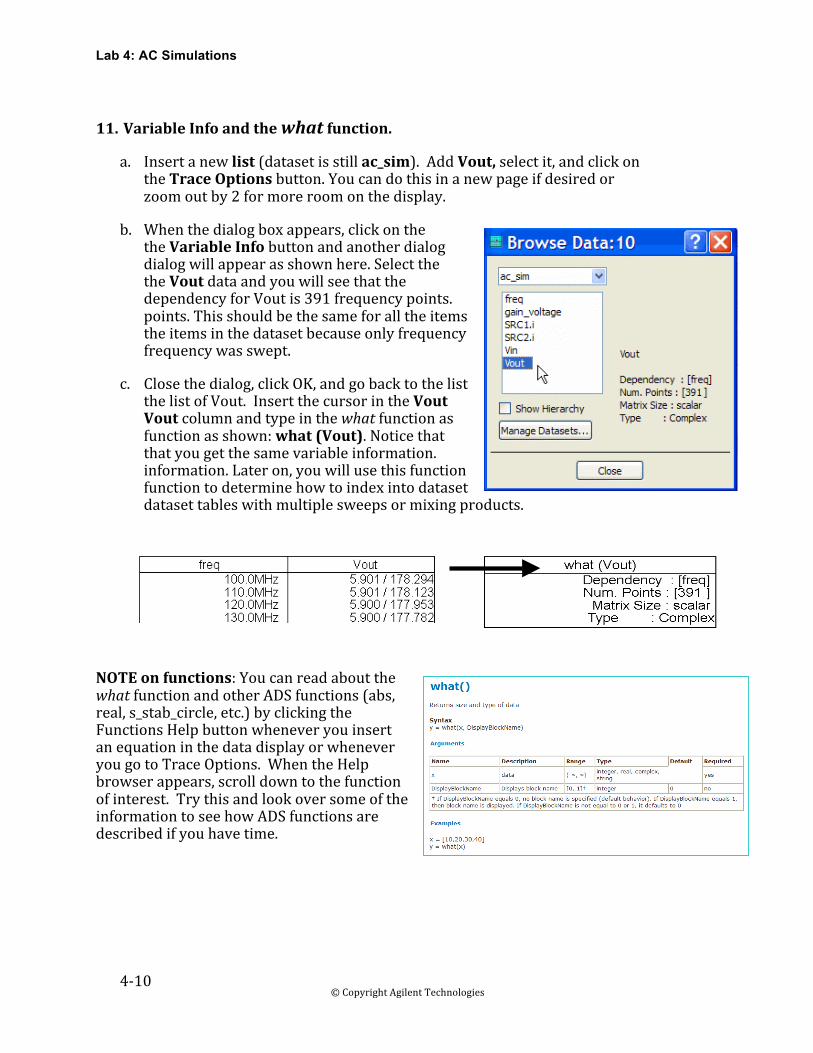
11. VariableInfoandthewhatfunction.
a. Insertanewlist(datasetisstillac_sim).AddVout,selectit,andclickontheTraceOptionsbutton.Youcandothisinanewpageifdesiredorzoomoutby2formoreroomonthedisplay.
b. Whenthedialogboxappears,clickonthetheVariableInfobuttonandanotherdialogdialogwillappearasshownhere.SelectthetheVoutdataandyouwillseethatthedependencyforVoutis391frequencypoints.points.Thisshouldbethesameforalltheitemstheitemsinthedatasetbecauseonlyfrequencyfrequencywasswept.
c. Closethedialog,clickOK,andgobacktothelistthelistofVout.InsertthecursorintheVoutVoutcolumnandtypeinthewhatfunctionasfunctionasshown:what(Vout).Noticethatthatyougetthesamevariableinformation.information.Lateron,youwillusethisfunctionfunctiontodeterminehowtoindexintodatasetdatasettableswithmultiplesweepsormixingproducts.
NOTEonfunctions:YoucanreadaboutthewhatfunctionandotherADSfunctions(abs,real,s_stab_circle,etc.)byclickingtheFunctionsHelpbuttonwheneveryouinsertanequationinthedatadisplayorwheneveryougotoTraceOptions.WhentheHelpbrowserappears,scrolldowntothefunctionofinterest.TrythisandlookoversomeoftheinformationtoseehowADSfunctionsaredescribedifyouhavetime.
Lab 4: AC Simulations
4‐11©CopyrightAgilentTechnologies2009
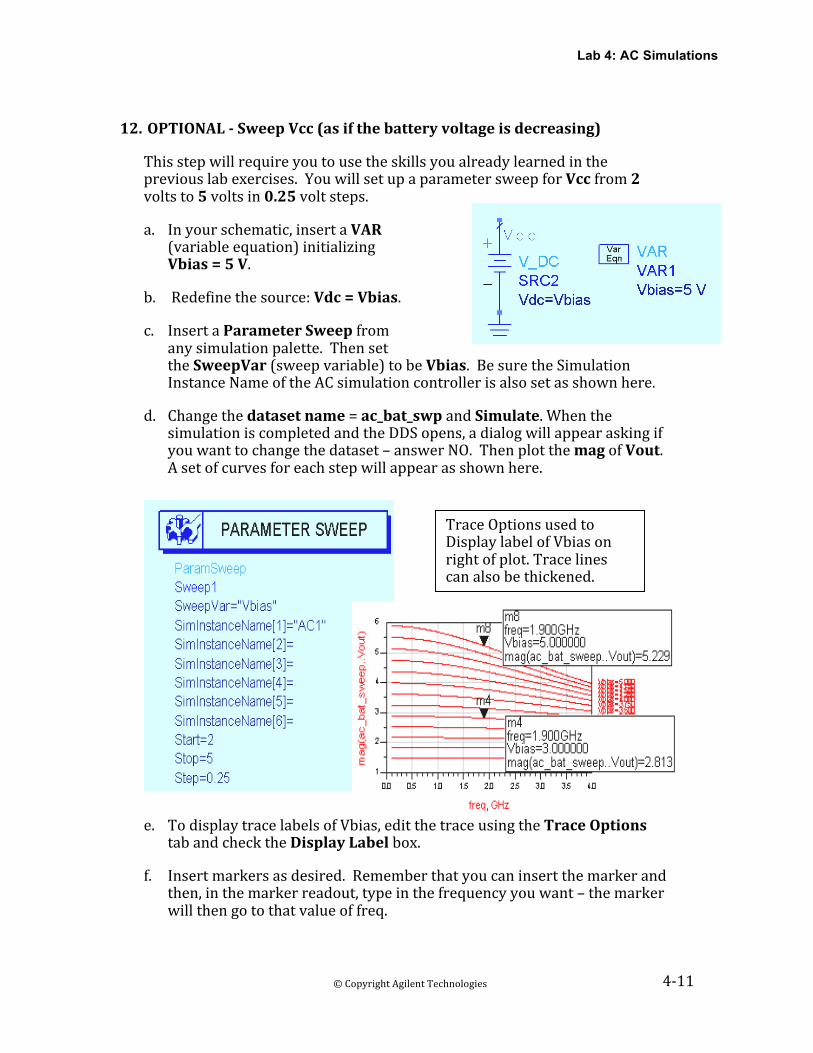
12. OPTIONALSweepVcc(asifthebatteryvoltageisdecreasing)
Thisstepwillrequireyoutousetheskillsyoualreadylearnedinthepreviouslabexercises.YouwillsetupaparametersweepforVccfrom2voltsto5voltsin0.25voltsteps.
a. Inyourschematic,insertaVAR(variableequation)initializingVbias=5V.
b. Redefinethesource:Vdc=Vbias.
c. InsertaParameterSweepfromanysimulationpalette.ThensettheSweepVar(sweepvariable)tobeVbias.BesuretheSimulationInstanceNameoftheACsimulationcontrollerisalsosetasshownhere.
d. Changethedatasetname=ac_bat_swpandSimulate.WhenthesimulationiscompletedandtheDDSopens,adialogwillappearaskingifyouwanttochangethedataset–answerNO.ThenplotthemagofVout.Asetofcurvesforeachstepwillappearasshownhere.
e. TodisplaytracelabelsofVbias,editthetraceusingtheTraceOptionstabandchecktheDisplayLabelbox.
f. Insertmarkersasdesired.Rememberthatyoucaninsertthemarkerandthen,inthemarkerreadout,typeinthefrequencyyouwant–themarkerwillthengotothatvalueoffreq.
TraceOptionsusedtoDisplaylabelofVbiasonrightofplot.Tracelinescanalsobethickened.
Lab 4: AC Simulations
4‐12©CopyrightAgilentTechnologies2009
g. Saveallyourwork.Youcankeeptheexistingschematicwindowopened–youwilluseittostartthenextlabexercise.Butclosethedatadisplayifitisstillopened.
EXTRAEXERCISES:
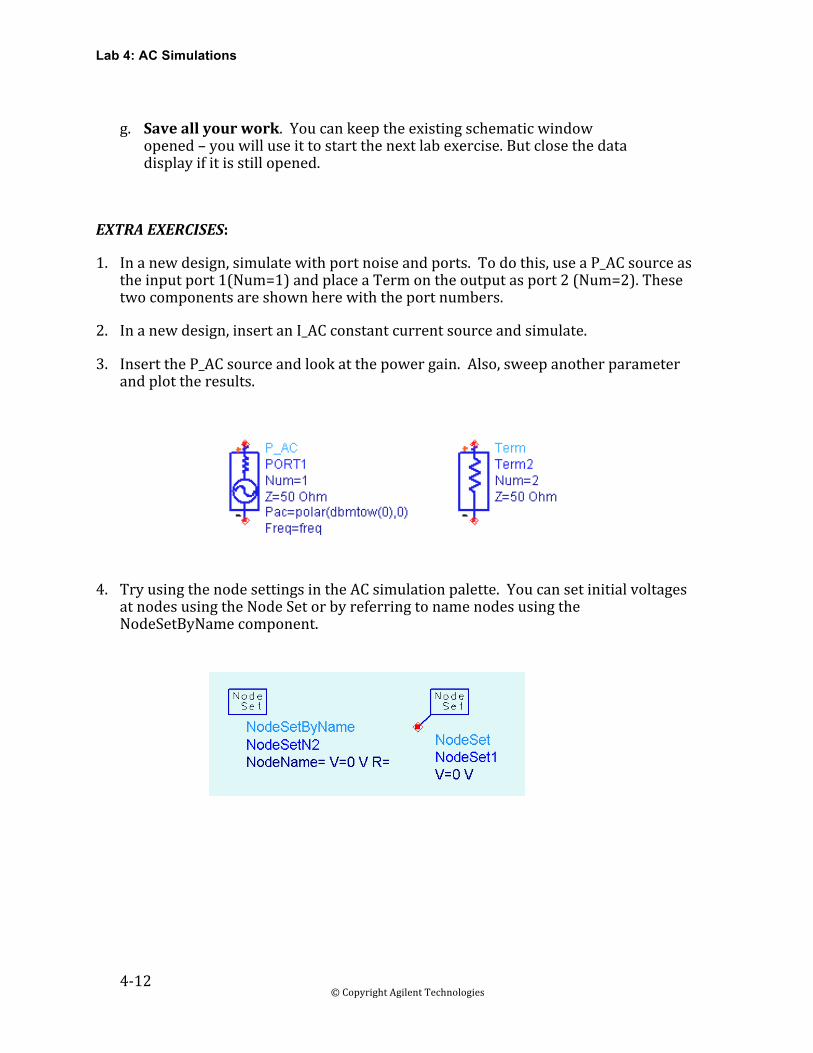
1. Inanewdesign,simulatewithportnoiseandports.Todothis,useaP_ACsourceastheinputport1(Num=1)andplaceaTermontheoutputasport2(Num=2).Thesetwocomponentsareshownherewiththeportnumbers.
2. Inanewdesign,insertanI_ACconstantcurrentsourceandsimulate.
3. InserttheP_ACsourceandlookatthepowergain.Also,sweepanotherparameterandplottheresults.
4. TryusingthenodesettingsintheACsimulationpalette.YoucansetinitialvoltagesatnodesusingtheNodeSetorbyreferringtonamenodesusingtheNodeSetByNamecomponent.