Embed Size (px)
Citation preview
CS498 Networking Lab Spring 2012
Lab 4: Exploring Real Gigabit Ethernet Switches
Instructor: Matthew Caesar Due
Ethernet is probably the most widely used networking technologies. Gigabit Ethernet switches
are common layer 2 networking devices for building wired local area network (LAN). Most
switches consist of three components: buffers to handle congestion; algorithms to make
scheduling and switching decisions; and switching fabric to forward data from one port to
another. Different switches have different architecture designs and usually that information is not
public-available. In this lab, we will explore the difference in the seemingly similar commodity
switches, including scheduling policy, delay, and queueing buffer mechanism.
Notes and FAQ
1. Login username and password
user: cs498student
password: cs498student (also the root password)
1 Testbed Component Description
The testbed uses the following hardware and software to instrument, transmit, and capture
Ethernet frames at line rates.
1.1 NetFPGA card, packet generator [1][2]
To generate traffic up to line rate with user configured parameters such as frame size,
sending rate and inter-frame gap. The data flows generated in this MP are Constant
Bit Rate (CBR) Ethernet raw frames in pcap format. It can also capture frames at line
rate.
1.2 Switches
3COM 3CGSU08
NetGear GS108v2
1.3 PackEth
A Linux GUI packet generator tool for Ethernet. It is used to create customized input
traffic files for this lab.
1.4 Wireshark
A free and open-source packet analyzer. It is used for input traffic creation as well as
output traffic analysis.
2 Initial Setup
2.1 Open a terminal and get the root privilege by typing
su
2.2 Check the availability of all four NetFPGA interfaces by typing
Ifconfig
And you should see all four interfaces: nf2c0 to nf2c3
2.3 Check environment variable NF_DESIGN_DIR
echo $NF_DESIGN_DIR
you should see /root/netfpga/projects/packet_generator, if not, set it to the above
path
2.4 Reprogramming the CPCI on netFPGA card by
/usr/local/sbin/cpci_reprogram.pl –all
You should see “CPCI on NetFPGA 0 has been successfully reprogrammed”
2.5 Load packet generator module into the NetFPGA card by
nf_download /usr/local/netfpga/bitfiles/packet_generator.bit
you should see something like
Download completed - 2377668 bytes. (expected -1).
DONE went high - chip has been successfully programmed.
CPCI Information
----------------
Version: 4 (rev 1)
Device (Virtex) Information
---------------------------
Project directory: packet_generator
Project name: Packet Generator
Project description: Packet Generator that replays PCAP files
3 Experiments
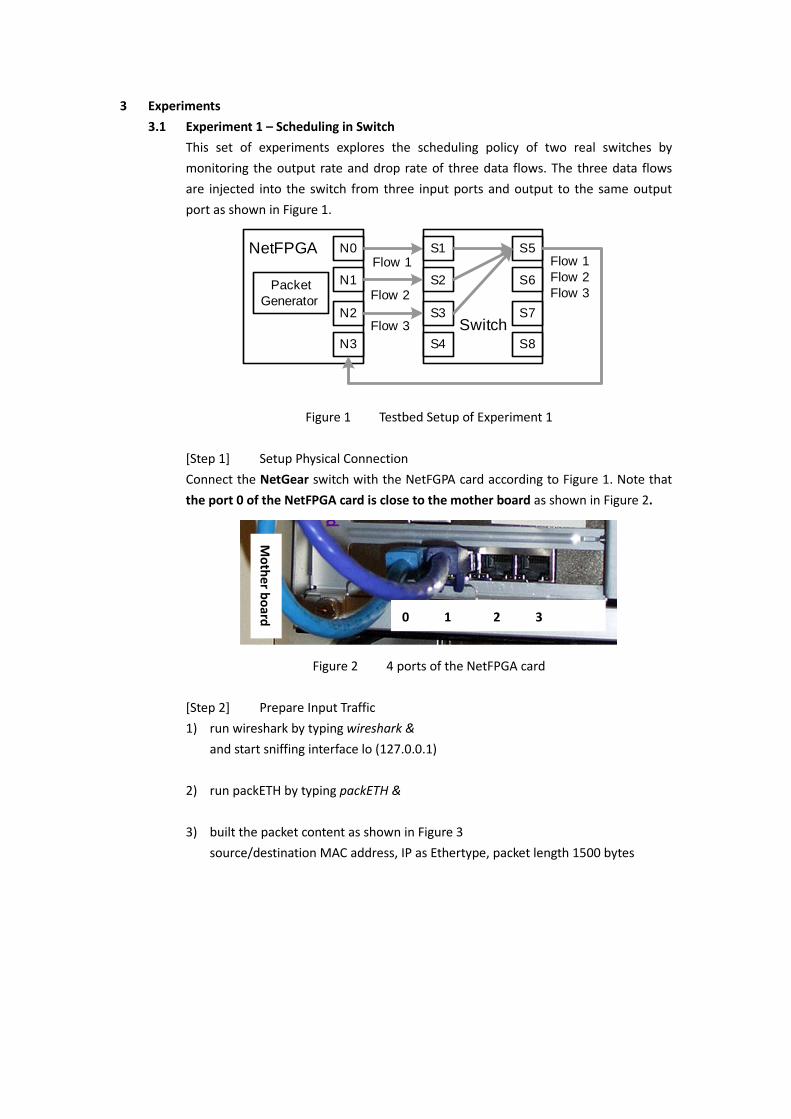
3.1 Experiment 1 – Scheduling in Switch
This set of experiments explores the scheduling policy of two real switches by
monitoring the output rate and drop rate of three data flows. The three data flows
are injected into the switch from three input ports and output to the same output
port as shown in Figure 1.
Flow 1NetFPGA N0
N1
N2
N3
Packet Generator
Switch
S1
S2
S3
S4
S5
S6
S7
S8
Flow 1Flow 2Flow 3Flow 2
Flow 3
Figure 1 Testbed Setup of Experiment 1
[Step 1] Setup Physical Connection
Connect the NetGear switch with the NetFGPA card according to Figure 1. Note that
the port 0 of the NetFPGA card is close to the mother board as shown in Figure 2.
Figure 2 4 ports of the NetFPGA card
[Step 2] Prepare Input Traffic
1) run wireshark by typing wireshark &
and start sniffing interface lo (127.0.0.1)
2) run packETH by typing packETH &
3) built the packet content as shown in Figure 3
source/destination MAC address, IP as Ethertype, packet length 1500 bytes
0 1 2 3
Mo
the
r bo
ard
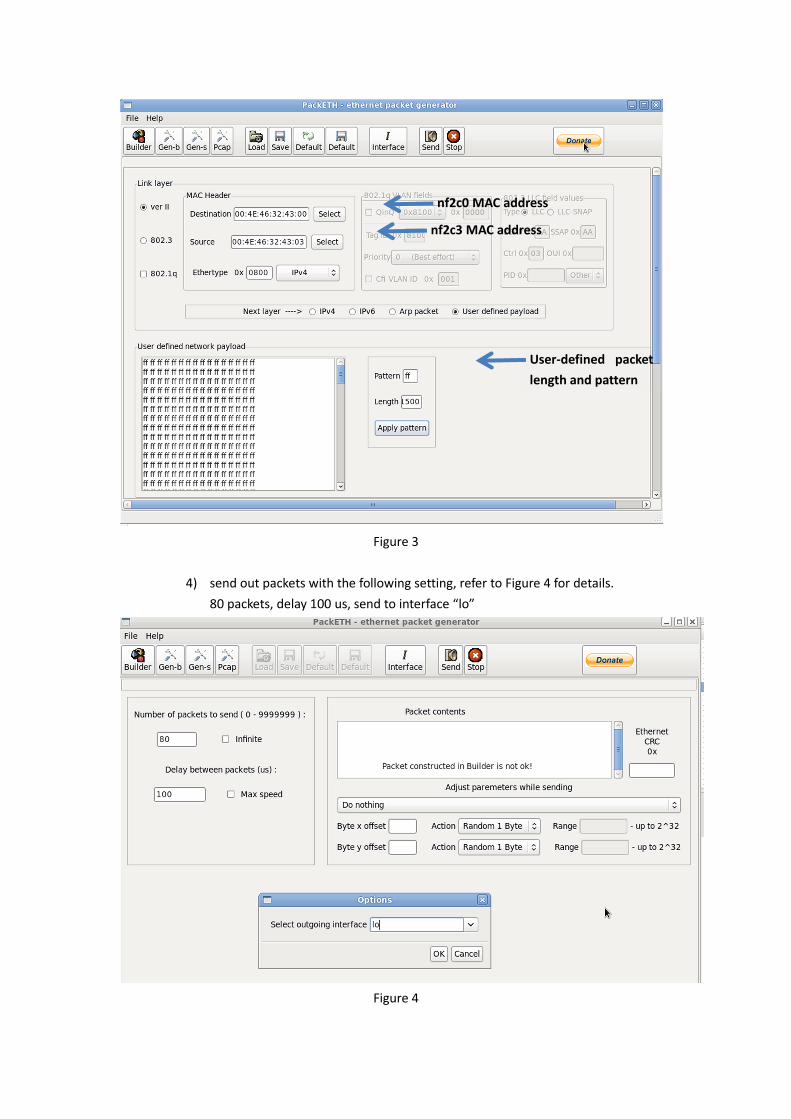
Figure 3
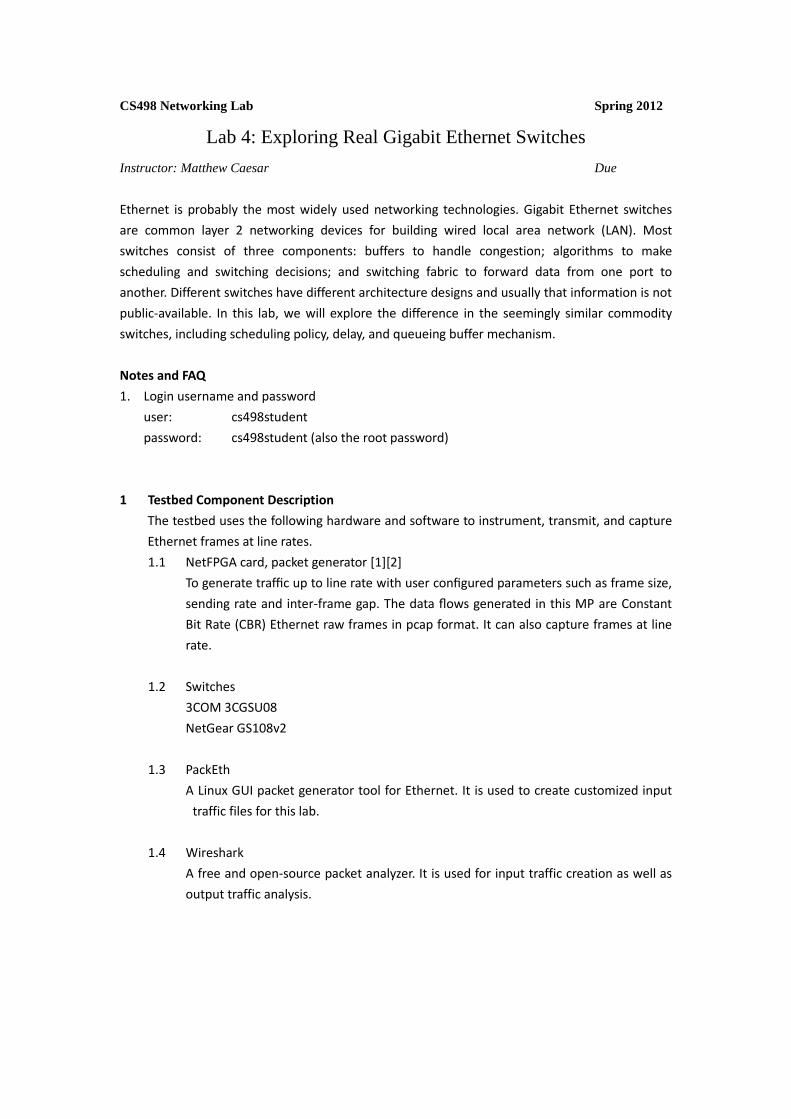
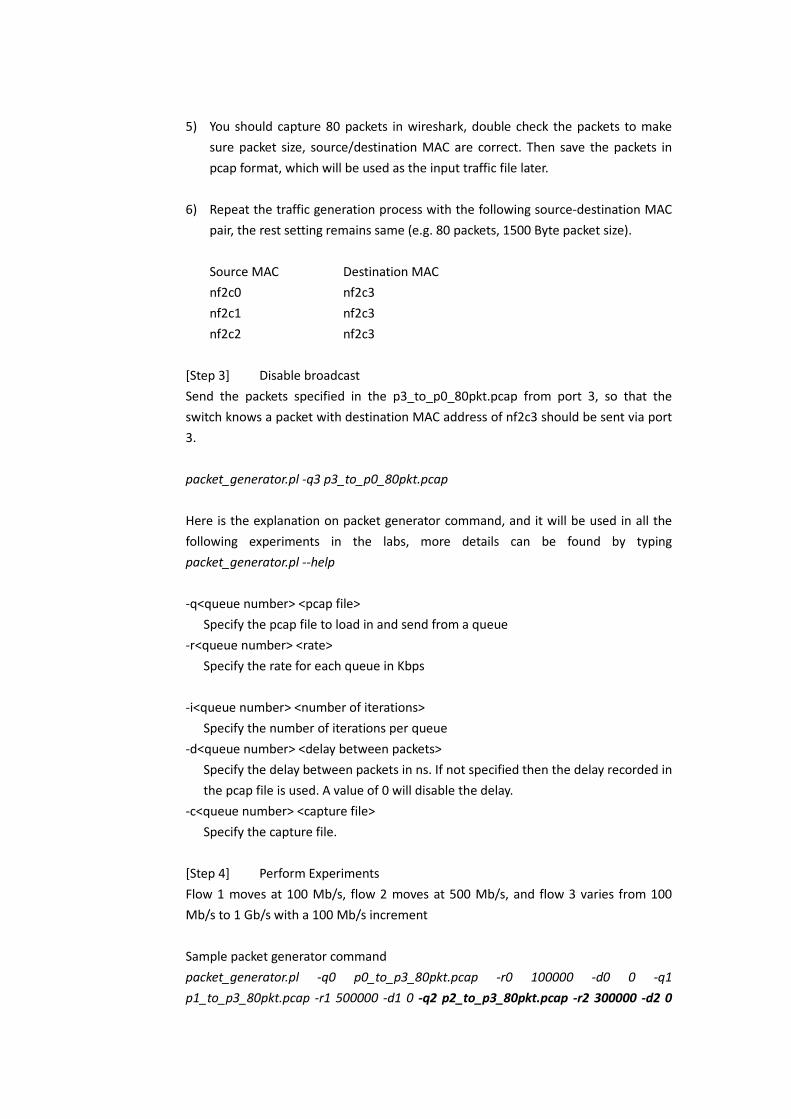
4) send out packets with the following setting, refer to Figure 4 for details.
80 packets, delay 100 us, send to interface “lo”
Figure 4
nf2c3 MAC address
nf2c0 MAC address
User-defined packet
length and pattern
5) You should capture 80 packets in wireshark, double check the packets to make
sure packet size, source/destination MAC are correct. Then save the packets in
pcap format, which will be used as the input traffic file later.
6) Repeat the traffic generation process with the following source-destination MAC
pair, the rest setting remains same (e.g. 80 packets, 1500 Byte packet size).
Source MAC Destination MAC
nf2c0 nf2c3
nf2c1 nf2c3
nf2c2 nf2c3
[Step 3] Disable broadcast
Send the packets specified in the p3_to_p0_80pkt.pcap from port 3, so that the
switch knows a packet with destination MAC address of nf2c3 should be sent via port
3.
packet_generator.pl -q3 p3_to_p0_80pkt.pcap
Here is the explanation on packet generator command, and it will be used in all the
following experiments in the labs, more details can be found by typing
packet_generator.pl --help
-q<queue number> <pcap file>
Specify the pcap file to load in and send from a queue
-r<queue number> <rate>
Specify the rate for each queue in Kbps
-i<queue number> <number of iterations>
Specify the number of iterations per queue
-d<queue number> <delay between packets>
Specify the delay between packets in ns. If not specified then the delay recorded in
the pcap file is used. A value of 0 will disable the delay.
-c<queue number> <capture file>
Specify the capture file.
[Step 4] Perform Experiments
Flow 1 moves at 100 Mb/s, flow 2 moves at 500 Mb/s, and flow 3 varies from 100
Mb/s to 1 Gb/s with a 100 Mb/s increment
Sample packet generator command
packet_generator.pl -q0 p0_to_p3_80pkt.pcap -r0 100000 -d0 0 -q1
p1_to_p3_80pkt.pcap -r1 500000 -d1 0 -q2 p2_to_p3_80pkt.pcap -r2 300000 -d2 0
-c3 300Mbps_result.pcap
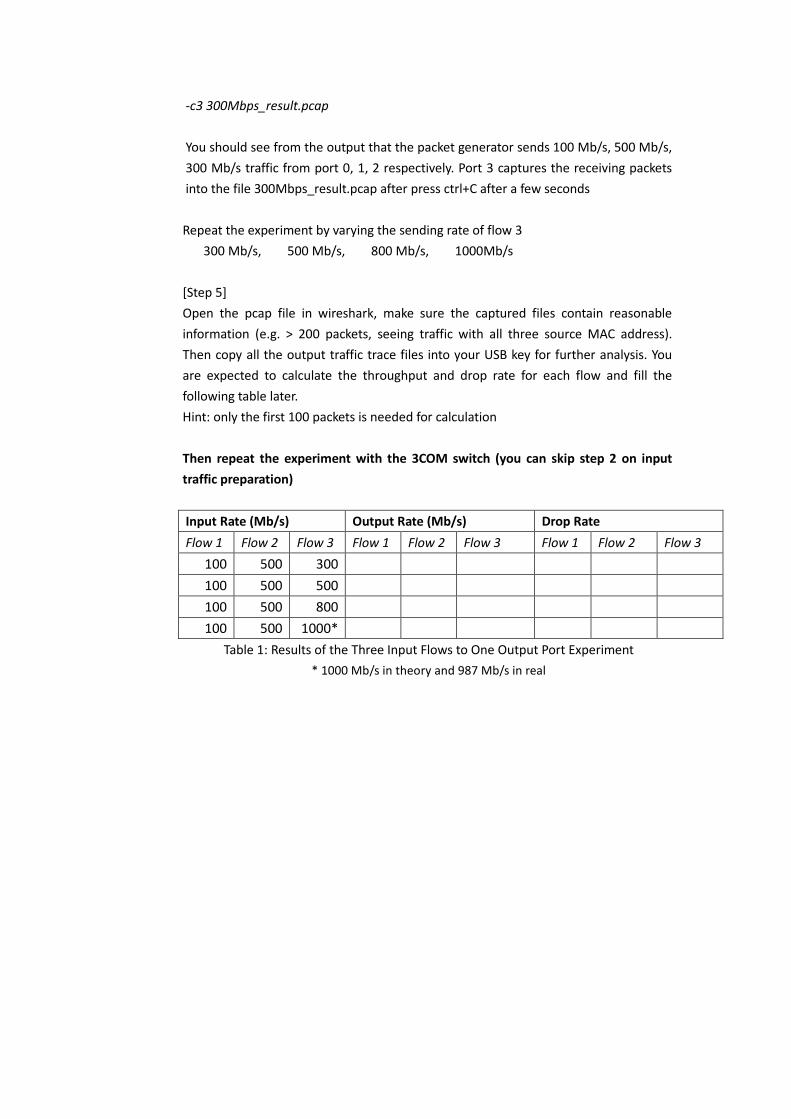
You should see from the output that the packet generator sends 100 Mb/s, 500 Mb/s,
300 Mb/s traffic from port 0, 1, 2 respectively. Port 3 captures the receiving packets
into the file 300Mbps_result.pcap after press ctrl+C after a few seconds
Repeat the experiment by varying the sending rate of flow 3
300 Mb/s, 500 Mb/s, 800 Mb/s, 1000Mb/s
[Step 5]
Open the pcap file in wireshark, make sure the captured files contain reasonable
information (e.g. > 200 packets, seeing traffic with all three source MAC address).
Then copy all the output traffic trace files into your USB key for further analysis. You
are expected to calculate the throughput and drop rate for each flow and fill the
following table later.
Hint: only the first 100 packets is needed for calculation
Then repeat the experiment with the 3COM switch (you can skip step 2 on input
traffic preparation)
Input Rate (Mb/s) Output Rate (Mb/s) Drop Rate
Flow 1 Flow 2 Flow 3 Flow 1 Flow 2 Flow 3 Flow 1 Flow 2 Flow 3
100 500 300
100 500 500
100 500 800
100 500 1000*
Table 1: Results of the Three Input Flows to One Output Port Experiment
* 1000 Mb/s in theory and 987 Mb/s in real
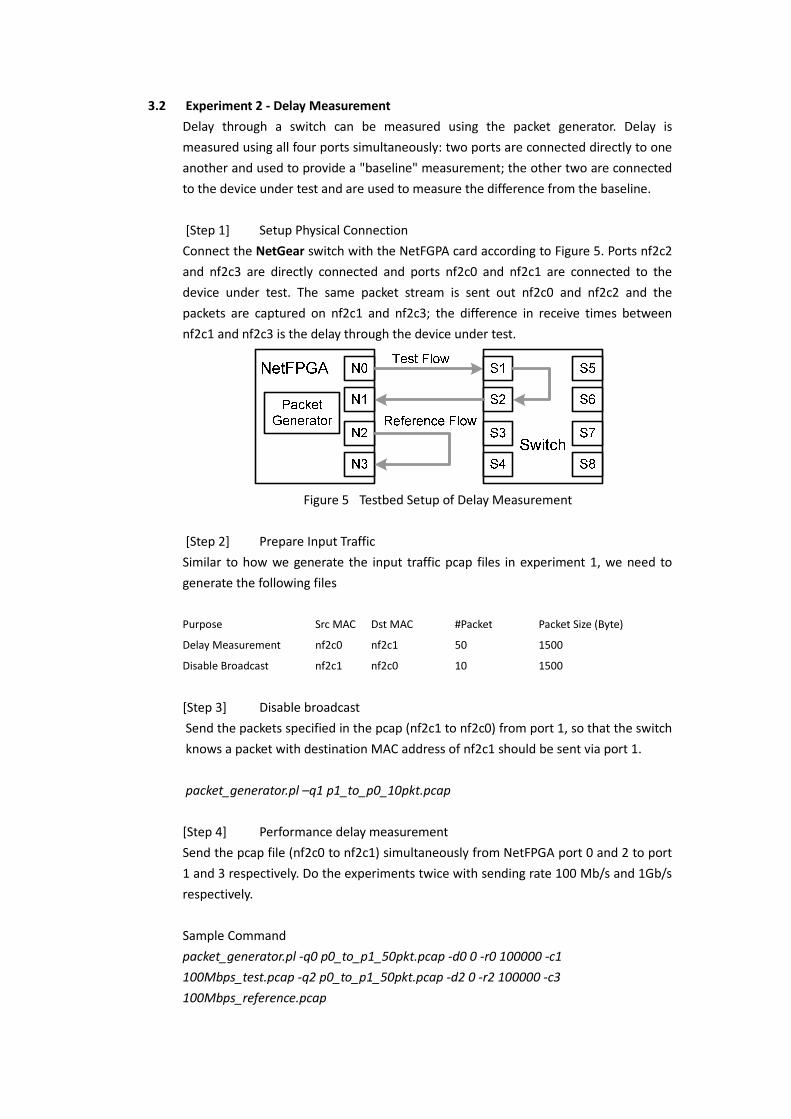
3.2 Experiment 2 - Delay Measurement
Delay through a switch can be measured using the packet generator. Delay is
measured using all four ports simultaneously: two ports are connected directly to one
another and used to provide a "baseline" measurement; the other two are connected
to the device under test and are used to measure the difference from the baseline.
[Step 1] Setup Physical Connection
Connect the NetGear switch with the NetFGPA card according to Figure 5. Ports nf2c2
and nf2c3 are directly connected and ports nf2c0 and nf2c1 are connected to the
device under test. The same packet stream is sent out nf2c0 and nf2c2 and the
packets are captured on nf2c1 and nf2c3; the difference in receive times between
nf2c1 and nf2c3 is the delay through the device under test.
Figure 5 Testbed Setup of Delay Measurement
[Step 2] Prepare Input Traffic
Similar to how we generate the input traffic pcap files in experiment 1, we need to
generate the following files
Purpose Src MAC Dst MAC #Packet Packet Size (Byte)
Delay Measurement nf2c0 nf2c1 50 1500
Disable Broadcast nf2c1 nf2c0 10 1500
[Step 3] Disable broadcast
Send the packets specified in the pcap (nf2c1 to nf2c0) from port 1, so that the switch
knows a packet with destination MAC address of nf2c1 should be sent via port 1.
packet_generator.pl –q1 p1_to_p0_10pkt.pcap
[Step 4] Performance delay measurement
Send the pcap file (nf2c0 to nf2c1) simultaneously from NetFPGA port 0 and 2 to port
1 and 3 respectively. Do the experiments twice with sending rate 100 Mb/s and 1Gb/s
respectively.
Sample Command
packet_generator.pl -q0 p0_to_p1_50pkt.pcap -d0 0 -r0 100000 -c1
100Mbps_test.pcap -q2 p0_to_p1_50pkt.pcap -d2 0 -r2 100000 -c3
100Mbps_reference.pcap
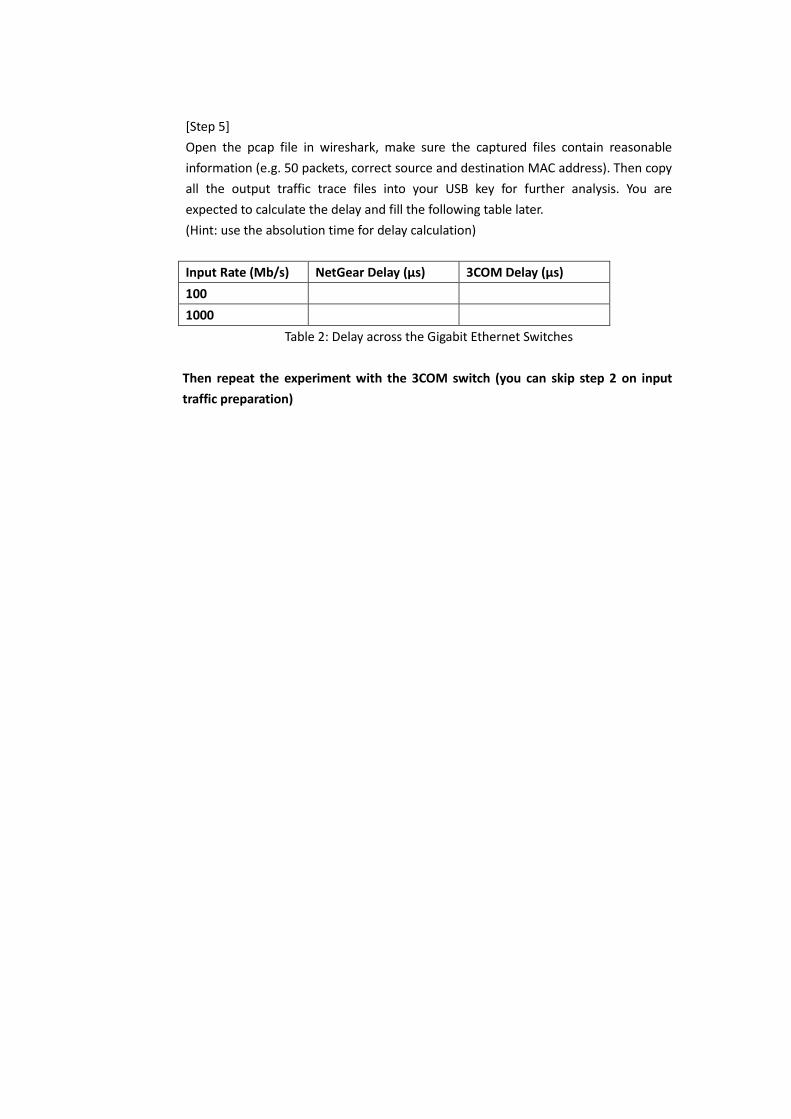
[Step 5]
Open the pcap file in wireshark, make sure the captured files contain reasonable
information (e.g. 50 packets, correct source and destination MAC address). Then copy
all the output traffic trace files into your USB key for further analysis. You are
expected to calculate the delay and fill the following table later.
(Hint: use the absolution time for delay calculation)
Input Rate (Mb/s) NetGear Delay (µs) 3COM Delay (µs)
100
1000
Table 2: Delay across the Gigabit Ethernet Switches
Then repeat the experiment with the 3COM switch (you can skip step 2 on input
traffic preparation)
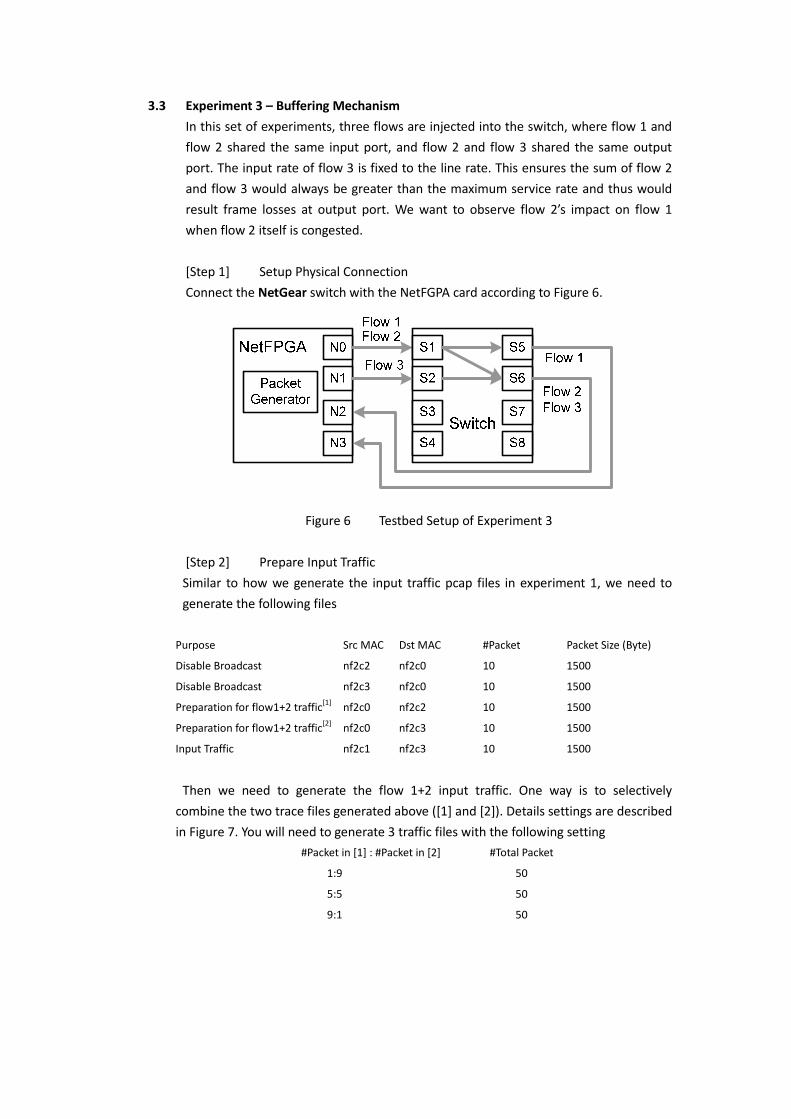
3.3 Experiment 3 – Buffering Mechanism
In this set of experiments, three flows are injected into the switch, where flow 1 and
flow 2 shared the same input port, and flow 2 and flow 3 shared the same output
port. The input rate of flow 3 is fixed to the line rate. This ensures the sum of flow 2
and flow 3 would always be greater than the maximum service rate and thus would
result frame losses at output port. We want to observe flow 2’s impact on flow 1
when flow 2 itself is congested.
[Step 1] Setup Physical Connection
Connect the NetGear switch with the NetFGPA card according to Figure 6.
Figure 6 Testbed Setup of Experiment 3
[Step 2] Prepare Input Traffic
Similar to how we generate the input traffic pcap files in experiment 1, we need to
generate the following files
Purpose Src MAC Dst MAC #Packet Packet Size (Byte)
Disable Broadcast nf2c2 nf2c0 10 1500
Disable Broadcast nf2c3 nf2c0 10 1500
Preparation for flow1+2 traffic[1]
nf2c0 nf2c2 10 1500
Preparation for flow1+2 traffic[2]
nf2c0 nf2c3 10 1500
Input Traffic nf2c1 nf2c3 10 1500
Then we need to generate the flow 1+2 input traffic. One way is to selectively
combine the two trace files generated above ([1] and [2]). Details settings are described
in Figure 7. You will need to generate 3 traffic files with the following setting
#Packet in [1] : #Packet in [2] #Total Packet
1:9 50
5:5 50
9:1 50
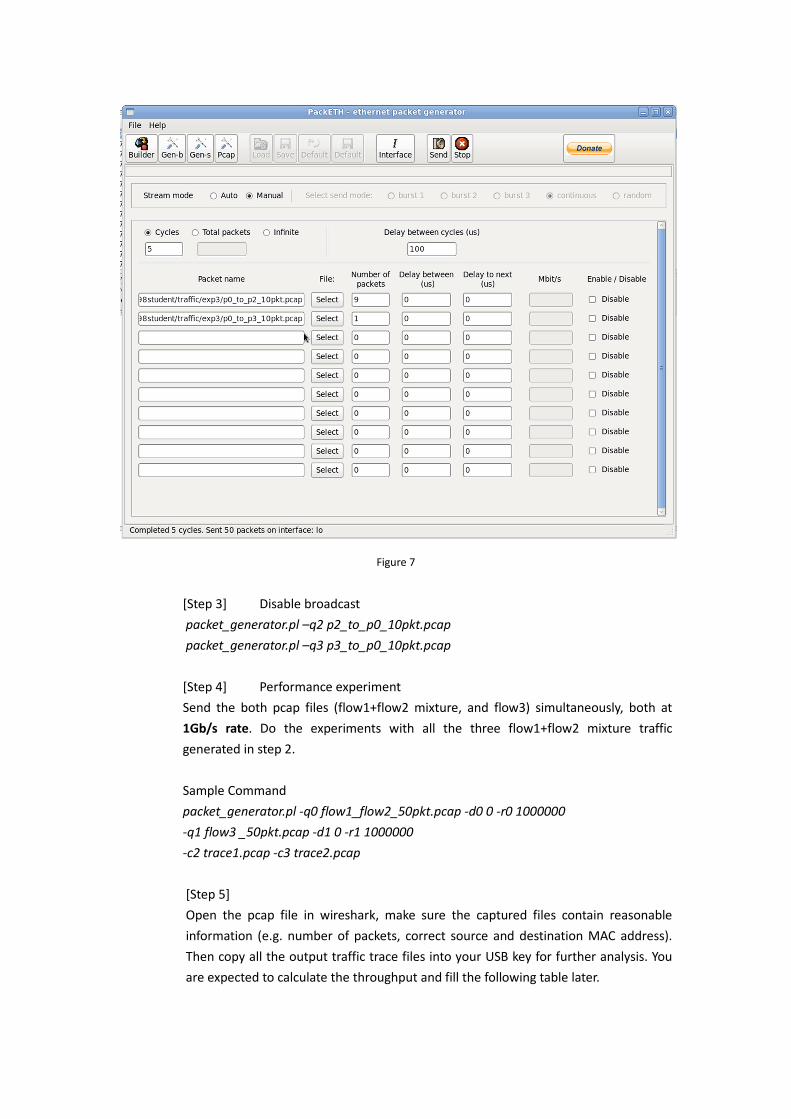
Figure 7
[Step 3] Disable broadcast
packet_generator.pl –q2 p2_to_p0_10pkt.pcap
packet_generator.pl –q3 p3_to_p0_10pkt.pcap
[Step 4] Performance experiment
Send the both pcap files (flow1+flow2 mixture, and flow3) simultaneously, both at
1Gb/s rate. Do the experiments with all the three flow1+flow2 mixture traffic
generated in step 2.
Sample Command
packet_generator.pl -q0 flow1_flow2_50pkt.pcap -d0 0 -r0 1000000
-q1 flow3 _50pkt.pcap -d1 0 -r1 1000000
-c2 trace1.pcap -c3 trace2.pcap
[Step 5]
Open the pcap file in wireshark, make sure the captured files contain reasonable
information (e.g. number of packets, correct source and destination MAC address).
Then copy all the output traffic trace files into your USB key for further analysis. You
are expected to calculate the throughput and fill the following table later.
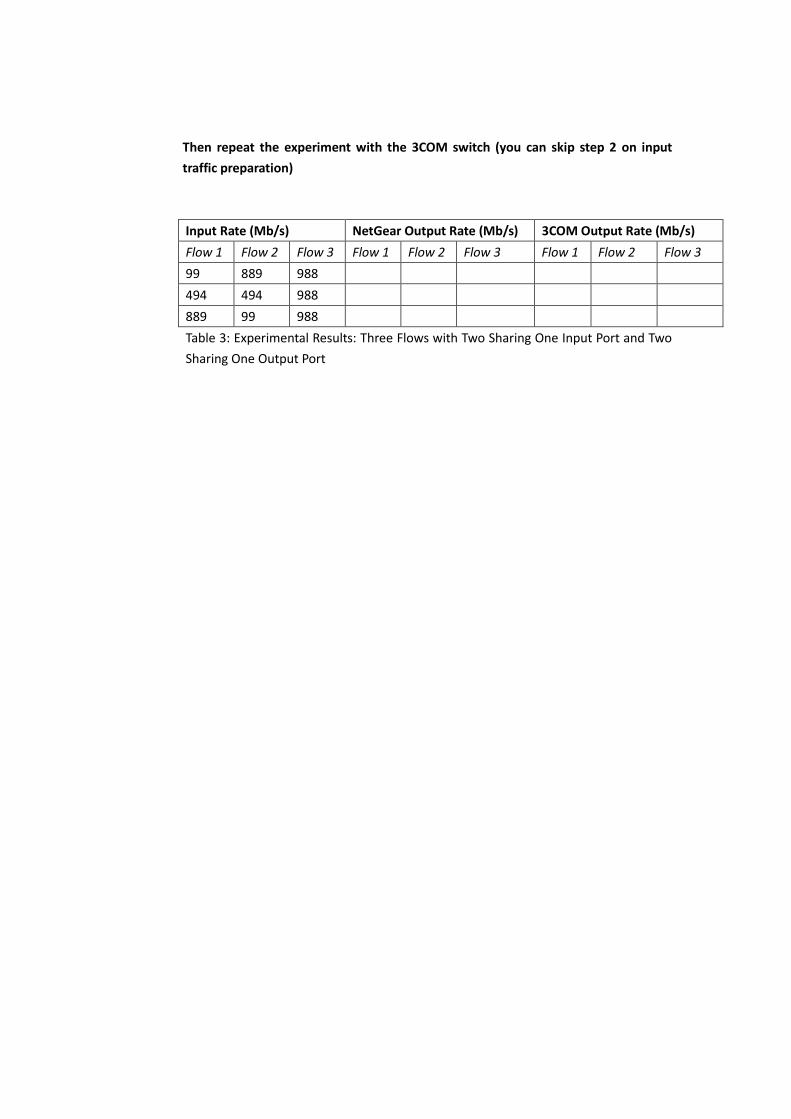
Then repeat the experiment with the 3COM switch (you can skip step 2 on input
traffic preparation)
Input Rate (Mb/s) NetGear Output Rate (Mb/s) 3COM Output Rate (Mb/s)
Flow 1 Flow 2 Flow 3 Flow 1 Flow 2 Flow 3 Flow 1 Flow 2 Flow 3
99 889 988
494 494 988
889 99 988
Table 3: Experimental Results: Three Flows with Two Sharing One Input Port and Two
Sharing One Output Port
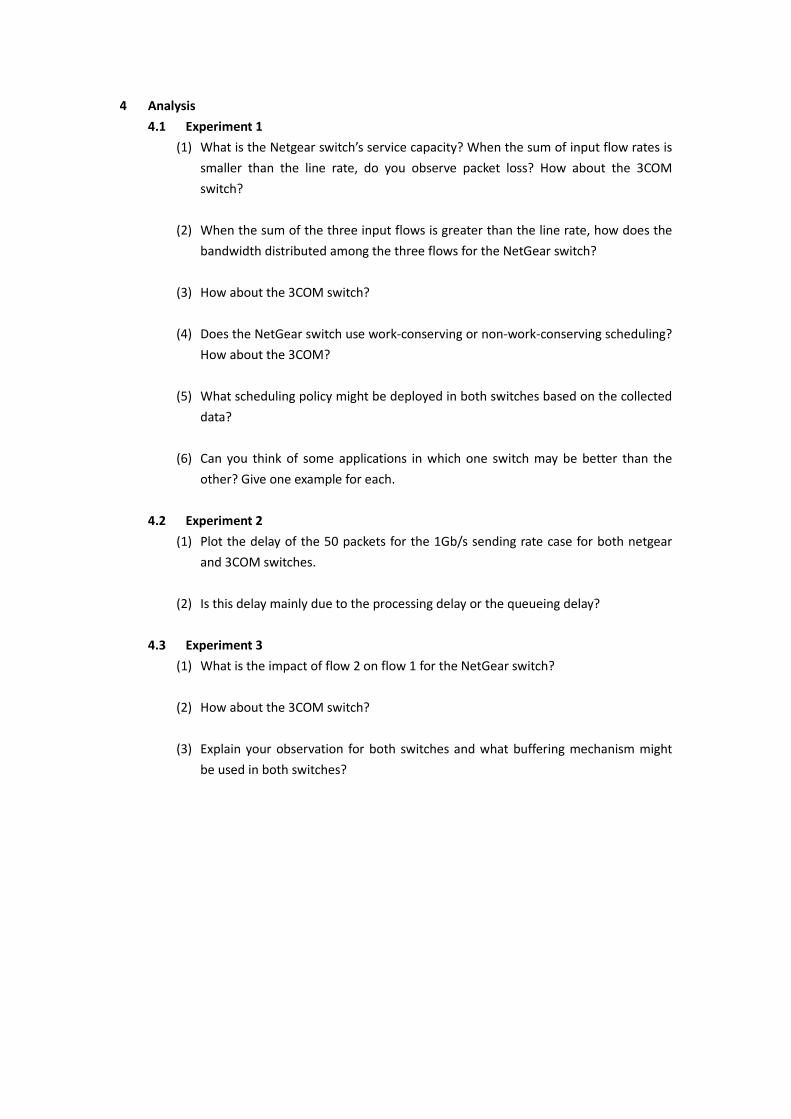
4 Analysis
4.1 Experiment 1
(1) What is the Netgear switch’s service capacity? When the sum of input flow rates is
smaller than the line rate, do you observe packet loss? How about the 3COM
switch?
(2) When the sum of the three input flows is greater than the line rate, how does the
bandwidth distributed among the three flows for the NetGear switch?
(3) How about the 3COM switch?
(4) Does the NetGear switch use work-conserving or non-work-conserving scheduling?
How about the 3COM?
(5) What scheduling policy might be deployed in both switches based on the collected
data?
(6) Can you think of some applications in which one switch may be better than the
other? Give one example for each.
4.2 Experiment 2
(1) Plot the delay of the 50 packets for the 1Gb/s sending rate case for both netgear
and 3COM switches.
(2) Is this delay mainly due to the processing delay or the queueing delay?
4.3 Experiment 3
(1) What is the impact of flow 2 on flow 1 for the NetGear switch?
(2) How about the 3COM switch?
(3) Explain your observation for both switches and what buffering mechanism might
be used in both switches?
5 Report
You report will include all the tables in the three experiments as well the questions in the
analysis section.
Please submit through the compass website and clearly state all the group members’
names and NetIDs. PDF or MS Word documents are accepted.
6 Reference
[1] G. Watson, N. McKeown, and M. Casado. NetFPGA: A tool for network research and
education. In Workshop on Architecture Research using FPGA Platforms, 2006.
[2] G. Covington, G. Gibb, J. Lockwood, and N. McKeown. A packet generator on the netfpga
platform. In IEEE Symposium on Field-Programmable Custom Computing Machines
(FCCM), 2009