Embed Size (px)
Citation preview
Lab ResponsibleBudget Responsible
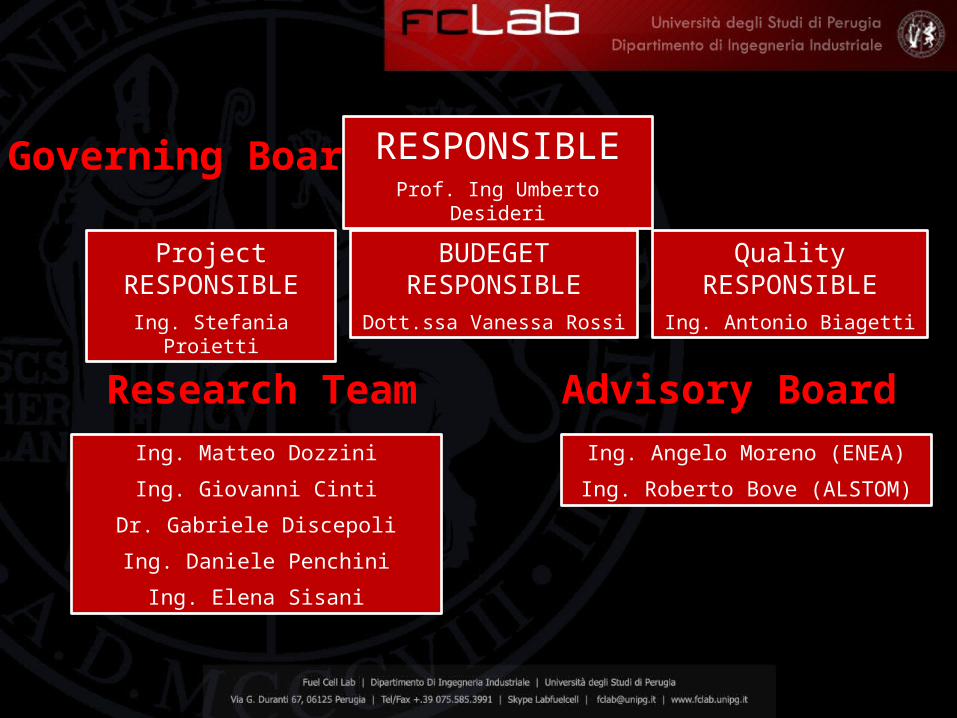
Governing Board RESPONSIBLEProf. Ing Umberto Desideri
Ing. Matteo Dozzini
Ing. Giovanni Cinti
Dr. Gabriele Discepoli
Ing. Daniele Penchini
Ing. Elena Sisani
BUDEGET RESPONSIBLEDott.ssa Vanessa Rossi
Project RESPONSIBLEIng. Stefania Proietti
Quality RESPONSIBLEIng. Antonio Biagetti
Research Team Advisory BoardIng. Angelo Moreno (ENEA)
Ing. Roberto Bove (ALSTOM)
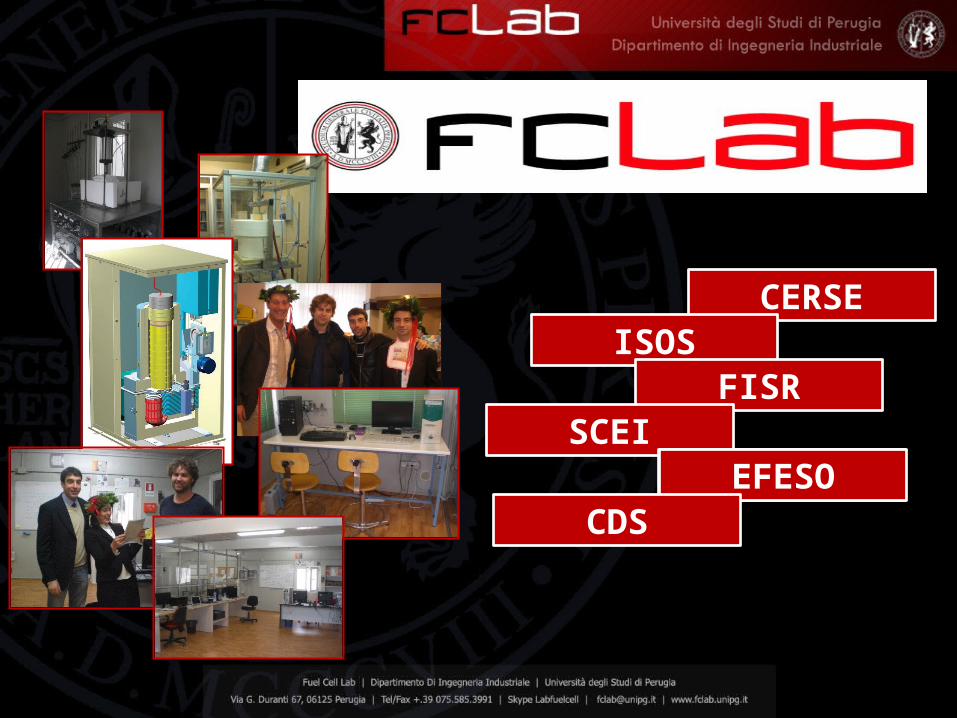
CERSEISOS
FISRSCEI
EFESOEFESOCDS
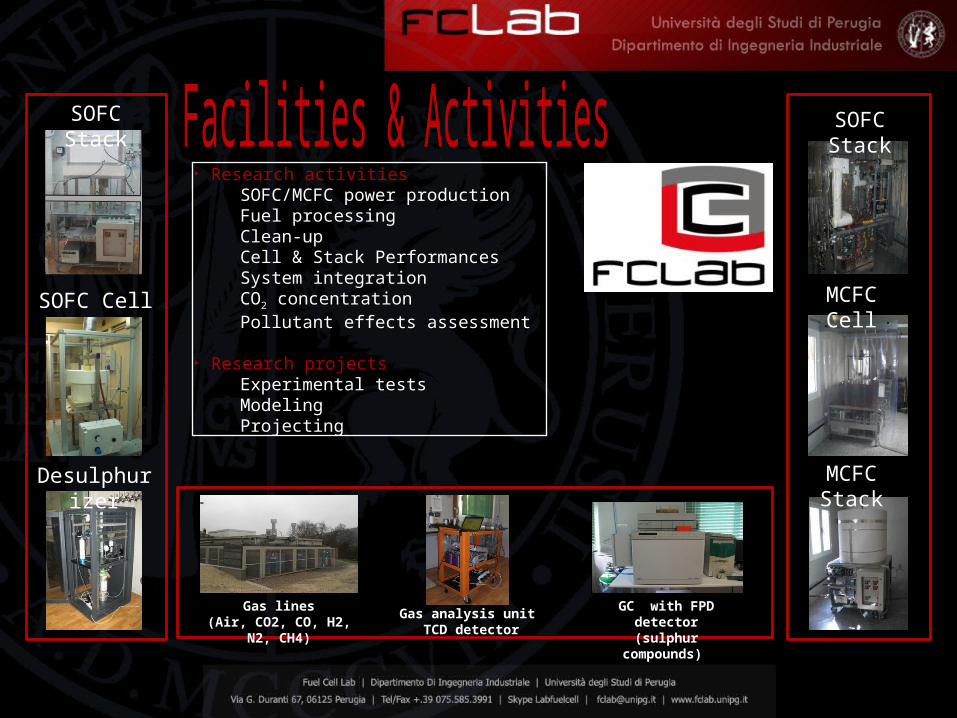
SOFC Stack
SOFC Cell
Desulphurizer
SOFC Stack
MCFC Cell
MCFC Stack
Gas analysis unit TCD detector
GC with FPD detector(sulphur compounds)
Gas lines(Air, CO2, CO, H2, N2, CH4)
‣ Research activitiesSOFC/MCFC power productionFuel processingClean-upCell & Stack PerformancesSystem integrationCO2 concentrationPollutant effects assessment
‣ Research projectsExperimental testsModelingProjecting

Tlow
= 232.07 KT
high = 353.56 K
P = -18.55 kW
i = 62.5 %
m,el
= 84.57 %P = -1.28 kW
i = 70 %
m,el
= 90 %
p = 0.05 barp = 0.30 bar
P = -0.45 kW
i = 70 %
m,el
= 90 % H = 200.34 kW
P = -5.09 kW
i = 62.5 %
m,el
= 76.36 %
E
= 23.25 kW
E,in = 0.00 kW
E
= 437.15 kW
E,in = 0.00 kW
E,in
= 439.91 kW
E = 40.92 kW
= 4.10
H,reac = -110.38 kW
Tlow
= 360.51 KT
high = 59.91 K
Ex
= 33.15 kW
H,trans = 100.089 kW
Tlow
= 624.13 KT
high = 103.69 K
E
= 0.00 kW
H,trans = 16.0388 kW
xSF
= 3.00 kg/kg
Treac
= 600.00 °Cp
reac = 1.00 bar
H,trans
= 83.39 kWT
sec = -221.59 °C
Vfc = 0.7938 V
ifc = 1200.00 A/m
2
Afc = 290.00 m
2
Rfc = 7e-05 m
2
uF = 70.00 %
uO = 18.56 %
Tfc = 800.00 °C
Pel,DC
= 276.25 kWP
el,AC = 265.20 kW
DC/AC
= 96.00 %
1.070 925.28
-2048.78 0.272
1.070 925.28
-2048.78 0.272
2929
1.060 703.69
-2355.55 0.272
2828
1.000 15.00
-98.85 0.2352727
1.200 15.00
-15908.41 0.027
2626
1.500 15.00
-15908.38 0.0272525
2424
2323
1.020 40.00
-3519.74 0.272
2222
1.017 15.00
-4467.65 0.009
2121
1.200 35.77
-4423.29 0.009
2020
1919 1.040 375.51
-2782.75 0.272
1818 1.050 659.91
-2414.55 0.272
1717
1616
1515 1.120 613.86
-7591.63 0.037
1414
1.130 750.00
685.26 1.061
1313
1.090 850.00
-9965.82 0.0651212
1.090 850.00
800.80 0.206
1111
1.130 31.36
-82.33 0.235
1010
99
1.130 866.11
819.81 0.825
88
77
66
55
1.170 600.00
-12266.07 0.027
44
1.090 850.00
-9965.82 0.065
33
1.170 600.00
-2672.30 0.009
22
1.100 850.00
-9965.82 0.131
11
24
23
22
H
21
20
19
18
17
16
15
14
13
12
11109
8
7
5
4
H
3
H
2
1
A C
p T
h m
p = Pressure [bar]
T = Temperature [°C]
h = Enthalpy [kJ/kg]
m = Mass flow [kg/s]
Vfc = Cell voltage [V]
ifc = Current density [A/m
2]
Afc = Cell area [m
2]
Rfc = Cell resistance [ m
2]
uF = Fuel uti l isation [%]
uO = Oxidant util isation [%]
Tfc = Fuelcell temperature [°C]
Pel,DC
= DC Power [kW]
Pel,AC
= AC Power [kW]
DC/AC = DC/AC conversion eff. [%]
xSF
= Steam-fuel ratio [kg/kg]
Treac
= Reaction temperature [°C]
preac
= Reaction pressure [bar]
H,trans = Transmitted heat flow [kW]
Tlow
= Low end temp. diff. [K]T
high = High end temp. diff. [K ]
E
= Energy loss [kW]
ex = Exergy loss [kW]
= Airfactor [-]
H,reac = Reaction heat [kW]
E,in
= Energy input [kW]
P = Power [kW]
i = Isentropic efficiency [%]
m,e
= Mechanical*Electrical eff. [%]
H = Heat output [kW]
p = Pressure drop [bar]T
sec = Temperature rise (secondary) [°C]
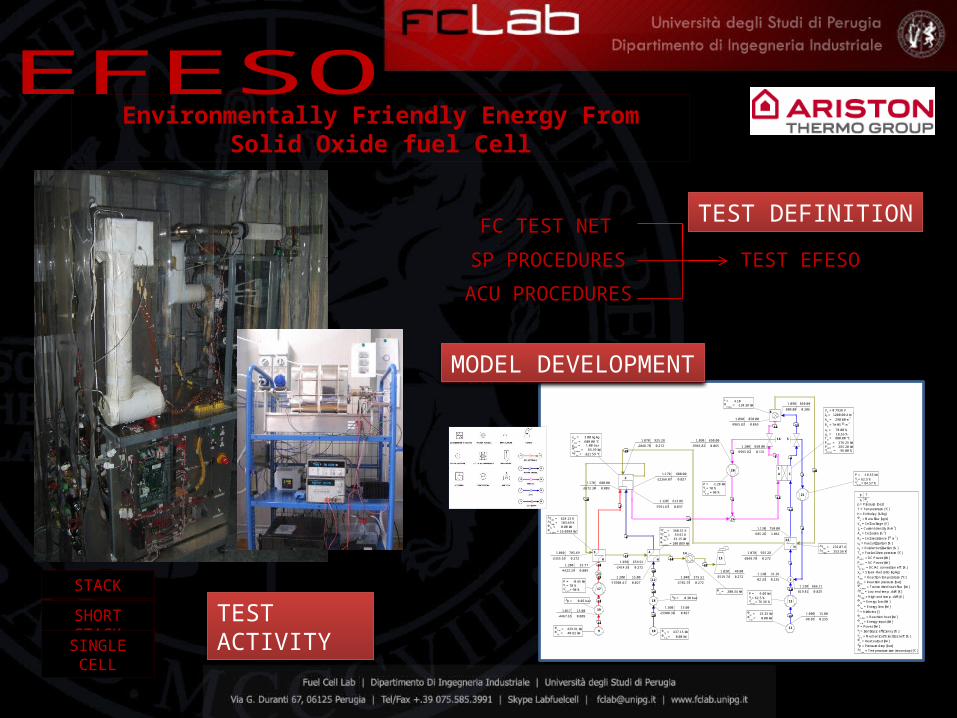
FC TEST NET
SP PROCEDURES
ACU PROCEDURES
TEST EFESO
TEST DEFINITION
MODEL DEVELOPMENT
TEST ACTIVITY
Environmentally Friendly Energy From Solid Oxide fuel Cell
STACK
SHORT STACK
SINGLE CELL
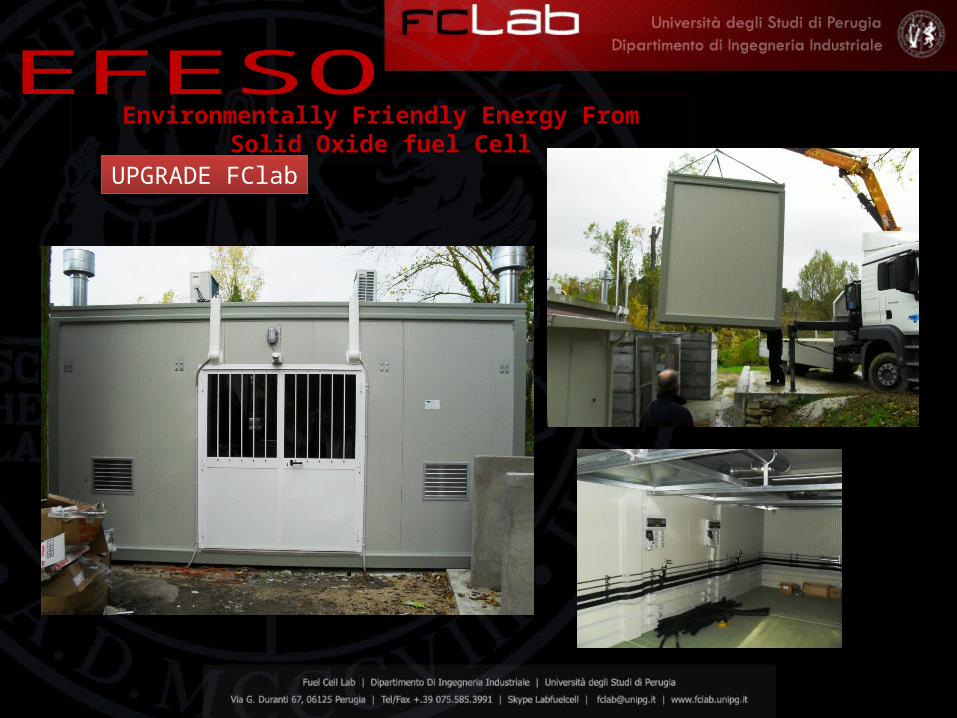
UPGRADE FClab
Environmentally Friendly Energy From Solid Oxide fuel Cell
Tlow
= 232.07 KT
high = 353.56 K
P = -18.55 kW
i = 62.5 %
m,el
= 84.57 %P = -1.28 kW
i = 70 %
m,el
= 90 %
p = 0.05 barp = 0.30 bar
P = -0.45 kW
i = 70 %
m,el
= 90 % H = 200.34 kW
P = -5.09 kW
i = 62.5 %
m,el
= 76.36 %
E
= 23.25 kW
E,in = 0.00 kW
E
= 437.15 kW
E,in = 0.00 kW
E,in
= 439.91 kW
E = 40.92 kW
= 4.10
H,reac = -110.38 kW
Tlow
= 360.51 KT
high = 59.91 K
Ex
= 33.15 kW
H,trans = 100.089 kW
Tlow
= 624.13 KT
high = 103.69 K
E
= 0.00 kW
H,trans = 16.0388 kW
xSF
= 3.00 kg/kg
Treac
= 600.00 °Cp
reac = 1.00 bar
H,trans
= 83.39 kWT
sec = -221.59 °C
Vfc = 0.7938 V
ifc = 1200.00 A/m
2
Afc = 290.00 m
2
Rfc = 7e-05 m
2
uF = 70.00 %
uO = 18.56 %
Tfc = 800.00 °C
Pel,DC
= 276.25 kWP
el,AC = 265.20 kW
DC/AC
= 96.00 %
1.070 925.28
-2048.78 0.272
1.070 925.28
-2048.78 0.272
2929
1.060 703.69
-2355.55 0.272
2828
1.000 15.00
-98.85 0.2352727
1.200 15.00
-15908.41 0.027
2626
1.500 15.00
-15908.38 0.0272525
2424
2323
1.020 40.00
-3519.74 0.272
2222
1.017 15.00
-4467.65 0.009
2121
1.200 35.77
-4423.29 0.009
2020
1919 1.040 375.51
-2782.75 0.272
1818 1.050 659.91
-2414.55 0.272
1717
1616
1515 1.120 613.86
-7591.63 0.037
1414
1.130 750.00
685.26 1.061
1313
1.090 850.00
-9965.82 0.0651212
1.090 850.00
800.80 0.206
1111
1.130 31.36
-82.33 0.235
1010
99
1.130 866.11
819.81 0.825
88
77
66
55
1.170 600.00
-12266.07 0.027
44
1.090 850.00
-9965.82 0.065
33
1.170 600.00
-2672.30 0.009
22
1.100 850.00
-9965.82 0.131
11
24
23
22
H
21
20
19
18
17
16
15
14
13
12
11109
8
7
5
4
H
3
H
2
1
A C
p T
h m
p = Pressure [bar]
T = Temperature [°C]
h = Enthalpy [kJ/kg]
m = Mass flow [kg/s]
Vfc = Cell voltage [V]
ifc = Current density [A/m
2]
Afc = Cell area [m
2]
Rfc = Cell resistance [ m
2]
uF = Fuel uti l isation [%]
uO = Oxidant util isation [%]
Tfc = Fuelcell temperature [°C]
Pel,DC
= DC Power [kW]
Pel,AC
= AC Power [kW]
DC/AC = DC/AC conversion eff. [%]
xSF
= Steam-fuel ratio [kg/kg]
Treac
= Reaction temperature [°C]
preac
= Reaction pressure [bar]
H,trans = Transmitted heat flow [kW]
Tlow
= Low end temp. diff. [K]T
high = High end temp. diff. [K ]
E
= Energy loss [kW]
ex = Exergy loss [kW]
= Airfactor [-]
H,reac = Reaction heat [kW]
E,in
= Energy input [kW]
P = Power [kW]
i = Isentropic efficiency [%]
m,e
= Mechanical*Electrical eff. [%]
H = Heat output [kW]
p = Pressure drop [bar]T
sec = Temperature rise (secondary) [°C]
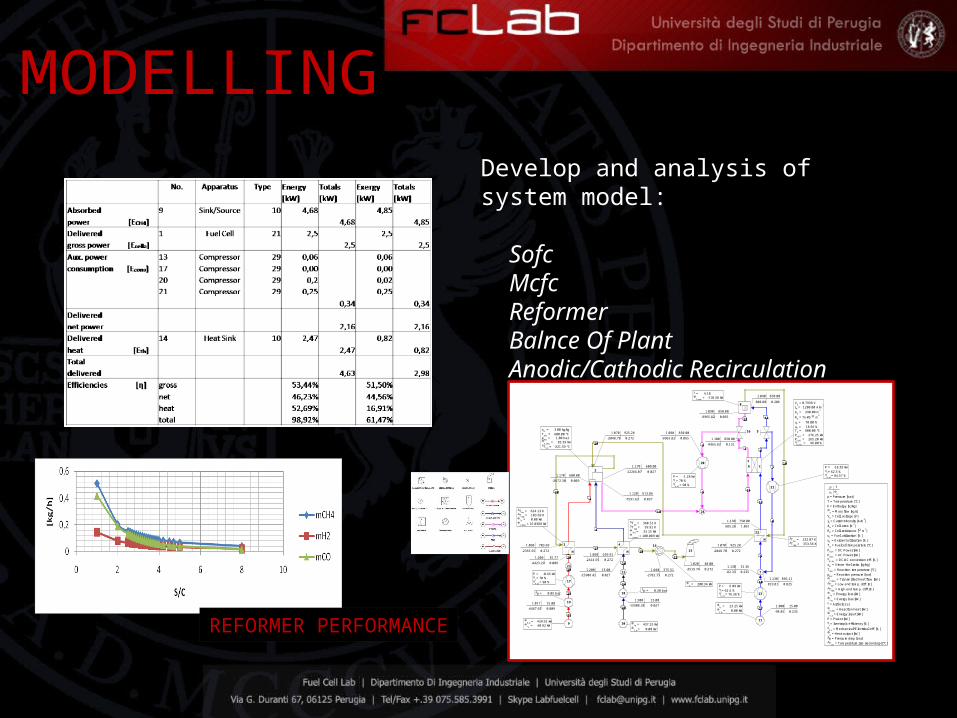
Develop and analysis of system model:
Sofc McfcReformerBalnce Of PlantAnodic/Cathodic Recirculation
REFORMER PERFORMANCE
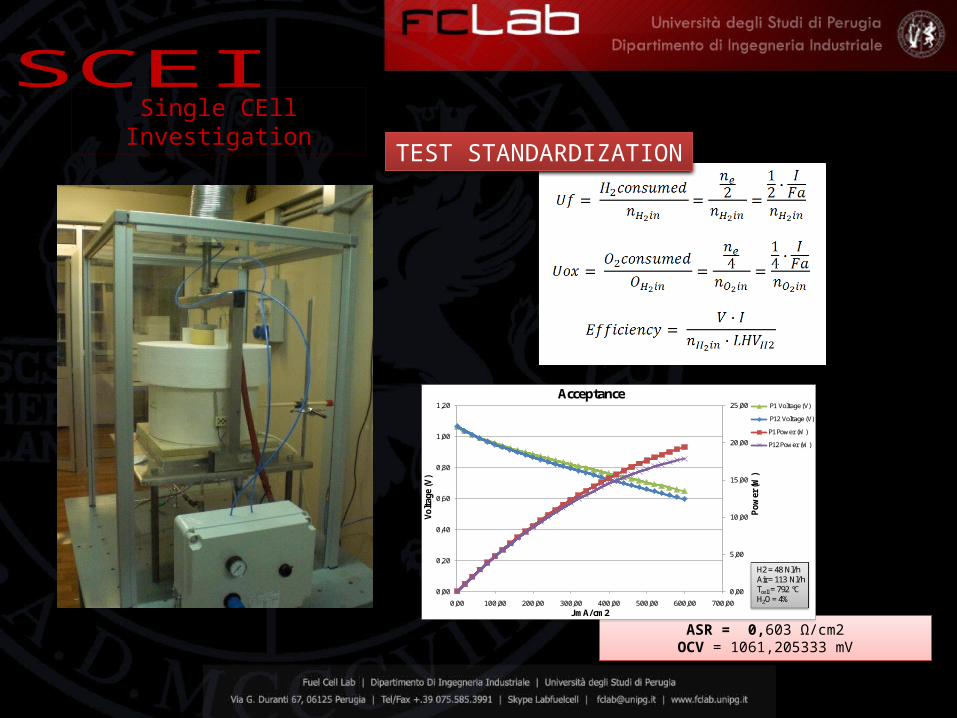
ASR = 0,603 Ω/cm2OCV = 1061,205333 mV
Single CEll Investigation
0,00
5,00
10,00
15,00
20,00
25,00
0,00
0,20
0,40
0,60
0,80
1,00
1,20
0,00 100,00 200,00 300,00 400,00 500,00 600,00 700,00
Pow
er (W
)
Volt
age
(V)
J mA/cm2
AcceptanceP1 Voltage (V)
P12 Voltage (V)
P1 Power (W)
P12 Power (W)
H2 = 48 Nl/hAir = 113 Nl/hTcell = 792 °CH2O = 4%
TEST STANDARDIZATION
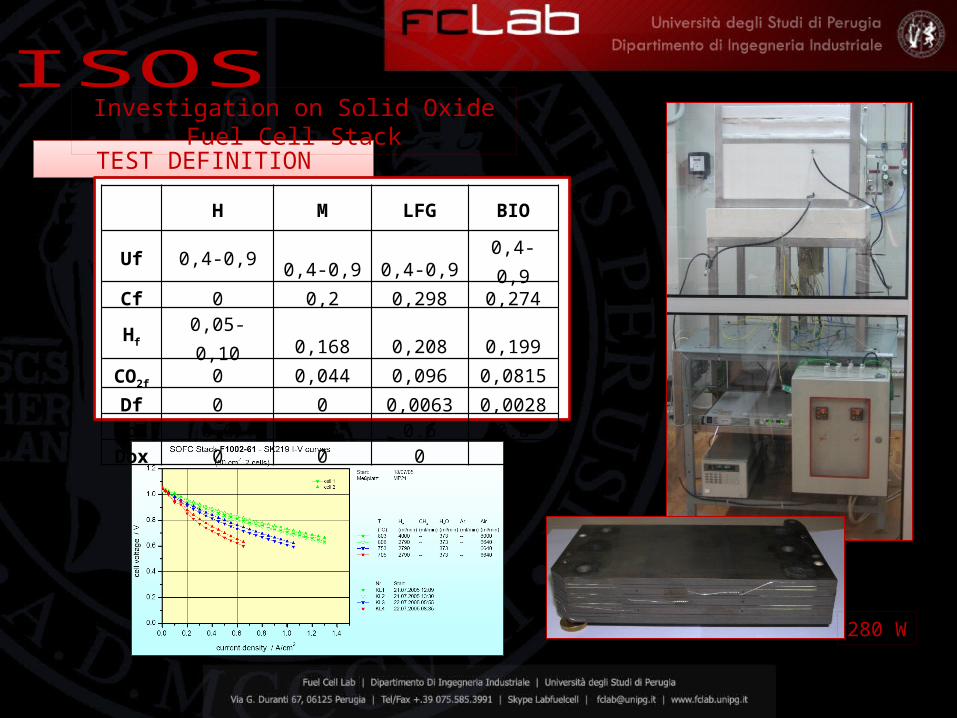
TEST DEFINITION
Investigation on Solid Oxide Fuel Cell Stack
H M LFG BIO
Uf 0,4-0,9 0,4-0,9 0,4-0,9 0,4-0,9Cf 0 0,2 0,298 0,274Hf 0,05-0,10 0,168 0,208 0,199
CO2f 0 0,044 0,096 0,0815Df 0 0 0,0063 0,0028
Uox 0.6 0.6 0.6 0.6Dox 0 0 0 0
280 W
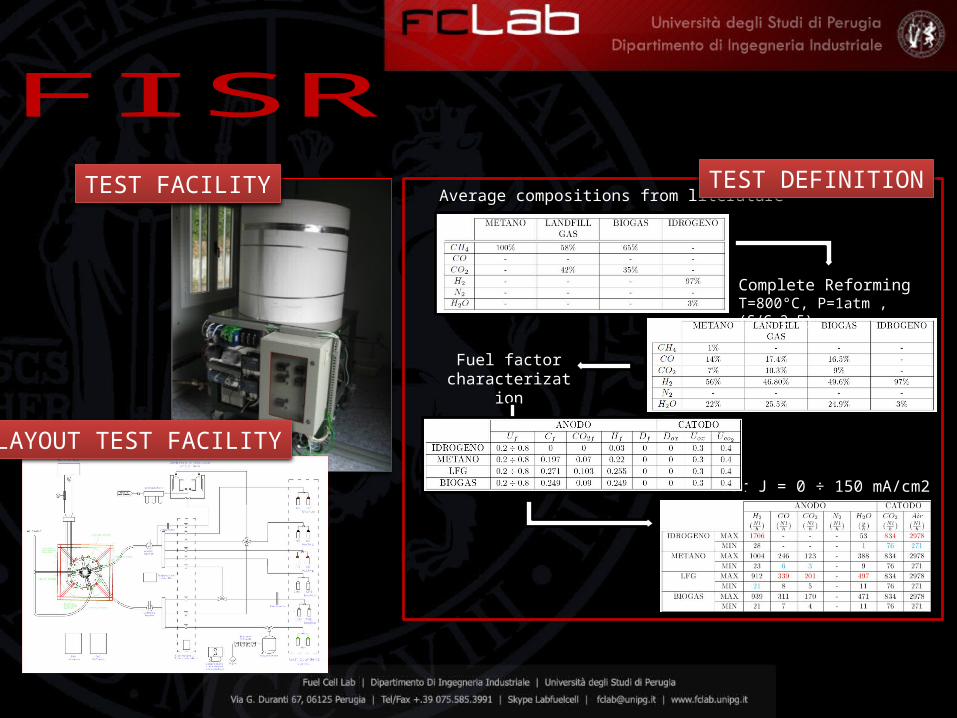
Complete Reforming T=800°C, P=1atm , (S/C=2,5)
Average compositions from literature
Fuel factor characterization
for J = 0 ÷ 150 mA/cm2
TEST DEFINITIONTEST FACILITY
LAYOUT TEST FACILITY
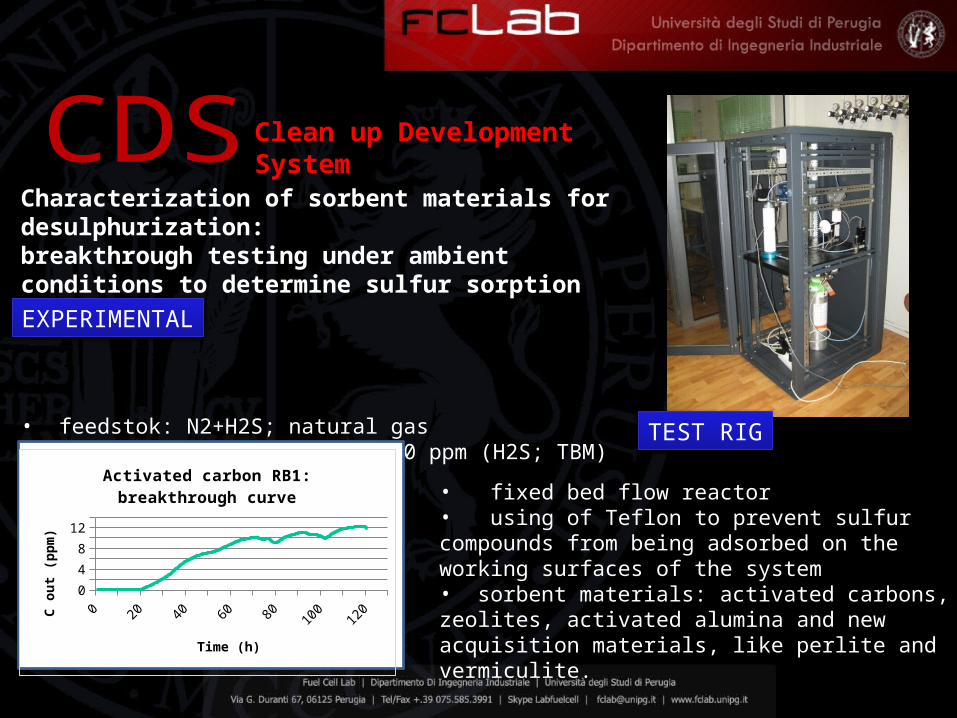
Clean up Development System
Characterization of sorbent materials for desulphurization: breakthrough testing under ambient conditions to determine sulfur sorption capacity
• feedstok: N2+H2S; natural gas• sulphur concentration: 10-20 ppm (H2S; TBM) • flow: 24 nl/h
0 10 20 30 40 50 60 70 80 90 100 110 120 13002468
101214
Activated carbon RB1: breakthrough curve
Time (h)
C ou
t (pp
m)
• fixed bed flow reactor• using of Teflon to prevent sulfur compounds from being adsorbed on the working surfaces of the system • sorbent materials: activated carbons, zeolites, activated alumina and new acquisition materials, like perlite and vermiculite.
TEST RIG
EXPERIMENTAL
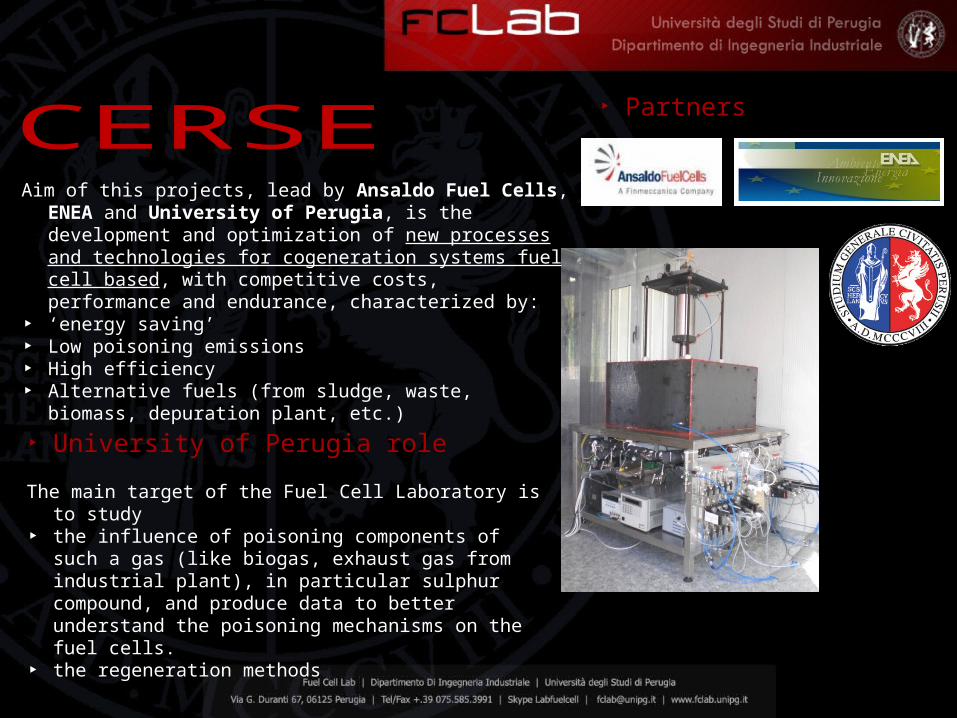
Aim of this projects, lead by Ansaldo Fuel Cells, ENEA and University of Perugia, is the development and optimization of new processes and technologies for cogeneration systems fuel cell based, with competitive costs, performance and endurance, characterized by:
‣ ‘energy saving’‣ Low poisoning emissions‣ High efficiency‣ Alternative fuels (from sludge, waste, biomass,
depuration plant, etc.)
‣ Partners
‣ University of Perugia role
The main target of the Fuel Cell Laboratory is to study‣ the influence of poisoning components of such a gas
(like biogas, exhaust gas from industrial plant), in particular sulphur compound, and produce data to better understand the poisoning mechanisms on the fuel cells.
‣ the regeneration methods
‣ Partners
‣ Partners
1111
88
77
66
55
44
33
22
11
11
8
7
6
5
4
32
1
A C
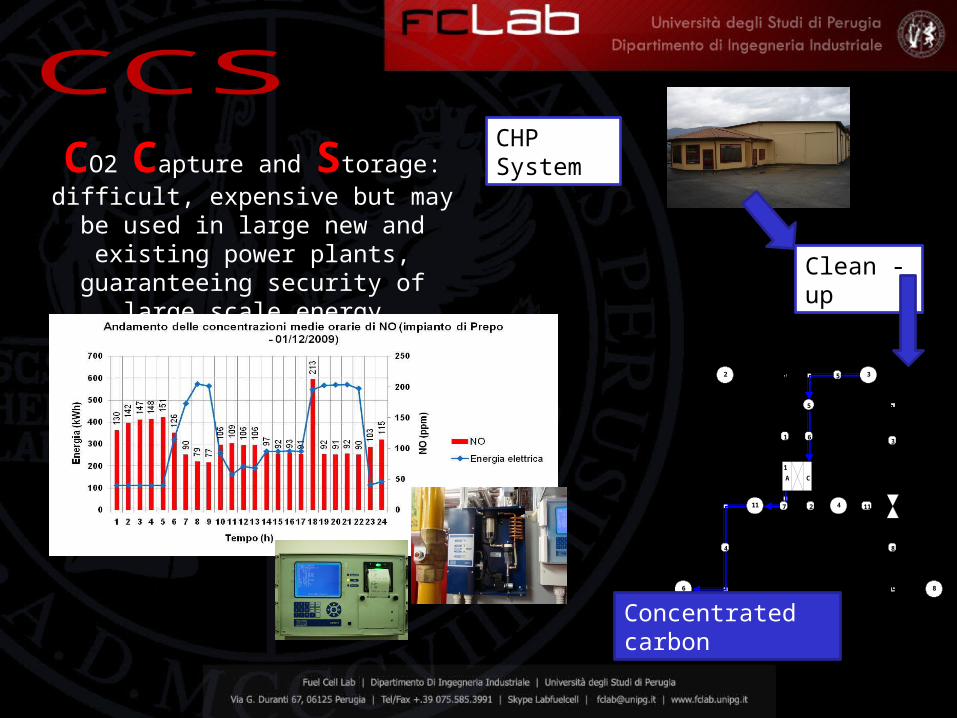
CHP System
Clean - up
Concentrated carbon
CO2 Capture and Storage:difficult, expensive but may be used in large new and existing power plants, guaranteeing security of large scale
energy production
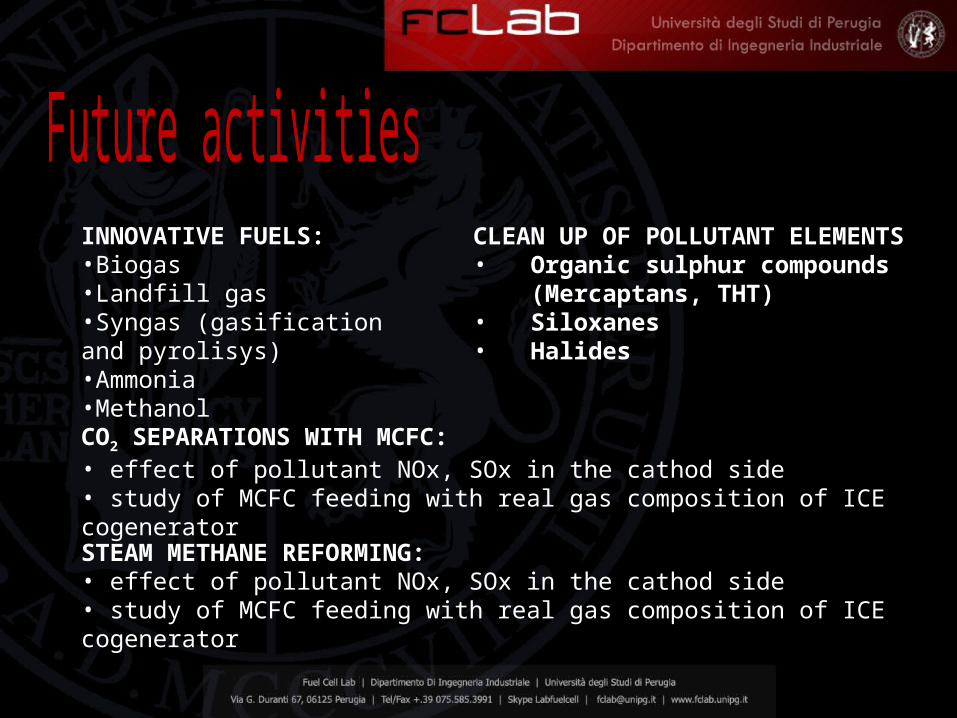
INNOVATIVE FUELS:•Biogas•Landfill gas•Syngas (gasification and pyrolisys)•Ammonia•Methanol
CLEAN UP OF POLLUTANT ELEMENTS• Organic sulphur compounds (Mercaptans, THT)• Siloxanes• Halides
CO2 SEPARATIONS WITH MCFC:• effect of pollutant NOx, SOx in the cathod side• study of MCFC feeding with real gas composition of ICE cogenerator
STEAM METHANE REFORMING:• effect of pollutant NOx, SOx in the cathod side• study of MCFC feeding with real gas composition of ICE cogenerator
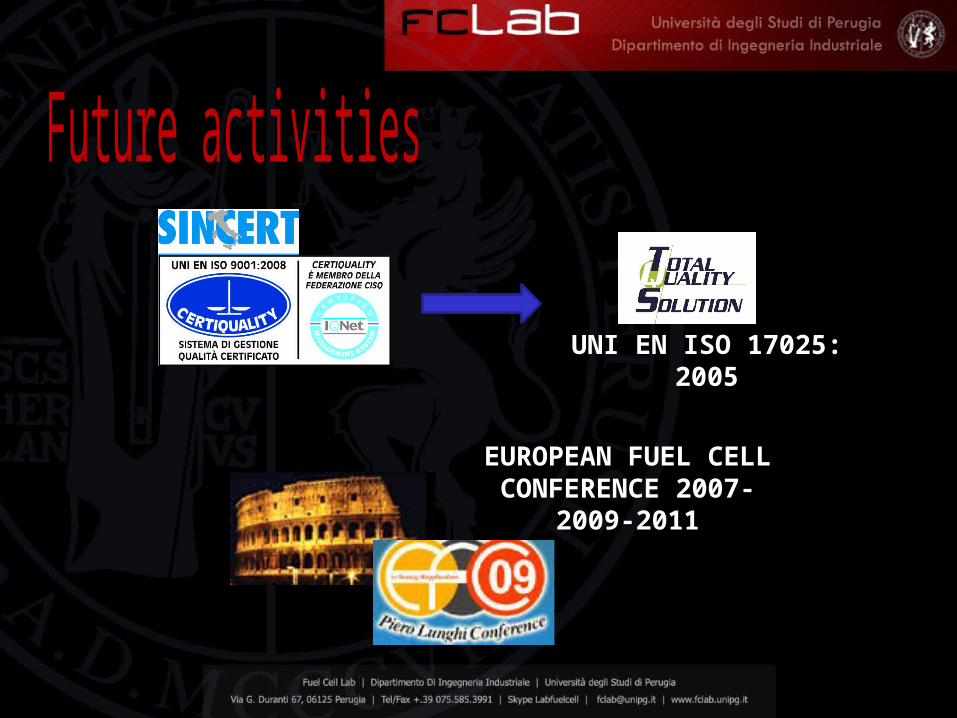
UNI EN ISO 17025: 2005
EUROPEAN FUEL CELL CONFERENCE 2007-2009-
2011
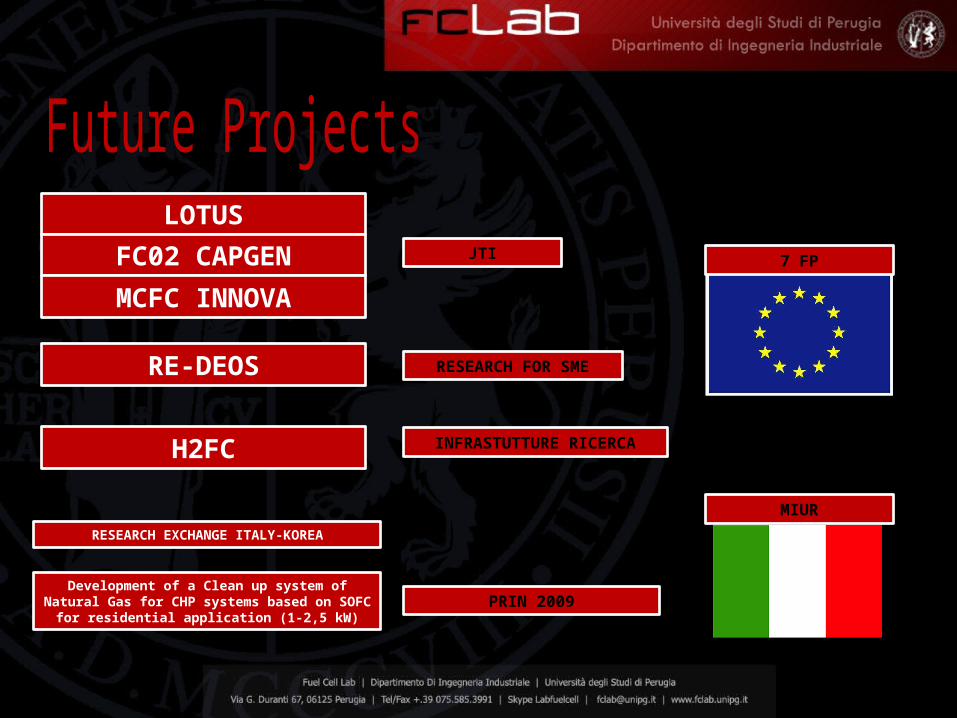
LOTUS
RE-DEOS
H2FC
FC02 CAPGEN
MCFC INNOVA
JTI
RESEARCH FOR SME
INFRASTUTTURE RICERCA
7 FP
Development of a Clean up system of Natural Gas for CHP systems based on
SOFC for residential application (1-2,5 kW)PRIN 2009
MIUR
RESEARCH EXCHANGE ITALY-KOREA