Embed Size (px)
DESCRIPTION
Labor market accessibility and unemployment. Therese Norman Maria Börjesson, Christer Anderstig. Purpose. How do increased labor market accessibility due to transport investments induce changes in the unemployment rate ?. Mechanisms/Hypothesis. - PowerPoint PPT Presentation
Citation preview

Labor market accessibility and unemployment
Therese Norman Maria Börjesson, Christer Anderstig

Purpose
• How do increased labor market accessibility due to transport investments induce changes in the unemployment rate?
Mechanisms/Hypothesis
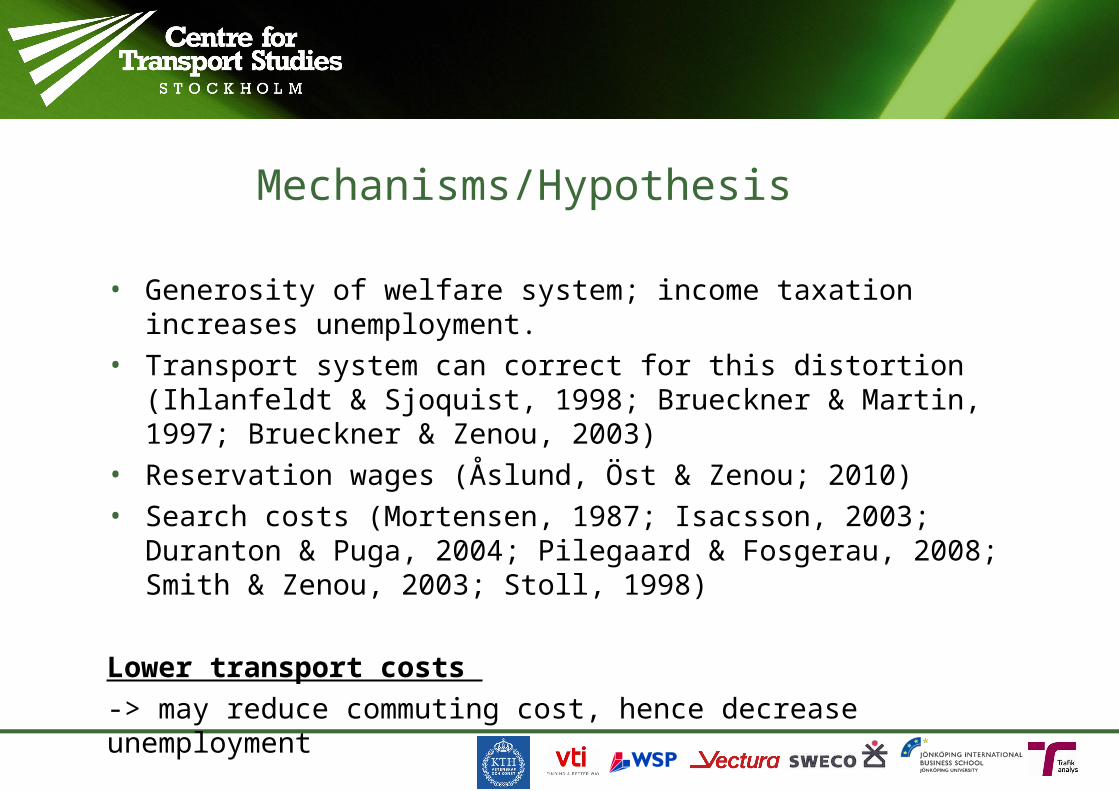
• Generosity of welfare system; income taxation increases unemployment.
• Transport system can correct for this distortion (Ihlanfeldt & Sjoquist, 1998; Brueckner & Martin, 1997; Brueckner & Zenou, 2003)
• Reservation wages (Åslund, Öst & Zenou; 2010)• Search costs (Mortensen, 1987; Isacsson, 2003; Duranton &
Puga, 2004; Pilegaard & Fosgerau, 2008; Smith & Zenou, 2003; Stoll, 1998)
Lower transport costs
-> may reduce commuting cost, hence decrease unemployment
Data
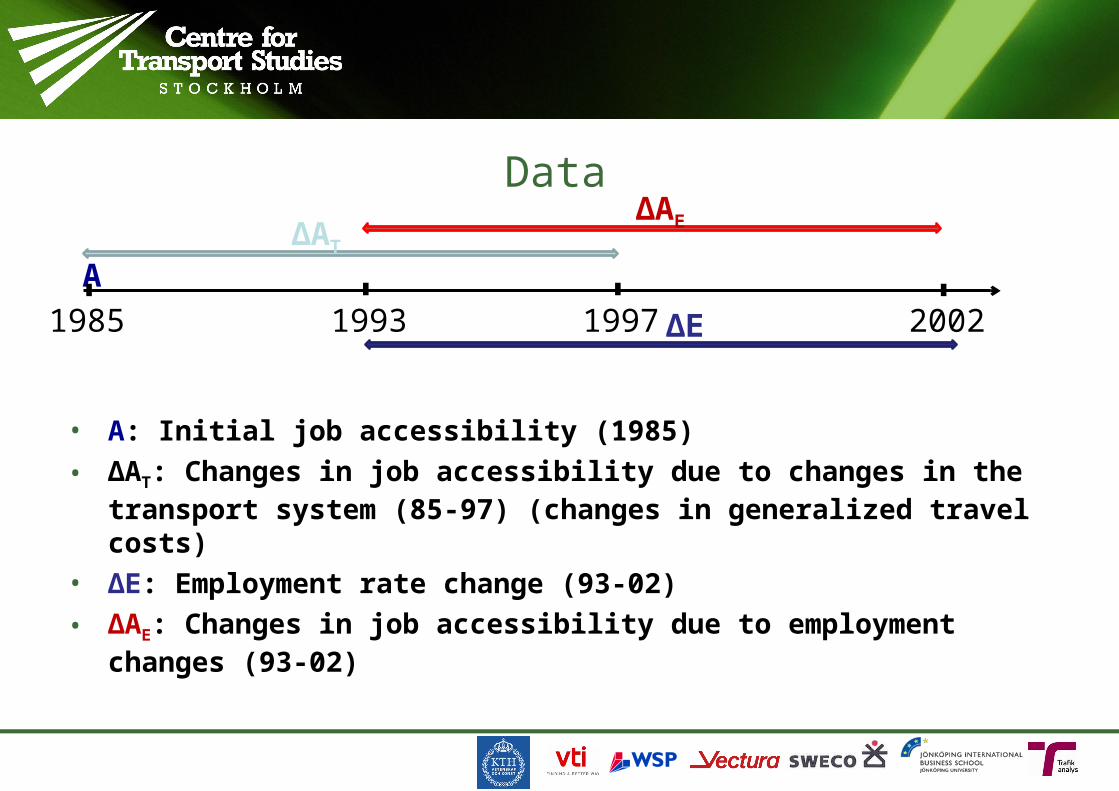
• A: Initial job accessibility (1985)
• ΔAT: Changes in job accessibility due to changes in the transport system (85-97) (changes in generalized travel costs)
• ΔE: Employment rate change (93-02)
• ΔAE: Changes in job accessibility due to employment changes (93-02)
1985 1993 1997 2002
ΔATΔAE
A
ΔE
Data
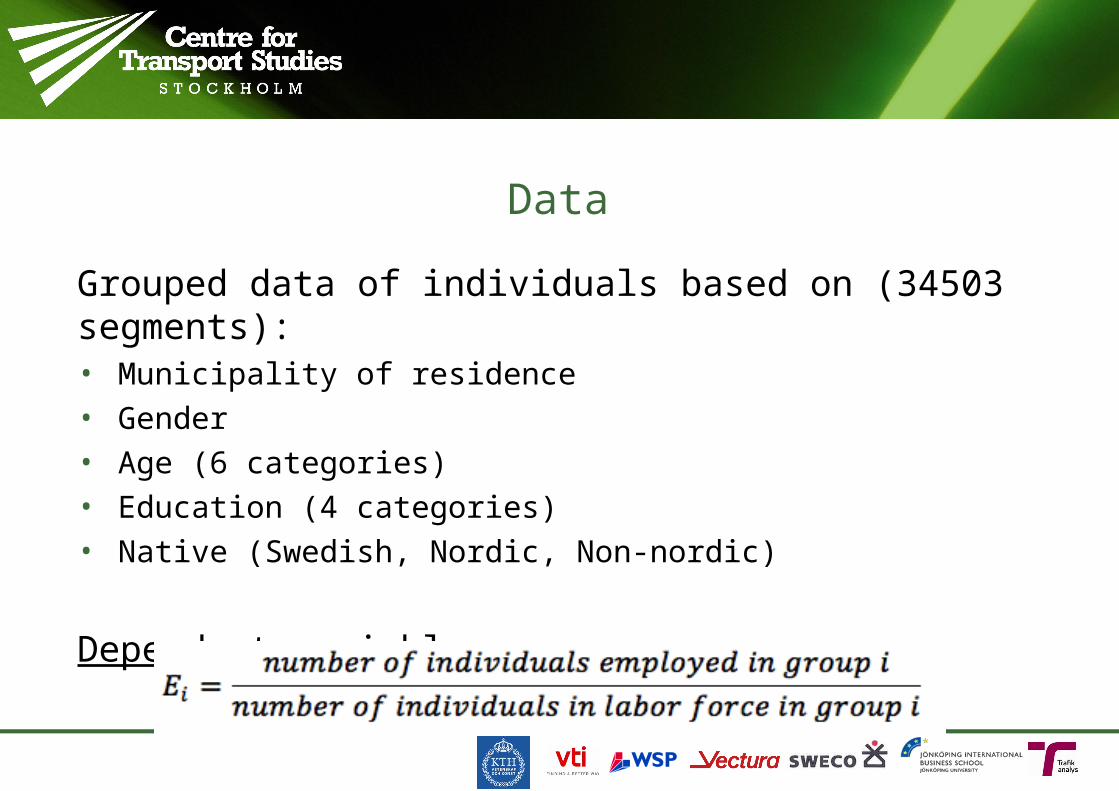
Grouped data of individuals based on (34503 segments):• Municipality of residence• Gender• Age (6 categories)• Education (4 categories)• Native (Swedish, Nordic, Non-nordic)
Dependent variable:
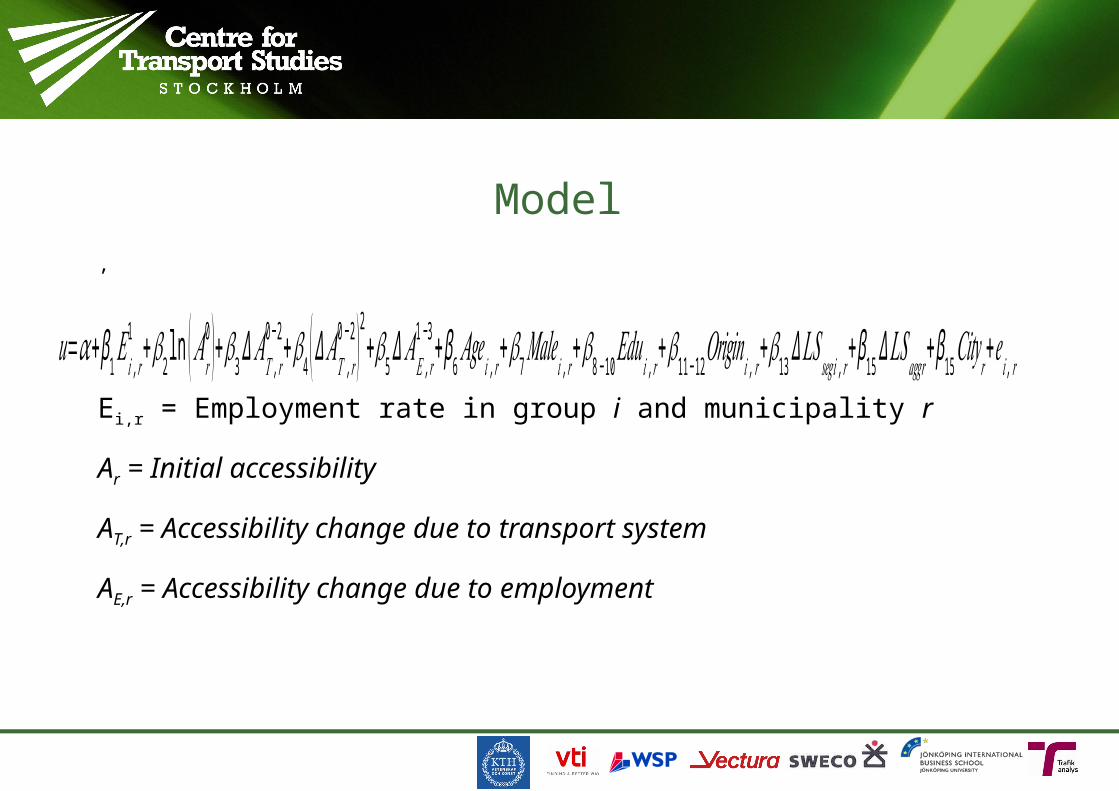
Model,
Ei,r = Employment rate in group i and municipality r
Ar = Initial accessibility
AT,r = Accessibility change due to transport system
AE,r = Accessibility change due to employment
𝑢=𝛼+ β1 𝐸𝑖 ,𝑟1 +𝛽2 ln ( 𝐴𝑟
0 )+𝛽3 Δ 𝐴𝑇 ,𝑟0−2+𝛽4 (Δ 𝐴𝑇 , 𝑟
0−2 )2+𝛽5 Δ 𝐴𝐸 , 𝑟1− 3+ β6 𝐴𝑔𝑒𝑖 , 𝑟+𝛽7 𝑀𝑎𝑙𝑒𝑖 ,𝑟+𝛽8−10 𝐸𝑑𝑢𝑖 , 𝑟+𝛽11−12𝑂𝑟𝑖𝑔𝑖𝑛𝑖 , 𝑟+𝛽13 Δ𝐿𝑆𝑠𝑒𝑔𝑖 ,𝑟+β15∆ 𝐿𝑆𝑎𝑔𝑔𝑟+ β15𝐶𝑖𝑡𝑦𝑟+𝑒𝑖 ,𝑟
• is a negative sensitivity parameter• Accessibility change due to changes in transport
• Accessibility change due to changes in employment
Accessibility
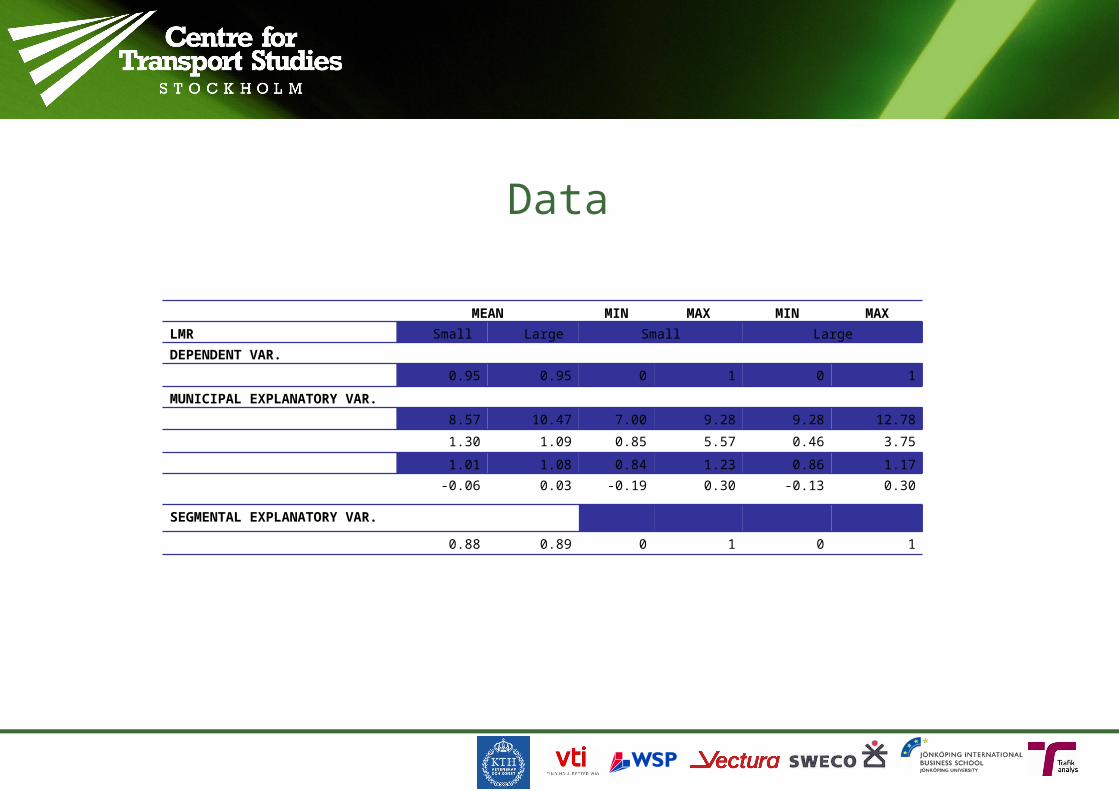
MEAN MIN MAX MIN MAXLMR Small Large Small LargeDEPENDENT VAR.
0.95 0.95 0 1 0 1
MUNICIPAL EXPLANATORY VAR.8.57 10.47 7.00 9.28 9.28 12.78
1.30 1.09 0.85 5.57 0.46 3.75
1.01 1.08 0.84 1.23 0.86 1.17-0.06 0.03 -0.19 0.30 -0.13 0.30
SEGMENTAL EXPLANATORY VAR.
0.88 0.89 0 1 0 1
Data
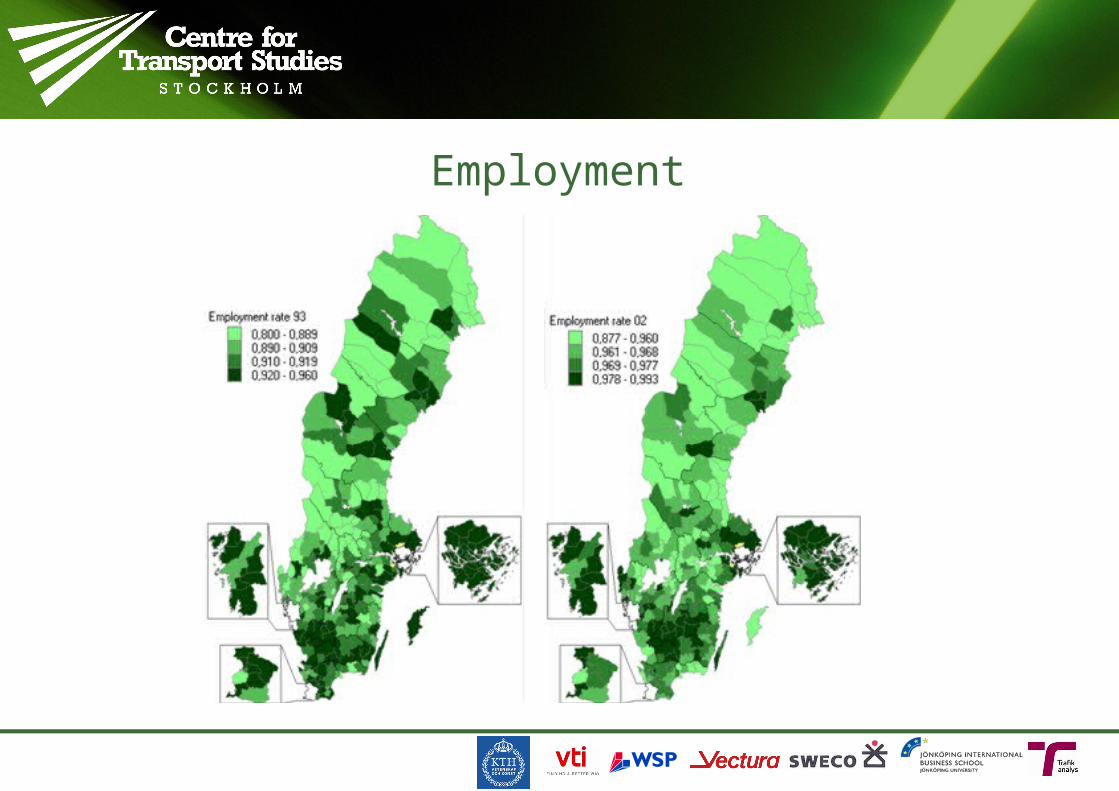
Employment
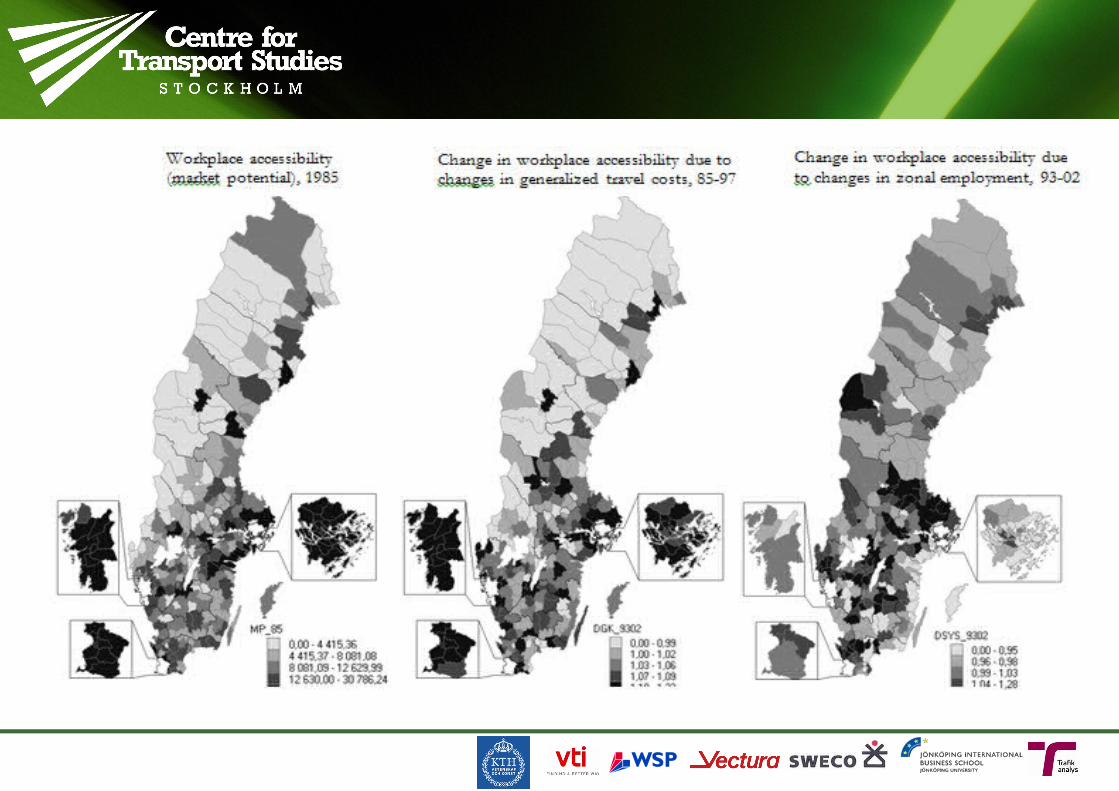
Job accessibility
Indep. Var.All
municipalitiesSmall LMR Large LMR
(1) (3) (4)
lnA0 0.165*** 0.020 0.302***
(0.007) (0.021) (0.010)
∆AT 0.358*** 0.248*** 0.344***
(0.038) (0.050) (0.073)
∆AT2 -0.062*** -0.048*** -0.061***
(0.008) (0.010) (0.018)
∆AE 0.707*** 1.235*** 0.437**
(0.128) (0.209) (0.182)
D_City -0.409*** -0.507***
(0.017) (0.020)
∆LS_agg -0.739*** 3.020*** -1.423***
(0.119) (0.251) (0.141)
ΔLS_seg -1.621*** 0.111 -2.854***
(0.152) (0.296) (0.214)
E93 3.012*** 2.736*** 3.026***
(0.051) (0.083) (0.066)
D_Male -0.018* -0.045** -0.012
(0.010) (0.020) (0.012)
Age -0.115*** -0.173*** -0.100***
(0.004) (0.008) (0.005)
D_Education2 0.207*** 0.129*** 0.221***
(0.013) (0.026) (0.015)
D_Education3 0.468*** 0.596*** 0.455***
(0.017) (0.043) (0.020)
D_Education4 0.744*** 0.923*** 0.722***
(0.019) (0.055) (0.021)
D_Non-nordic -0.809*** -0.635*** -0.829***
(0.014) (0.039) (0.017)
D_Nordic -0.265*** -0.436*** -0.250***
(0.024) (0.040) (0.030)
Constant 0.165*** 0.020 0.302***
(0.007) (0.021) (0.010)
Observations 29,869 13,478 16,391
AIC 0.228 0.243 0.225
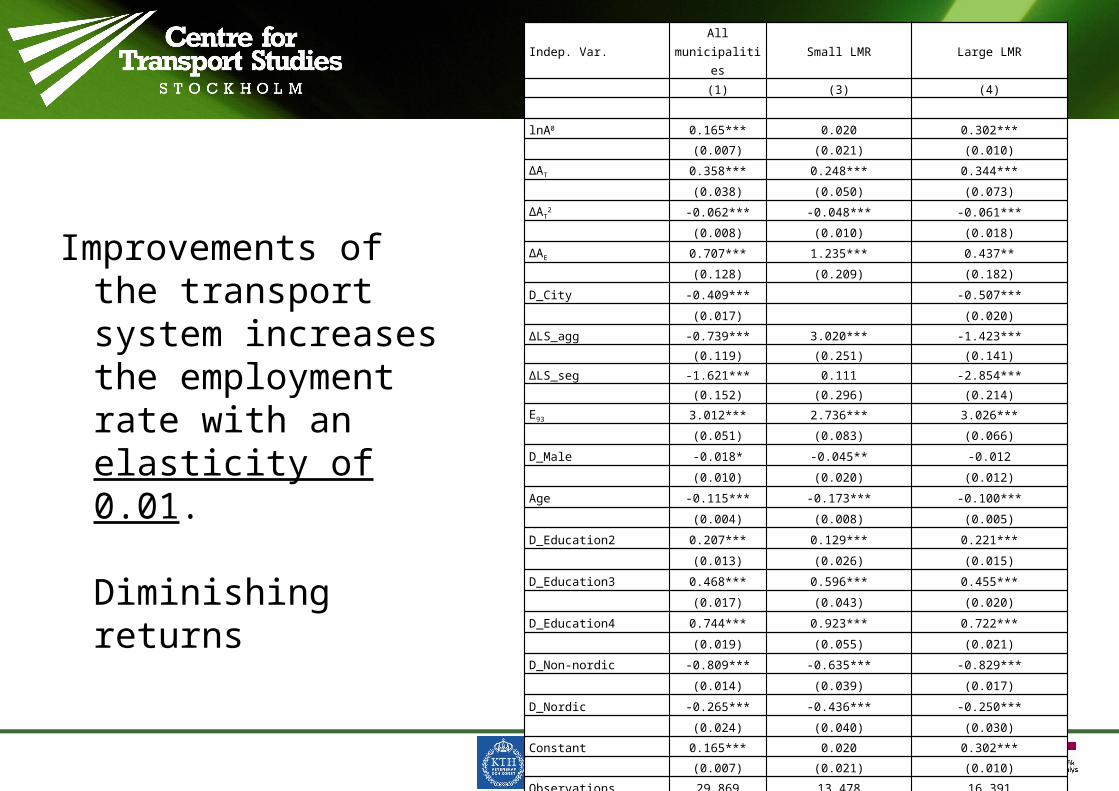
Improvements of the transport system increases the employment rate with an elasticity of 0.01.
Diminishing returns

Segmented on education levelEducation level Elasticity of E
w.r.t. AT
Primary 0.013
Secondary 0.010
Higher level: ≤ 3 years 0.010
Higher level: ≥ 4 years 0.005
Education level proxy for wage prospectsReservation wages more important for low income groups .
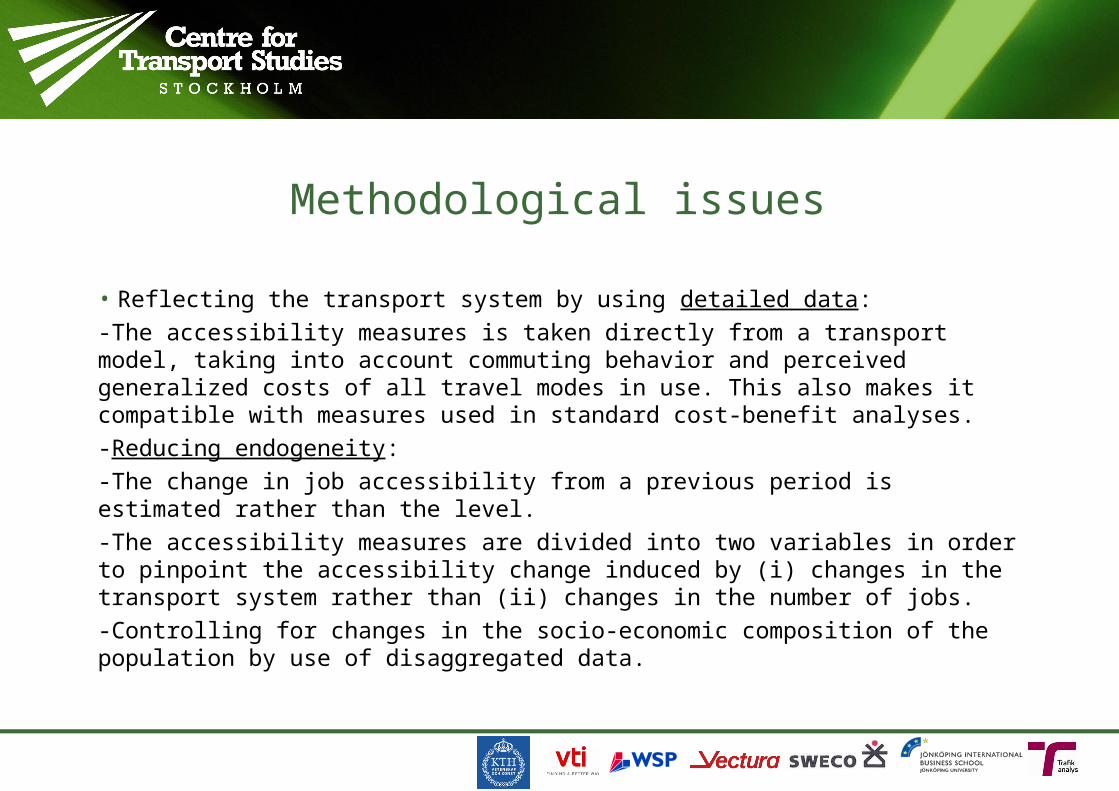
Methodological issues
• Reflecting the transport system by using detailed data:-The accessibility measures is taken directly from a transport model, taking into account commuting behavior and perceived generalized costs of all travel modes in use. This also makes it compatible with measures used in standard cost-benefit analyses.-Reducing endogeneity:-The change in job accessibility from a previous period is estimated rather than the level. -The accessibility measures are divided into two variables in order to pinpoint the accessibility change induced by (i) changes in the transport system rather than (ii) changes in the number of jobs.-Controlling for changes in the socio-economic composition of the population by use of disaggregated data.
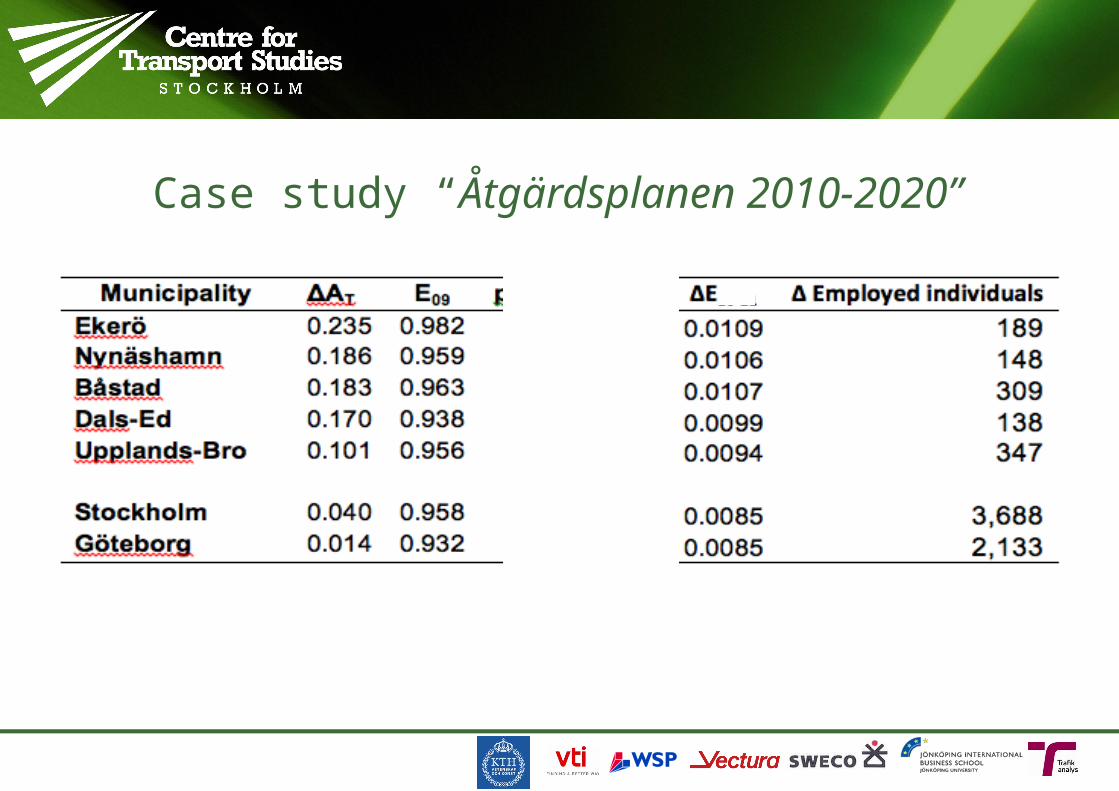
Case study “Åtgärdsplanen 2010-2020”
Conclusions
• Improvements in job accessibility due to changes in the transport system have a positive impact on employment level, elasticity 0.01
• The impact increases with lower education level (income level)
• Consistent with theories on reservation wages