Embed Size (px)
Citation preview
Process Control
Process Control
pH and Conductivity
Courseware Sample 86014-F0
Order no.: 86014-10
First Edition
Revision level: 01/2015
By the staff of Festo Didactic
© Festo Didactic Ltée/Ltd, Quebec, Canada 2012
Internet: www.festo-didactic.com
e-mail: [email protected]
Printed in Canada
All rights reserved
ISBN 978-2-89640-553-4 (Printed version)
Legal Deposit – Bibliothèque et Archives nationales du Québec, 2012
Legal Deposit – Library and Archives Canada, 2012
The purchaser shall receive a single right of use which is non-exclusive, non-time-limited and limited
geographically to use at the purchaser's site/location as follows.
The purchaser shall be entitled to use the work to train his/her staff at the purchaser's site/location and
shall also be entitled to use parts of the copyright material as the basis for the production of his/her own
training documentation for the training of his/her staff at the purchaser's site/location with
acknowledgement of source and to make copies for this purpose. In the case of schools/technical
colleges, training centers, and universities, the right of use shall also include use by school and college
students and trainees at the purchaser's site/location for teaching purposes.
The right of use shall in all cases exclude the right to publish the copyright material or to make this
available for use on intranet, Internet and LMS platforms and databases such as Moodle, which allow
access by a wide variety of users, including those outside of the purchaser's site/location.
Entitlement to other rights relating to reproductions, copies, adaptations, translations, microfilming and
transfer to and storage and processing in electronic systems, no matter whether in whole or in part, shall
require the prior consent of Festo Didactic GmbH & Co. KG.
Information in this document is subject to change without notice and does not represent a commitment on
the part of Festo Didactic. The Festo materials described in this document are furnished under a license
agreement or a nondisclosure agreement.
Festo Didactic recognizes product names as trademarks or registered trademarks of their respective
holders.
All other trademarks are the property of their respective owners. Other trademarks and trade names may
be used in this document to refer to either the entity claiming the marks and names or their products.
Festo Didactic disclaims any proprietary interest in trademarks and trade names other than its own.
© Festo Didactic 86014-10 III
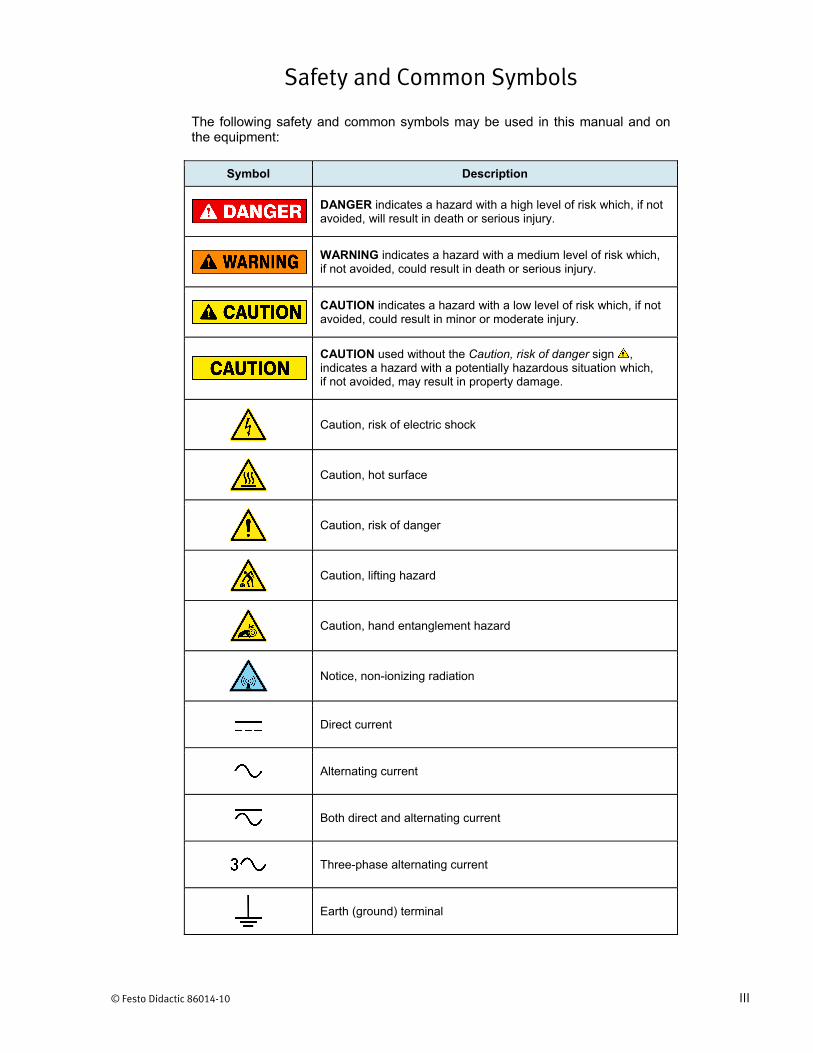
Safety and Common Symbols
The following safety and common symbols may be used in this manual and on the equipment:
Symbol Description
DANGER indicates a hazard with a high level of risk which, if not avoided, will result in death or serious injury.
WARNING indicates a hazard with a medium level of risk which, if not avoided, could result in death or serious injury.
CAUTION indicates a hazard with a low level of risk which, if not avoided, could result in minor or moderate injury.
CAUTION used without the Caution, risk of danger sign , indicates a hazard with a potentially hazardous situation which, if not avoided, may result in property damage.
Caution, risk of electric shock
Caution, hot surface
Caution, risk of danger
Caution, lifting hazard
Caution, hand entanglement hazard
Notice, non-ionizing radiation
Direct current
Alternating current
Both direct and alternating current
Three-phase alternating current
Earth (ground) terminal
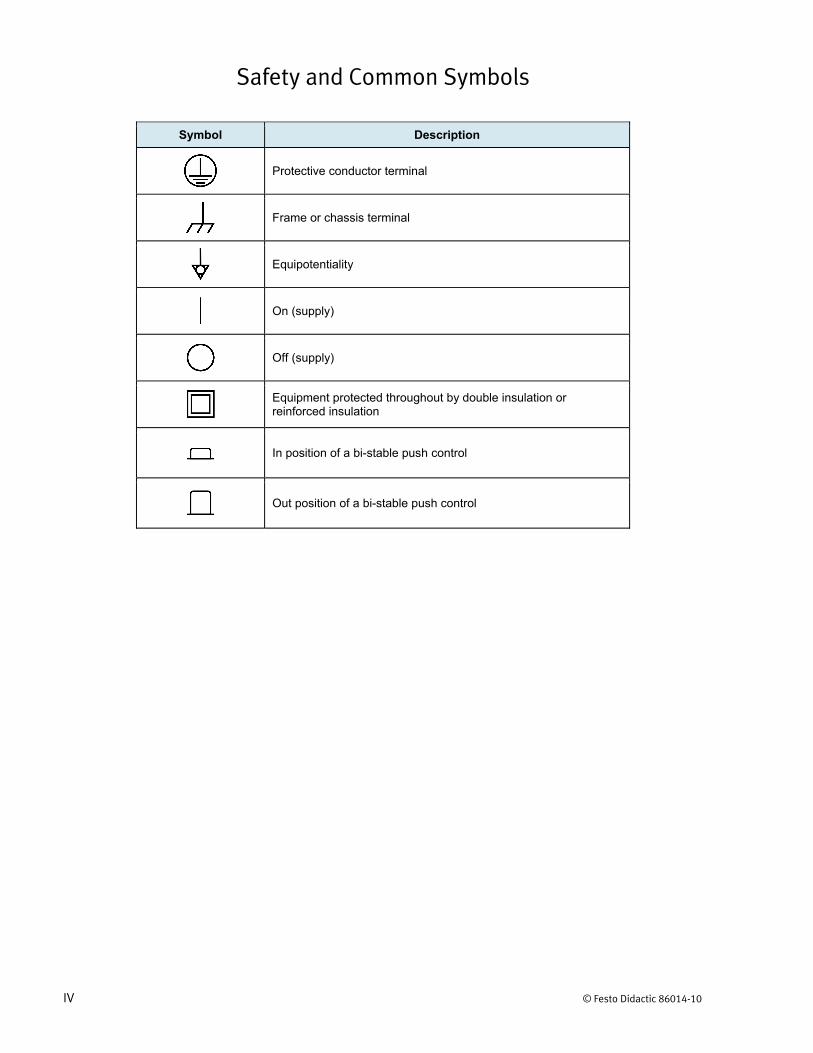
Safety and Common Symbols
IV © Festo Didactic 86014-10
Symbol Description
Protective conductor terminal
Frame or chassis terminal
Equipotentiality
On (supply)
Off (supply)
Equipment protected throughout by double insulation or reinforced insulation
In position of a bi-stable push control
Out position of a bi-stable push control
© Festo Didactic 86014-10 V
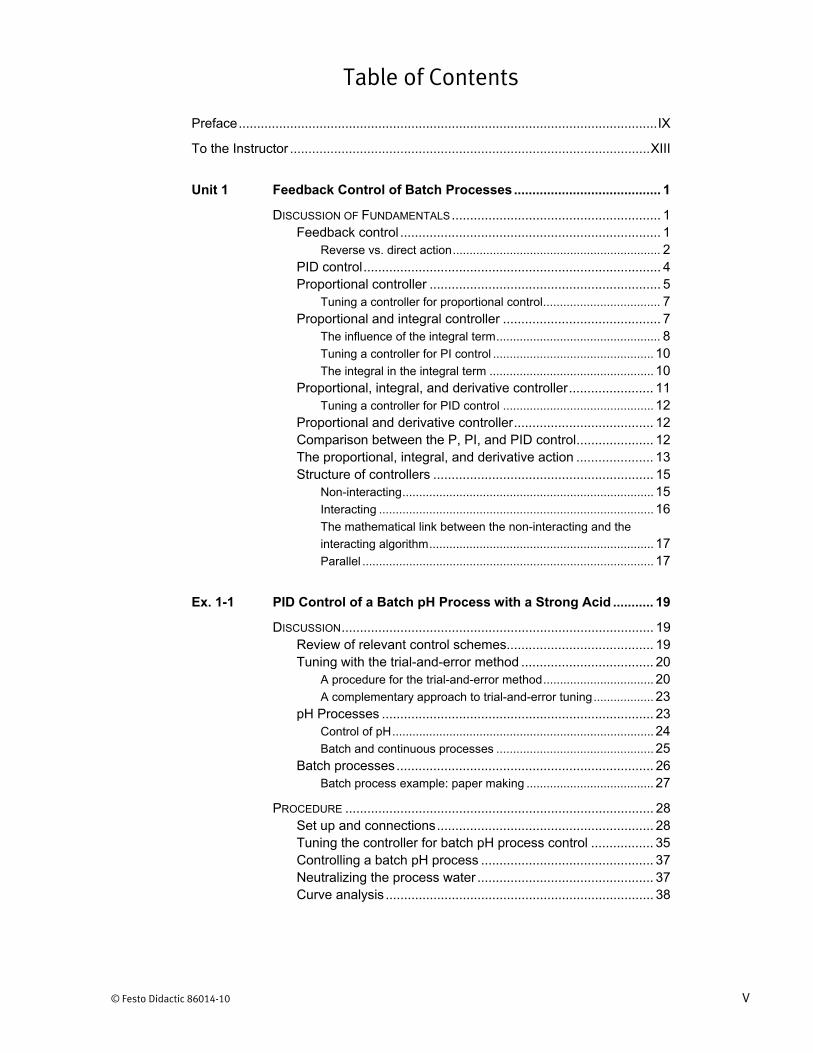
Table of Contents
Preface .................................................................................................................. IX
To the Instructor .................................................................................................. XIII
Unit 1 Feedback Control of Batch Processes ........................................ 1
DISCUSSION OF FUNDAMENTALS ......................................................... 1 Feedback control ....................................................................... 1
Reverse vs. direct action .............................................................. 2 PID control ................................................................................. 4 Proportional controller ............................................................... 5
Tuning a controller for proportional control ................................... 7 Proportional and integral controller ........................................... 7
The influence of the integral term ................................................. 8 Tuning a controller for PI control ................................................ 10 The integral in the integral term ................................................. 10
Proportional, integral, and derivative controller ....................... 11 Tuning a controller for PID control ............................................. 12
Proportional and derivative controller ...................................... 12 Comparison between the P, PI, and PID control ..................... 12 The proportional, integral, and derivative action ..................... 13 Structure of controllers ............................................................ 15
Non-interacting ........................................................................... 15 Interacting .................................................................................. 16 The mathematical link between the non-interacting and the
interacting algorithm ................................................................... 17 Parallel ....................................................................................... 17
Ex. 1-1 PID Control of a Batch pH Process with a Strong Acid ........... 19
DISCUSSION ..................................................................................... 19 Review of relevant control schemes........................................ 19 Tuning with the trial-and-error method .................................... 20
A procedure for the trial-and-error method ................................. 20 A complementary approach to trial-and-error tuning .................. 23
pH Processes .......................................................................... 23 Control of pH .............................................................................. 24 Batch and continuous processes ............................................... 25
Batch processes ...................................................................... 26 Batch process example: paper making ...................................... 27
PROCEDURE .................................................................................... 28 Set up and connections ........................................................... 28 Tuning the controller for batch pH process control ................. 35 Controlling a batch pH process ............................................... 37 Neutralizing the process water ................................................ 37 Curve analysis ......................................................................... 38
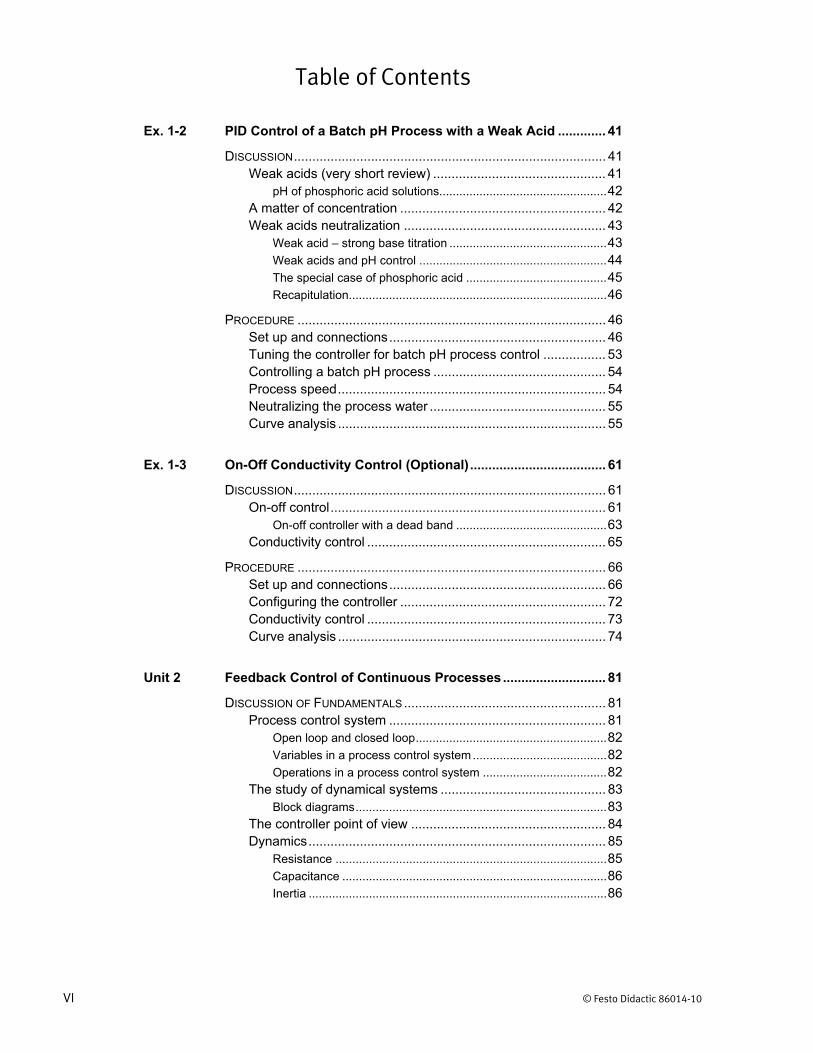
Table of Contents
VI © Festo Didactic 86014-10
Ex. 1-2 PID Control of a Batch pH Process with a Weak Acid ............. 41
DISCUSSION ..................................................................................... 41 Weak acids (very short review) ............................................... 41
pH of phosphoric acid solutions .................................................. 42 A matter of concentration ........................................................ 42 Weak acids neutralization ....................................................... 43
Weak acid – strong base titration ............................................... 43 Weak acids and pH control ........................................................ 44 The special case of phosphoric acid .......................................... 45 Recapitulation............................................................................. 46
PROCEDURE .................................................................................... 46 Set up and connections ........................................................... 46 Tuning the controller for batch pH process control ................. 53 Controlling a batch pH process ............................................... 54 Process speed ......................................................................... 54 Neutralizing the process water ................................................ 55 Curve analysis ......................................................................... 55
Ex. 1-3 On-Off Conductivity Control (Optional) ..................................... 61
DISCUSSION ..................................................................................... 61 On-off control ........................................................................... 61
On-off controller with a dead band ............................................. 63 Conductivity control ................................................................. 65
PROCEDURE .................................................................................... 66 Set up and connections ........................................................... 66 Configuring the controller ........................................................ 72 Conductivity control ................................................................. 73 Curve analysis ......................................................................... 74
Unit 2 Feedback Control of Continuous Processes ............................ 81
DISCUSSION OF FUNDAMENTALS ....................................................... 81 Process control system ........................................................... 81
Open loop and closed loop ......................................................... 82 Variables in a process control system ........................................ 82 Operations in a process control system ..................................... 82
The study of dynamical systems ............................................. 83 Block diagrams ........................................................................... 83
The controller point of view ..................................................... 84 Dynamics ................................................................................. 85
Resistance ................................................................................. 85 Capacitance ............................................................................... 86 Inertia ......................................................................................... 86
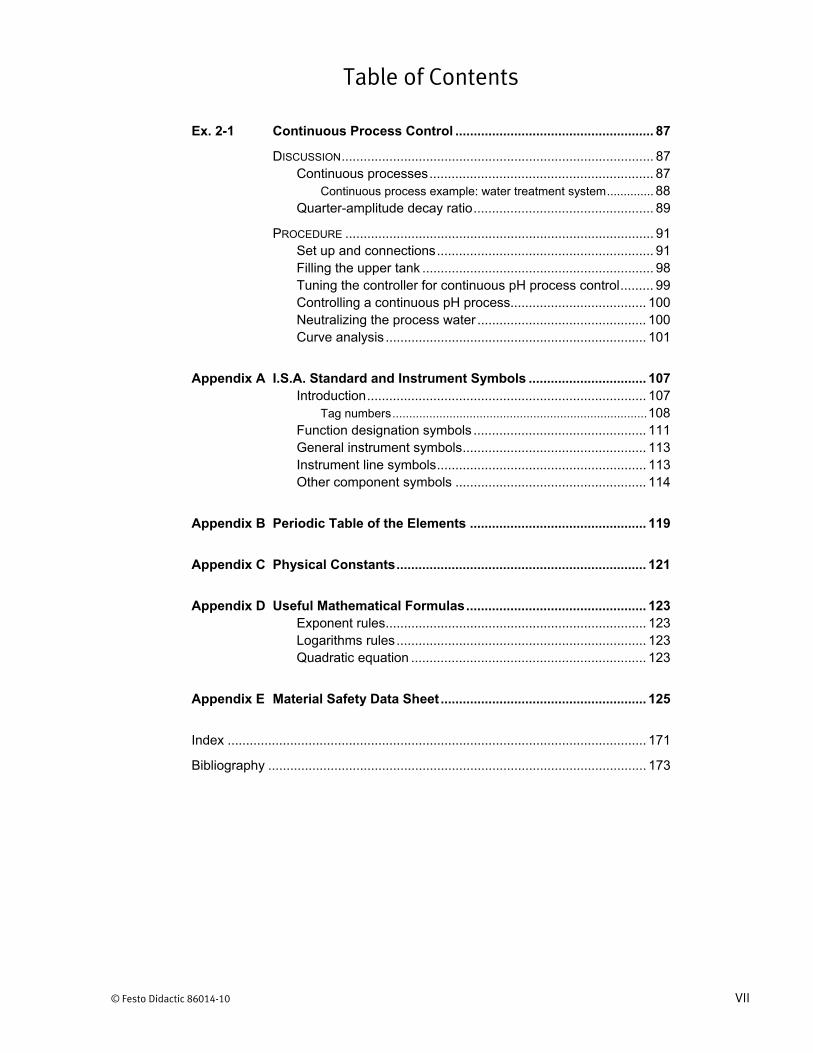
Table of Contents
© Festo Didactic 86014-10 VII
Ex. 2-1 Continuous Process Control ...................................................... 87
DISCUSSION ..................................................................................... 87 Continuous processes ............................................................. 87
Continuous process example: water treatment system .............. 88 Quarter-amplitude decay ratio ................................................. 89
PROCEDURE .................................................................................... 91 Set up and connections ........................................................... 91 Filling the upper tank ............................................................... 98 Tuning the controller for continuous pH process control ......... 99 Controlling a continuous pH process..................................... 100 Neutralizing the process water .............................................. 100 Curve analysis ....................................................................... 101
Appendix A I.S.A. Standard and Instrument Symbols ................................ 107 Introduction ............................................................................ 107
Tag numbers ............................................................................ 108 Function designation symbols ............................................... 111 General instrument symbols .................................................. 113 Instrument line symbols ......................................................... 113 Other component symbols .................................................... 114
Appendix B Periodic Table of the Elements ................................................ 119
Appendix C Physical Constants .................................................................... 121
Appendix D Useful Mathematical Formulas ................................................. 123 Exponent rules ....................................................................... 123 Logarithms rules .................................................................... 123 Quadratic equation ................................................................ 123
Appendix E Material Safety Data Sheet ........................................................ 125
Index .................................................................................................................. 171
Bibliography ....................................................................................................... 173

© Festo Didactic 86014-10 IX
Preface
Automated process control offers so many advantages over manual control that the majority of today’s industrial processes use it to some extent. Breweries, wastewater treatment plants, mining facilities, and the automotive industry are just a few industries that benefit from automated process control systems.
Maintaining process variables such as pressure, flow, level, temperature, and pH within a desired operating range is of the utmost importance when manufacturing products with a predictable composition and quality.
The Instrumentation and Process Control Training System, series 353X, is a state-of-the-art system that faithfully reproduces an industrial environment. Throughout this course, students develop skills in the installation and operation of equipment used in the process control field. The use of modern, industrial-grade equipment is instrumental in teaching theoretical and hands-on knowledge required to work in the process control industry.
The modularity of the system allows the instructor to select the equipment required to meet the objectives of a specific course. Two mobile workstations, on which all of the equipment is installed, form the basis of the system. Several optional components used in pressure, flow, level, temperature, and pH control loops are available, as well as various valves, calibration equipment, and software. These add-ons can replace basic components having the same functionality, depending on the context. During control exercises, a variety of controllers can be used interchangeably depending on the instructor’s preference.
We hope that your learning experience with the Instrumentation and Process Control Training System will be the first step toward a successful career in the process control industry.
Preface
X © Festo Didactic 86014-10

Preface
© Festo Didactic 86014-10 XI
We invite readers of this manual to send us their tips, feedback and suggestions for improving the book.
Please send these to [email protected].
The authors and Festo Didactic look forward to your comments.

© Festo Didactic 86014-10 XIII
To the Instructor
You will find in this Instructor Guide all the elements included in the Student Manual together with the answers to all questions, results of measurements, graphs, explanations, suggestions, and, in some cases, instructions to help you guide the students through their learning process. All the information that applies to you is placed between markers and appears in red.
Accuracy of measurements
The numerical results of the hands-on exercises may differ from one student to another. For this reason, the results and answers given in this manual should be considered as a guide. Students who correctly performed the exercises should expect to demonstrate the principles involved and make observations and measurements similar to those given as answers.
Equipment installation
In order for students to be able to perform the exercises in the Student Manual, the Process Control Training Equipment – pH and Conductivity must have been properly installed, according to the instructions given in the user guide Familiarization with the Instrumentation and Process Control System – pH and Conductivity, part number 86012-E.

Sample Exercise
Extracted from
the Student Manual
and the Instructor Guide

© Festo Didactic 86014-10 19
Familiarize yourself with the trial-and-error method for tuning your controller and apply this method when tuning a batch pH process using a strong acid.
The Discussion of this exercise covers the following points:
Review of relevant control schemes Tuning with the trial-and-error method
A procedure for the trial-and-error method. A complementary approach to trial-and-error tuning.
pH Processes Control of pH. Batch and continuous processes.
Batch processes Batch process example: paper making.
This exercise introduces three control schemes and puts them to use in a pH process loop. This allows a comparative analysis of the different schemes in terms of efficiency, simplicity, and applicability to various situations. An intuitive method to tune controllers is also presented.
Review of relevant control schemes
A controller in proportional mode (P mode) outputs a signal ( : manipulated variable) which is proportional to the difference between the target value (SP: set point) and the actual value of the variable ( : controlled variable). This simple scheme works well but typically causes an offset. The only parameter to tune is the controller gain (or the proportional band ( % 100%/ ) if your controller uses this parameter instead).
A controller in proportional/integral mode (PI mode) works in a fashion similar to a controller in P mode, but also integrates the error over time to reduce the residual error to zero. The integral action tends to respond slowly to a change in error for large values of the integral time and increases the risks of overshoot and instability for small values of .Thus, the two parameters which require tuning for this control method are (or %) and (or the integral gain, defined as 1/ ).
A controller in proportional, integral, and derivative mode (PID mode) incorporates the three control actions into a single polyvalent and powerful control scheme. The addition of derivative action to the PI mode results in the capacity to attenuate overshoots to some extent, but adds the risk of instability if the process is noisy.
Tuning a controller in PID mode requires careful adjustment of the proportional gain ( ), the integral time ( ), and the derivative time ( ) to properly address the control requirements of the process. In some circumstances, the controller
PID Control of a Batch pH Process with a Strong Acid
Exercise 1-1
EXERCISE OBJECTIVE
DISCUSSION OUTLINE
DISCUSSION
Ex. 1-1 – PID Control of a Batch pH Process with a Strong Acid Discussion
20 © Festo Didactic 86014-10
output must not be zero when the error is null. In these cases, a bias ( ), also known as manual reset, must be set.
The on-off control mode is the simplest control scheme available. It involves either a 0% or a 100% output signal from the controller based on the sign of the measured error. The option to add a dead band, available with most controllers, reduces the oscillation frequency and prevents premature wear of the final control element. There are no parameters to specify for this mode beyond a set point and dead band parameters. Note that it is possible to simulate an on-off mode with a controller in P mode for a large value of (or a very small %).
Tuning with the trial-and-error method
The trial-and-error method of controller tuning is a procedure for adjusting the P, I, and D parameters until the controller is able to rapidly correct its output in response to a step change in the error. This correction is to be performed without excessive overshooting of the controlled variable.
This method is widely used because it does not require the characteristics of the process to be known nor is it necessary to bring the process into a sustained oscillation. Another important aspect of this method is that it is instrumental in developing an intuition for the effects of each of the tuning parameters.
However, the trial-and-error method can be daunting for inexperienced technicians because a change in tuning constant tends to affect the action of all three controller terms. For example, increasing the integral action increases the overshooting which, in turn, increases the rate of change of the error triggers an increase in the derivative action. A structured approach and experience help in obtaining a good tuning relatively quickly without resorting to involved calculations.
A good trial-and-error method is to follow a geometrical progression in the search for optimal parameters. For example, multiplying or dividing one of the tuning parameters by two at each iteration can help you converge quickly toward an optimal value of the parameter.
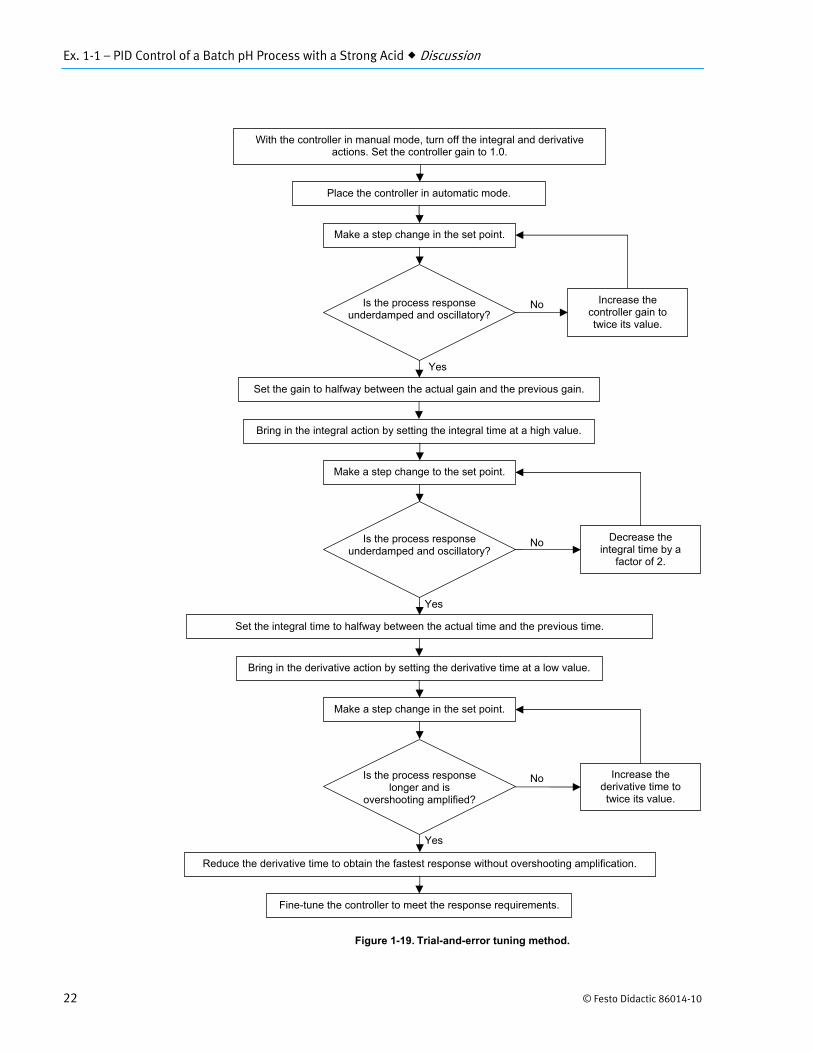
A procedure for the trial-and-error method
The trial-and-error method is performed using the following procedure (also refer to Figure 1-19 and Figure 1-20 for PI control):
1. Set the controller to the desired mode: P, PI, PD, or PID. Follow the instructions to adjust each parameter relevant to this mode. Note that, if your controller allows, you can use the PID mode to perform any of the modes by simply setting the parameters to appropriate values (e.g.,
0 for PI mode).
Adjusting the P action
2. With the controller in manual mode, turn off the integral and derivative actions of the controller by setting and respectively to the largest possible value and 0.
Ex. 1-1 – PID Control of a Batch pH Process with a Strong Acid Discussion
© Festo Didactic 86014-10 21
3. Set the controller gain to an arbitrary, but small, value, such as 1.
4. Place the controller in the automatic (closed-loop) mode.
5. Make a step change to the set point and observe the response of the controlled variable. The set point change should be typical of the expected use of the system.
Since the controller gain is low, the controlled variable will take a relatively long time to stabilize (i.e., the response is likely to be overdamped).
6. Increase by a factor of 2 and make another step change to the set point. Observe the effect on the response of the controlled variable.
The objective is to find the value of at which the response becomes underdamped and oscillatory. This is the ultimate controller gain. Keep increasing by factors of 2, performing a set point change after each new attempt, until you observe the oscillatory response.
Once the ultimate controller gain is reached, revert back to the previous value of by decreasing the controller gain by a factor of 2. The P action is now appropriately set to add another control action if required.
Adjusting the I action
7. Add integral action by setting the integral time at an arbitrarily high value. Decrease by factors of 2, making a set point change after each setting.
Continue until you reach a value of , at which the response of the controlled variable becomes underdamped and oscillatory. At this point, revert back to the previous value of by increasing to twice its value.
The I action is now set. If required, you can now proceed to the adjustment of the D action, if required.
Adjusting the D action
8. Add derivative action by setting the derivative time at an arbitrarily low value. Increase by factors of 2, making a set point change after each setting.
Continue until you reach the value of that gives the fastest response without amplifying the overshooting or creating oscillation.
The D action is now set.
Fine-tuning the parameters
9. Fine-tune parameters of the controller until the requirements regarding the response time and overshooting of the controlled variable are satisfied.
The controller gain is related to the proportional band: % 100%/ .
If your controller uses the proportional band, start with a value of % 100%, and replace instructions to increase by a factor of two by instructions to de-crease % by a factor of two.
Ex. 1-1 – PID Control of a Batch pH Process with a Strong Acid Discussion
22 © Festo Didactic 86014-10
Figure 1-19.Trial-and-error tuning method.
Make a step change in the set point.
Place the controller in automatic mode.
With the controller in manual mode, turn off the integral and derivative actions. Set the controller gain to 1.0.
Increase the controller gain to twice its value.
Set the gain to halfway between the actual gain and the previous gain.
Bring in the integral action by setting the integral time at a high value.
Decrease the integral time by a
factor of 2.
Make a step change to the set point.
Set the integral time to halfway between the actual time and the previous time.
Bring in the derivative action by setting the derivative time at a low value.
Make a step change in the set point.
Reduce the derivative time to obtain the fastest response without overshooting amplification.
Fine-tune the controller to meet the response requirements.
Is the process response underdamped and oscillatory?
Is the process response longer and is
overshooting amplified?
Is the process response underdamped and oscillatory?
Increase the derivative time to twice its value.
No
No
No
Yes
Yes
Yes
Ex. 1-1 – PID Control of a Batch pH Process with a Strong Acid Discussion
© Festo Didactic 86014-10 23
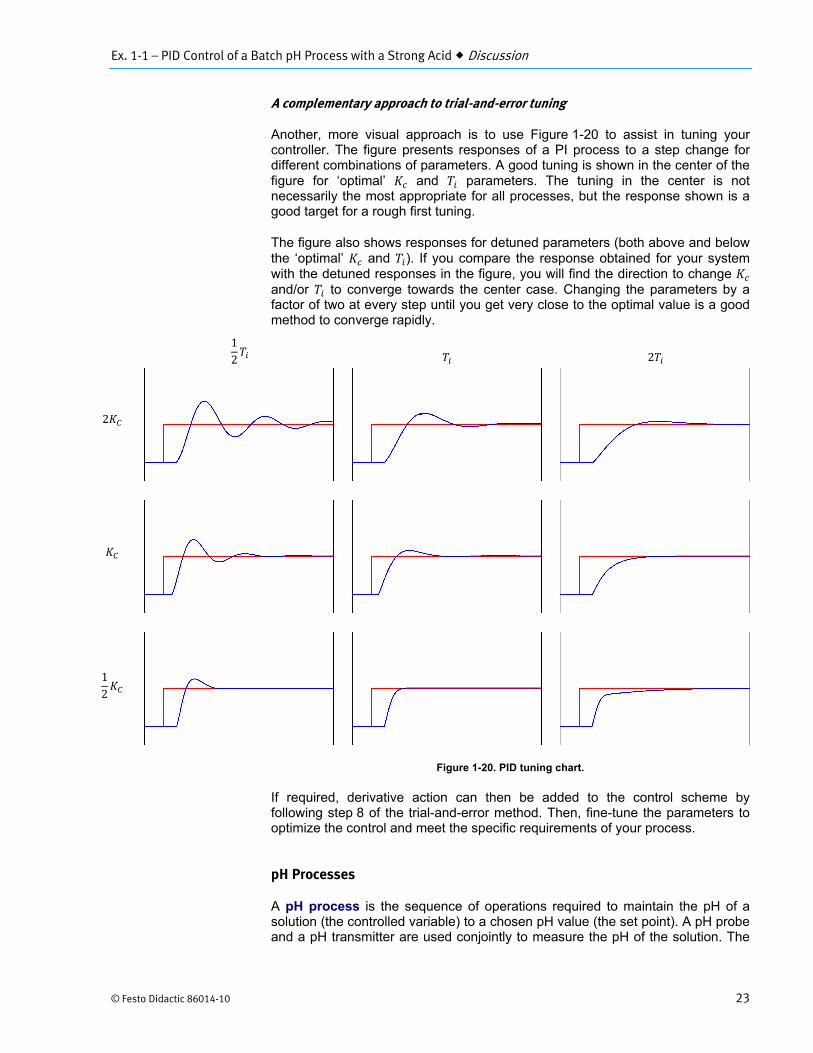
A complementary approach to trial-and-error tuning
Another, more visual approach is to use Figure 1-20 to assist in tuning your controller. The figure presents responses of a PI process to a step change for different combinations of parameters. A good tuning is shown in the center of the figure for ‘optimal’ and parameters. The tuning in the center is not necessarily the most appropriate for all processes, but the response shown is a good target for a rough first tuning.
The figure also shows responses for detuned parameters (both above and below the ‘optimal’ and ). If you compare the response obtained for your system with the detuned responses in the figure, you will find the direction to change and/or to converge towards the center case. Changing the parameters by a factor of two at every step until you get very close to the optimal value is a good method to converge rapidly.
Figure 1-20. PID tuning chart.
If required, derivative action can then be added to the control scheme by following step 8 of the trial-and-error method. Then, fine-tune the parameters to optimize the control and meet the specific requirements of your process.
pH Processes
A pH process is the sequence of operations required to maintain the pH of a solution (the controlled variable) to a chosen pH value (the set point). A pH probe and a pH transmitter are used conjointly to measure the pH of the solution. The
2
12
12
2
Ex. 1-1 – PID Control of a Batch pH Process with a Strong Acid Discussion
24 © Festo Didactic 86014-10
measurement results are used to determine the action needed keep the controlled variable at the required value. Thus, the pH is also the measured variable. To compensate for any difference between the set point and the controlled variable, small quantities of acid or base are added to the solution.
Control of pH
The control of pH is essential in many industrial processes. This is especially true for processes where the chemical reaction rate is higher within a specific pH range. If a chemical reagent is added to a process when pH is not at the right value, the reaction may take too long or may not occur at all. In the food processing industry, pH is of the highest importance. An inadequate pH not only results in bad-tasting food, but can also influence the color, smell, and shelf life of the product. Controlling the pH can increase the quality of the final product, the safety of the process, and the performance of the business.
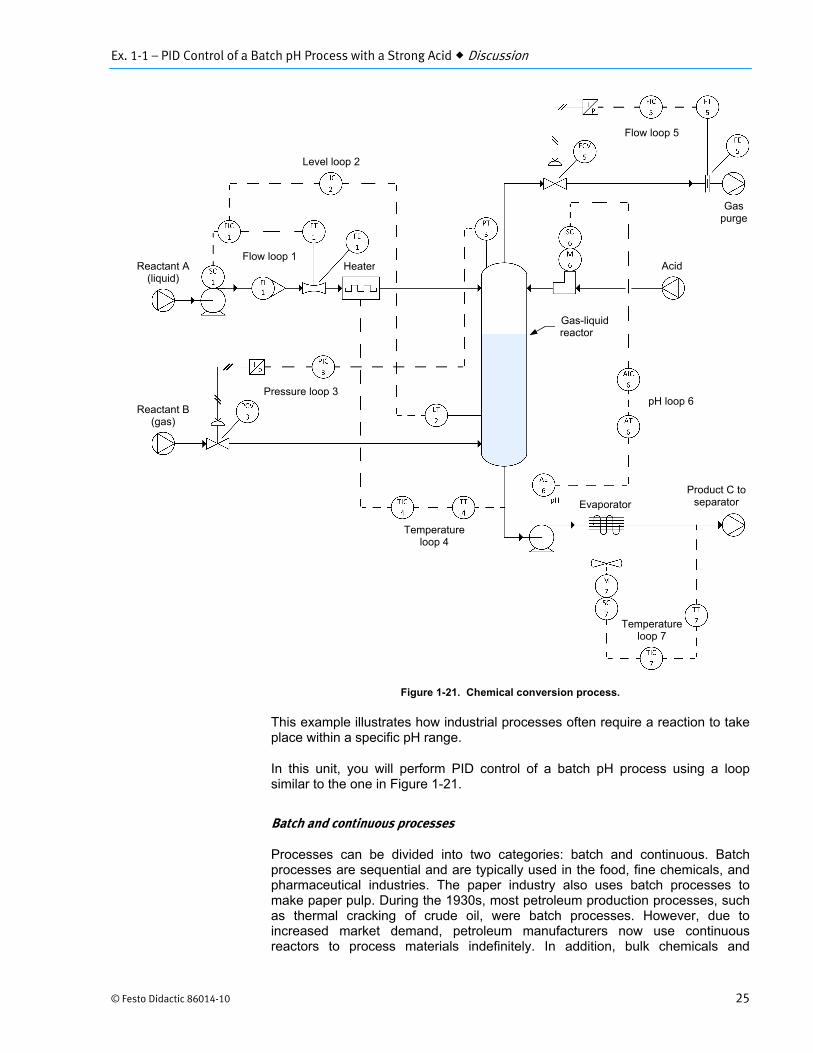
For example, consider the chemical conversion process shown in Figure 1-21. The purpose of the process is to combine a liquid reactant, A, and a gaseous reactant, B, to form a third liquid product, C.
Reactants A and B are first charged into the reactor.
A reaction takes place in the reactor causing the pH of the solution to increase. To obtain a maximum conversion of the reactants, pH loop 6 keeps the pH of the liquid in the reactor constant by adding acid to the solution maintaining the pH of the solution at an ideal value.
The liquid product is then removed from the bottom of the reactor and passed through an evaporator. As it flows through the evaporator, the liquid product loses thermal energy causing its temperature to decrease and the reaction to stop.
To ensure that the reaction is correctly stopped, temperature loop 7 keeps the temperature of the liquid product constant through speed variation of the evaporator blower.
Ex. 1-1 – PID Control of a Batch pH Process with a Strong Acid Discussion
© Festo Didactic 86014-10 25
Figure 1-21. Chemical conversion process.
This example illustrates how industrial processes often require a reaction to take place within a specific pH range.
In this unit, you will perform PID control of a batch pH process using a loop similar to the one in Figure 1-21.
Batch and continuous processes
Processes can be divided into two categories: batch and continuous. Batch processes are sequential and are typically used in the food, fine chemicals, and pharmaceutical industries. The paper industry also uses batch processes to make paper pulp. During the 1930s, most petroleum production processes, such as thermal cracking of crude oil, were batch processes. However, due to increased market demand, petroleum manufacturers now use continuous reactors to process materials indefinitely. In addition, bulk chemicals and
Reactant A (liquid)
Flow loop 1
Level loop 2
Heater
Pressure loop 3
Temperature loop 4
Temperature loop 7
pH loop 6
Flow loop 5
Product C to separatorEvaporator
Reactant B (gas)
Acid
Gas purge
Gas-liquid reactor
Ex. 1-1 – PID Control of a Batch pH Process with a Strong Acid Discussion
26 © Festo Didactic 86014-10
fertilizers are mainly manufactured using continuous processes. Wastewater treatment plants also use continuous processes to safely recycle or dispose of water.
Even though processes are classified as batch or continuous, most industries use processes that combine batch and continuous systems. High industry standards for both product quality and cost efficiency often require many batch processes to keep continuous control over at least one variable. Besides, almost all continuous manufacturing processes end with batch quality control testing, packaging, and shipping.
Batch processes
A batch process as defined by the Instrumentation, Systems, and Automation Society (ISA) SP88 committee, is a process that manufactures a finite quantity of material by subjecting measured quantities of raw materials to a sequential order of processing actions using one or more pieces of equipment. Most batch operations are usually completed within minutes or hours. To achieve batch control, a recipe is required. A recipe is the complete set of data and operations that uniquely defines the control requirements to produce a batch of a specific product. Using a specific recipe, a technician should have all the necessary information such as material quantities, order of processing activities, set points, mixing, etc. to make a determined quantity of a product.
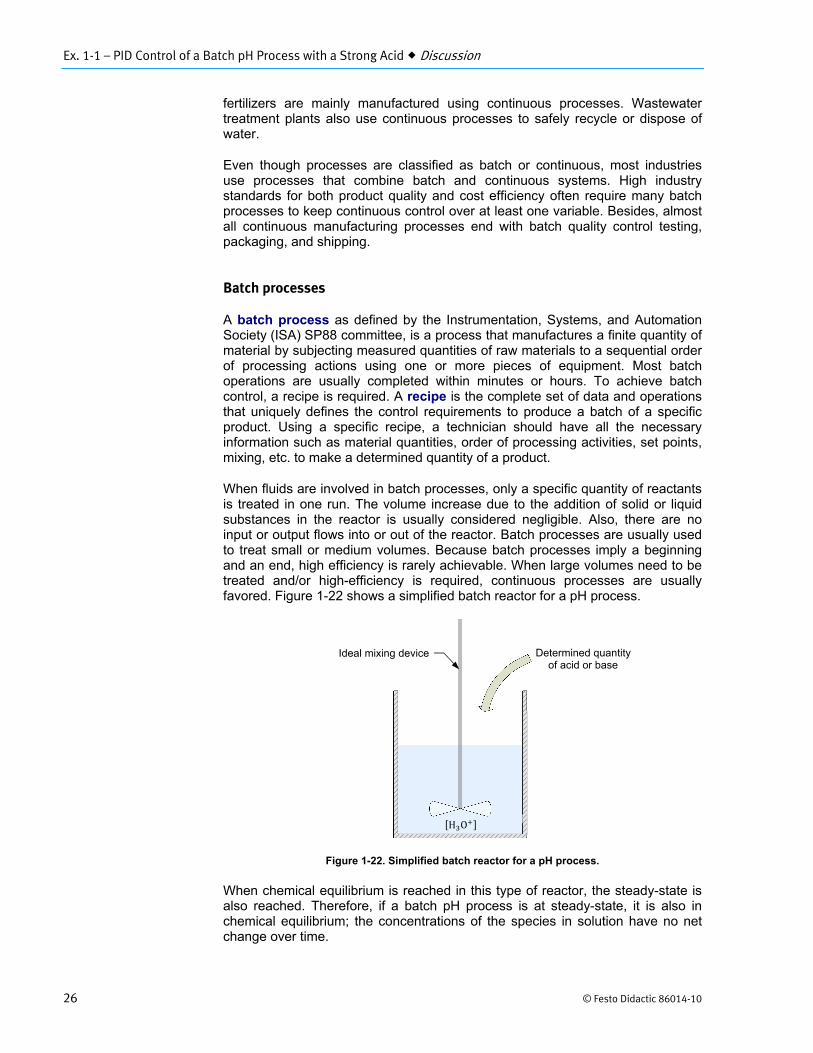
When fluids are involved in batch processes, only a specific quantity of reactants is treated in one run. The volume increase due to the addition of solid or liquid substances in the reactor is usually considered negligible. Also, there are no input or output flows into or out of the reactor. Batch processes are usually used to treat small or medium volumes. Because batch processes imply a beginning and an end, high efficiency is rarely achievable. When large volumes need to be treated and/or high-efficiency is required, continuous processes are usually favored. Figure 1-22 shows a simplified batch reactor for a pH process.
Figure 1-22. Simplified batch reactor for a pH process.
When chemical equilibrium is reached in this type of reactor, the steady-state is also reached. Therefore, if a batch pH process is at steady-state, it is also in chemical equilibrium; the concentrations of the species in solution have no net change over time.
Determined quantity of acid or base
Ideal mixing device
H O
Ex. 1-1 – PID Control of a Batch pH Process with a Strong Acid Discussion
© Festo Didactic 86014-10 27
The following points summarize the main characteristics of this idealized batch pH process:
a predetermined quantity of reactant is treated
flow into and out of the tank is null
negligible volume increase
used to treat small or medium volumes
the initial hydronium concentration is H O
the concentration of H O is affected by the addition of an acid or a base
medium-efficiency process
chemical equilibrium and steady-state describe the same phenomenon
Batch process example: paper making
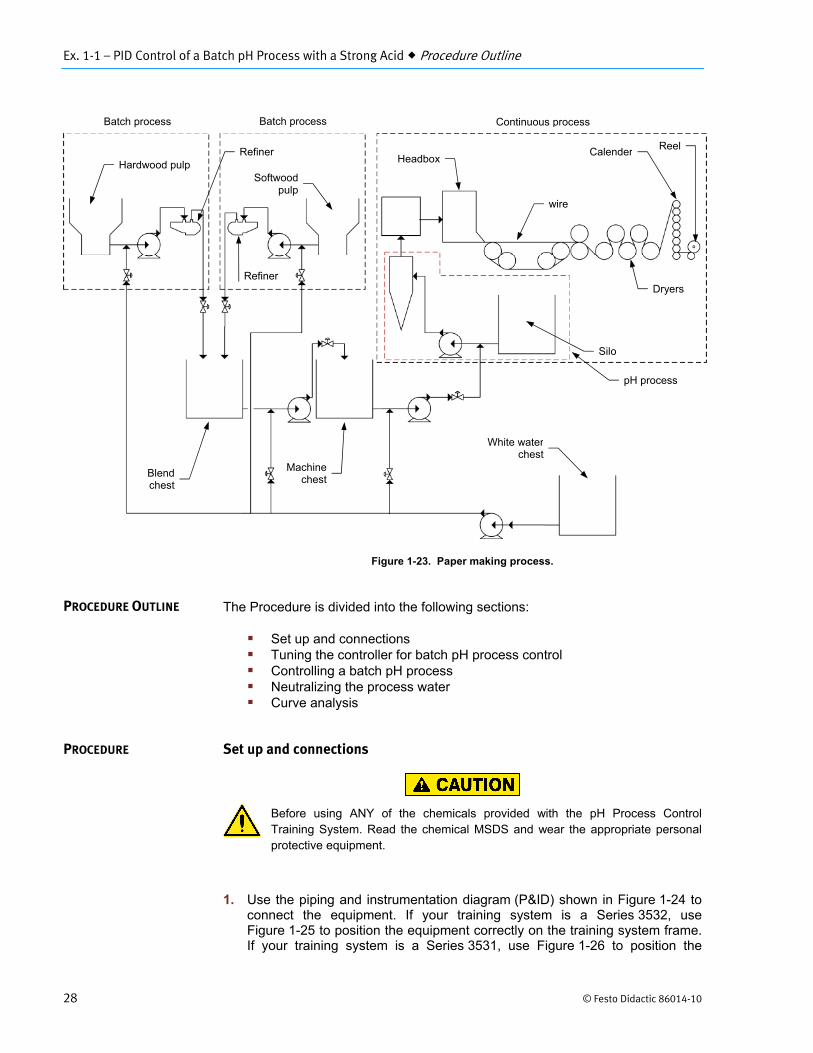
Paper making is a complex task that includes numerous chemical treatments, mixing sequences, and reprocessing operations. Both batch and continuous process control are required to carry out these tasks and obtain paper as the final product. Figure 1-23 illustrates a simplified version of a paper making process.
A mix of softwood and hardwood pulp is used to make paper. Proportions of softwood to hardwood vary according to the desired paper. Both types of pulp are passed through refiners where the pulp is cut to increase its surface area. A mix of softwood and hardwood pulp slurry is fed into the blend chest where it is diluted and mixed for approximately 12 minutes. The pulp is then fed into the machine chest for another 12 minutes of mixing. These steps are essentially batch processes.
The pulp is then pumped from the machine chest and is continuously fed into the headbox after undergoing various different treatments such as dilution and cleaning. The headbox spreads the stock on the wire. Excess water is drained into the silo and reprocessed. Presses are used to mechanically remove a portion of the water remaining in the paper. The remaining water is removed as the paper is dried on hot cylinders. Finally, the paper is compressed in a calender stack and wrapped on a reel.
Ex. 1-1 – PID Control of a Batch pH Process with a Strong Acid Procedure Outline
28 © Festo Didactic 86014-10
Figure 1-23. Paper making process.
The Procedure is divided into the following sections:
Set up and connections Tuning the controller for batch pH process control Controlling a batch pH process Neutralizing the process water Curve analysis
Set up and connections
Before using ANY of the chemicals provided with the pH Process ControlTraining System. Read the chemical MSDS and wear the appropriate personalprotective equipment.
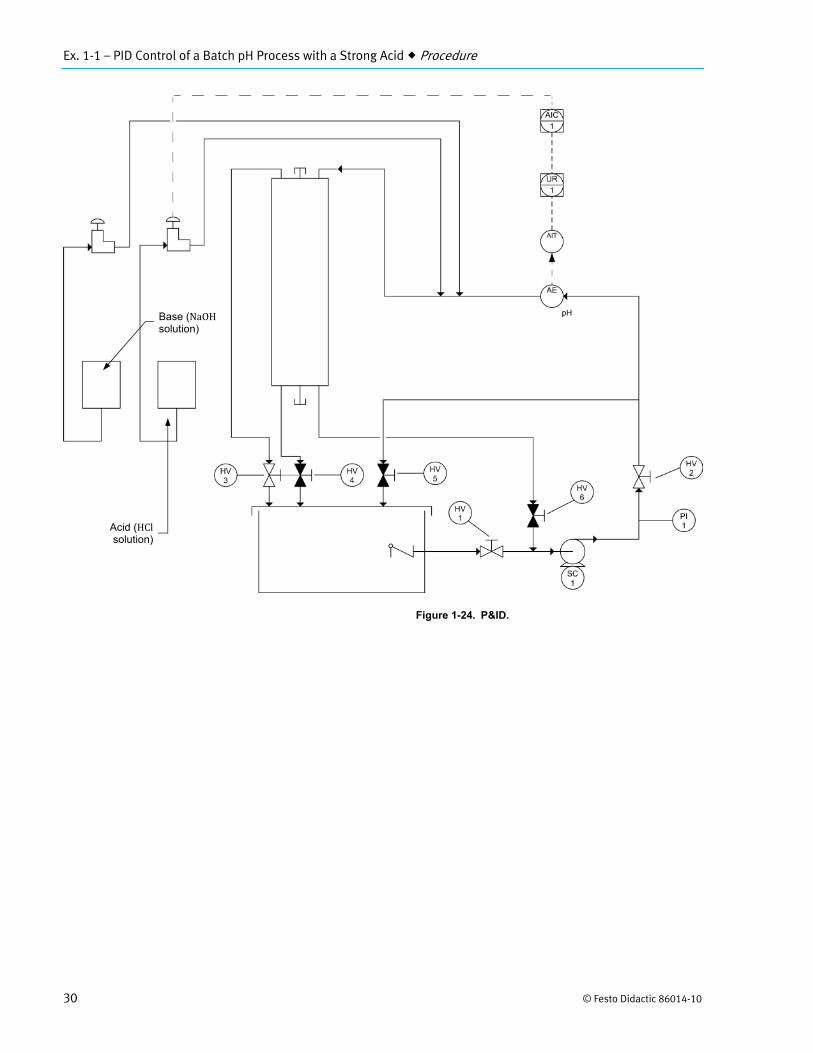
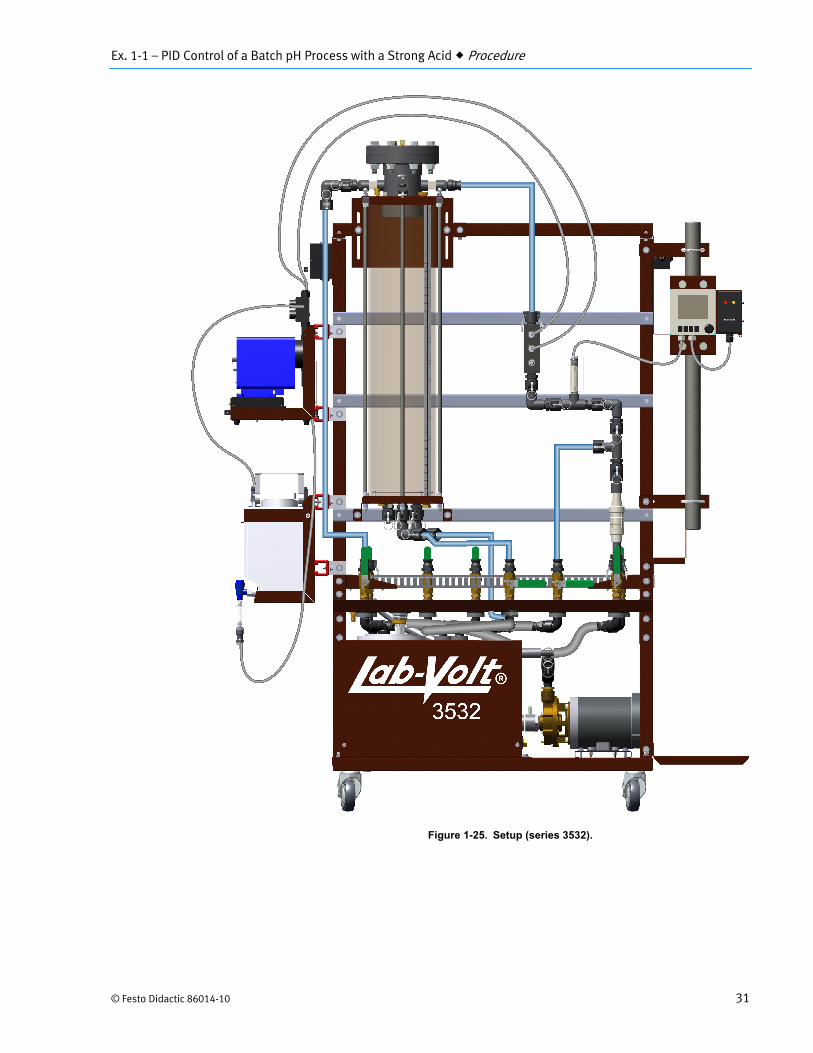
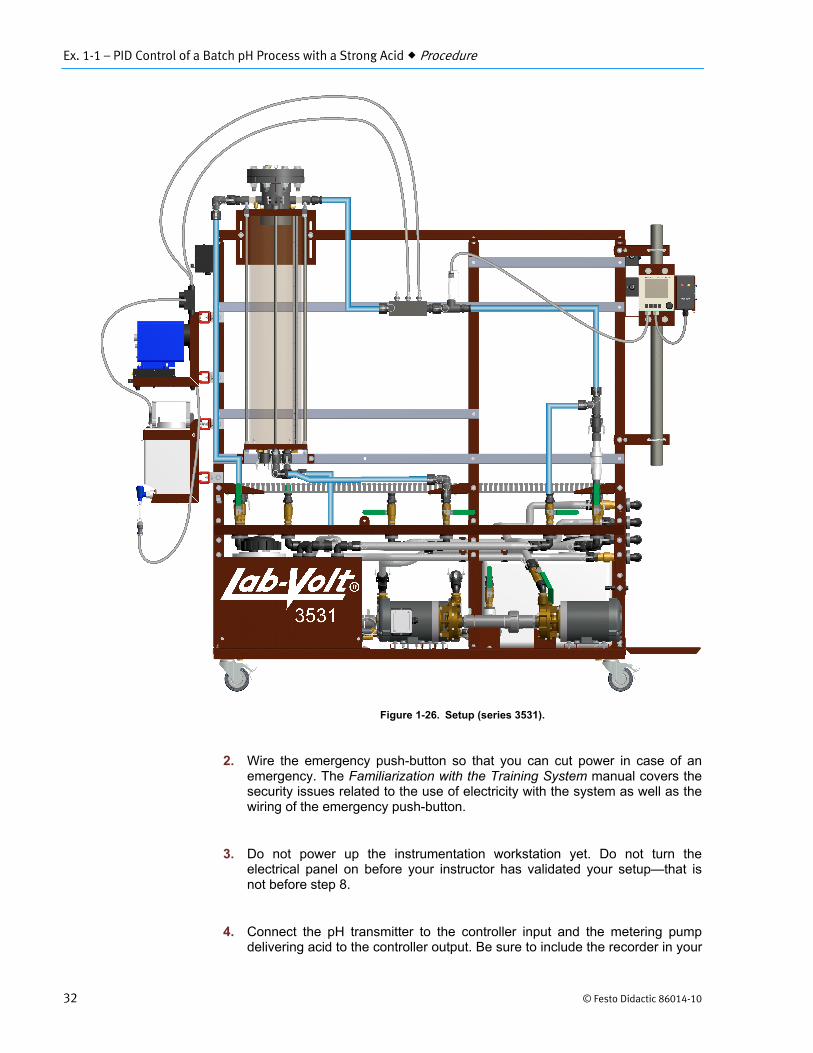
1. Use the piping and instrumentation diagram (P&ID) shown in Figure 1-24 to connect the equipment. If your training system is a Series 3532, use Figure 1-25 to position the equipment correctly on the training system frame. If your training system is a Series 3531, use Figure 1-26 to position the
PROCEDURE OUTLINE
PROCEDURE
Batch process Batch process Continuous process
Refiner
Refiner
Headbox
wire
Calender
Dryers
Silo
White waterchest
Machinechest
Blend chest
Hardwood pulp Softwood
pulp
pH process
Reel
Ex. 1-1 – PID Control of a Batch pH Process with a Strong Acid Procedure
© Festo Didactic 86014-10 29
equipment correctly on the training system frame. Use the basic setup presented in the Familiarization with the Training System manual. Table 1-2 lists the equipment you must add to the basic setup in order to set up your system for this exercise.
Table 1-2. Equipment required for this exercise.
Name Part number Identification
Controller * AIC
Volumetric flask 38406
Scopulla 38442
Sodium hydroxide solution 1.0 N 38444
Hydrochloric acid solution 1.0 N 38445
Phenol red 38446
Graduated cylinder 38447
Latex gloves 40331-54
Pipette 40331-65
Safety glasses 40348
pH transmitter 46945 AIT
Metering pumps 46956
Paperless recorder 46972 UR
Chemical tanks 46994
Ex. 1-1 – PID Control of a Batch pH Process with a Strong Acid Procedure
30 © Festo Didactic 86014-10
Figure 1-24. P&ID.
Acid (HClsolution)
Base (NaOH solution)
Ex. 1-1 – PID Control of a Batch pH Process with a Strong Acid Procedure
© Festo Didactic 86014-10 31
Figure 1-25. Setup (series 3532).
Ex. 1-1 – PID Control of a Batch pH Process with a Strong Acid Procedure
32 © Festo Didactic 86014-10
Figure 1-26. Setup (series 3531).
2. Wire the emergency push-button so that you can cut power in case of an emergency. The Familiarization with the Training System manual covers the security issues related to the use of electricity with the system as well as the wiring of the emergency push-button.
3. Do not power up the instrumentation workstation yet. Do not turn the electrical panel on before your instructor has validated your setup—that is not before step 8.
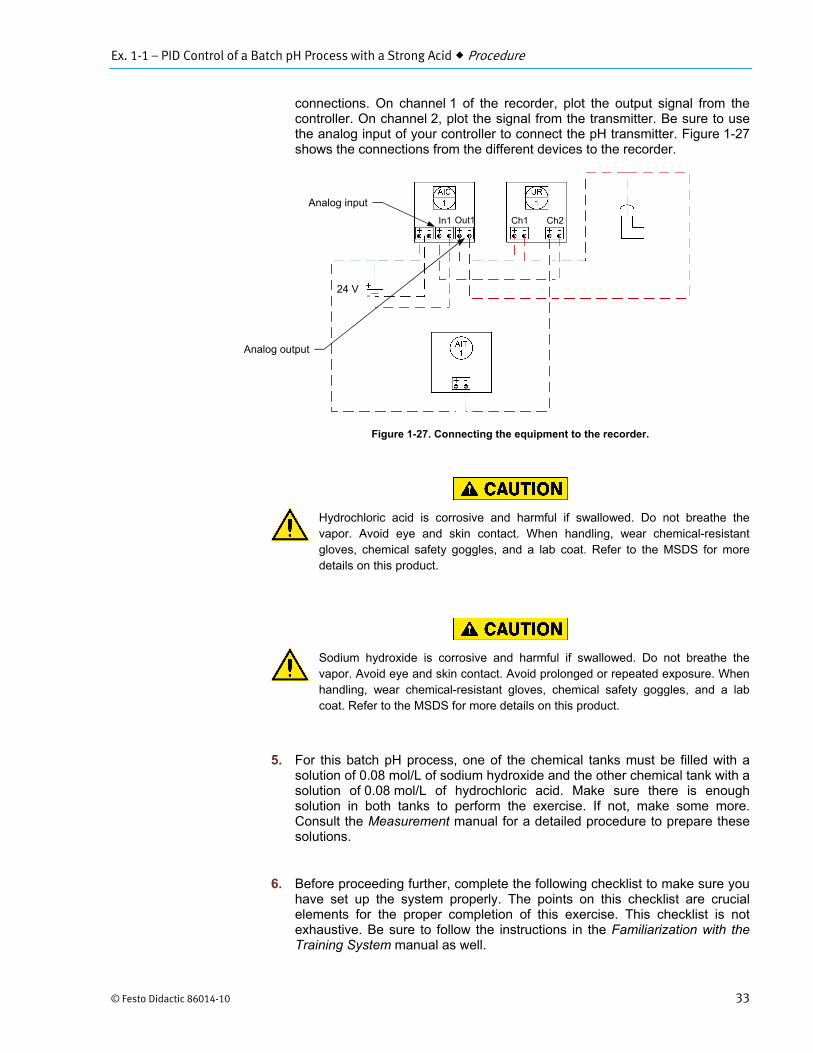
4. Connect the pH transmitter to the controller input and the metering pump delivering acid to the controller output. Be sure to include the recorder in your
Ex. 1-1 – PID Control of a Batch pH Process with a Strong Acid Procedure
© Festo Didactic 86014-10 33
connections. On channel 1 of the recorder, plot the output signal from the controller. On channel 2, plot the signal from the transmitter. Be sure to use the analog input of your controller to connect the pH transmitter. Figure 1-27 shows the connections from the different devices to the recorder.
Figure 1-27. Connecting the equipment to the recorder.
Hydrochloric acid is corrosive and harmful if swallowed. Do not breathe the vapor. Avoid eye and skin contact. When handling, wear chemical-resistant gloves, chemical safety goggles, and a lab coat. Refer to the MSDS for more details on this product.
Sodium hydroxide is corrosive and harmful if swallowed. Do not breathe the vapor. Avoid eye and skin contact. Avoid prolonged or repeated exposure. When handling, wear chemical-resistant gloves, chemical safety goggles, and a lab coat. Refer to the MSDS for more details on this product.
5. For this batch pH process, one of the chemical tanks must be filled with a solution of 0.08 mol/L of sodium hydroxide and the other chemical tank with a solution of 0.08 mol/L of hydrochloric acid. Make sure there is enough solution in both tanks to perform the exercise. If not, make some more. Consult the Measurement manual for a detailed procedure to prepare these solutions.
6. Before proceeding further, complete the following checklist to make sure you have set up the system properly. The points on this checklist are crucial elements for the proper completion of this exercise. This checklist is not exhaustive. Be sure to follow the instructions in the Familiarization with the Training System manual as well.
24 V
In1 Out1 Ch1 Ch2
Analog input
Analog output
Ex. 1-1 – PID Control of a Batch pH Process with a Strong Acid Procedure
34 © Festo Didactic 86014-10
f
All unused male adapters on the column are capped and the flange is properly tightened.
The hand valves are in the positions shown in the P&ID.
The chemical tanks are filled with the appropriate solutions and are carefully labeled.
You are wearing the appropriate PPE.
The vent tube is properly installed.
The controller is properly connected to the pH transmitter and the metering pump delivering acid.
The paperless recorder is set up and configured to record the output of the pH transmitter and the output of the controller.
7. Ask your instructor to check and approve your setup.
8. Power up the electrical unit, this starts all electrical devices.
9. Make sure the pH probe is properly inserted into the connection port on the process workstation.
10. On the recorder, make sure to plot in units of 0% to 100% the controller out-put (4-20 mA) connected to channel 1 and the transmitter output (0 pH to 14 pH) connected to channel 2.
11. Configure the metering pump delivering the hydrochloric acid solution so that its delivery rate goes from 0% to 100% when the output signal from the con-troller varies from 4 mA to 20 mA.
12. Configure the pH transmitter so that its output varies from 4 mA to 20 mA when the pH value varies from 0 to 14.
13. Test your system for leaks. Use the drive to make the pump run at low speed in order to produce a small flow rate. Gradually increase the flow rate, up to 50% of the maximum flow rate that the pumping unit can deliver (i.e., set the drive speed to 30 Hz). Repair all leaks.
Ex. 1-1 – PID Control of a Batch pH Process with a Strong Acid Procedure
© Festo Didactic 86014-10 35
14. Start the pump and set the drive speed to 30 Hz.
This setup uses a telescopic pipe which can extend if the pump runs at a too high speed.Be sure to set the drive speed to a maximum of 30 Hz and secure the tubing as much attach brackets, Model 85444, as possible.
15. Fill the column up to 20 cm (8 in) of water, then close HV1 and open HV6 to put the process workstation into recirculation mode.
16. Remove one of the caps from the top of the column. Using a funnel, add about 20 mL of phenol red to the process water. Add more phenol red for more contrast if desired.
Tuning the controller for batch pH process control
17. Set the controller to PI mode and configure it with the parameters shown in Table 1-3. Be careful to convert these parameters for your controller. Some controllers use proportional band instead of the controller gain or reset rate instead of integral time (or reset time).
Table 1-3. Controller parameters.
Parameter Value
Controller gain ( ) 4.0
Integral time ( ) 48 s (0.8 min)
Set point 40%
18. Using the metering pump connected to the chemical tank containing the solution of 0.08 mol/L of sodium hydroxide, start injecting alkaline solution into the process water with the metering pump delivery rate set to 25% of its maximum delivery rate.
19. Set your controller to automatic mode.
20. The parameter of Table 1-3 are starting values, you may have to fine tune your controller to refine the control of your loop. Use the PID tuning chart in Figure 1-20 and the trial-and-error method to fine tune the control of the batch process.
21. Since alkaline solution is constantly added, this batch process is more difficult to control when the pH is greater than the set point than it is to control when the pH is less than the set point. Therefore, to fine tune the controller, make changes in the set point from 40% to 50% or from 50% to 60%.
Ex. 1-1 – PID Control of a Batch pH Process with a Strong Acid Procedure
36 © Festo Didactic 86014-10
22. As you experiment with fine tuning the controller, make sure to adjust the level in the column to 20 cm (8 in) by opening HV4.
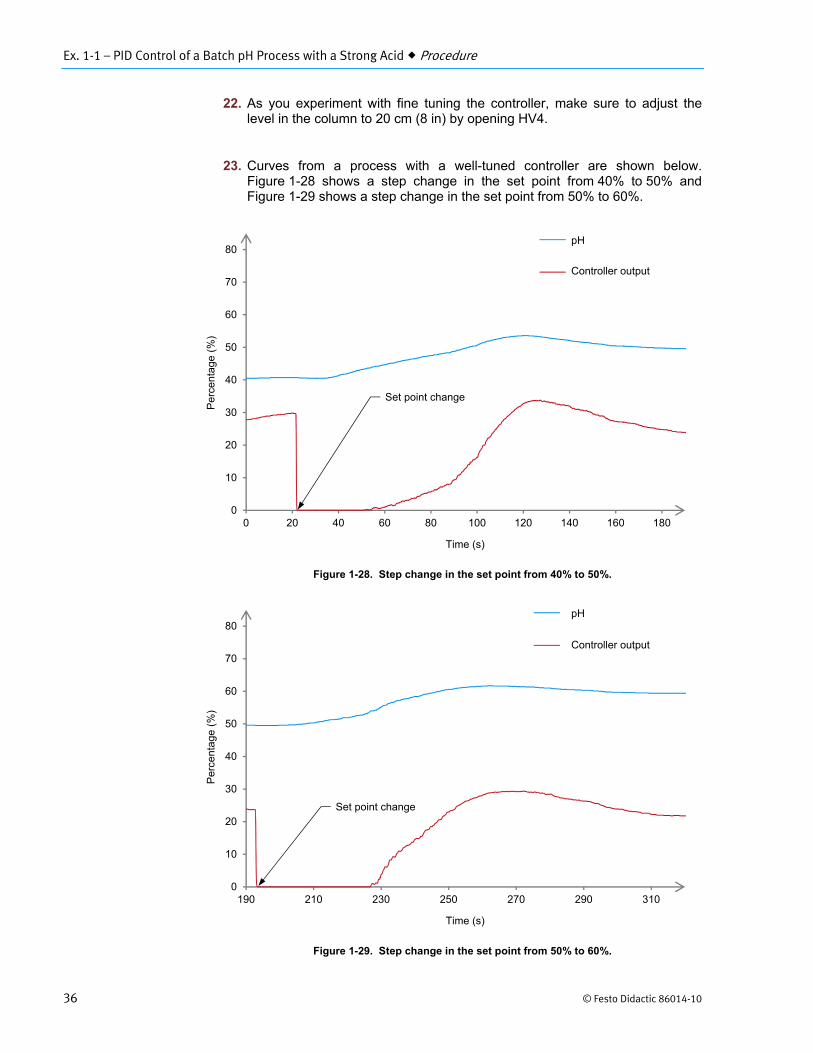
23. Curves from a process with a well-tuned controller are shown below. Figure 1-28 shows a step change in the set point from 40% to 50% and Figure 1-29 shows a step change in the set point from 50% to 60%.
Figure 1-28. Step change in the set point from 40% to 50%.
Figure 1-29. Step change in the set point from 50% to 60%.
0
10
20
30
40
50
60
70
80
0 20 40 60 80 100 120 140 160 180
pH(%)Metering pump (HCl)
0
10
20
30
40
50
60
70
80
190 210 230 250 270 290 310
pH(%)Metering pump (HCl)
Set point change
Set point change
pH
Controller output
pH
Controller output
Time (s)
Time (s)
Per
cent
age
(%)
Per
cent
age
(%)
Ex. 1-1 – PID Control of a Batch pH Process with a Strong Acid Procedure
© Festo Didactic 86014-10 37
Controlling a batch pH process
24. Once the controller is properly tuned, it is time to test your pH loop against a perturbation in the process. First, make sure to adjust the level in the column to 20 cm (8 in) by opening HV4.
25. Next, make sure the controller set point is set to 40% and that the pH value of the process water is stable close to this set point.
26. When ready, change the delivery rate of the metering pump injecting alkaline solution from 25% to 50% and observe on the trend recorder how the controller reacts to this perturbation.
27. Note the time and date displayed the recorder. You will need this information to retrieve the data from the recorder at the end of this exercise.
28. If the controller is properly tuned, the pH value of the process water should stabilize within 10 minutes. If the pH does not stabilize, fine tune the controller once more and try again the Controlling a batch pH process section. The ideal tuning parameters can vary from one setup to another depending on the type of water used, the delivery flow rate of the metering pumps, the temperature, the quantity of water in the column, etc. Therefore, be patient and systematic while tuning your controller.
29. Once the process loop reacts appropriately to the perturbation in the alkaline flow rate described in step 26, try decreasing the delivery rate of the metering pump injecting alkaline solution from 50% to 25%. Again, observe how the controller reacts to this perturbation on the trend recorder.
30. Note the time and date displayed on the recorder.
Neutralizing the process water
31. The process water contains a strong acid solution now. Therefore, it is very important that you neutralize the process water before draining the system.
32. Since the controller is now properly tuned, change the controller set point to 50% (i.e., a pH value of 7) and wait for the process to stabilize at the set point.
33. When the pH has reached a value between 6.5 and 7.5, it is safe to drain the system. Open HV4 and HV5 to drain the water from the column into the main tank of the process workstation.
Ex. 1-1 – PID Control of a Batch pH Process with a Strong Acid Procedure
38 © Festo Didactic 86014-10
Curve analysis
34. Follow the procedure in the Familiarization with the Training System manual to transfer the data from the paperless recorder to a computer.
35. Stop the system, turn off the power, and store the equipment. Do not forget to rinse the pH probe and store it into a storage solution as described in the Familiarization with the Training System manual.
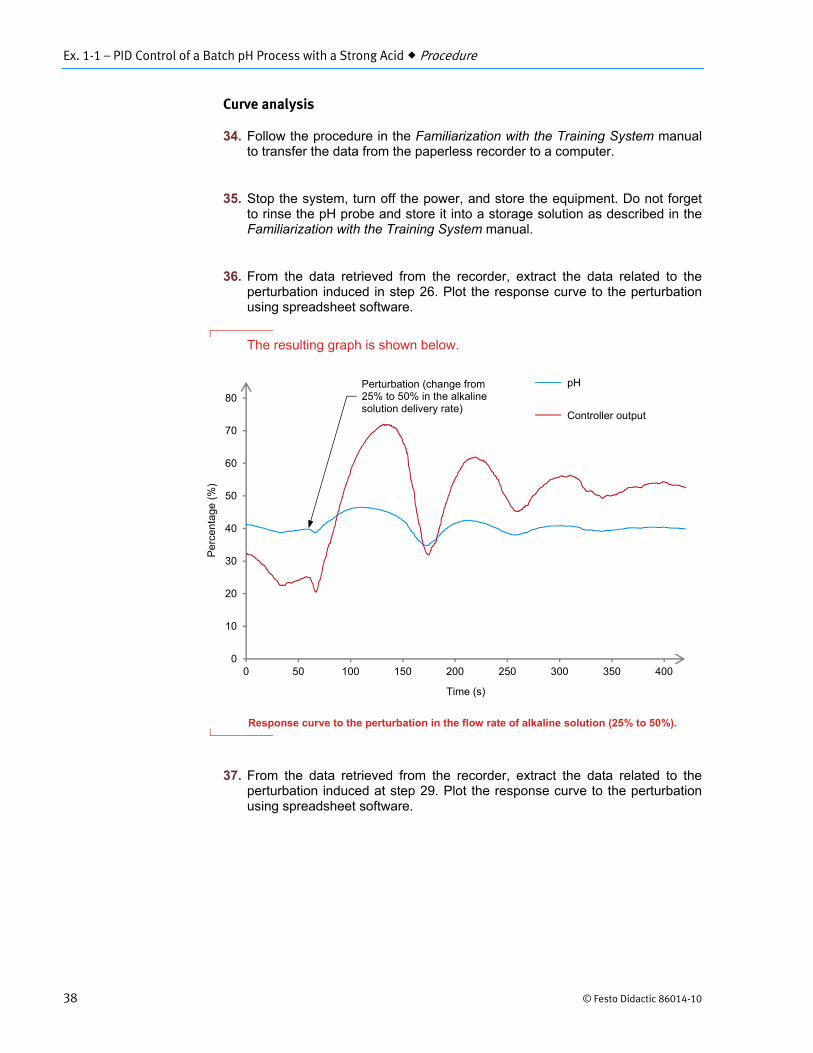
36. From the data retrieved from the recorder, extract the data related to the perturbation induced in step 26. Plot the response curve to the perturbation using spreadsheet software.
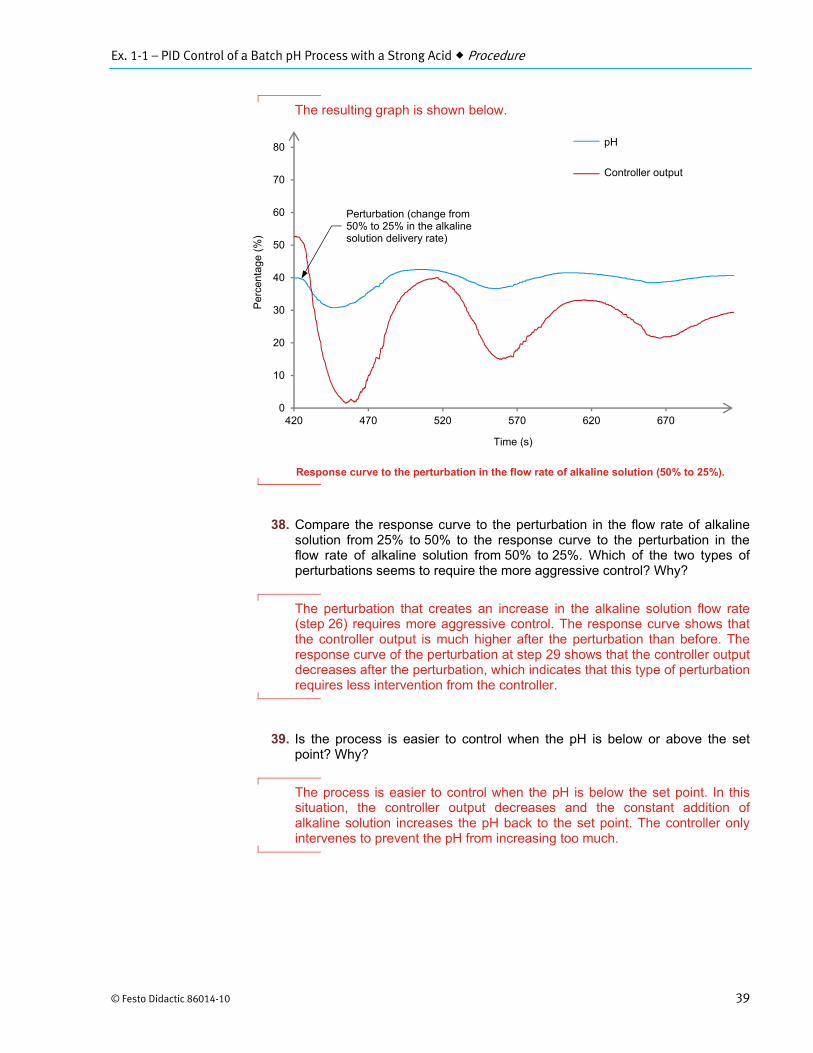
The resulting graph is shown below.
Response curve to the perturbation in the flow rate of alkaline solution (25% to 50%).
37. From the data retrieved from the recorder, extract the data related to the perturbation induced at step 29. Plot the response curve to the perturbation using spreadsheet software.
0
10
20
30
40
50
60
70
80
0 50 100 150 200 250 300 350 400
pH(%)Metering pump(HCl)
pH
Controller output
Time (s)
Per
cent
age
(%)
Perturbation (change from 25% to 50% in the alkaline solution delivery rate)
Ex. 1-1 – PID Control of a Batch pH Process with a Strong Acid Procedure
© Festo Didactic 86014-10 39
The resulting graph is shown below.
Response curve to the perturbation in the flow rate of alkaline solution (50% to 25%).
38. Compare the response curve to the perturbation in the flow rate of alkaline solution from 25% to 50% to the response curve to the perturbation in the flow rate of alkaline solution from 50% to 25%. Which of the two types of perturbations seems to require the more aggressive control? Why?
The perturbation that creates an increase in the alkaline solution flow rate (step 26) requires more aggressive control. The response curve shows that the controller output is much higher after the perturbation than before. The response curve of the perturbation at step 29 shows that the controller output decreases after the perturbation, which indicates that this type of perturbation requires less intervention from the controller.
39. Is the process is easier to control when the pH is below or above the set point? Why?
The process is easier to control when the pH is below the set point. In this situation, the controller output decreases and the constant addition of alkaline solution increases the pH back to the set point. The controller only intervenes to prevent the pH from increasing too much.
0
10
20
30
40
50
60
70
80
420 470 520 570 620 670
pH(%)Metering pump(HCl)
Perturbation (change from 50% to 25% in the alkaline solution delivery rate)
pH
Controller output
Time (s)
Per
cent
age
(%)
Ex. 1-1 – PID Control of a Batch pH Process with a Strong Acid Conclusion
40 © Festo Didactic 86014-10
40. From what you have observed in this exercise. Describe how the process loop reacts if the controller gain is too small.
The pH saturates to a high value because of the constant addition of alkaline solution.
In this exercise you learned what a batch pH process is and how to tune such a process using the trial-and-error method.
1. What is the advantage of adding integral action to a proportional control scheme?
A well tuned integral action eliminates the offset typical of P-only control.
2. Why is on-off control not efficient in the previous procedure?
On-off control works well for slow-changing processes with large capacitance. In this procedure, the pH varies quickly and, therefore, it is difficult to control the process using a two-state scheme.
3. Why does the trial-and-error method proceed with a factor of two change at every iteration?
This method (geometrical progression) typically converges toward the solution faster than a fixed increment method (arithmetic progression).
4. What happens if you increase the parameter in a PI control scheme?
The response has larger amplitude of oscillation and takes more time to stabilize.
5. Referring to Figure 1-20, explain how to set the gain and integral time of the controller in a process where it is essential that the controlled variable stays continuously below the set point.
The controller gain must be very low to avoid an overshoot in the controlled variable. In addition, the integral time should be high, further reducing the risk of overshoot, while keeping the controlled variable close to the set point.
CONCLUSION
REVIEW QUESTIONS
© Festo Didactic 86014-10 173
Bibliography
Bird, R. Byron, Stewart, W.E, and Lightfoot, E.N. Transport Phenomena, New York: John Wiley & Sons, 1960, ISBN 0-471-07392-X.
Chau, P. C. Process Control: A First Course with MATLAB, Cambridge University Press, 2002, ISBN 0-521-00255-9.
Coughanowr, D.R. Process Systems Analysis and Control, Second Edition, New York: McGraw-Hill Inc., 1991, ISBN 0-07-013212-7.
Haynes, W. M. CRC Handbook of Chemistry and Physics, 91th edition, CRC Press, 2010, ISBN 1-439-82077-5.
Liptak, B.G. Instrument Engineers' Handbook: Process Control, Third Edition, Pennsylvania, Chilton Book Company, 1995, ISBN 0-8019-8542-1.
Liptak, B.G. Instrument Engineers' Handbook: Process Measurement and Analysis, Third Edition, Pennsylvania, Chilton Book Company, 1995, ISBN 0-8019-8197-2.
Luyben, M. L., and Luyben, W. L. Essentials of Process Control, McGraw-Hill Inc., 1997, ISBN 0-07-039172-6.
Luyben, W.L. Process Modeling, Simulation and Control for Chemical Engineers, Second Edition, New York: McGraw-Hill Inc., 1990, ISBN 0-07-100793-8.
Mcmillan, G.K. and Cameron, R.A. Advanced pH Measurement and Control, Third Edition, NC: ISA, 2005, ISBN 0-07-100793-8.
Mcmillan, G. K. Good Tuning: A Pocket Guide, ISA - The Instrumentation, Systems, and Automation Society, 2000, ISBN 1-55617-726-7.
Mcmillan, G. K. Process/Industrial Instruments and Controls Handbook, Fifth Edition, New York: McGraw-Hill Inc., 1999, ISBN 0-07-012582-1.
Metcalf & Eddy INC. Wastewater Engineering - Treatment and Reuse, Third Edition, McGraw-Hill Inc., 1991, ISBN 0-07-041690-7.
Perry, R.H. and Green, D. Perry's Chemical Engineers' Handbook, Sixth Edition, New York: McGraw-Hill Inc., 1984, ISBN 0-07-049479-7.
Raman, R. Chemical Process Computation, New-York: Elsevier applied science ltd, 1985, ISBN 0-85334-341-1.
Ranade, V. V. Computational Flow Modeling for Chemical Reactor Engineering, California: Academic Press, 2002, ISBN 0-12-576960-1.
Shinskey, G.F. Process Control Systems, Third Edition, New York: McGraw-Hill Inc., 1988, ISBN 978-0070569034.
Smith, Carlos A. Automated Continuous Process Control, John Wiley & Sons, Inc., New York 2002, ISBN 0-471-21578-3.
Soares, C. Process Engineering Equipment Handbook, McGraw-Hill Inc., 2002, ISBN 0-07-059614-X.

Bibliography
174 © Festo Didactic 86014-10
Weast, R.C. CRC Handbook of Chemistry and Physics, 1st Student Edition, Florida: CRC Press, 1988, ISBN 0-4893-0740-6.