Embed Size (px)
Citation preview
RESEARCH ARTICLE
Lack of Ecological and Life History Context
Can Create the Illusion of Social Interactions in
Dictyostelium discoideum
Ricardo Martınez-Garcıa, Corina E. Tarnita*
Department of Ecology and Evolutionary Biology, Princeton University, Princeton NJ, United States of
America
Abstract
Studies of social microbes often focus on one fitness component (reproductive success
within the social complex), with little information about or attention to other stages of the life
cycle or the ecological context. This can lead to paradoxical results. The life cycle of the
social amoeba Dictyostelium discoideum includes a multicellular stage in which not neces-
sarily clonal amoebae aggregate upon starvation to form a possibly chimeric (genetically
heterogeneous) fruiting body made of dead stalk cells and spores. The lab-measured repro-
ductive skew in the spores of chimeras indicates strong social antagonism that should result
in low genotypic diversity, which is inconsistent with observations from nature. Two studies
have suggested that this inconsistency stems from the one-dimensional assessment of fit-
ness (spore production) and that the solution lies in tradeoffs between multiple life-history
traits, e.g.: spore size versus viability; and spore-formation (via aggregation) versus staying
vegetative (as non-aggregated cells). We develop an ecologically-grounded, socially-neu-
tral model (i.e. no social interactions between genotypes) for the life cycle of social amoebae
in which we theoretically explore multiple non-social life-history traits, tradeoffs and tradeoff-
implementing mechanisms. We find that spore production comes at the expense of time to
complete aggregation, and, depending on the experimental setup, spore size and viability.
Furthermore, experimental results regarding apparent social interactions within chimeric
mixes can be qualitatively recapitulated under this neutral hypothesis, without needing to
invoke social interactions. This allows for simple potential resolutions to the previously para-
doxical results. We conclude that the complexities of life histories, including social behavior
and multicellularity, can only be understood in the appropriate multidimensional ecological
context, when considering all stages of the life cycle.
Author Summary
Fitness in social microbes is often measured in terms of reproductive success in the social
stage, with little regard to other stages of the life cycle (e.g. solitary) or to the ecological
context. This approach can lead to seemingly paradoxical results that point to complex
PLOS Computational Biology | DOI:10.1371/journal.pcbi.1005246 December 15, 2016 1 / 21
a11111
OPENACCESS
Citation: Martınez-Garcıa R, Tarnita CE (2016)
Lack of Ecological and Life History Context Can
Create the Illusion of Social Interactions in
Dictyostelium discoideum. PLoS Comput Biol 12
(12): e1005246. doi:10.1371/journal.pcbi.1005246
Editor: Natalia L. Komarova, University of California
Irvine, UNITED STATES
Received: May 2, 2016
Accepted: November 14, 2016
Published: December 15, 2016
Copyright: © 2016 Martınez-Garcıa, Tarnita. This is
an open access article distributed under the terms
of the Creative Commons Attribution License,
which permits unrestricted use, distribution, and
reproduction in any medium, provided the original
author and source are credited.
Data Availability Statement: All relevant data are
within the paper and its Supporting Information
files.
Funding: We acknowledge the support of the
Gordon and Betty Moore Foundation (https://www.
moore.org/) grant GBMF2550.06 to RMG, and the
Alfred P. Sloan Foundation (http://www.sloan.org/)
grant FR-2015-65382 to CET. The funders had no
role in study design, data collection and analysis,
decision to publish, or preparation of the
manuscript.
social interactions (e.g., social cheating) among individuals in the population. However,
recent experimental studies in Dictyostelium discoideum, one of the most studied social
microbes, have highlighted various tradeoffs among previously ignored non-social traits
that should affect fitness. We develop an ecologically-motivated socially-neutral model for
the life cycle of D. discoideum that combines these proposed traits and tradeoffs and pro-
poses new ones to determine whether existing observations can be explained without the
need to invoke social interactions. We confirm this expectation and conclude that the
complexities of social behavior can only be understood in the appropriate ecological con-
text, when considering a complete description of the life cycle.
Introduction
The cellular slime mold Dictyostelium discoideum is one of the most studied examples of coop-
eration and altruism in microbes. Upon starvation, solitary amoebae aggregate with neighbors
to form a multicellular fruiting body made of stalk and spores. The spores are resistant and
will germinate upon encountering favorable conditions while the stalk cells die during stalk
development [1–4]. In the process of aggregation these amoebae do not exclude non-kin; con-
sequently, chimeras (multicellular fruiting bodies consisting of at least two genotypes) have
been observed both in the lab and in nature [5–8]. These chimeras are functional: the multiple
genotypes participate both in stalk formation and in spore production (although not necessar-
ily in equal measures, a phenomenon known as reproductive skew [6]). Studies to date have
found significant reproductive skew in D. discoideum chimeras [9,10] and in a variety of other
cellular slime molds [11]. This was interpreted as a sign of social conflict and strains that were
over-represented in the spores were seen as socially dominant [9,10]. Furthermore, the appar-
ent dominance of some strains over all others (e.g., in D. discoideum, linear dominance hierar-
chies were recorded) raised into question the persistence of the latter in the wild. Thus, the
experimentally uncovered dominance relationships seemed to point towards a decrease in spe-
cies-wide genetic diversity that was inconsistent with the immense diversity and coexistence
observed among strains in nature [5,8,9,11].
Recent studies [12,13] have suggested that both the impression of social conflict and the
inconsistency between experimental predictions and natural observations arise due to the one-
dimensional assessment of D. discoideum fitness, which is equated to spore contribution, when
in fact life-history tradeoffs between non-social traits can lead to multiple fitness components.
The first proposed tradeoff concerns the response to starvation and lies in the decision
between staying vegetative and becoming a spore [12]. In D. discoideum not all cells aggregate
to become multicellular; experiments have shown that these cells are viable [12] and theoretical
approaches suggested that they could be part of a bet-hedging strategy in uncertain environ-
ments [12,14]: non-aggregators (also called loner cells in [12]) have a high chance of death if
the starvation period is long, but, if food does return to the environment, they have a head
start against spores that need time to germinate. Given this tradeoff, genotypes that are over-
represented in spores might not be social cheats but rather they could simply be those that
have been selected to leave fewer non-aggregators behind [12]. While this tradeoff does not
yield coexistence in a well-mixed setting, it can do so in the presence of temporal heterogeneity
(e.g., seasonality [15]), or of spatial heterogeneity and spore dispersal [12]. Subsequently, a sec-
ond tradeoff was determined empirically, between spore number and viability: genotypes that
were overrepresented in spores also made smaller and less viable spores when grown clonally,
D. discoideum: Lack of Ecology and Life-History May Result in Illusory Social Interactions
PLOS Computational Biology | DOI:10.1371/journal.pcbi.1005246 December 15, 2016 2 / 21
Competing Interests: The authors have declared
that no competing interests exist.
suggesting that the previously-determined social dominance might be only apparent [13]. This
tradeoff was hypothesized to allow coexistence of multiple strains [13].
While [12–14] convincingly argue that D. discoideum fitness has multiple components that,
when ignored, can create the illusion of social interactions, there is no immediate link between
the two different tradeoffs they propose, nor is there a theoretical framework in which to assess
(a) how many such tradeoffs are likely to occur and what are the relationships between them,
(b) by what mechanisms they play out and (c) whether they are sufficient to resolve the incon-
sistency between the lab-based dominance hierarchies and the experimental observations. To
this end, we set out to provide such an eco-evolutionary framework in which we study selec-
tion on non-social life-history traits in D. discoideum, explore the possible tradeoffs that can
arise, and make testable predictions for future empirical work. While the framework is not all-
encompassing, it provides a theoretical starting point on which additional ecological and life-
history knowledge can be built. We recapitulate existing experimental results without needing
to invoke social interactions, we make testable predictions, and we propose improved experi-
mental designs and measures of D. discoideum chimeric interactions that capture the variety of
tradeoffs.
More broadly, these findings affect our understanding of D. discoideum social behavior and
multicellularity and they resonate with recent studies emphasizing the challenges associated
with assessing cooperation and free-riding in microbes in the absence of the ecological context
under which the trait deemed cooperative has evolved and is maintained [12–14,16–20]. We
showcase some of the complex outcomes (e.g. bet-hedging, coexistence) that ecological context
and selection on non-social traits can produce in the absence of social interactions. Many of
these outcomes have been theoretically shown before when studied independently (i.e. focus
on one trait or one environmental characteristic, e.g. see [21–23]) but here we identify power-
ful synergistic interactions that cannot be predicted from one-dimensional analyses. Finally,
these results also contribute towards clarifying the misinterpretations that can arise from
sociobiological investigations into microbe behavior that are not grounded in an ecological
understanding.
Results
Eco-evolutionary framework
Starting from experimental observations, we build a model of cellular slime molds incorporat-
ing hypothesized life-history traits and tradeoffs and their functional consequences [24]. The
model we employ is a generalization of [12] to study more broadly life-history tradeoffs in D.
discoideum in response to environmental stressors. Since we are interested in nonsocial traits,
we study a well-mixed population in which we assume that there are no social interactions
between genotypes and in which we do not model the spatial aggregation process. This model
therefore ignores interactions between genotypes that may arise during the developmental
process. Although D. discoideum and other cellular slime molds are likely to be found in spa-
tially structured environments where movement in the vegetative state is limited, a first well-
mixed approach is necessary to tease apart the effects of spatial structure from effects arising
from simple life history tradeoffs in a well-mixed setting. In this socially neutral, well-mixed
context, aggregation occurs randomly (with anyone in the population) and within chimeric
aggregates there are no interactions.
Environment. Here we focus on starvation and we study both deterministic environ-
ments–in which food recovery is certain and the starvation times (time between onset of star-
vation and the next food pulse) are always of the same length, T, and stochastic environments–
in which food recovery is variable and uncertain and the starvation times are drawn from an
D. discoideum: Lack of Ecology and Life-History May Result in Illusory Social Interactions
PLOS Computational Biology | DOI:10.1371/journal.pcbi.1005246 December 15, 2016 3 / 21
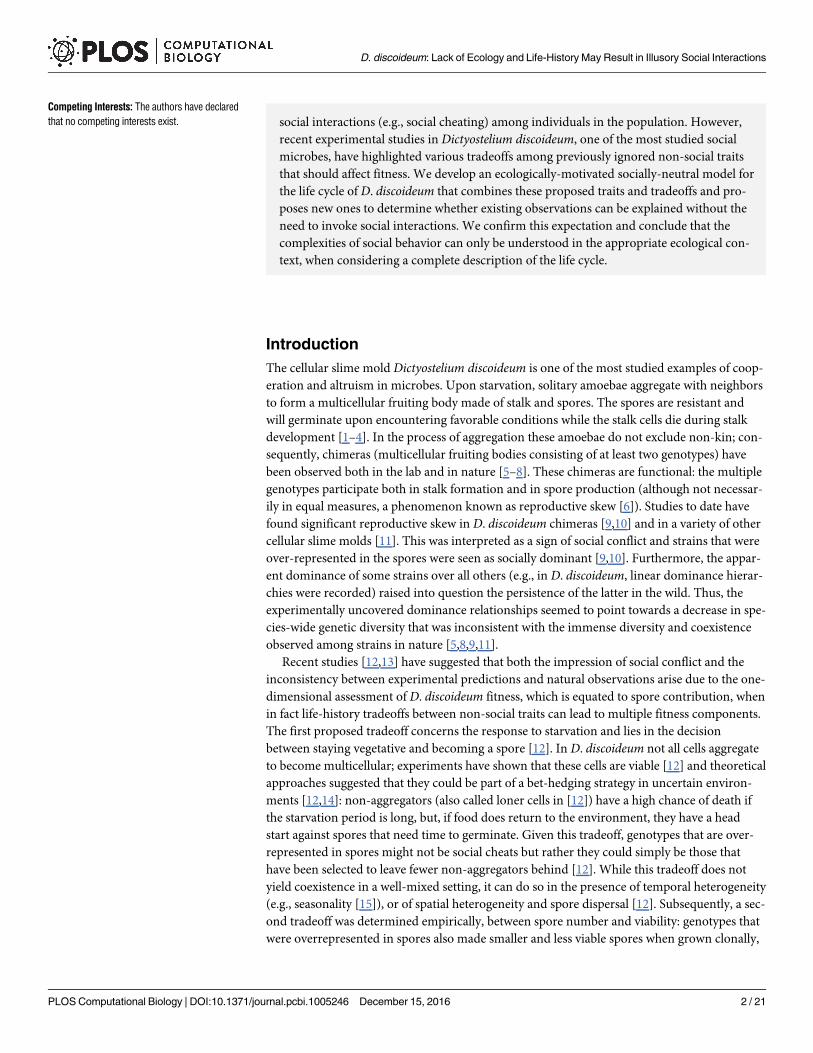
exponential distribution with average λT (Fig 1A). We assume that all cells in a given environ-
ment compete for the available resources.
Life-history traits. Based on experimental observations, three traits seem to play an
important role: the commitment to aggregating versus not aggregating (staying solitary) in
response to starvation [12,14]; the spore size; and the spore viability [13]. The first trait, the
response to starvation, encapsulates a genotype’s decision to commit resources to sporulation
(which occurs as a result of aggregation) or to remaining vegetative, and captures the tradeoff
between resistant spores that are able to survive in harsh conditions but are slow to germinate
when the conditions improve, and non-resistant solitary cells (non-aggregators) that eventu-
ally die in harsh conditions but which are able to immediately start eating and dividing if food
returns. The second and third traits–spore size and spore viability–are correlated: spore viabil-
ity appears to be a direct functional consequence of spore size [13]. This agrees with work in
other species where egg or seed size determine germination ability [25–28]. Furthermore,
spore size is naturally linked to cell size, the latter being a determinant of cell survival [29]. We
hypothesize that cell size, and implicitly spore size, are linked to another trait—the rate at
which cells divide, c,—via a classical growth-reproduction tradeoff [20]. Given the relationship
between size and survival/viability, this further results into a reproduction-survival tradeoff
between cells that divide fast and are able to use up common resources but pay the cost of a
decreased survival (for non-aggregators) or viability (for spores, [13]), and cells that divide
slowly thereby potentially losing out resources to faster dividing strains but at the same time
having an increased survival or viability (Fig 1B and 1C).
Implementation of the aggregator versus non-aggregator tradeoff. For the aggregators:
non-aggregators tradeoff, it has been hypothesized that a stochastic switch is responsible for its
implementation [12,14], such that, upon starvation, the population splits instantaneously into
fixed fractions of aggregators (some of which become spores while others die during stalk for-
mation) and non-aggregators. In this case the trait under selection is the fraction of individuals
that aggregate upon starvation, α (Fig 1D and 1F): if α = 0, a monoculture of genotype α does
not undergo aggregation; if α = 1, a monoculture only produces aggregators and leaves no
non-aggregators behind. Intermediate α values represent a mixed strategy where some cells
aggregate and others remain solitary. However, there is no experimental proof that a discrete
mechanism such as a stochastic switch is responsible for the non-aggregators. Therefore, in
addition to the stochastic switch, we also study a second, continuous mechanism, whereby
starving solitary cells turn into aggregated cells continuously at rate γ, which is the trait under
selection. The higher the rate γ, the faster the cells aggregate (Fig 1E and 1G). While in the dis-
crete approach only a certain fraction of cells can aggregate and the others remain solitary, veg-
etative cells, in the continuous approach every cell has the potential to aggregate and become a
spore, but some take longer than others. Therefore, for a given genotype (γ, c), the final num-
ber of spores is determined by the length of the starvation period (Fig A(i) in S1 Text). This lat-
ter approach also allows the study of the time to complete aggregation (henceforth aggregation
time), defined as the time it takes for all the non-aggregators either to die or to aggregate. With
this definition, the lower the aggregation rate γ, the longer it takes a genotype to complete
aggregation (Fig A(ii) in S1 Text). In what follows we will show that the model predictions are
robust to the choice of mechanism; therefore, to simplify the presentation, we will focus on the
discrete mechanism in the main text and present the continuous mechanism in the S1 Text.
Model. The dynamics of the free-living amoebae is given by a well-mixed model of com-
petition for a resource R between the different genotypes, each given by a pair (α, c) or (γ, c),
depending on the mechanism under investigation. The genotypes have abundances X�,c, where
the � is a place holder for either α or γ, depending on the mechanism under investigation. Thus
D. discoideum: Lack of Ecology and Life-History May Result in Illusory Social Interactions
PLOS Computational Biology | DOI:10.1371/journal.pcbi.1005246 December 15, 2016 4 / 21
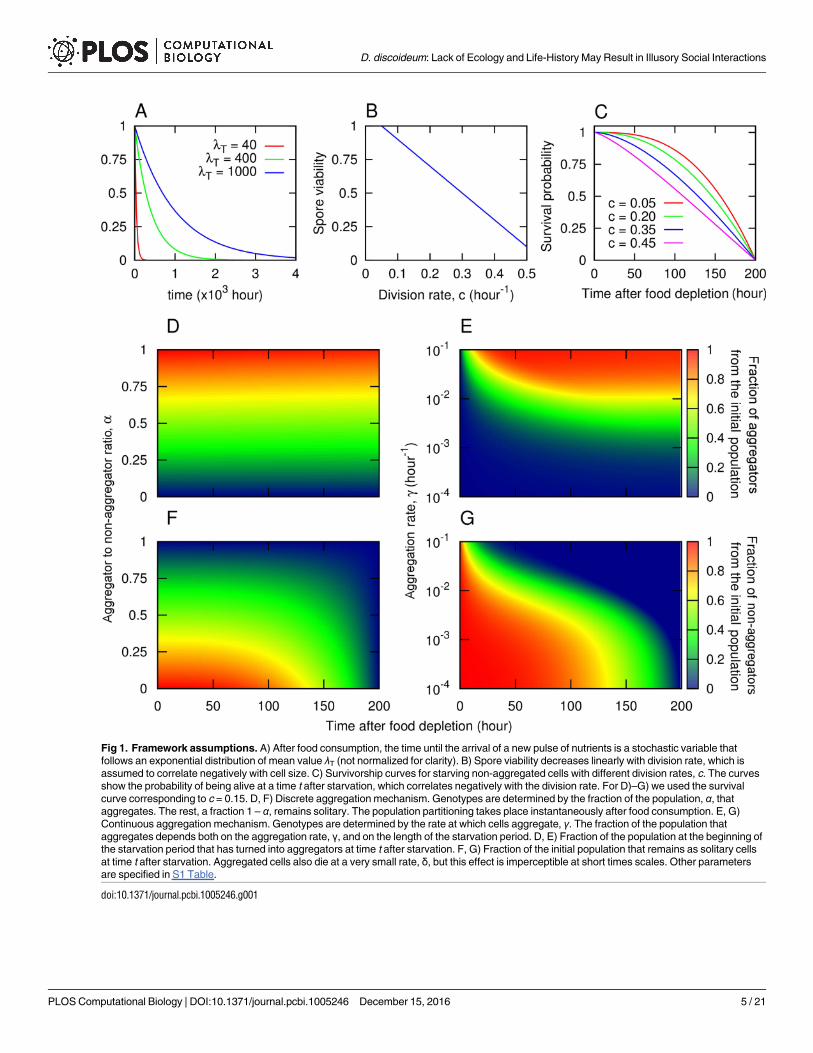
Fig 1. Framework assumptions. A) After food consumption, the time until the arrival of a new pulse of nutrients is a stochastic variable that
follows an exponential distribution of mean value λT (not normalized for clarity). B) Spore viability decreases linearly with division rate, which is
assumed to correlate negatively with cell size. C) Survivorship curves for starving non-aggregated cells with different division rates, c. The curves
show the probability of being alive at a time t after starvation, which correlates negatively with the division rate. For D)–G) we used the survival
curve corresponding to c = 0.15. D, F) Discrete aggregation mechanism. Genotypes are determined by the fraction of the population, α, that
aggregates. The rest, a fraction 1 – α, remains solitary. The population partitioning takes place instantaneously after food consumption. E, G)
Continuous aggregation mechanism. Genotypes are determined by the rate at which cells aggregate, γ. The fraction of the population that
aggregates depends both on the aggregation rate, γ, and on the length of the starvation period. D, E) Fraction of the population at the beginning of
the starvation period that has turned into aggregators at time t after starvation. F, G) Fraction of the initial population that remains as solitary cells
at time t after starvation. Aggregated cells also die at a very small rate, δ, but this effect is imperceptible at short times scales. Other parameters
are specified in S1 Table.
doi:10.1371/journal.pcbi.1005246.g001
D. discoideum: Lack of Ecology and Life-History May Result in Illusory Social Interactions
PLOS Computational Biology | DOI:10.1371/journal.pcbi.1005246 December 15, 2016 5 / 21
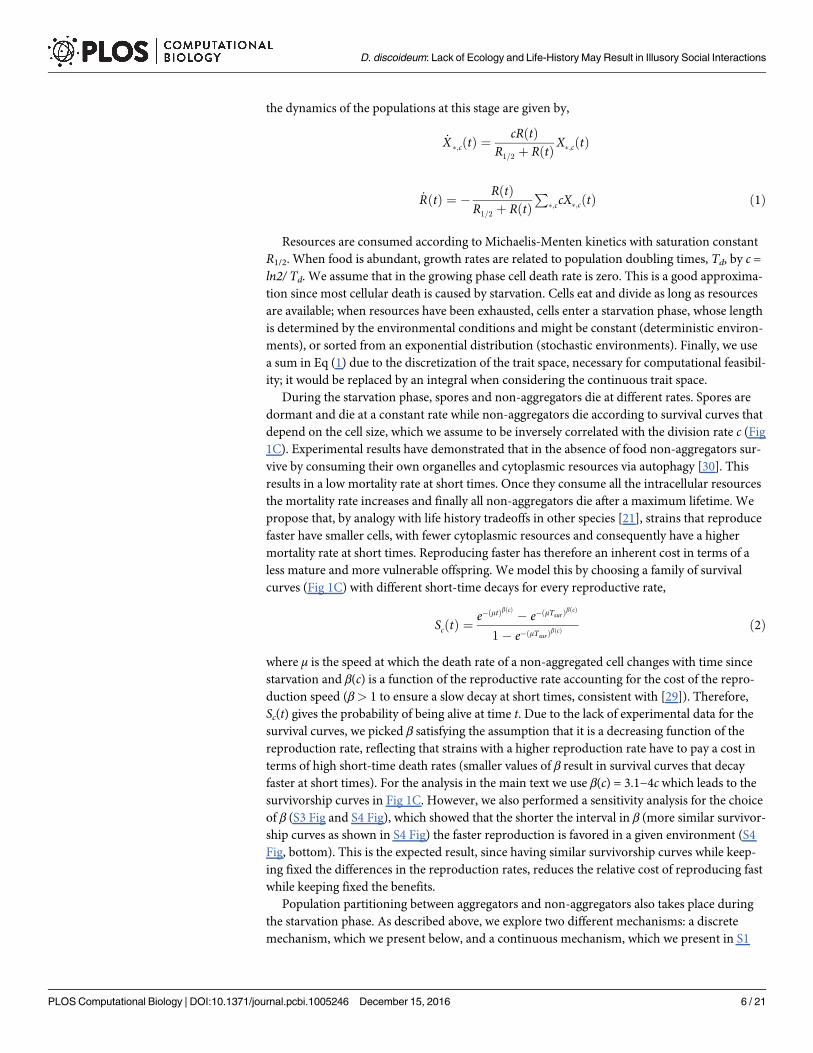
the dynamics of the populations at this stage are given by,
_X �;c tð Þ ¼cRðtÞ
R1=2 þ RðtÞX�;c tð Þ
_R tð Þ ¼ �RðtÞ
R1=2 þ RðtÞP�;ccX�;c tð Þ ð1Þ
Resources are consumed according to Michaelis-Menten kinetics with saturation constant
R1/2. When food is abundant, growth rates are related to population doubling times, Td, by c =
ln2/ Td. We assume that in the growing phase cell death rate is zero. This is a good approxima-
tion since most cellular death is caused by starvation. Cells eat and divide as long as resources
are available; when resources have been exhausted, cells enter a starvation phase, whose length
is determined by the environmental conditions and might be constant (deterministic environ-
ments), or sorted from an exponential distribution (stochastic environments). Finally, we use
a sum in Eq (1) due to the discretization of the trait space, necessary for computational feasibil-
ity; it would be replaced by an integral when considering the continuous trait space.
During the starvation phase, spores and non-aggregators die at different rates. Spores are
dormant and die at a constant rate while non-aggregators die according to survival curves that
depend on the cell size, which we assume to be inversely correlated with the division rate c (Fig
1C). Experimental results have demonstrated that in the absence of food non-aggregators sur-
vive by consuming their own organelles and cytoplasmic resources via autophagy [30]. This
results in a low mortality rate at short times. Once they consume all the intracellular resources
the mortality rate increases and finally all non-aggregators die after a maximum lifetime. We
propose that, by analogy with life history tradeoffs in other species [21], strains that reproduce
faster have smaller cells, with fewer cytoplasmic resources and consequently have a higher
mortality rate at short times. Reproducing faster has therefore an inherent cost in terms of a
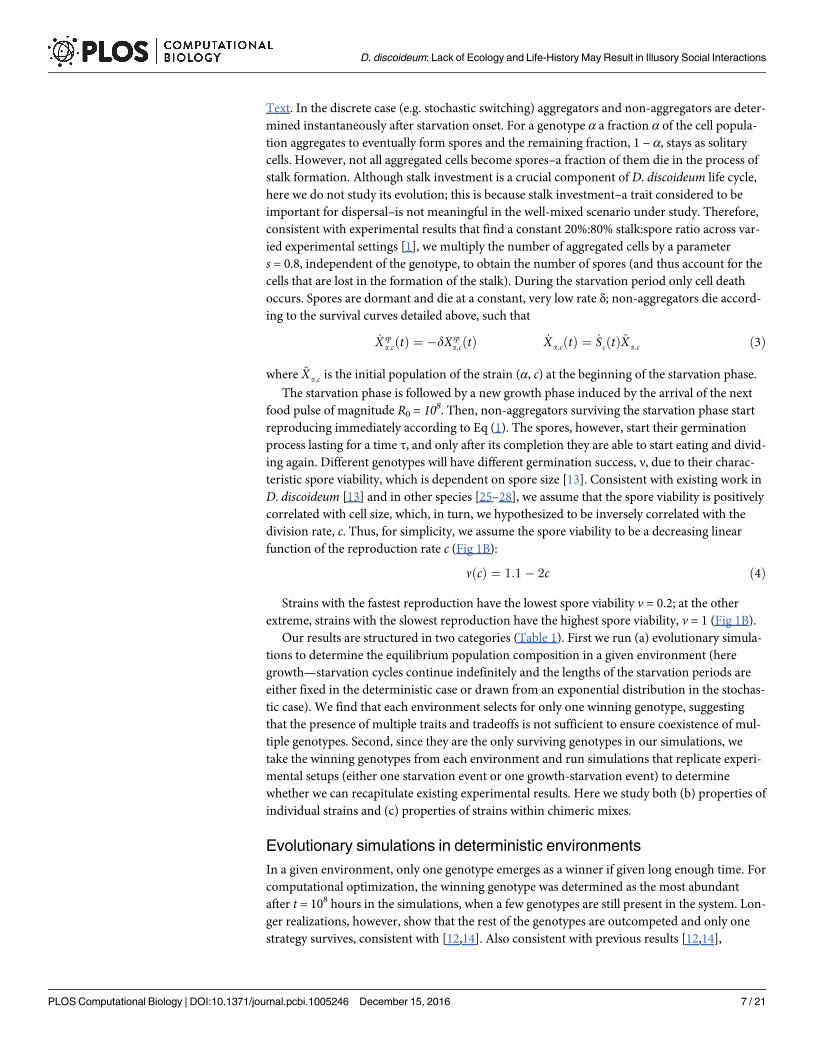
less mature and more vulnerable offspring. We model this by choosing a family of survival
curves (Fig 1C) with different short-time decays for every reproductive rate,
Sc tð Þ ¼e� ðmtÞbðcÞ � e� ðmTsurÞ
bðcÞ
1 � e� ðmTsurÞbðcÞ ð2Þ
where μ is the speed at which the death rate of a non-aggregated cell changes with time since
starvation and β(c) is a function of the reproductive rate accounting for the cost of the repro-
duction speed (β> 1 to ensure a slow decay at short times, consistent with [29]). Therefore,
Sc(t) gives the probability of being alive at time t. Due to the lack of experimental data for the
survival curves, we picked β satisfying the assumption that it is a decreasing function of the
reproduction rate, reflecting that strains with a higher reproduction rate have to pay a cost in
terms of high short-time death rates (smaller values of β result in survival curves that decay
faster at short times). For the analysis in the main text we use β(c) = 3.1−4c which leads to the
survivorship curves in Fig 1C. However, we also performed a sensitivity analysis for the choice
of β (S3 Fig and S4 Fig), which showed that the shorter the interval in β (more similar survivor-
ship curves as shown in S4 Fig) the faster reproduction is favored in a given environment (S4
Fig, bottom). This is the expected result, since having similar survivorship curves while keep-
ing fixed the differences in the reproduction rates, reduces the relative cost of reproducing fast
while keeping fixed the benefits.
Population partitioning between aggregators and non-aggregators also takes place during
the starvation phase. As described above, we explore two different mechanisms: a discrete
mechanism, which we present below, and a continuous mechanism, which we present in S1
D. discoideum: Lack of Ecology and Life-History May Result in Illusory Social Interactions
PLOS Computational Biology | DOI:10.1371/journal.pcbi.1005246 December 15, 2016 6 / 21
Text. In the discrete case (e.g. stochastic switching) aggregators and non-aggregators are deter-
mined instantaneously after starvation onset. For a genotype α a fraction α of the cell popula-
tion aggregates to eventually form spores and the remaining fraction, 1 − α, stays as solitary
cells. However, not all aggregated cells become spores–a fraction of them die in the process of
stalk formation. Although stalk investment is a crucial component of D. discoideum life cycle,
here we do not study its evolution; this is because stalk investment–a trait considered to be
important for dispersal–is not meaningful in the well-mixed scenario under study. Therefore,
consistent with experimental results that find a constant 20%:80% stalk:spore ratio across var-
ied experimental settings [1], we multiply the number of aggregated cells by a parameter
s = 0.8, independent of the genotype, to obtain the number of spores (and thus account for the
cells that are lost in the formation of the stalk). During the starvation period only cell death
occurs. Spores are dormant and die at a constant, very low rate δ; non-aggregators die accord-
ing to the survival curves detailed above, such that
_X spa;cðtÞ ¼ � dXsp
a;cðtÞ _X a;cðtÞ ¼ _ScðtÞ~X a;c ð3Þ
where ~X a;c is the initial population of the strain (α, c) at the beginning of the starvation phase.
The starvation phase is followed by a new growth phase induced by the arrival of the next
food pulse of magnitude R0 = 108. Then, non-aggregators surviving the starvation phase start
reproducing immediately according to Eq (1). The spores, however, start their germination
process lasting for a time τ, and only after its completion they are able to start eating and divid-
ing again. Different genotypes will have different germination success, ν, due to their charac-
teristic spore viability, which is dependent on spore size [13]. Consistent with existing work in
D. discoideum [13] and in other species [25–28], we assume that the spore viability is positively
correlated with cell size, which, in turn, we hypothesized to be inversely correlated with the
division rate, c. Thus, for simplicity, we assume the spore viability to be a decreasing linear
function of the reproduction rate c (Fig 1B):
nðcÞ ¼ 1:1 � 2c ð4Þ
Strains with the fastest reproduction have the lowest spore viability v = 0.2; at the other
extreme, strains with the slowest reproduction have the highest spore viability, v = 1 (Fig 1B).
Our results are structured in two categories (Table 1). First we run (a) evolutionary simula-
tions to determine the equilibrium population composition in a given environment (here
growth—starvation cycles continue indefinitely and the lengths of the starvation periods are
either fixed in the deterministic case or drawn from an exponential distribution in the stochas-
tic case). We find that each environment selects for only one winning genotype, suggesting
that the presence of multiple traits and tradeoffs is not sufficient to ensure coexistence of mul-
tiple genotypes. Second, since they are the only surviving genotypes in our simulations, we
take the winning genotypes from each environment and run simulations that replicate experi-
mental setups (either one starvation event or one growth-starvation event) to determine
whether we can recapitulate existing experimental results. Here we study both (b) properties of
individual strains and (c) properties of strains within chimeric mixes.
Evolutionary simulations in deterministic environments
In a given environment, only one genotype emerges as a winner if given long enough time. For
computational optimization, the winning genotype was determined as the most abundant
after t = 108 hours in the simulations, when a few genotypes are still present in the system. Lon-
ger realizations, however, show that the rest of the genotypes are outcompeted and only one
strategy survives, consistent with [12,14]. Also consistent with previous results [12,14],
D. discoideum: Lack of Ecology and Life-History May Result in Illusory Social Interactions
PLOS Computational Biology | DOI:10.1371/journal.pcbi.1005246 December 15, 2016 7 / 21
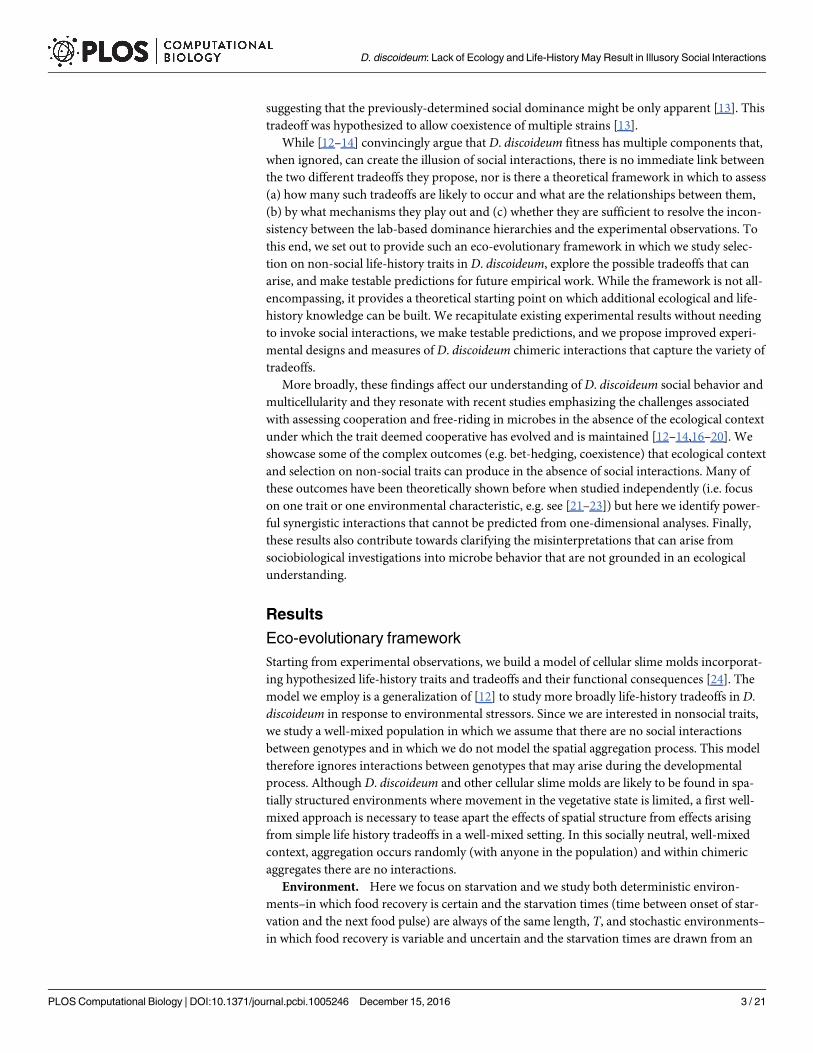
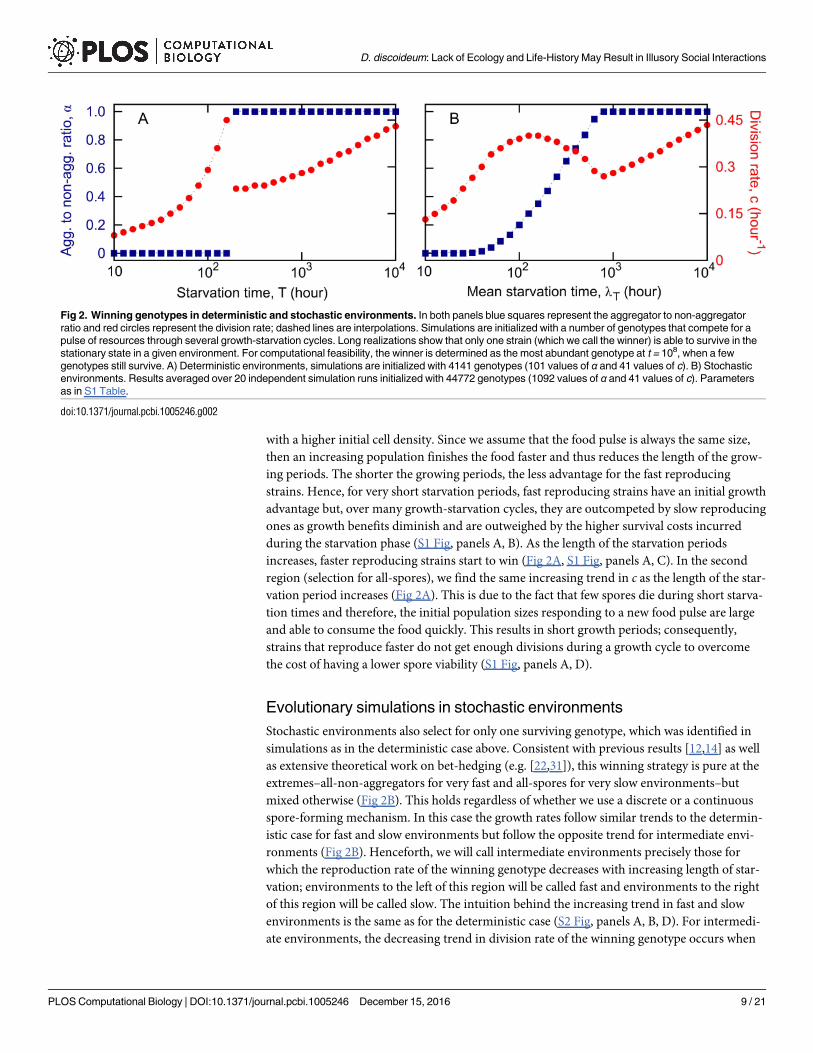
deterministic environments always select for pure strategies: environments where food recov-
ers faster select for all non-aggregators (α = 0) and environments where food recovers slower
select for all spores (α = 1) (Fig 2A). The switch between these two regions (all-non-aggrega-
tors versus all-spores) takes place at starvation times close to the maximum lifespan of a non-
aggregator in the absence of food. In both regions, the lower the starvation time, the lower the
growth rate c. In the first region (selection for all-non-aggregators), due to the very short star-
vation periods, the whole population increases over time so that each new growth period starts
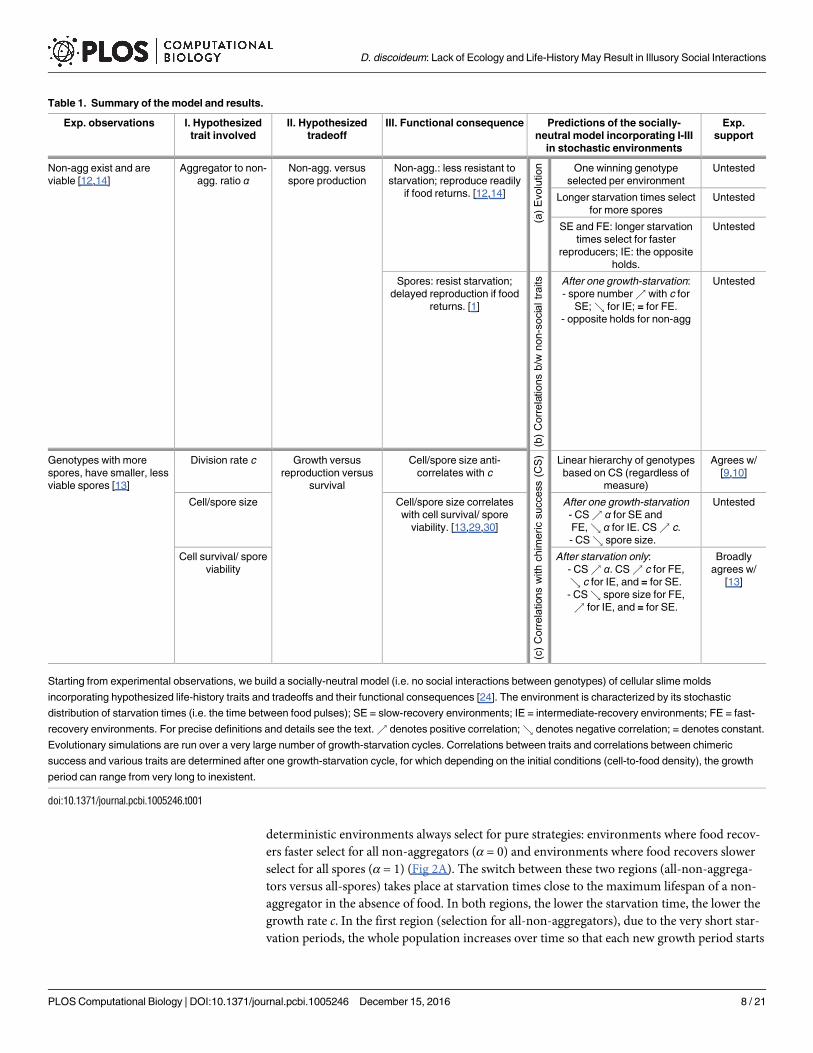
Table 1. Summary of the model and results.
Exp. observations I. Hypothesized
trait involved
II. Hypothesized
tradeoff
III. Functional consequence Predictions of the socially-
neutral model incorporating I-III
in stochastic environments
Exp.
support
Non-agg exist and are
viable [12,14]
Aggregator to non-
agg. ratio αNon-agg. versus
spore production
Non-agg.: less resistant to
starvation; reproduce readily
if food returns. [12,14]
(a)E
volution One winning genotype
selected per environment
Untested
Longer starvation times select
for more spores
Untested
SE and FE: longer starvation
times select for faster
reproducers; IE: the opposite
holds.
Untested
Spores: resist starvation;
delayed reproduction if food
returns. [1]
(b)C
orrelations
b/wnon-socialtraits After one growth-starvation:
- spore number% with c for
SE;& for IE; = for FE.
- opposite holds for non-agg
Untested
Genotypes with more
spores, have smaller, less
viable spores [13]
Division rate c Growth versus
reproduction versus
survival
Cell/spore size anti-
correlates with c
(c)C
orrelations
with
chimericsuccess(CS) Linear hierarchy of genotypes
based on CS (regardless of
measure)
Agrees w/
[9,10]
Cell/spore size Cell/spore size correlates
with cell survival/ spore
viability. [13,29,30]
After one growth-starvation
- CS% α for SE and
FE,& α for IE. CS% c.
- CS& spore size.
Untested
Cell survival/ spore
viability
After starvation only:
- CS% α. CS% c for FE,
& c for IE, and = for SE.
- CS& spore size for FE,
% for IE, and = for SE.
Broadly
agrees w/
[13]
Starting from experimental observations, we build a socially-neutral model (i.e. no social interactions between genotypes) of cellular slime molds
incorporating hypothesized life-history traits and tradeoffs and their functional consequences [24]. The environment is characterized by its stochastic
distribution of starvation times (i.e. the time between food pulses); SE = slow-recovery environments; IE = intermediate-recovery environments; FE = fast-
recovery environments. For precise definitions and details see the text.% denotes positive correlation;& denotes negative correlation; = denotes constant.
Evolutionary simulations are run over a very large number of growth-starvation cycles. Correlations between traits and correlations between chimeric
success and various traits are determined after one growth-starvation cycle, for which depending on the initial conditions (cell-to-food density), the growth
period can range from very long to inexistent.
doi:10.1371/journal.pcbi.1005246.t001
D. discoideum: Lack of Ecology and Life-History May Result in Illusory Social Interactions
PLOS Computational Biology | DOI:10.1371/journal.pcbi.1005246 December 15, 2016 8 / 21
with a higher initial cell density. Since we assume that the food pulse is always the same size,
then an increasing population finishes the food faster and thus reduces the length of the grow-
ing periods. The shorter the growing periods, the less advantage for the fast reproducing
strains. Hence, for very short starvation periods, fast reproducing strains have an initial growth
advantage but, over many growth-starvation cycles, they are outcompeted by slow reproducing
ones as growth benefits diminish and are outweighed by the higher survival costs incurred
during the starvation phase (S1 Fig, panels A, B). As the length of the starvation periods
increases, faster reproducing strains start to win (Fig 2A, S1 Fig, panels A, C). In the second
region (selection for all-spores), we find the same increasing trend in c as the length of the star-
vation period increases (Fig 2A). This is due to the fact that few spores die during short starva-
tion times and therefore, the initial population sizes responding to a new food pulse are large
and able to consume the food quickly. This results in short growth periods; consequently,
strains that reproduce faster do not get enough divisions during a growth cycle to overcome
the cost of having a lower spore viability (S1 Fig, panels A, D).
Evolutionary simulations in stochastic environments
Stochastic environments also select for only one surviving genotype, which was identified in
simulations as in the deterministic case above. Consistent with previous results [12,14] as well
as extensive theoretical work on bet-hedging (e.g. [22,31]), this winning strategy is pure at the
extremes–all-non-aggregators for very fast and all-spores for very slow environments–but
mixed otherwise (Fig 2B). This holds regardless of whether we use a discrete or a continuous
spore-forming mechanism. In this case the growth rates follow similar trends to the determin-
istic case for fast and slow environments but follow the opposite trend for intermediate envi-
ronments (Fig 2B). Henceforth, we will call intermediate environments precisely those for
which the reproduction rate of the winning genotype decreases with increasing length of star-
vation; environments to the left of this region will be called fast and environments to the right
of this region will be called slow. The intuition behind the increasing trend in fast and slow
environments is the same as for the deterministic case (S2 Fig, panels A, B, D). For intermedi-
ate environments, the decreasing trend in division rate of the winning genotype occurs when
Fig 2. Winning genotypes in deterministic and stochastic environments. In both panels blue squares represent the aggregator to non-aggregator
ratio and red circles represent the division rate; dashed lines are interpolations. Simulations are initialized with a number of genotypes that compete for a
pulse of resources through several growth-starvation cycles. Long realizations show that only one strain (which we call the winner) is able to survive in the
stationary state in a given environment. For computational feasibility, the winner is determined as the most abundant genotype at t = 108, when a few
genotypes still survive. A) Deterministic environments, simulations are initialized with 4141 genotypes (101 values of α and 41 values of c). B) Stochastic
environments. Results averaged over 20 independent simulation runs initialized with 44772 genotypes (1092 values of α and 41 values of c). Parameters
as in S1 Table.
doi:10.1371/journal.pcbi.1005246.g002
D. discoideum: Lack of Ecology and Life-History May Result in Illusory Social Interactions
PLOS Computational Biology | DOI:10.1371/journal.pcbi.1005246 December 15, 2016 9 / 21
the starvation periods are long enough to be costly for the survival of non-aggregators but they
are still short so that spores incur little mortality leading to short growth periods during which
fast reproducing cells do not derive enough benefit to offset the lower viability of their spores
(S2 Fig, panel C). For realistic values of the spore death rate (not too large), these qualitative
trends are robust with respect to parameter choice both in the stochastic and in the determin-
istic case (S3 Fig and S4 Fig). The results are independent of the initial conditions (S5 Fig,
panel A) but they are affected by the saturation behavior assumed for the Michaelis-Menten
dynamics (S5 Fig, panel B).
In what follows we will focus on stochastic environments since they are more likely to cap-
ture the realities of microbial lives [32]. When we refer to fast-environment, intermediate-
environment or slow-environment genotypes, we mean the winning genotypes from fast,
intermediate, respectively slow environments.
Correlations between non-social life-history traits
To determine the correlations that emerge between reproduction, survival and viability as a
function of the traits and tradeoffs included in our model, we used the winning genotypes
from each stochastic environment (Fig 2B) and we allowed initial clonal populations of identi-
cal size to complete one growth phase on identical resources and undergo the sporulation pro-
cess triggered by starvation upon resource depletion. Thus, unlike in our evolutionary setup
above where competing genotypes underwent many successive growth-starvation cycles, for
the purposes of exploring correlations between non-social traits we replicated laboratory set-
ups of one growth period followed by the subsequent starvation to allow for comparison with
existing data. Since the population partitioning between aggregators and non-aggregators fol-
lowed by the spore:stalk cell differentiation takes place in our model instantaneously upon
resource depletion, we do not need to consider the duration of the starvation phase; all quanti-
ties of interest are evaluated at the onset of starvation. We determined the total population
size, number of aggregators and number of non-aggregators for each of these genotypes and
related them to each other, to the division time c, and to the investment in aggregators versus
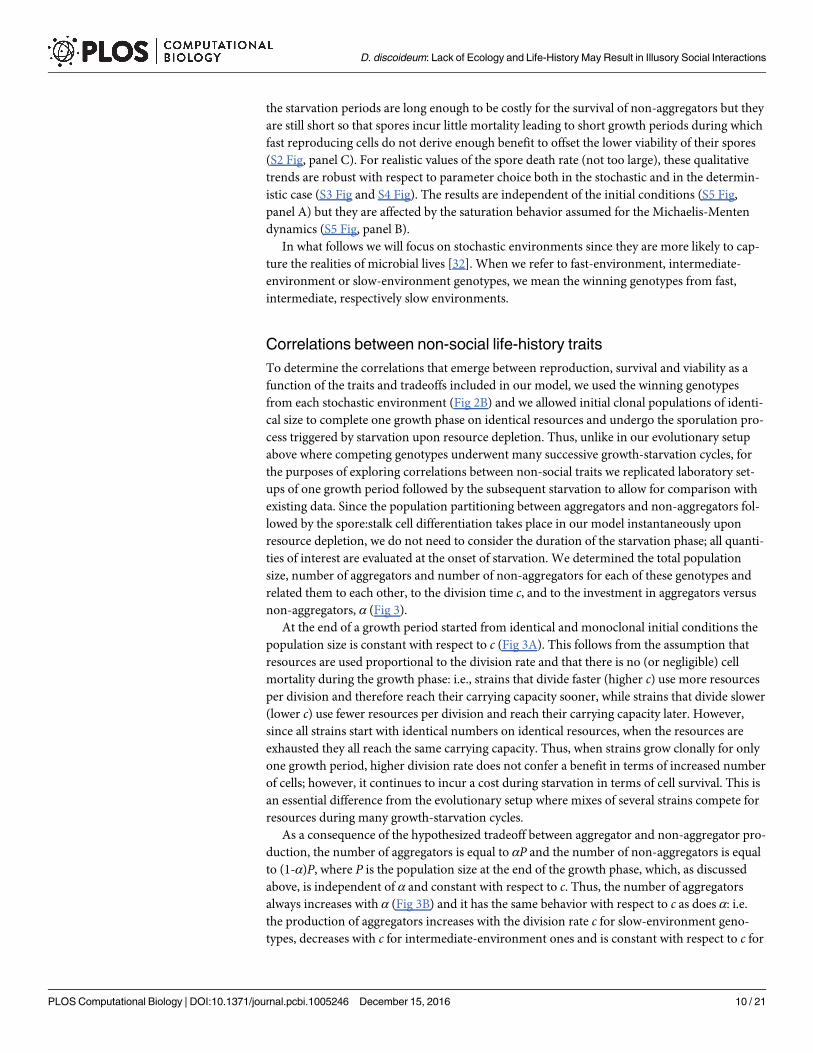
non-aggregators, α (Fig 3).
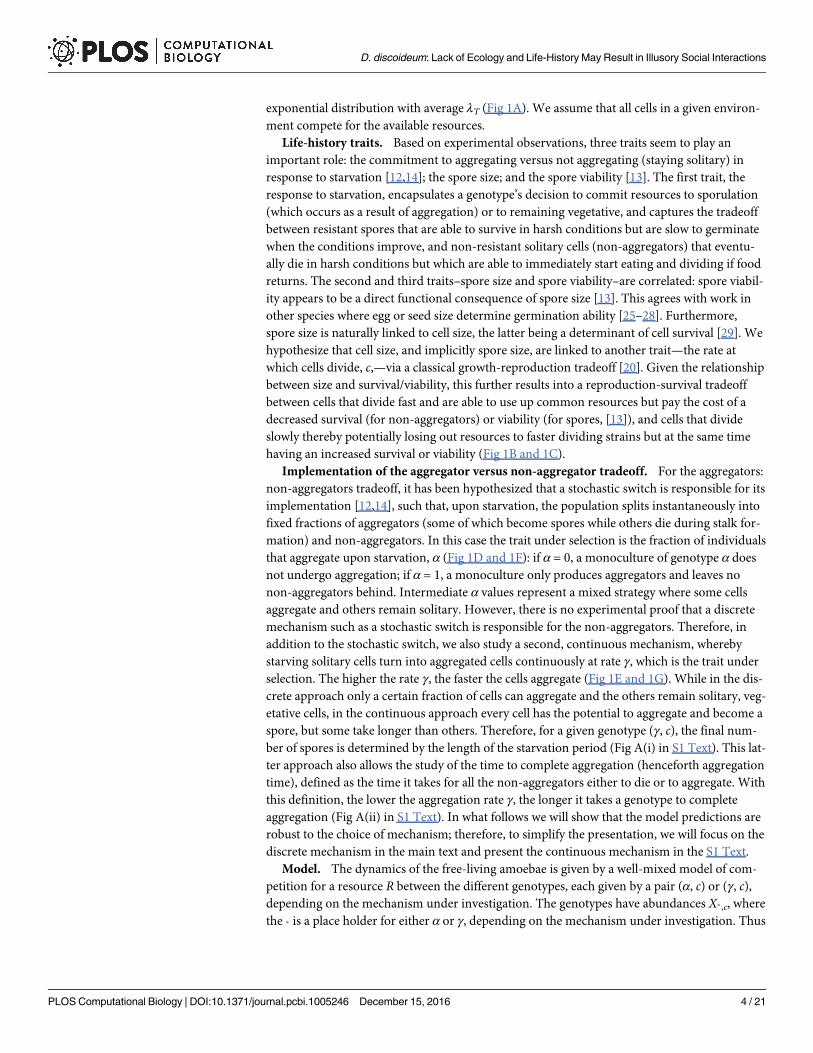
At the end of a growth period started from identical and monoclonal initial conditions the
population size is constant with respect to c (Fig 3A). This follows from the assumption that
resources are used proportional to the division rate and that there is no (or negligible) cell
mortality during the growth phase: i.e., strains that divide faster (higher c) use more resources
per division and therefore reach their carrying capacity sooner, while strains that divide slower
(lower c) use fewer resources per division and reach their carrying capacity later. However,
since all strains start with identical numbers on identical resources, when the resources are
exhausted they all reach the same carrying capacity. Thus, when strains grow clonally for only
one growth period, higher division rate does not confer a benefit in terms of increased number
of cells; however, it continues to incur a cost during starvation in terms of cell survival. This is
an essential difference from the evolutionary setup where mixes of several strains compete for
resources during many growth-starvation cycles.
As a consequence of the hypothesized tradeoff between aggregator and non-aggregator pro-
duction, the number of aggregators is equal to αP and the number of non-aggregators is equal
to (1-α)P, where P is the population size at the end of the growth phase, which, as discussed
above, is independent of α and constant with respect to c. Thus, the number of aggregators
always increases with α (Fig 3B) and it has the same behavior with respect to c as does α: i.e.
the production of aggregators increases with the division rate c for slow-environment geno-
types, decreases with c for intermediate-environment ones and is constant with respect to c for
D. discoideum: Lack of Ecology and Life-History May Result in Illusory Social Interactions
PLOS Computational Biology | DOI:10.1371/journal.pcbi.1005246 December 15, 2016 10 / 21
fast-environment genotypes (Fig 3C). Aggregators and non-aggregators are anticorrelated, so
that a high investment in aggregators comes at the cost of a low investment in non-aggregators
(Fig 3D). Non-aggregators always decrease with α (Fig 3E) and with respect to c they have the
inverse behavior of α: i.e. non-aggregator production decreases with c for fast-environment
genotypes and increases for intermediate ones (Fig 3F). Slow-environment genotypes do not
produce non-aggregators.
It is important to note that these results are sensitive to the experimental/simulation condi-
tions. All results above hold if monocultures are allowed to undergo a full growth-starvation
cycle. If, as has been the case in experimental studies [13], monocultures are grown exponen-
tially in abundant resources and then washed and abruptly starved, we find an overall positive
correlation between number of spores and division rate (S6 Fig). This yields a negative correla-
tion between number of spores and cell and spore size that agrees with experimental findings
reported in [13].
Chimeric success
In this neutral context where individuals do not interact with each other except indirectly via
their competition for resources (possible inter-strain interactions during the aggregation and
the development of the fruiting body are neglected), chimeric success is only apparent and it is
simply a measure of which genotype makes more spores in a mix. So far chimeric success has
been measured at the end of one starvation event (i.e. no mixed growth period) [10,11,13];
however, genotypes that starve together in nature must have shared at least one growth period
(i.e. the one prior to the starvation event). Therefore, in the context of our new understanding
of the interplay between life history traits we propose a new measure of chimeric success that
emphasizes the importance of both growth and starvation. Since the natural history of slime
molds is insufficient to infer how many such growth-starvation cycles two genotypes are likely
to share, we restrict our measure of chimeric success to only one growth-starvation cycle.
Fig 3. Correlations between non-social traits. A clonal growth period for each one of the 31 winning genotypes obtained
in Fig 2B is integrated to evaluate correlations between the non-social traits included in the model at the onset of starvation.
A) The total population is constant for all genotypes. Number of aggregators versus B) the aggregator to non-aggregator
ratio, α; C) division rate, c. Number of non-aggregators versus D) the number of aggregators; E) the aggregator to non-
aggregator ratio; F) the division rate.
doi:10.1371/journal.pcbi.1005246.g003
D. discoideum: Lack of Ecology and Life-History May Result in Illusory Social Interactions
PLOS Computational Biology | DOI:10.1371/journal.pcbi.1005246 December 15, 2016 11 / 21
Thus, chimeric success is not a measure of fitness, but rather a measure of spore production in
a mixed context. Finally, although chimeras made of several genotypes occur in nature occa-
sionally, experimental work has exclusively focused on pairwise mixes and therefore for ease of
comparison we will limit our analysis to this case.
The difference between our proposed measure of chimeric success and the existing one con-
sists in the setup: for the existing measure, which we will denote CSS, one starts with a 50:50 mix
of two starving genotypes and allows them to aggregate and form spores; for the new measure,
which we will denote CSX0GS, one starts an initial population of size X0 composed of a 50:50 mix of
two genotypes on an amount of food, R0, and allows the cells first to grow, then starve naturally,
and subsequently aggregate and form spores. In both setups, in keeping with previous work
[9,10,13], the chimeric success of a genotype in a pairwise mix is given by its fraction of the total
spores; the overall chimeric success of a genotype is the average over all such pairwise mixes. For
mathematical definitions and details see Methods. Although the two setups are different, the
measure we propose reduces to the existing one in the limit of high cell relative to resource den-
sity, when food is insufficient to support growth and therefore cells starve instantaneously.
The chimeric success is measured upon completion of spore formation. Thus, for the dis-
crete spore formation mechanism chimeric success is measured at the onset of starvation,
when the aggregate and the spores are formed instantaneously; for the continuous spore for-
mation mechanism, the number of spores has to be measured after a standardized starvation
time, at which all genotypes will have completed their aggregation. We therefore measure the
quantities of interest at time Tsur = 200 hours of starvation, which is the maximum amount of
time that a starving solitary cell can live. A more extensive discussion of the continuous mech-
anism is shown in S1 Text.
As already outlined above, since each environment only selects for one genotype, we
assume that, at equilibrium, genotypes that can end up in mixes are these winning genotypes,
perhaps as a result of dispersal between different environments. Therefore, for the pairwise
comparisons we used the winning genotypes from each environment obtained in Fig 2B and
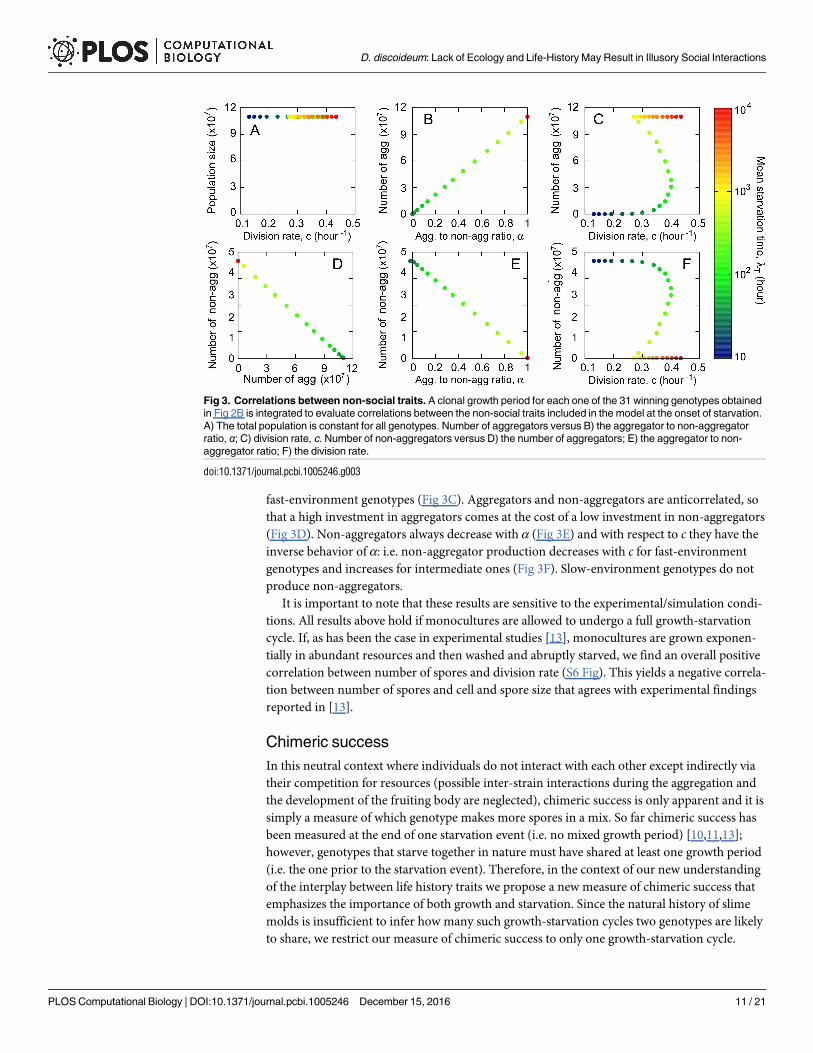
started with 50:50 mixes of low (Fig 4A and Fig 5 top row), intermediate (Fig 4B and Fig 5
Fig 4. Relative chimeric success in pairwise mixes. The winning genotypes from Fig 2B are mixed in pairs and their relative number of spores
measured after a single growth-starvation cycle. Genotypes are ordered according to the environment where they evolved in, with 0 corresponding
to the fastest-recovery environment (i.e. λT = 10 hours) and 30 corresponding to the slowest-recovery one (i.e. λT = 104 hours). To define chimeric
success, we refer to one of the genotypes in the mix as reference genotype (x-axis) and to the other as mixed (genotype). Mixes in which the
reference genotype produces more spores than its mixed partner are represented by red squares, whereas blue squares represent mixes in which
the mixed genotype produces more spores. Mixes in which both genotypes produce the same amount of spores are represented by gray squares.
A ranking of the genotypes according to their chimeric success is determined using the number of pair mixes in which a given genotype produces
more spores than its partners; this depends on the initial amoebae relative to resource density. A) Low initial cell:resource density: 103 cells and
R0 = 108 resources, B) Intermediate initial cell: resource density: 107 cells and R0 = 108 resources, C) High initial cell:resource density: 1010 cells
and R0 = 108 resources.
doi:10.1371/journal.pcbi.1005246.g004
D. discoideum: Lack of Ecology and Life-History May Result in Illusory Social Interactions
PLOS Computational Biology | DOI:10.1371/journal.pcbi.1005246 December 15, 2016 12 / 21
middle row) and high (Fig 4C and Fig 5 bottom row) initial cell densities relative to resource
magnitude. As before, in what follows, when we refer to fast-environment, intermediate-envi-
ronment or slow-environment genotypes, we mean the winning genotypes from these respec-
tive environments. We want to investigate two aspects. First, we want to explore relative
chimeric success between pairs of genotypes (Fig 4). Second, we want to determine how overall
(average) chimeric success correlates with non-social life history traits: division time c and
implicitly cell survival and spore viability, spore production, aggregators to non-aggregators
ratio and number of non-aggregators (Fig 5). Because in mixes that undergo a growth period
the production of spores and non-aggregators depends on the mixing partner, we compare the
chimeric success of a genotype not to its production of spores and non-aggregators in mono-
culture, as determined in the Correlations between non-social life-history traits section, but to
its average production of aggregators and non-aggregators, where the average is taken over all
pairwise mixes.
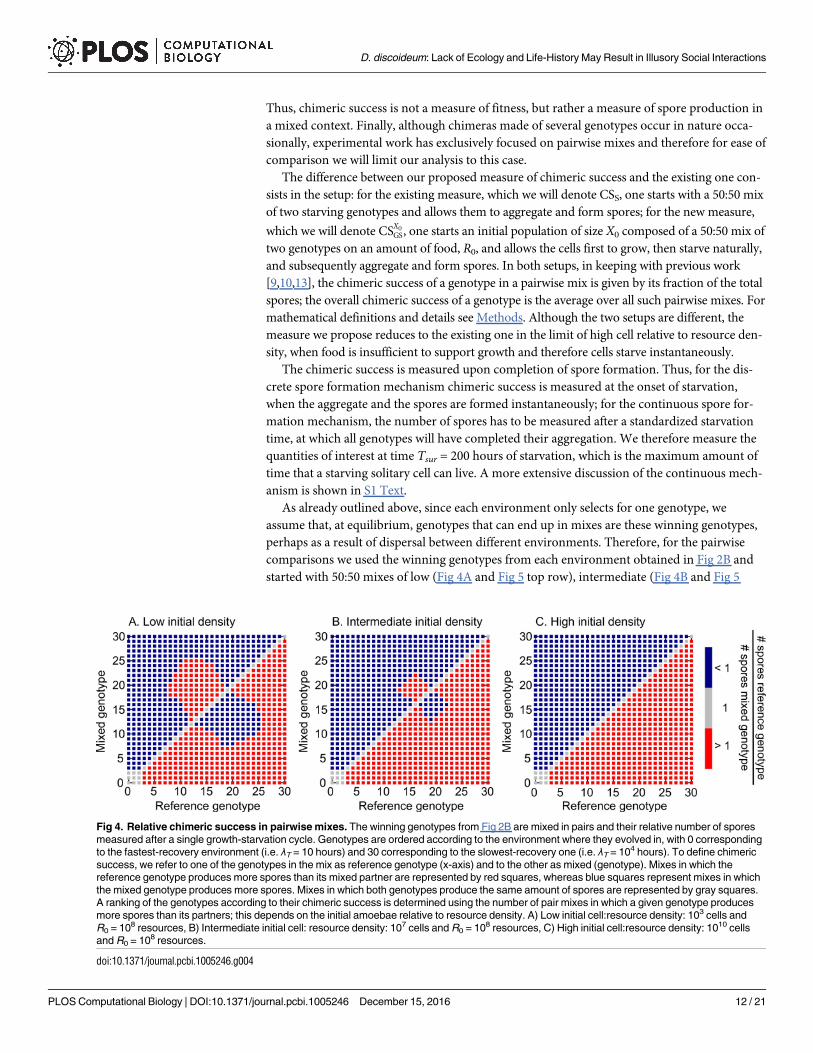
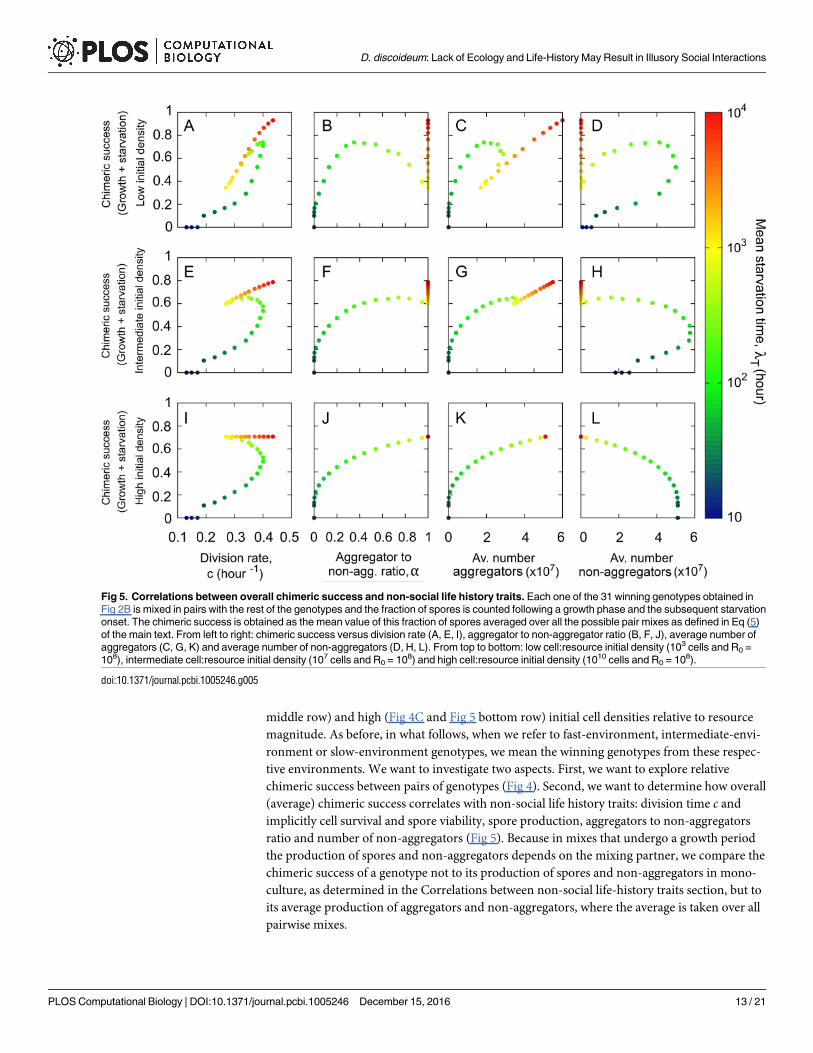
Fig 5. Correlations between overall chimeric success and non-social life history traits. Each one of the 31 winning genotypes obtained in
Fig 2B is mixed in pairs with the rest of the genotypes and the fraction of spores is counted following a growth phase and the subsequent starvation
onset. The chimeric success is obtained as the mean value of this fraction of spores averaged over all the possible pair mixes as defined in Eq (5)
of the main text. From left to right: chimeric success versus division rate (A, E, I), aggregator to non-aggregator ratio (B, F, J), average number of
aggregators (C, G, K) and average number of non-aggregators (D, H, L). From top to bottom: low cell:resource initial density (103 cells and R0 =
108), intermediate cell:resource initial density (107 cells and R0 = 108) and high cell:resource initial density (1010 cells and R0 = 108).
doi:10.1371/journal.pcbi.1005246.g005
D. discoideum: Lack of Ecology and Life-History May Result in Illusory Social Interactions
PLOS Computational Biology | DOI:10.1371/journal.pcbi.1005246 December 15, 2016 13 / 21
As explained above for clonal growth, in one growth-starvation cycle the spore-forming
mechanism does not affect the growth period. Unlike in the case of monocultures, however,
where the population size is constant with respect to c at the end of growth, in mixes, a higher
division rate c gives the benefit of faster food consumption and increased population size.
Although higher c still incurs the cost of higher mortality during starvation, if the growth
period is sufficiently long, its potential benefits can outweigh the costs. Since chimeric success
is determined upon starvation-induced fruiting body formation following one growth period,
what matters is the length of the growth period. This depends on the initial cell density relative
to the amount of available food such that the lower the initial cell density relative to the food
pulse, the longer the growth period.
Both in the pairwise and in the average scenarios we find that, at low cell-to-resource initial
densities, chimeric success is mainly determined by growth and therefore its behavior is domi-
nated by the division rate rather than the aggregator to non-aggregator ratio. As the initial cell
density relative to resource magnitude is increased, the two forces–division rate and aggregator
to non-aggregator ratio–start to equilibrate and eventually, at high cell-to-resource density
where there is only residual growth, the starvation period dominates and the chimeric success
is mostly determined by the aggregator to non-aggregator ratio.
For pairwise comparisons, regardless of the initial density we find that our strains are orga-
nized in a linear hierarchy of chimeric dominance, consistent with lab results for D. discoideum[9,10] (Fig 4). However, the ranking of the strains in the hierarchy, given by the number of
pairs (red squares in Fig 4) in which the focal strain produces more spores than its partner,
strongly depends on initial cell-to-resource densities. For high initial cell densities, the hierar-
chy ordering is dominated by the spore investment and we find that the higher the α, the
higher the chimeric success of the genotype (Fig 4C). As the initial cell density decreases and
the division rate starts to play a stronger role, intermediate-environment genotypes for which
spore investment is anticorrelated with the division rate separate into two symmetric groups
that interchange their places in the hierarchy (Fig 4A and 4B): the group with the higher α and
lower c gets displaced by the group with the lower α and higher c. The slow-environment geno-
types continue to top the hierarchy and the fast-environment genotypes continue to be at the
bottom of the hierarchy.
Moving on to the overall (average) chimeric success, we find that at low initial densities it is
positively correlated with the division rate (Fig 5A); it is positively correlated with the average
number of spores for fast- and slow-environment genotypes but it is negatively correlated with
it for intermediate-environment genotypes for which the negative effect of decreasing c is
stronger than the positive effect of increasing α (Fig 5B and 5C). Finally, the behavior of the
chimeric success with respect to the number of non-aggregators is the opposite of the behavior
with respect to spores (Fig 5D).
As the initial cell density relative to resource magnitude is increased, the division rate and
aggregator to non-aggregator ratio start to play more equal roles (Fig 5E–5H) and eventually,
at high cell density, the latter dominates. Thus, at the high density extreme where growth is
only residual and starvation dominates, chimeric success correlates positively with the aggre-
gator to non-aggregator ratio (Fig 5J), and with the number of spores (Fig 5K), and it corre-
lates negatively with the average number of non-aggregators (Fig 5L). Chimeric success still
correlates positively with division rate for fast-environment genotypes but it correlates nega-
tively with division rate for intermediate-environment genotypes where now the effect of αdominates the effect of c (Fig 5I). For slow-environment genotypes where the spore investment
α, is fixed (maximal), the correlation with division rate is slightly positive, since a higher divi-
sion rate implies a higher production of spores.
D. discoideum: Lack of Ecology and Life-History May Result in Illusory Social Interactions
PLOS Computational Biology | DOI:10.1371/journal.pcbi.1005246 December 15, 2016 14 / 21
Discussion
We built a theoretical framework, focused on D. discoideum but easily generalizable to other
sporulating microbes, to explore the effects of selection on non-social life history traits in vari-
able environments. Within this framework, we were able to qualitatively recapitulate existing
results attributed to apparent social behavior in D. discoideum in a model that assumes no
social interactions and does not consider any other interaction that may occur during the
development of the fruiting body. This highlights the importance of an extended understand-
ing of ecology and life history. In the absence of ecological knowledge–which environment
each genotype evolved in, and in the absence of life history knowledge–which life history traits
selection acts on and what relationships exist between them, one can incorrectly interpret dif-
ferences in spore investment as chimeric success and attribute the latter to complex interac-
tions (e.g. social cheating). In the neutral context, previously paradoxical findings do not even
arise.
Specifically, we assume that two genotypic traits are under selection–division rate and
aggregator to non-aggregator ratio (the latter yielding an immediate anticorrelation between
spore number and non-aggregator number). We find a negative correlation between spore
number and aggregation time (see S1 Text for details). Furthermore, depending on the simula-
tion setup (encapsulating different experimental setups), additional correlations can be identi-
fied between spore production and cell and spore size, survival and viability, such that spore
production generally comes at a cost of spore viability, consistent with [13].
In this multi-trait context, measures that attempted to quantify success upon starvation–
such as spore number and chimeric success, were revealed to be ill-defined, as we showed star-
vation and growth to be inextricably linked. We therefore proposed a new and more general
measure of chimeric success that accounts for both growth and starvation and found that
genotypes are organized in a linear hierarchy based on their pairwise chimeric success, consis-
tent with experimental results [9,10]. Furthermore, the overall chimeric success of a genotype,
measured as an average over pairwise comparisons, generally increases with the division rate
(i.e. decreases with cell/spore size) consistent with experimental results [13], it increases with
the average number of spores produced and with the aggregator to non-aggregator ratio, and
it decreases with aggregation time (see S1 Text for details). Finally, we found that the relation-
ship between chimeric success and investment in non-aggregators depends on the experimen-
tal conditions. Our results are robust with respect to the choice of mechanism underlying the
non-social traits (e.g. stochastic switching versus phenotypic variation).
Despite the multiple life history traits and associated tradeoffs, however, we found that each
environment, whether deterministic or stochastic, selects for only one winning genotype.
Coexistence can be achieved in the current model if we incorporate spatial heterogeneity and
weak-to-moderate dispersal between different environments (consistent with [12]), or tempo-
ral heterogeneity [15]. In the absence of any spatial or temporal heterogeneity, multiple geno-
type coexistence is possible only when strains balance their tradeoffs so that they have identical
fitness, as suggested in [13]. Such balancing however reduces the scenarios where coexistence
may occur and yields them ungeneric. This is in agreement with classic works in community
ecology that show that in the absence of frequency-dependent mechanisms tradeoffs alone do
not generally result in coexistence [33].
Several future directions arise. First, our results constitute general testable predictions
(Table 1) and emphasize the importance of standardized measures and experimental proto-
cols, ideally chosen to most closely approximate natural conditions. Future work needs to
build on existing work in life-history theory that highlights that the reproductive output of just
one life-stage is not necessarily an appropriate fitness measure [34–36], to propose a new
D. discoideum: Lack of Ecology and Life-History May Result in Illusory Social Interactions
PLOS Computational Biology | DOI:10.1371/journal.pcbi.1005246 December 15, 2016 15 / 21
measure of D. discoideum fitness, that accounts for the way natural selection acts on the life his-
tories of individuals and their ancestors, in variable environments. Recent work has proposed
a very elegant framework in bacteria that could be adapted for other microbes [37]. Second,
although we were able to qualitatively capture existing results in a well-mixed, neutral frame-
work, this dismisses neither the importance of spatial structure, which is likely to influence the
dynamics at least quantitatively, nor the possibility of social interactions in general. While the
linear hierarchies in D. discoideum are well aligned with the neutral hypothesis, other slime
mold species have exhibited short dominance loops [11], possibly indicative of small subsets of
interacting genotypes. Even in D. discoideum, there exists at least one extreme lab mutant that
has been shown to interact in chimeras, a social parasite that is unable to form its own stalk
but uses other genotypes’ stalks to support its spores [38]. Although such a mutant has not
been found in nature, it has been shown to be very destructive in lab experiments [38] and
therefore its effects are worth re-investigating using this new multi-trait understanding of fit-
ness. One hypothesis is that the non-aggregators can act as buffers against the destructive
effects of a parasite that can only exploit the social aspects of the behavior. This is consistent
with existing results from the theory of cooperation and sociality showing that individuals that
do not participate in the social dynamics are of primary importance for the evolution of social
behavior [39,40]. Third, the life cycle of D. discoideum may involve many other tradeoffs to be
considered in the future, such as allocating more cells in the spore body at the expense of
reducing the dispersal ability by creating a shorter stalk. Fourth, for simplicity, we have encap-
sulated here all the ecological variability in the starvation times; however, environmental het-
erogeneity may also come into play in other ways, e.g. in the way resources reappear in the
system (progressively instead of instantaneously, or seasonally instead of throughout the year
[15]) or in the amount of nutrients available at the beginning of each growth cycle, which here
we have taken to be constant as a first approach. This could introduce additional tradeoffs aris-
ing from strains showing different feeding behavior [41]. Finally, our model does not include
mutation, meiotic recombination or horizontal gene transfer, all of which can play an impor-
tant role in producing diversity that could lead to coexistence, at least temporarily. Although
mutation rates are very low in D. discoideum [42], meiotic recombination appears to occur at a
sufficiently high rate that it could potentially influence population composition [43].
Our results show broadly that in fluctuating environments multicellularity and sociality are
just part of a set of risk-management strategies. Although our work was motivated by D. discoi-deum in particular and by microbes in general, these results can be extended to other species
where similar ecologically-induced tradeoffs between aggregation time, size and social behav-
ior have been identified [44,45].
Methods
Implementation of the evolutionary simulations
To determine the winning genotype in each environment, we performed numerical simula-
tions of several growth-starvation cycles in environments defined by their starvation time (for
deterministic ones) or by their average starvation time (for stochastic ones). For the latter, star-
vation times were a stochastic variable exponentially distributed. The spectrum of genotypes
was discretized, using 44772 genotypes for stochastic environments (1092 values of α and 41
values of c) and 4141 for deterministic environments (101 values of α and 41 values of c). The
values of c range between c = 0.05 and c = 0.45 with a sampling of 10−2. In stochastic environ-
ments, the values of α were chosen with a sampling of 10−4 between α = 0 and α = 0.1 and with
a sampling of 10−2 between α = 0.1 and α = 1. This irregular sampling was chosen to avoid
abrupt jumps in the winning c in environments that select for strategies with a small investment
D. discoideum: Lack of Ecology and Life-History May Result in Illusory Social Interactions
PLOS Computational Biology | DOI:10.1371/journal.pcbi.1005246 December 15, 2016 16 / 21
in spores. In deterministic environments, however, the sampling in α was homogeneous, with a
sampling step of 0.01 between α = 0 and α = 1.
In deterministic environments a single run was used (randomness introduced by the initial
condition was tested and shown to be irrelevant in determining the stationary state) while in
stochastic environments averages were taken over 20 independent realizations. In both cases
simulations were run until t = 108 hours and the winning genotype defined as the most abun-
dant at that time. This was done for computational feasibility, longer simulations shown that
in the long-term only one genotype survives. In stochastic environments the variance of this
measurement is very low and the mean value coincides with the result of each single run. S1
Fig and S2 Fig show the short time evolution of some genotypes in deterministic and stochastic
environments.
Initial abundances of each genotype were independently drawn from a standard log-normal
distribution and subsequently normalized so that the entire population contained 108 cells. An
initial resource pulse of magnitude 108 was added and the trajectories governed by Eq (1) was
integrated using a Runge-Kutta numerical method until resources are exhausted (R reaches a
zero value). The depletion of the resources triggers the onset of starvation and the population
instantaneously splits between aggregators and non-aggregators and aggregators instan-
taneously differentiate between spores and stalk cells. A fraction α of cells aggregate and the
remaining 1 - α remains as solitary (non-aggregated) cells. Finally, the population of aggrega-
tors is multiplied by a factor s = 0.8 that accounts for the spore:stalk cell differentiation.
The starvation onset is followed by a starvation phase in which both populations decline due
to the death of spores and non-aggregated cells. To evaluate the final population size of both
classes of cells at the end of the starvation phase, due to the fact that Eq (3) has an analytical
solution, the functions are evaluated at t = T (if the environment is stochastic, this time is previ-
ously sorted from an exponential distribution), which significantly speeds up the simulations.
Correlations between non-social traits
Simulations are stopped at the starvation onset, when resources have been exhausted and the
population splits between aggregators and non-aggregators but before entering in the starva-
tion phase in which cells and spores die.
Chimeric success
Genotypes underwent one growth and after resources consumption, the populations split
between a fraction α of aggregators and (1-α) of non-aggregators. Let Xspa;c be the amount of
spores produced by genotype (α, c), which is obtained by multiplying the number of aggrega-
tors by a factor s = 0.8 to account for the stalk:spore cell differentiation. The pairwise chimeric
success of genotype (α, c) against genotype (α, c0) is given by Xspa;c=ðX
spa;c þ Xsp
a0 ;c0 Þ and the average
chimeric success of genotype (α, c) is given by:
CS a; cð Þ ¼1
Nst � 1
Pa0 ;c0
Xspa;c
Xspa;c þ Xsp
a0 ;c0ð5Þ
where the sum runs over all the possible values of α and c except for α = α0 and c = c0 simulta-
neously and Nst is the total number of strains considered in the average.
Linear hierarchies of chimeric dominance
To construct the linear hierarchies (Fig 4), the 31 winning genotypes obtained from Fig 2B are
ordered according to the environment they evolved in. Label 0 corresponds to the winning
D. discoideum: Lack of Ecology and Life-History May Result in Illusory Social Interactions
PLOS Computational Biology | DOI:10.1371/journal.pcbi.1005246 December 15, 2016 17 / 21
genotype from the environment with λT = 10 hour and label 30 to the winning genotype that
evolved in the environment with λT = 104 hour. All strains are mixed in pairs, they undergo a
growth-starvation cycle, and pairwise chimeric success is measured. To define a dominance /
subordination relationship between the genotypes we set one of the genotypes in the mix as
the reference genotype and its partner as the mixed genotype. If the reference genotype makes
more spores than the mixed genotype, then it has a higher chimeric success, which is indicated
by a red square in Fig 4. If the reference genotype makes fewer spores it will have a lower chi-
meric success (blue squares in Fig 4), and both genotypes will be equally successful if the num-
ber of spores is the same (gray squares in Fig 4).
Supporting Information
S1 Text. Continuous mechanism. Detailed description and analysis of the continuous aggre-
gation mechanism.
(PDF)
S1 Table. Description of the model parameters and their values. The lower part of the table
gives the parameters that are allowed to evolve.
(DOCX)
S1 Fig. Short-time evolution of populations in deterministic environments. A) Winning
genotype in each environment, given by its investment in spores α (blue squares), and division
rate c (red circles). Three environments are chosen and marked with a green circle, two of
them select for α = 0 strategies and one for α = 1. B) Fast-recovery environment (T = 10 hour):
fast reproducing strains have an advantage in the short run, but are in the long run outcom-
peted by the genotype with the lowest division rate. C) Intermediate-recovery environments
(T = 158 hour): fast-reproducing strains are able to maintain their competitive advantage
throughout. D) Slow-recovery environments (T = 199 hour): selection for genotypes with slow
cell division.
(TIF)
S2 Fig. Temporal evolution of populations in stochastic environments. A) Winning geno-
type in each environment, given by its investment in spores, α (blue squares), and division
rate, c (red circles). Three environments are chosen and marked with a green circle. B,C) For
intermediate environments (λT = 100 hour and λT = 358 hour respectively), populations show
high amplitude fluctuations since the variation in the starvation times favors in each cycle a
different genotype. D) For slow environments (λT = 1000 hour), the amplitude of the fluctua-
tions in the population size decreases since most of the starvation times favor genotypes with
α = 1.
(TIF)
S3 Fig. Sensitivity analysis of the winning genotype for the choice of survival cost function,
β. Increasing the survival probability of bigger cells over time (β = 5.1 − 8c) reduces selection
for fast reproducing strains. The cost of small spores in terms of germination survival was not
changed, so fast spore-selecting environments select for the same division rate as in Fig 2. Sim-
ulations are initialized with a number of genotypes that compete through several growth-star-
vation cycles. For computational feasibility the winner is determined as the most abundant
genotype at t = 108, when a few genotype still survive. Larger realizations show that only the
winner is able to survive in the stationary state. A) Deterministic environments. B) Stochastic
environments.
(TIF)
D. discoideum: Lack of Ecology and Life-History May Result in Illusory Social Interactions
PLOS Computational Biology | DOI:10.1371/journal.pcbi.1005246 December 15, 2016 18 / 21
S4 Fig. Sensitivity analysis for different choices of survival cost function β in deterministic
environments. Modifying the tradeoff between cell survival and cell size leads to selection for
different division rates in the α = 0 environments. A, B, C) The top row shows three families of
curves where the survival advantage of bigger cells against the smaller ones increases from left
to right. A) β = 3.1 − 4c, B) β = 5.5 − 10c, C) β = 19 − 40c. D) Selected division rate as a function
of the starvation time in deterministic environments.
(TIF)
S5 Fig. Sensitivity analysis for the initial condition and the Michaelis-Menten rates. A) The
initial population size does not modify the winning genotype, only the transient dynamics.
Highly diluted initial populations initially favor genotypes with a high division rate. However,
once the total population reaches the carrying capacity, genotypes with a faster division rate
start declining and eventually go to extinction. On the contrary, if the initial population is
above the carrying capacity the total number of cells decreases at short times. Bigger cells take
advantage of their longer survival, but as the population reaches the carrying capacity geno-
types with a higher division rate start growing and finally outcompete the slower strains. Initial
populations of each genotype were drawn from a log-normal distribution and the total popula-
tion subsequently normalized to 103, 107, 108 and 1010 cells. The size of the food pulse was kept
constant, so increasing the population size increases the competition for resources. Data points
are not shown for clarity, sampling in the mean starvation time as in panel B. B) Increasing the
saturation constant R1/2 anticipates selection for completely aggregating strategies (α = 1) since
the growth term decreases. Environments with a given mean starvation time become harsher
and it is more beneficial to make more spores and reproduce faster. The initial population was
fixed at 108 cells and the amplitude of each food pulse at 108. Squares indicate division rate and
circles aggregator to non-aggregator ratio.
(TIF)
S6 Fig. Tradeoff between number of spores and cell and spore size under different simula-
tion settings. When the strains are plated on abundant resources and grow exponentially dur-
ing a fixed time, followed by sudden starvation, A) the population size and B) the number of
spores correlate positively with the division rate. Logarithmic scale used for the vertical axis in
both the panels.
(TIF)
Acknowledgments
We thank the IFISC (CSIC-UIB) computing lab for technical support and the use of their
computational resources; and A. Herre for helpful discussions.
Author Contributions
Conceptualization: RMG CET.
Methodology: RMG CET.
Software: RMG.
Writing – original draft: CET.
Writing – review & editing: RMG CET.
D. discoideum: Lack of Ecology and Life-History May Result in Illusory Social Interactions
PLOS Computational Biology | DOI:10.1371/journal.pcbi.1005246 December 15, 2016 19 / 21
References1. Bonner JT. The Social Amoebae: The Biology of Cellular Slime Molds. Princeton University Press;
2009.
2. Bonner JT. Evolutionary strategies and developmental constraints in the cellular slime molds. Am Nat.
1982; 119(4): 530–552.
3. Strassmann JE, Queller DC. Evolution of cooperation and control of cheating in a social microbe. Pro-
ceedings of the National Academy of Sciences. 2011; 108: 10855–10862.
4. Raper KB. The Dictyostelids. Princeton University Press; 1984.
5. Fortunato A, Strassmann JE, Santorelli L, Queller DC. Co-occurrence in nature of different clones of the
social amoeba, Dictyostelium discoideum. Mol Ecol. 2003; 12: 1031–1038. PMID: 12753221
6. Strassmann JE, Zhu Y, Queller DC. Altruism and social cheating in the social amoeba Dictyostelium
discoideum. Nature. 2000; 408: 965–967. doi: 10.1038/35050087 PMID: 11140681
7. Gilbert OM, Foster KR, Mehdiabadi NJ, Strassmann JE, Queller DC. High relatedness maintains multi-
cellular cooperation in a social amoeba by controlling cheater mutants. Proc Natl Acad Sci USA. 2007;
104: 8913–8917. doi: 10.1073/pnas.0702723104 PMID: 17496139
8. Sathe S, Kaushik S, Lalremruata A, Aggarwal RK, Cavender JC, Nanjundiah V. Genetic Heterogeneity
in Wild Isolates of Cellular Slime Mold Social Groups. Microb Ecol. 2010; 60: 137–148. doi: 10.1007/
s00248-010-9635-4 PMID: 20179919
9. Fortunato A, Queller DC, Strassmann JE. A linear dominance hierarchy among clones in chimeras of
the social amoeba Dictyostelium discoideum. Journal of Evolutionary Biology. 2003; 16: 438–445.
PMID: 14635843
10. Buttery NJ, Rozen DE, Wolf JB, Thompson CRL. Quantification of Social Behavior in D. discoideum
Reveals Complex Fixed and Facultative Strategies. Current Biology. 2009; 19: 1373–1377. doi: 10.
1016/j.cub.2009.06.058 PMID: 19631539
11. Sathe S, Khetan N, Nanjundiah V. Interspecies and intraspecies interactions in social amoebae. Journal
of Evolutionary Biology. 2014; 27: 349–362. doi: 10.1111/jeb.12298 PMID: 24341405
12. Tarnita CE, Washburne A, Martinez-Garcia R, Sgro AE, Levin SA. Fitness tradeoffs between spores
and nonaggregating cells can explain the coexistence of diverse genotypes in cellular slime molds. Pro-
ceedings of the National Academy of Sciences. 2015; 112: 2776–2781.
13. Wolf JB, Howie JA, Parkinson K, Gruenheit N, Melo D, Rozen D, et al. Fitness Trade-offs Result in the
Illusion of Social Success. Curr Biol. 2015; 25: 1086–1090. doi: 10.1016/j.cub.2015.02.061 PMID:
25819562
14. Dubravcic D, van Baalen M, Nizak C. An evolutionarily significant unicellular strategy in response to
starvation stress in Dictyostelium social amoebae. F1000Res. 2014; 3: 133. doi: 10.12688/
f1000research.4218.2 PMID: 25309731
15. Martinez-Garcia R, Tarnita CE. Seasonality can induce coexistence of multiple bet-hedging strategies
in Dictyostelium discoideum via storage effect. arXiv preprint arXiv:1606.05912, 2016.
16. O’Brien S, Brockhurst MA. Social Evolution: Slimy Cheats Pay a Price. Curr Biol. 2015; 25: R378–
R381. doi: 10.1016/j.cub.2015.03.018 PMID: 25942554
17. Rainey PB. Precarious development: The uncertain social life of cellular slime molds. Proceedings of
the National Academy of Sciences. 2015; 112(9), 2639–2640.
18. Zhang X-X, Rainey PB. Exploring the sociobiology of pyoverdin-producing Pseudomonas. Evolution.
2013; 67: 3161–3174. doi: 10.1111/evo.12183 PMID: 24152000
19. Redfield RJ. Is quorum sensing a side effect of diffusion sensing? Trends Microbiol. 2002; 10: 365–370.
PMID: 12160634
20. Driscoll WW, Pepper JW, Pierson LS III, Pierson EA. Spontaneous Gac Mutants of Pseudomonas bio-
logical control strains: cheaters or mutualists? Applied and Environmental Microbiology. 2011; 77:
7227–7235. doi: 10.1128/AEM.00679-11 PMID: 21873476
21. Stearns SC. The Evolution of Life Histories. Oxford University Press; 1992.
22. Kussell E, Kishony R, Balaban NQ, Leibler S. Bacterial persistence: a model of survival in changing
environments. Genetics. 2005; 169: 1807–1814. doi: 10.1534/genetics.104.035352 PMID: 15687275
23. Amarasekare P. Competitive coexistence in spatially structured environments: a synthesis. Ecology
Letters. 2003; 6: 1109–1122.
24. Agrawal AA, Conner JK, Rasmann S. Tradeoffs and negative correlations in evolutionary ecology. Evo-
lution since Darwin: the first, 2010; 150, 243–268.
25. Gomez JM. Bigger is not always better: conflicting selective pressures on seed size in Quercus ilex.
Evolution. 2004; 58: 71–80. PMID: 15058720
D. discoideum: Lack of Ecology and Life-History May Result in Illusory Social Interactions
PLOS Computational Biology | DOI:10.1371/journal.pcbi.1005246 December 15, 2016 20 / 21
26. Singh AR, Makne VG. Correlation studies on seed viability and seedling vigour in relation to seed size in
sorghum (Sorghum bicolor). Seed science and technology; 1985.
27. Armstrong DP, Westoby M. Seedlings from large seeds tolerated defoliation better: a test using phylo-
geneticaly independent contrasts. Ecology.1993; 74(4), 1092–1100.
28. Jeuthe H, Brannas E, Nilsson J. Effects of egg size, maternal age and temperature on egg, viability of
farmed Arctic charr. Aquaculture. 2013; 408, 70–77.
29. Dubravcic D. Quantitative evolutionary analysis of the life cycle of social amoebae. Universite Rene
Descartes-Paris V. 2013.
30. Otto GP, Wu MY, Kazgan N, Anderson OR, Kessin RH. Dictyostelium Macroautophagy Mutants Vary in
the Severity of Their Developmental Defects. Journal of Biological Chemistry. 2004; 279: 15621–
15629. doi: 10.1074/jbc.M311139200 PMID: 14736886
31. Kussell E, Leibler S. Phenotypic diversity, population growth, and information in fluctuating environ-
ments. Science. 2005; 309: 2075–2078. doi: 10.1126/science.1114383 PMID: 16123265
32. Kussell E. Evolution in microbes. Annual Review of Biophysics. 2013; 42: 493–513. doi: 10.1146/
annurev-biophys-083012-130320 PMID: 23654305
33. Tilman D. Constraints and tradeoffs: toward a predictive theory of competition and succession. Oikos.
1990; 58(1), 3–15.
34. Caswell H. Matrix population models: construction, analysis and interpretation. Second edition. Sun-
derland, MA: Sinauer; 2001.
35. Charlesworth B. Evolution in age-structured populations. Cambridge, UK: Cambridge Univ Press;
1994.
36. Tuljapurkar S. Delayed reproduction and fitness in variable environments. Proc Natl Acad Sci USA.
1990; 87: 1139–1143. PMID: 2300574
37. Lambert G, Kussell E. Quantifying Selective Pressures Driving Bacterial Evolution Using Lineage Anal-
ysis. Phys Rev X. 2015; 5: 011016. doi: 10.1103/PhysRevX.5.011016 PMID: 26213639
38. Kuzdzal-Fick JJ, Fox SA, Strassmann JE, Queller DC. High Relatedness Is Necessary and Sufficient to
Maintain Multicellularity in Dictyostelium. Science. 2011; 334: 1548–1551. doi: 10.1126/science.
1213272 PMID: 22174251
39. Hauert C, De Monte S, Hofbauer J, Sigmund K. Volunteering as red queen mechanism for cooperation
in public goods games. Science. 2002; 296(5570), 1129–1132. doi: 10.1126/science.1070582 PMID:
12004134
40. Garcia T, Doulcier G, De Monte S. The evolution of adhesiveness as a social adaptation. eLife. 2015;4
e08595.
41. Horn EG. Food competition among the cellular slime molds (Acrasieae). Ecology. 1971;, 52(3), 475–
484.
42. Saxer G, Havlak P, Fox SA, Quance MA, Gupta S, Fofanov Y, et al. Whole Genome Sequencing of
Mutation Accumulation Lines Reveals a Low Mutation Rate in the Social Amoeba Dictyostelium discoi-
deum. PLoS ONE. 2012; 7: e46759. doi: 10.1371/journal.pone.0046759 PMID: 23056439
43. Flowers JM, Li SI, Stathos A, Saxer G, Ostrowski EA, Queller DC, et al. Variation, Sex, and Social
Cooperation: Molecular Population Genetics of the Social Amoeba Dictyostelium discoideum. PLoS
Genet. 2010; 6: e1001013. doi: 10.1371/journal.pgen.1001013 PMID: 20617172
44. Kocher SD, Pellissier L, Veller C, Purcell J, Nowak MA, Chapuisat M, et al. Transitions in social com-
plexity along elevational gradients reveal a combined impact of season length and development time on
social evolution. Proceedings of the Royal Society B: Biological Sciences. 2014; 281: 20140627–
20140627 doi: 10.1098/rspb.2014.0627 PMID: 24870045
45. Rubenstein DR. Spatiotemporal environmental variation, risk aversion, and the evolution of cooperative
breeding as a bet-hedging strategy. Proceedings of the National Academy of Sciences. 2011; 108
Suppl 2: 10816–10822.
D. discoideum: Lack of Ecology and Life-History May Result in Illusory Social Interactions
PLOS Computational Biology | DOI:10.1371/journal.pcbi.1005246 December 15, 2016 21 / 21