Embed Size (px)
Citation preview
1
LAKE ASSESSMENT REPORT FOR EGYPT LAKE IN HILLSBOROUGH COUNTY, FLORIDA
Date Assessed: June 26, 2008 Assessed by: Monetta Wilson, Grant Harley and David Eilers Reviewed by: Jim Griffin, Ph.D.
INTRODUCTION This assessment was conducted to update existing physical and ecological data for Egypt Lake on the Hillsborough County Watershed Atlas (http://www.hillsborough.wateratlas.usf.edu/). The project is a collaborative effort between the University of South Florida’s Center for Community Design and Research and Hillsborough County Stormwater Management Section. The project is funded by Hillsborough County and the Southwest Florida Water Management District’s Northwest Hillsborough, Hillsborough River and Alafia River Basin Boards. The project has, as its primary goal, the rapid assessing of up to 150 lakes in Hillsborough County during a five year period. The product of these investigations will provide the County, lake property owners and the general public a better understanding of the general health of Hillsborough County lakes, in terms of shoreline development, water quality, lake morphology (bottom contour, volume, area etc.) and the plant biomass and species diversity. These data are intended to assist the County and its citizens to better manage lakes and lake centered watersheds. Figure 1. Photo of Egypt Lake, taken June 26, 2008
2
The first section of the report provides the results of the overall morphological assessment of the lake. Primary data products include: a contour (bathymetric) map of the lake, area, volume and depth statistics, and the water level at the time of assessment. These data are useful for evaluating trends and for developing management actions such as plant management where depth and lake volume are needed. The second section provides the results of the vegetation assessment conducted on the lake. These results can be used to better understand and manage vegetation in the lake. A list is provided with the different plant species found at various sites around the lake. Potentially invasive, exotic (non-native) species are identified in a plant list and the percent of exotics is presented in a summary table. Watershed values provide a means of reference. The third section provides the results of the water quality sampling of the lake. Both field data and laboratory data are presented. The trophic state index (TSI)
i is used to develop a general
lake health statement, which is calculated for both the water column with vegetation and the water column if vegetation were removed. These data are derived from the water chemistry and vegetative submerged biomass assessments and are useful in understanding the results of certain lake vegetation management practices. The intent of this assessment is to provide a starting point from which to track changes in the lake, and where previous comprehensive assessment data is available, to track changes in the lake’s general health. These data can provide the information needed to determine changes and to monitor trends in physical condition and ecological health of the lake.
Section 1: Lake Morphology
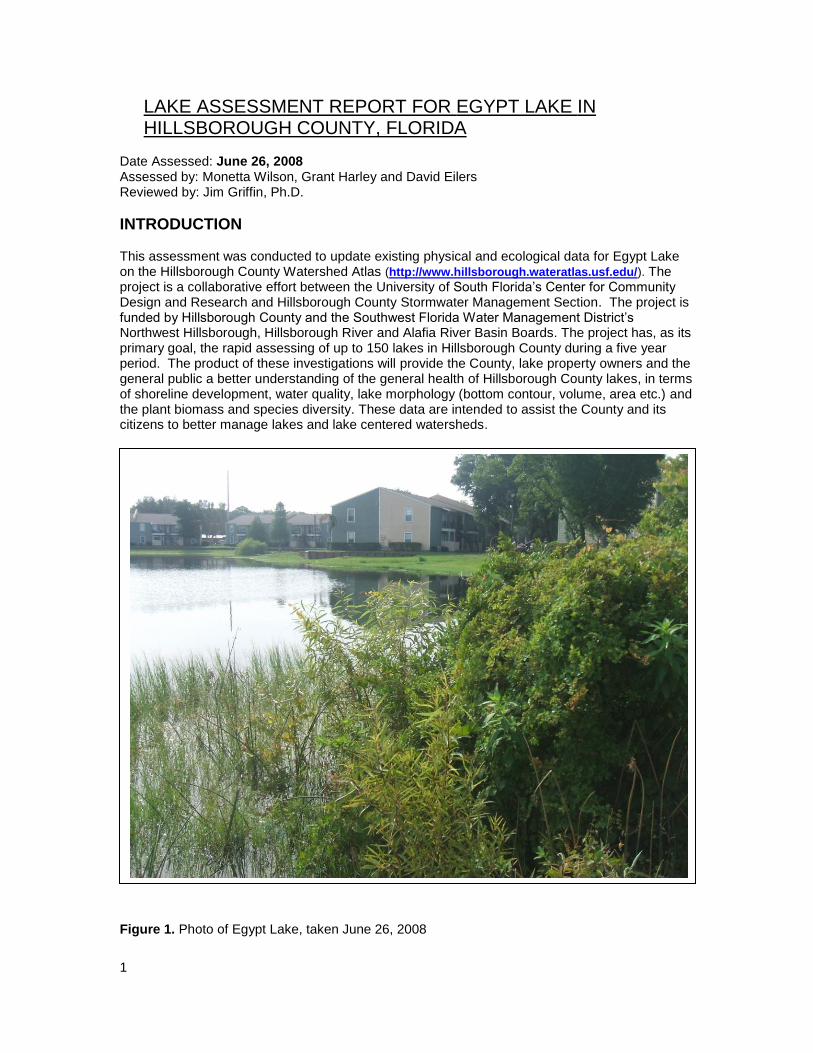
Bathymetric Mapii. Table 1 provides the lake’s morphologic parameters in various units. The
bottom of the lake was mapped using a Lowrance LCX 28C HD Wide Area Augmentation System (WAAS)
iii enabled Global Positioning System (GPS) with fathometer (bottom sounder) to
determine the boat’s position, and bottom depth in a single measurement. The result is an estimate of the lake’s area, mean and maximum depths, and volume and the creation of a bottom contour map (Figure 2). Besides pointing out the deeper fishing holes in the lake, the morphologic data derived from this part of the assessment can be valuable to overall management of the lake vegetation as well as providing flood storage data for flood models. Table 1. Lake Morphologic Data (Area, Depth and Volume).
Parameter Feet Meters Acres Acre-ft Gallons
Surface Area (sq) 2,530,123.71 235,149.70 58.08
Mean Depth 14.50 4.42
Maximum Depth 32.07 9.77
Volume (cubic) 34,774,325.97 984,808.91 798.31 260,131,825.6
Gauge (relative) 35.84 10.92

3
Figure 1. Contour map for Egypt Lake. The mapping technique used in 2008 employs a standard DGPS for horizontal position and a fathometer for depth.
4
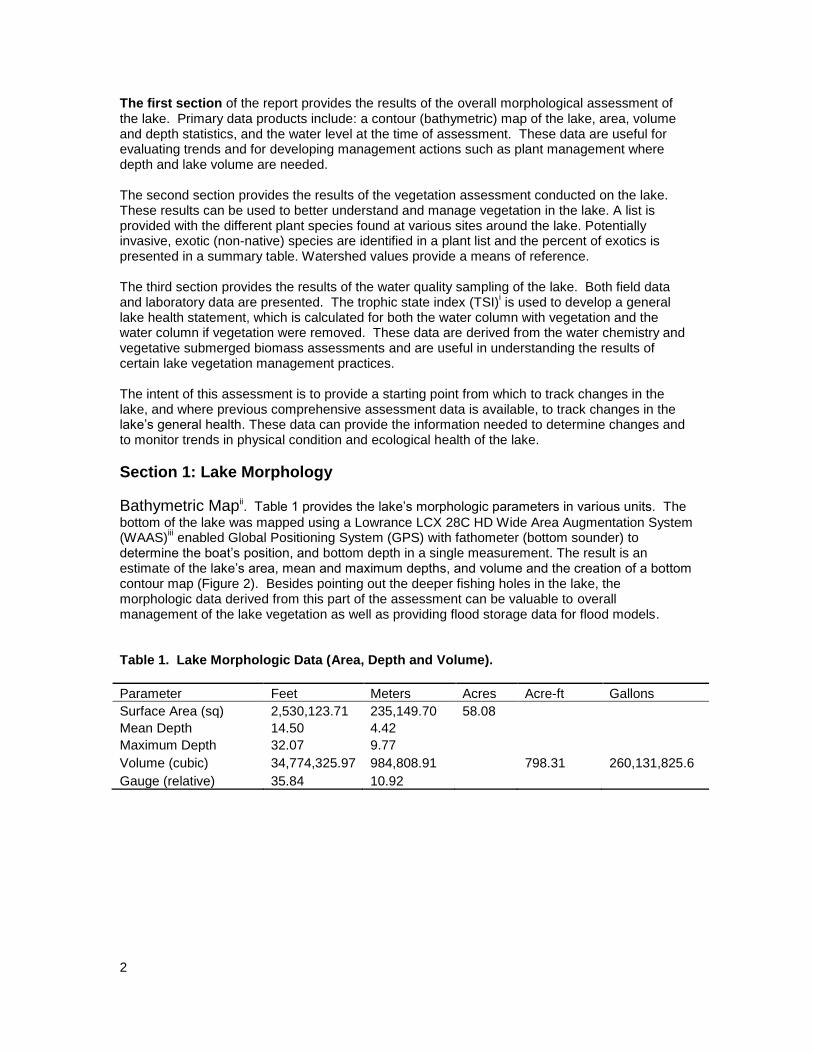
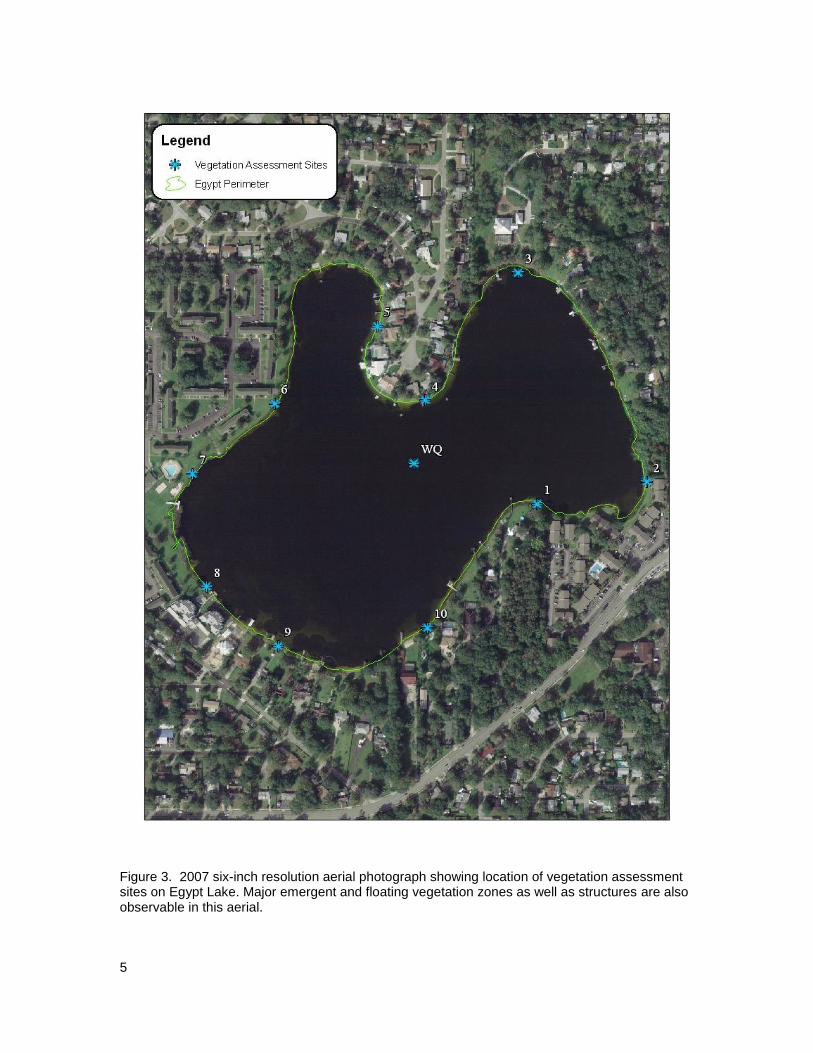
Section 2: Lake Ecology (vegetation) The lake’s apparent vegetative cover and shoreline detail are evaluated using the latest lake aerial photograph as shown in Figure 3 and by use of WAAS enabled GPS. Submerged vegetation is determined from the analysis of bottom returns from the Lowrance 28c HD combined GPS/fathometer described earlier. As depicted in Figure 3, ten vegetation assessment sites were chosen for intensive sampling based on the Lake Assessment Protocol (copy available on request) for a lake of this size. The site positions are set using GPS and then loaded into a GIS mapping program (ArcGIS) for display. Each site is sampled in the three primary vegetative zones (emergent, submerged and floating).
iv The latest high resolution aerial photos are used to
provide shore details (docks, structures, vegetation zones) and to calculate the extent of surface vegetation coverage. The primary indices of submerged vegetation cover and biomass for the lake, percent area coverage (PAC) and percent volume infestation (PVI), are determined by transiting the lake by boat and employing a fathometer to collect “hard and soft return” data. These data are later analyzed for presence and absence of vegetation and to determine the height of vegetation if present. The PAC is determined from the presence and absence analysis of 100 sites in the lake and the PVI is determined by measuring the difference between hard returns (lake bottom) and soft returns (top of vegetation) for sites (within the 100 analyzed sites) where plants are determined present (Figure 6). The data collected during the site vegetation sampling include vegetation type, exotic vegetation, predominant plant species and submerged vegetation biomass. The total number of species from all sites is used to approximate the total diversity of aquatic plants and the percent of invasive-exotic plants on the lake (Table 2). The Watershed value in Table 2 only includes lakes sampled during the lake assessment project begun in May of 2006. These data will change as additional lakes are sampled. Tables 3 through 5 detail the results from the 2008 aquatic plant assessment for the lake. These data are determined from the 10 sites used for intensive vegetation surveys. The tables are divided into Floating Leaf, Emergent and Submerged plants and contain the plant code, species, common name and presence (indicated by a 1) or absence (indicated by a blank space) of species and the calculated percent occurrence (number sites species is found/number of sites) and type of plant (Native, Non-Native, Invasive, Pest). In the “Type” category, the term invasive indicates the plant is commonly considered invasive in this region of Florida and the term “pest” indicates that the plant has a greater than 55% occurrence in the lake and is also considered a problem plant for this region of Florida, or in a non-native invasive that is or has the potential to be a problem plant in the lake and has at least 40% occurrence. These two terms are somewhat subjective; however, they are provided to give lake property owners some guidance in the management of plants on their property. Please remember that to remove or control plants in a wetland (lake shoreline) in Hillsborough County the property owner must secure an Application To Perform Miscellaneous Activities In Wetlands (http://www.epchc.org/forms_documents.htm) permit from the Environmental Protection Commission of Hillsborough County and for management of in-lake vegetation outside the wetland fringe (for lakes with an area greater than ten acres), the property owner must secure a Florida Department of Environmental Protection permit (http://www.dep.state.fl.us/lands/invaspec). Table 2. Total diversity, percent exotics, and number of Exotic Pests Plants Council pest plants.
Parameter Lake Watershed
Total Plant Diversity (# of Taxa) 38 38
% Non-Native Plants 21.05% 21.05%
Total Pest Plant Species 2 2
5
Figure 3. 2007 six-inch resolution aerial photograph showing location of vegetation assessment sites on Egypt Lake. Major emergent and floating vegetation zones as well as structures are also observable in this aerial.
6
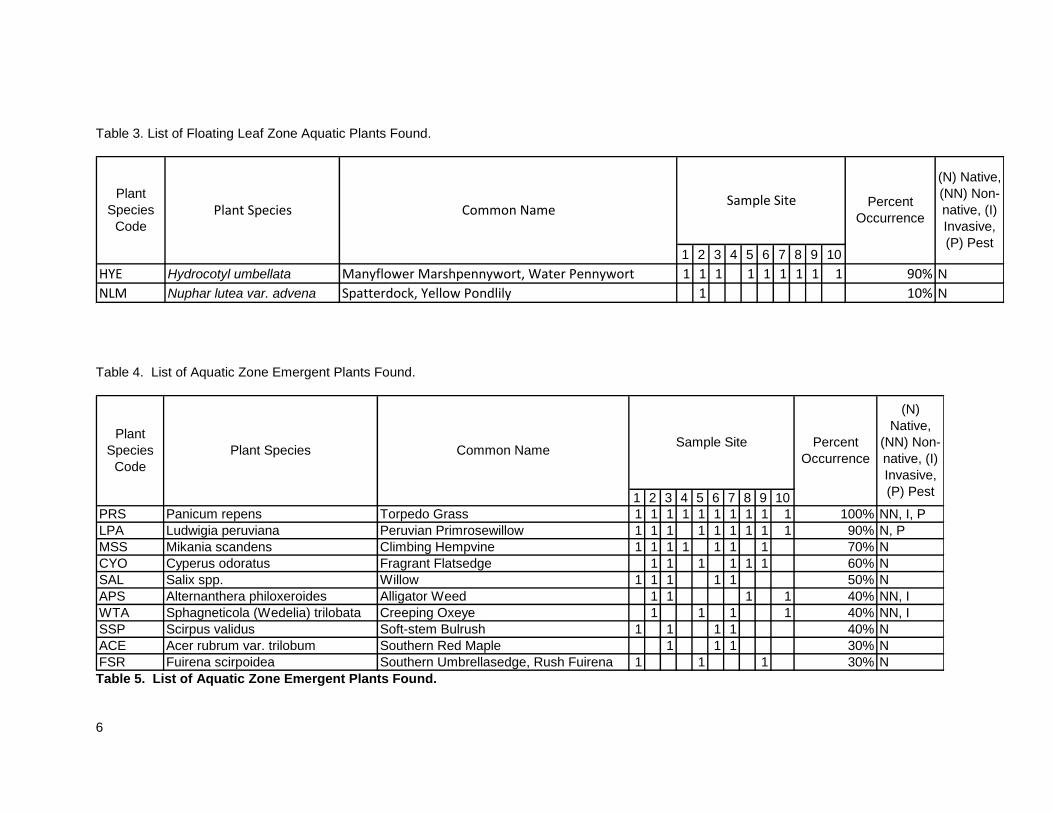
Table 3. List of Floating Leaf Zone Aquatic Plants Found.
1 2 3 4 5 6 7 8 9 10
HYE Hydrocotyl umbellata Manyflower Marshpennywort, Water Pennywort 1 1 1 1 1 1 1 1 1 90% N
NLM Nuphar lutea var. advena Spatterdock, Yellow Pondlily 1 10% N
Plant
Species
Code
Plant Species Common NameSample Site Percent
Occurrence
(N) Native,
(NN) Non-
native, (I)
Invasive,
(P) Pest
Table 4. List of Aquatic Zone Emergent Plants Found.
1 2 3 4 5 6 7 8 9 10
PRS Panicum repens Torpedo Grass 1 1 1 1 1 1 1 1 1 1 100% NN, I, P
LPA Ludwigia peruviana Peruvian Primrosewillow 1 1 1 1 1 1 1 1 1 90% N, P
MSS Mikania scandens Climbing Hempvine 1 1 1 1 1 1 1 70% N
CYO Cyperus odoratus Fragrant Flatsedge 1 1 1 1 1 1 60% N
SAL Salix spp. Willow 1 1 1 1 1 50% N
APS Alternanthera philoxeroides Alligator Weed 1 1 1 1 40% NN, I
WTA Sphagneticola (Wedelia) trilobata Creeping Oxeye 1 1 1 1 40% NN, I
SSP Scirpus validus Soft-stem Bulrush 1 1 1 1 40% N
ACE Acer rubrum var. trilobum Southern Red Maple 1 1 1 30% N
FSR Fuirena scirpoidea Southern Umbrellasedge, Rush Fuirena 1 1 1 30% N
Percent
Occurrence
(N)
Native,
(NN) Non-
native, (I)
Invasive,
(P) Pest
Plant
Species
Code
Plant Species Common NameSample Site
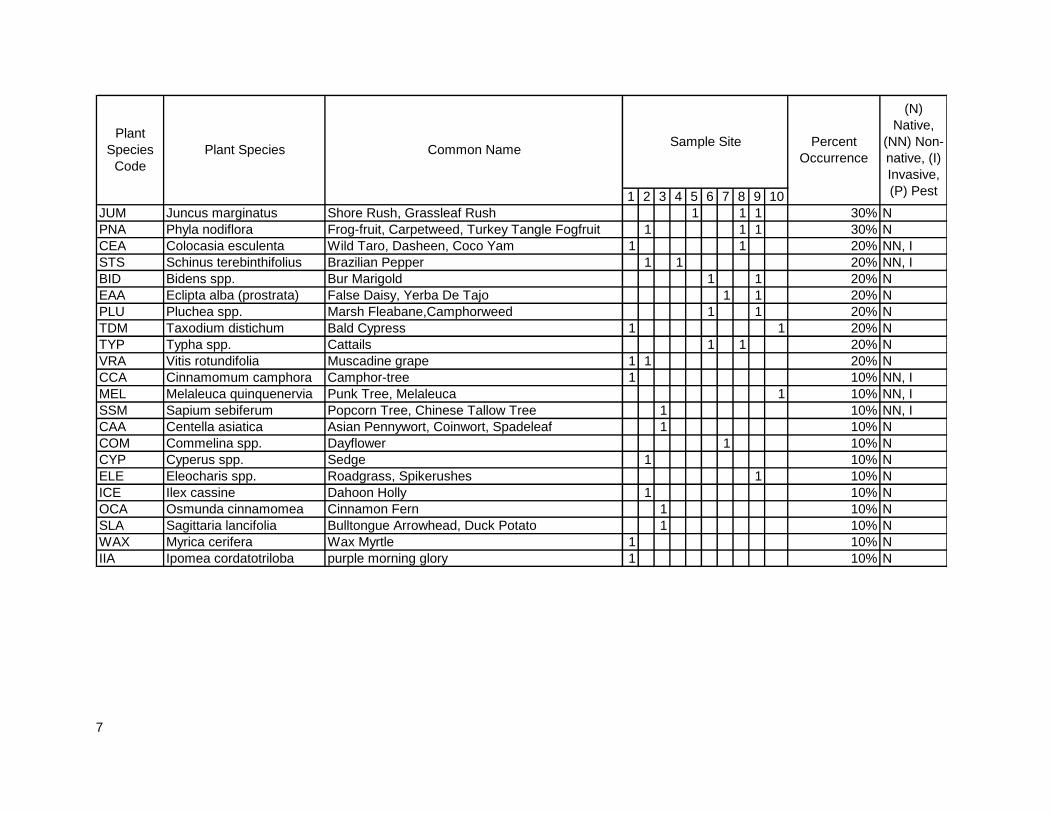
Table 5. List of Aquatic Zone Emergent Plants Found.
7
1 2 3 4 5 6 7 8 9 10
JUM Juncus marginatus Shore Rush, Grassleaf Rush 1 1 1 30% N
PNA Phyla nodiflora Frog-fruit, Carpetweed, Turkey Tangle Fogfruit 1 1 1 30% N
CEA Colocasia esculenta Wild Taro, Dasheen, Coco Yam 1 1 20% NN, I
STS Schinus terebinthifolius Brazilian Pepper 1 1 20% NN, I
BID Bidens spp. Bur Marigold 1 1 20% N
EAA Eclipta alba (prostrata) False Daisy, Yerba De Tajo 1 1 20% N
PLU Pluchea spp. Marsh Fleabane,Camphorweed 1 1 20% N
TDM Taxodium distichum Bald Cypress 1 1 20% N
TYP Typha spp. Cattails 1 1 20% N
VRA Vitis rotundifolia Muscadine grape 1 1 20% N
CCA Cinnamomum camphora Camphor-tree 1 10% NN, I
MEL Melaleuca quinquenervia Punk Tree, Melaleuca 1 10% NN, I
SSM Sapium sebiferum Popcorn Tree, Chinese Tallow Tree 1 10% NN, I
CAA Centella asiatica Asian Pennywort, Coinwort, Spadeleaf 1 10% N
COM Commelina spp. Dayflower 1 10% N
CYP Cyperus spp. Sedge 1 10% N
ELE Eleocharis spp. Roadgrass, Spikerushes 1 10% N
ICE Ilex cassine Dahoon Holly 1 10% N
OCA Osmunda cinnamomea Cinnamon Fern 1 10% N
SLA Sagittaria lancifolia Bulltongue Arrowhead, Duck Potato 1 10% N
WAX Myrica cerifera Wax Myrtle 1 10% N
IIA Ipomea cordatotriloba purple morning glory 1 10% N
Percent
Occurrence
(N)
Native,
(NN) Non-
native, (I)
Invasive,
(P) Pest
Plant
Species
Code
Plant Species Common NameSample Site
8
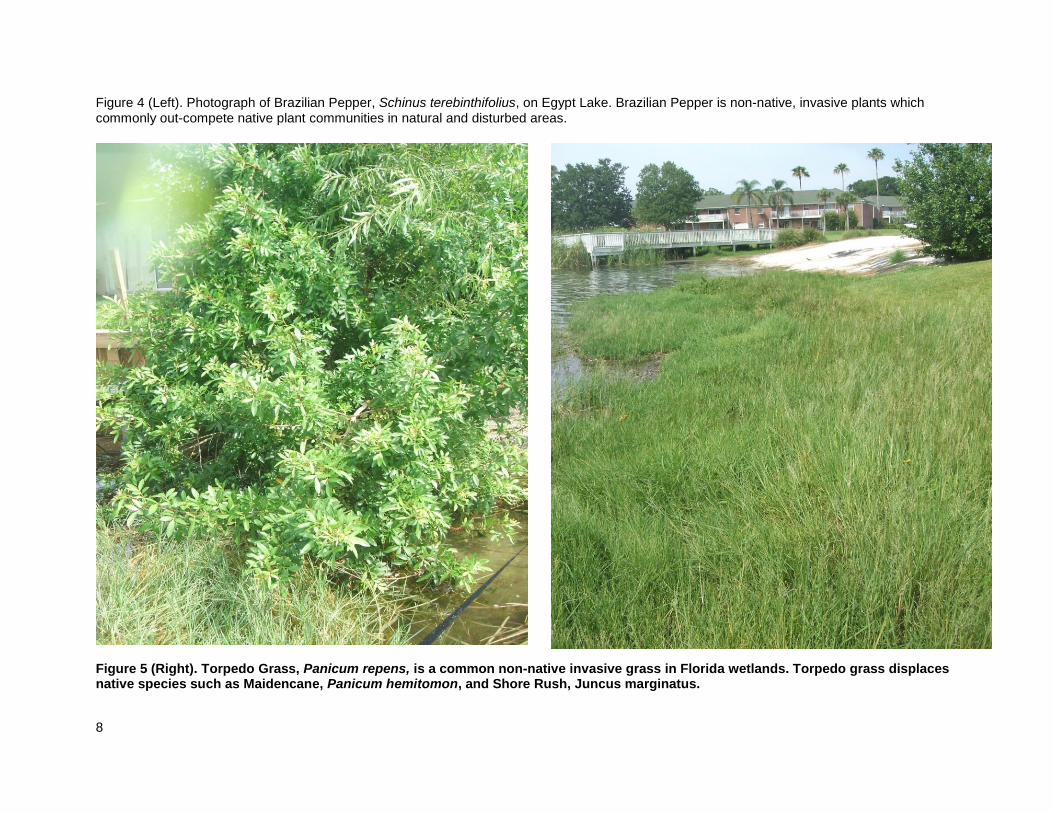
Figure 4 (Left). Photograph of Brazilian Pepper, Schinus terebinthifolius, on Egypt Lake. Brazilian Pepper is non-native, invasive plants which commonly out-compete native plant communities in natural and disturbed areas.
Figure 5 (Right). Torpedo Grass, Panicum repens, is a common non-native invasive grass in Florida wetlands. Torpedo grass displaces native species such as Maidencane, Panicum hemitomon, and Shore Rush, Juncus marginatus.
9
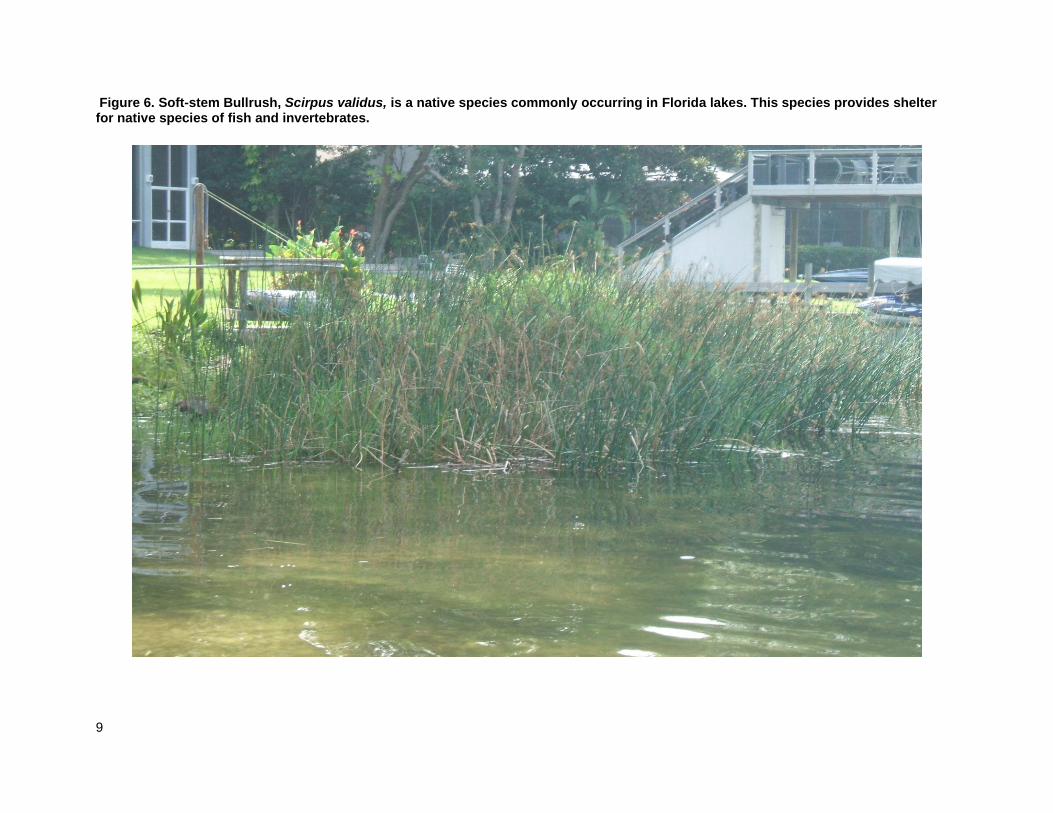
Figure 6. Soft-stem Bullrush, Scirpus validus, is a native species commonly occurring in Florida lakes. This species provides shelter for native species of fish and invertebrates.
10
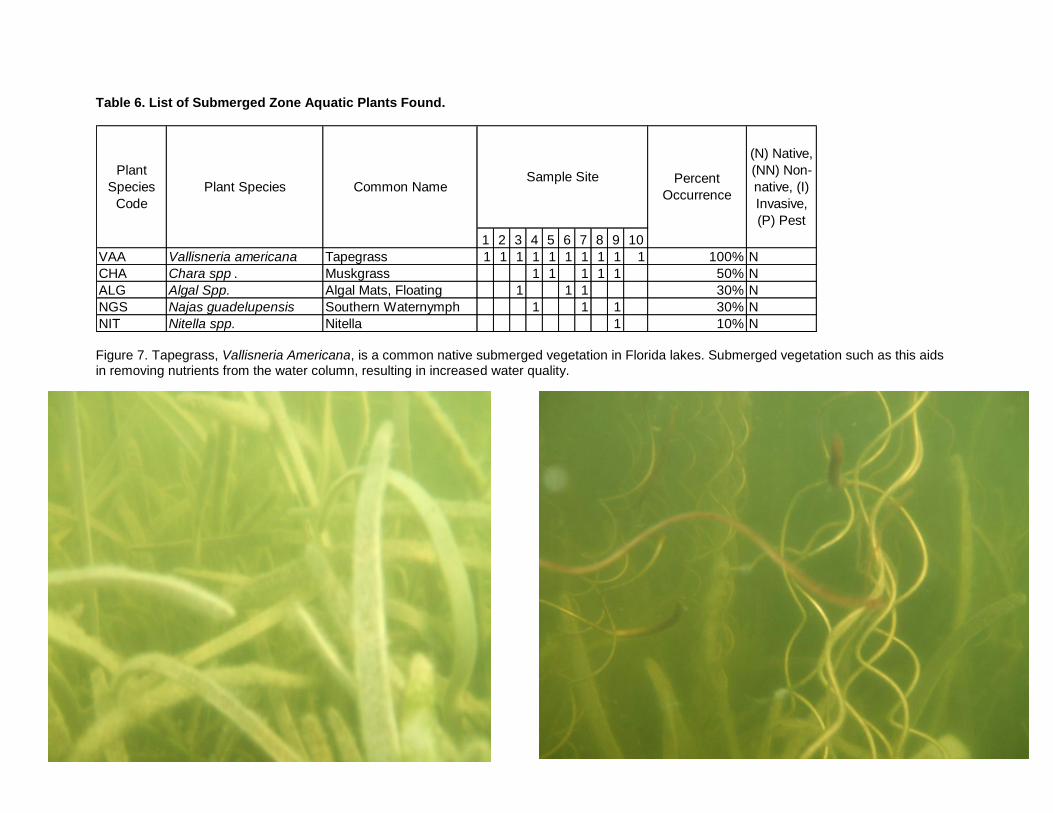
Table 6. List of Submerged Zone Aquatic Plants Found.
1 2 3 4 5 6 7 8 9 10
VAA Vallisneria americana Tapegrass 1 1 1 1 1 1 1 1 1 1 100% N
CHA Chara spp . Muskgrass 1 1 1 1 1 50% N
ALG Algal Spp. Algal Mats, Floating 1 1 1 30% N
NGS Najas guadelupensis Southern Waternymph 1 1 1 30% N
NIT Nitella spp. Nitella 1 10% N
Percent
Occurrence
(N) Native,
(NN) Non-
native, (I)
Invasive,
(P) Pest
Plant
Species
Code
Plant Species Common NameSample Site
Figure 7. Tapegrass, Vallisneria Americana, is a common native submerged vegetation in Florida lakes. Submerged vegetation such as this aids in removing nutrients from the water column, resulting in increased water quality.
11
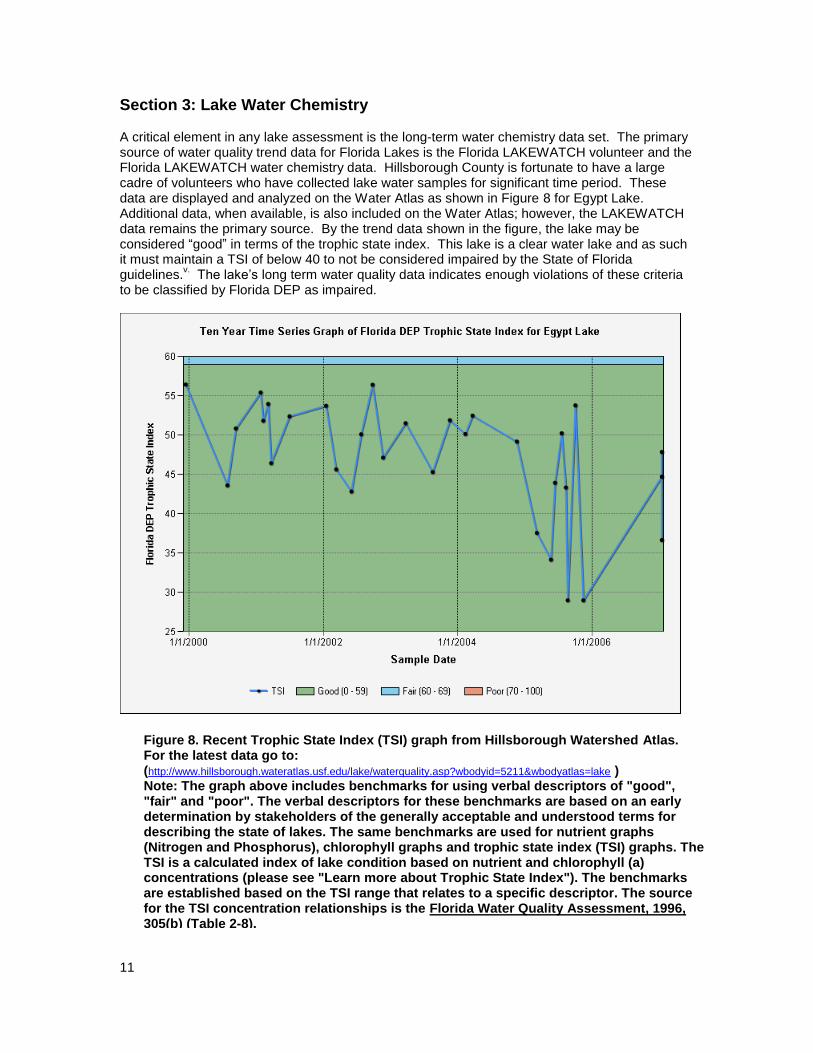
Section 3: Lake Water Chemistry A critical element in any lake assessment is the long-term water chemistry data set. The primary source of water quality trend data for Florida Lakes is the Florida LAKEWATCH volunteer and the Florida LAKEWATCH water chemistry data. Hillsborough County is fortunate to have a large cadre of volunteers who have collected lake water samples for significant time period. These data are displayed and analyzed on the Water Atlas as shown in Figure 8 for Egypt Lake. Additional data, when available, is also included on the Water Atlas; however, the LAKEWATCH data remains the primary source. By the trend data shown in the figure, the lake may be considered “good” in terms of the trophic state index. This lake is a clear water lake and as such it must maintain a TSI of below 40 to not be considered impaired by the State of Florida guidelines.
v. The lake’s long term water quality data indicates enough violations of these criteria
to be classified by Florida DEP as impaired.
Figure 8. Recent Trophic State Index (TSI) graph from Hillsborough Watershed Atlas. For the latest data go to: (http://www.hillsborough.wateratlas.usf.edu/lake/waterquality.asp?wbodyid=5211&wbodyatlas=lake ) Note: The graph above includes benchmarks for using verbal descriptors of "good", "fair" and "poor". The verbal descriptors for these benchmarks are based on an early determination by stakeholders of the generally acceptable and understood terms for describing the state of lakes. The same benchmarks are used for nutrient graphs (Nitrogen and Phosphorus), chlorophyll graphs and trophic state index (TSI) graphs. The TSI is a calculated index of lake condition based on nutrient and chlorophyll (a) concentrations (please see "Learn more about Trophic State Index"). The benchmarks are established based on the TSI range that relates to a specific descriptor. The source for the TSI concentration relationships is the Florida Water Quality Assessment, 1996, 305(b) (Table 2-8).
12
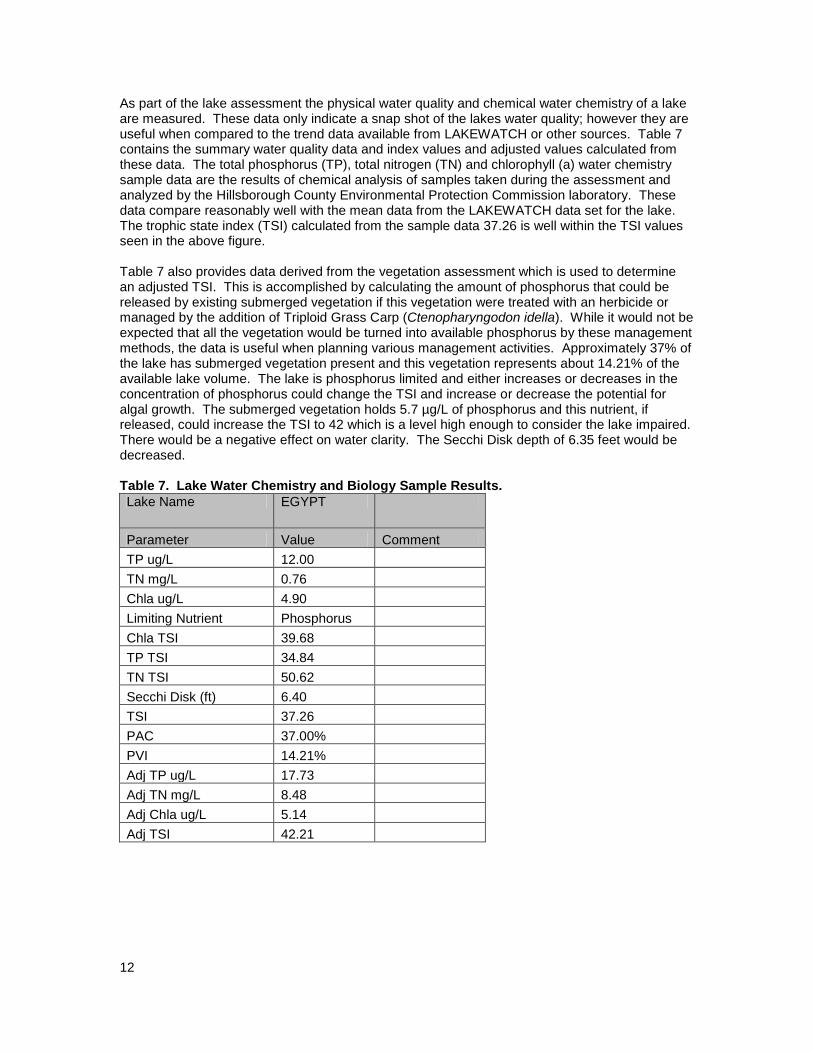
As part of the lake assessment the physical water quality and chemical water chemistry of a lake are measured. These data only indicate a snap shot of the lakes water quality; however they are useful when compared to the trend data available from LAKEWATCH or other sources. Table 7 contains the summary water quality data and index values and adjusted values calculated from these data. The total phosphorus (TP), total nitrogen (TN) and chlorophyll (a) water chemistry sample data are the results of chemical analysis of samples taken during the assessment and analyzed by the Hillsborough County Environmental Protection Commission laboratory. These data compare reasonably well with the mean data from the LAKEWATCH data set for the lake. The trophic state index (TSI) calculated from the sample data 37.26 is well within the TSI values seen in the above figure. Table 7 also provides data derived from the vegetation assessment which is used to determine an adjusted TSI. This is accomplished by calculating the amount of phosphorus that could be released by existing submerged vegetation if this vegetation were treated with an herbicide or managed by the addition of Triploid Grass Carp (Ctenopharyngodon idella). While it would not be expected that all the vegetation would be turned into available phosphorus by these management methods, the data is useful when planning various management activities. Approximately 37% of the lake has submerged vegetation present and this vegetation represents about 14.21% of the available lake volume. The lake is phosphorus limited and either increases or decreases in the concentration of phosphorus could change the TSI and increase or decrease the potential for algal growth. The submerged vegetation holds 5.7 µg/L of phosphorus and this nutrient, if released, could increase the TSI to 42 which is a level high enough to consider the lake impaired. There would be a negative effect on water clarity. The Secchi Disk depth of 6.35 feet would be decreased. Table 7. Lake Water Chemistry and Biology Sample Results.
Lake Name EGYPT
Parameter Value Comment
TP ug/L 12.00
TN mg/L 0.76
Chla ug/L 4.90
Limiting Nutrient Phosphorus
Chla TSI 39.68
TP TSI 34.84
TN TSI 50.62
Secchi Disk (ft) 6.40
TSI 37.26
PAC 37.00%
PVI 14.21%
Adj TP ug/L 17.73
Adj TN mg/L 8.48
Adj Chla ug/L 5.14
Adj TSI 42.21
13
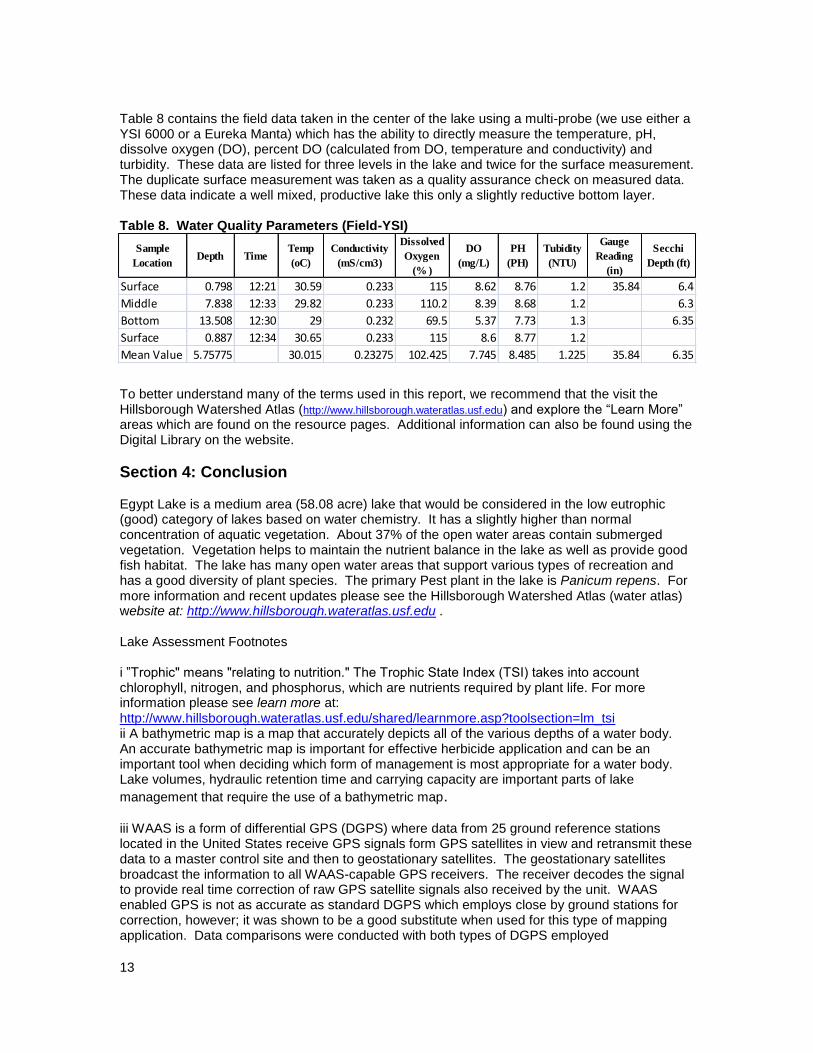
Table 8 contains the field data taken in the center of the lake using a multi-probe (we use either a YSI 6000 or a Eureka Manta) which has the ability to directly measure the temperature, pH, dissolve oxygen (DO), percent DO (calculated from DO, temperature and conductivity) and turbidity. These data are listed for three levels in the lake and twice for the surface measurement. The duplicate surface measurement was taken as a quality assurance check on measured data. These data indicate a well mixed, productive lake this only a slightly reductive bottom layer. Table 8. Water Quality Parameters (Field-YSI)
To better understand many of the terms used in this report, we recommend that the visit the Hillsborough Watershed Atlas (http://www.hillsborough.wateratlas.usf.edu) and explore the “Learn More” areas which are found on the resource pages. Additional information can also be found using the Digital Library on the website.
Section 4: Conclusion Egypt Lake is a medium area (58.08 acre) lake that would be considered in the low eutrophic (good) category of lakes based on water chemistry. It has a slightly higher than normal concentration of aquatic vegetation. About 37% of the open water areas contain submerged vegetation. Vegetation helps to maintain the nutrient balance in the lake as well as provide good fish habitat. The lake has many open water areas that support various types of recreation and has a good diversity of plant species. The primary Pest plant in the lake is Panicum repens. For more information and recent updates please see the Hillsborough Watershed Atlas (water atlas) website at: http://www.hillsborough.wateratlas.usf.edu . Lake Assessment Footnotes i ”Trophic" means "relating to nutrition." The Trophic State Index (TSI) takes into account chlorophyll, nitrogen, and phosphorus, which are nutrients required by plant life. For more information please see learn more at: http://www.hillsborough.wateratlas.usf.edu/shared/learnmore.asp?toolsection=lm_tsi ii A bathymetric map is a map that accurately depicts all of the various depths of a water body. An accurate bathymetric map is important for effective herbicide application and can be an important tool when deciding which form of management is most appropriate for a water body. Lake volumes, hydraulic retention time and carrying capacity are important parts of lake
management that require the use of a bathymetric map. iii WAAS is a form of differential GPS (DGPS) where data from 25 ground reference stations located in the United States receive GPS signals form GPS satellites in view and retransmit these data to a master control site and then to geostationary satellites. The geostationary satellites broadcast the information to all WAAS-capable GPS receivers. The receiver decodes the signal to provide real time correction of raw GPS satellite signals also received by the unit. WAAS enabled GPS is not as accurate as standard DGPS which employs close by ground stations for correction, however; it was shown to be a good substitute when used for this type of mapping application. Data comparisons were conducted with both types of DGPS employed
Sample
LocationDepth Time
Temp
(oC)
Conductivity
(mS/cm3)
Dissolved
Oxygen
(% )
DO
(mg/L)
PH
(PH)
Tubidity
(NTU)
Gauge
Reading
(in)
Secchi
Depth (ft)
Surface 0.798 12:21 30.59 0.233 115 8.62 8.76 1.2 35.84 6.4
Middle 7.838 12:33 29.82 0.233 110.2 8.39 8.68 1.2 6.3
Bottom 13.508 12:30 29 0.232 69.5 5.37 7.73 1.3 6.35
Surface 0.887 12:34 30.65 0.233 115 8.6 8.77 1.2
Mean Value 5.75775 30.015 0.23275 102.425 7.745 8.485 1.225 35.84 6.35
14
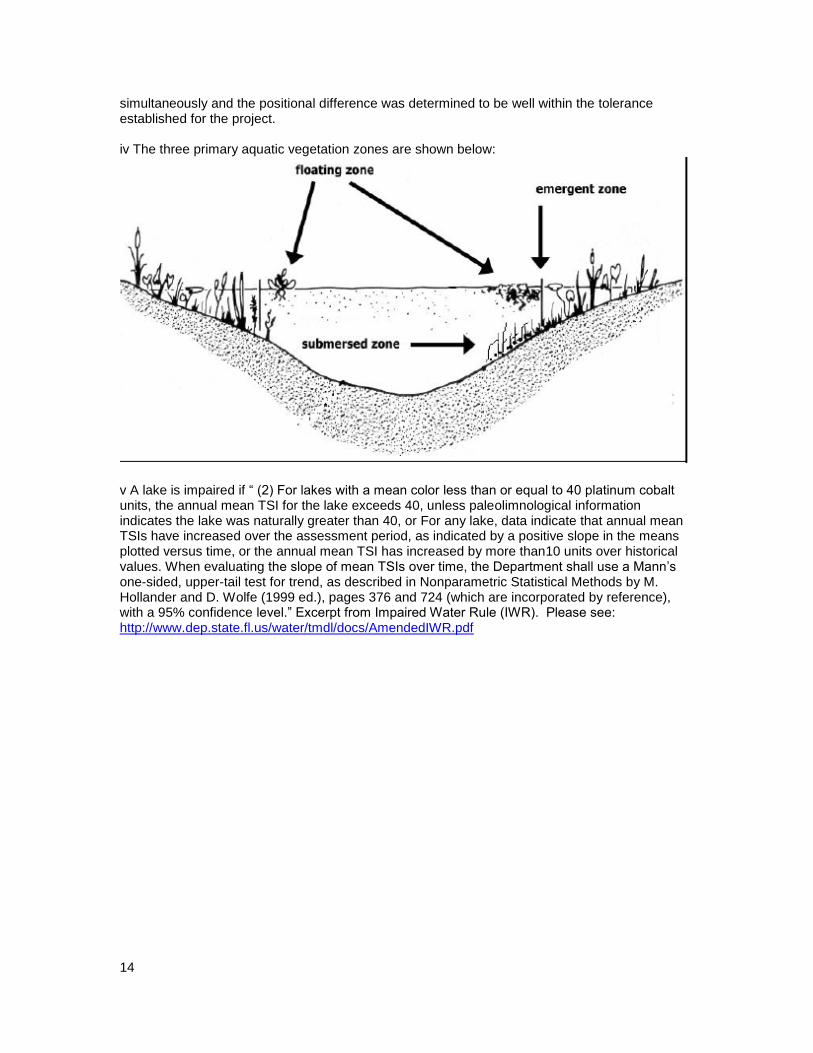
simultaneously and the positional difference was determined to be well within the tolerance established for the project. iv The three primary aquatic vegetation zones are shown below:
v A lake is impaired if “ (2) For lakes with a mean color less than or equal to 40 platinum cobalt units, the annual mean TSI for the lake exceeds 40, unless paleolimnological information indicates the lake was naturally greater than 40, or For any lake, data indicate that annual mean TSIs have increased over the assessment period, as indicated by a positive slope in the means plotted versus time, or the annual mean TSI has increased by more than10 units over historical values. When evaluating the slope of mean TSIs over time, the Department shall use a Mann’s one-sided, upper-tail test for trend, as described in Nonparametric Statistical Methods by M. Hollander and D. Wolfe (1999 ed.), pages 376 and 724 (which are incorporated by reference), with a 95% confidence level.” Excerpt from Impaired Water Rule (IWR). Please see: http://www.dep.state.fl.us/water/tmdl/docs/AmendedIWR.pdf


![Lake Manzala Engineered Wetland, Port Said, Egypt [IWC4 Presentation]](https://img.pdfslide.net/doc/110x75/58868b9c1a28abf6158b54a5/lake-manzala-engineered-wetland-port-said-egypt-iwc4-presentation.jpg)