Embed Size (px)
Citation preview
LAND DEGRADATION, SOIL CONSERVATION AND POVERTY
STATUS OF FARMERS IN OSUN STATE, NIGERIA
Amao J.O., Ayantoye K. and Aluko A.M.
Department of Agricultural Economics, Faculty of Agricultural Sciences,
Ladoke Akintola University of Technology,
PMB 4000, Ogbomoso, Oyo State, Nigeria
E-mail: [email protected]
Abstract: This study deals with Land degradation and Poverty Status of farmers in Osun
State, Nigeria. Data were collected from 105 randomly sampled respondents in the study
area. The methods employed in analyzing the data were, Descriptive statistics, FGT poverty
index and Probit regression model. The study revealed that averagely they were aged 51.66
years. Majority 79.05% were male, 73.33% were married and 46.67% had household size of
6-10 members with a mean household size of 8 members in the house. The mean farm size
was 9.70ha58.48% of the respondents had between 0.5-2ha of land subjected to fallowing.
9.52% of the respondents had between 0.5-2ha of land subjected to livestock farming.
78.10% of the respondents had between 0.5-2ha of degraded cash crop land. 74.29% of the
respondents had between 0.5-2ha of degraded food cropland. 47.62% of the respondents had
between 0.5-2ha of degraded fallow land. 86.67% of the respondents did not use dung of
livestock kept on the farm. 72.38% of the respondents used bush burning on their farm.
65.71% of the respondents used mulching on their farm. 85.71% of the respondents practiced
clean clearing on their farm. 63.81% of the respondents practiced crop rotation on their farm.
66.67% of the respondents did not use organic manure on their farm. 62.66% of the
respondents did not practice zero tillage on their farm. The study further revealed that poverty
incidence (P0) was 51%, poverty depth (P1) was 17% and poverty severity (P2) was 8%. The
determinants of poverty in the study area are; marital status, household size and land area
under livestock farming.
Keywords: Degraded land, zero tillage, poverty incidence, clean clearing, livestock farming.
1. STATEMENT OF PROBLEM
Over exploitation of land resources through over grazing, over use of fertilizer, soil
erosion, soil acidification and Stalinization, overload of soil nutrients and loss of agricultural
land to other users. Under investment in land which includes the degradation of existing
components of land that are not maintained such as terrace, irrigation work as well as land
improvement that are not made due to lack s of investment incentives (Oyekale, 2008). The
impact of land degradation on the local population includes crop failure and famine, shortage
of water, soil erosion, shortage of pasture for livestock and prolong drought (Subair, 2009). In
International Journal of Science, Environment ISSN 2278-3687 (O)
and Technology, Vol. 2, No 6, 2013, 1205 – 1231
Received Oct 8, 2013 * Published Dec 2, 2013 * www.ijset.net
1206 Amao J.O., Ayantoye K. and Aluko A.M.
all parts of Nigeria, there is noticeable evidence of land degradation. This varies from place
to place in terms of the types, duration, severity, and socio-economic impact (Aruleba, 2004;
Senjobi, 2007). There is need for a scientific study to discover the particular cropping pattern
or system that will give its highest productivity. The importance of this cannot be
underestimated given an economic condition that we faced with the problem of acute
shortage of food and an over increasing population (Oyekale, 2008).
Communal ownership of land in Nigeria has been associated with such problems as
limited tenure security, restrictions or farmers’ mobility, and the inevitable fragmentation of
holdings among future heirs. In addition, group ownership restricts access rights community
members outside the owning group, a situation that limits the use of land as collateral for
agricultural credit. But communal ownership has also been credited with preserving
traditional land use practices such as bush fallowing, which has helped retard problems of
land degradation. (Food and Agriculture Organization, FAO, 2003). To solve the problems of
land degradation and its linkage, to agricultural productivity and poverty, we need to take a
broader perspective both in how the problem is defined and in the set of possible solution. It
may be that despite reported high erosion rates, soil erosion is not the most important land
degradation problem to farmers; the nature of land degradation problem their causes likely
varies from place to place (Fitsum et al, 2009). This leads to consideration of a broader set of
possible solutions than simple conservation programmes. It may be that other area of policy
intervention such as land tenure policy; infrastructure and market policies have much greater
impact than conservation programme (Subair, 2009). The specific objectives are to: identify
land degradation/use categories, type of cultural/soil conservation practices adopted and
poverty status of farmers in the study area.
2. THEORETICAL FRAMEWORK
The importance of natural resources, especially land to agriculture and rural
development is well recognized. Land is the basic natural resource that provides habitat and
sustenance for living organisms. Africa is endowed with enough land to undertake small and
large scale activities to strengthen household security, national development, trans-boundary
cooperation and regional integration to transform trade, and create new opportunities for
sustainable development that is sensitive to the environment and social and economic issues
(Bangladesh, 2001). The economic fortune of most developing countries, including Nigeria,
however, revolves, largely around the exploitation and use of land resources especially in the
����������������������������������������������Land Degradation, Soil Conservation and Poverty Status …. 1207�
�
�
primary industry such as, agriculture (Titilola and Jeje, 2008). Busari, (2010) explained that
land degradation is the process of decay in the land’s physical and biological resources,
which continues until it reduces the lands advantage. According to Dixon and Peter, (2001)
the process of land degradation can be natural but usually ends with a new natural balance. In
most recent cases, land degradation reflects imbalance between man and environments. Man
is always seen not as the higher but the acceleration of the land degradation process so that
land becomes truly unproductive and difficult to rehabilitate, limited to time and cost.
Senjobi and Ogunkunle, (2010) explained that land, being limited in supply is pressured and
competed for by several uses. The intensification of cultivation resulting in the opening up of
new lands exposes the top soil to the elements of degradation and alters the natural ecological
conservatory balances in the landscape.
According to Eniola et al., (2010) Land degradation, a decline in land quality caused
by human activities, will remain high on the international agenda in the 21st century. In the
developing countries like Nigeria where a large proportion of human population depends
almost entirely on land resources for their sustenance, there is increasing competing demand
for land utilization such as grazing, fish pond construction, quarrying, crop farming amongst
others. People can be major asset in reversing trend towards degradation. According to Sara
and Satya, (2009) Land degradation is the most important environmental problem currently
challenging the nation of sustainable development in many parts of the world. The problem is
most acute where the environment is intrinsically vulnerable and where the population is
losing control of its own resource, unless some local actions are being taken. The willingness
of all involved parties to take appropriate local action therefore must be put as the important
measure for perceiving the readiness to take control measure against land degradation.
Oyekale, (2008) suggested two broad types of land degradation, which are:
Overexploitation of land resources through over use of fertilizer, soil acidification, pan
information, terrain deformation, soil erosion, overgrazing, eutrophication, over load of soil
nutrients and under investment in land which includes degradation of existing components of
land that are not properly managed such as irrigation terraces, pollution tree alleys as well as
load improvement that are not made due to lack of investment incentives. According to
Akamigbo (2005), land degradation assumes varying dimensions depending on one’s
location. In Nigeria, for example, inhabitants of the coastal areas are not as worried by the
fear of desert encroachment as those who reside in Bornu, Sokoto, Katsina and Kano states of
Nigeria, just as they worry about oil pollution and spillage, coastal erosion and flooding in
1208 Amao J.O., Ayantoye K. and Aluko A.M.
Niger Delta of Nigeria. Sheet erosion is nation-wide while gully erosion is most severe and
dense in certain southern states of Anambra, Imo, Abia, Enugu, Ondo, Delta and Akwa Ibom.
Flooding occurs throughout Nigeria.
According to Busari (2010) Land degradation caused by agriculture takes many forms
and has many causes. Some of the most causes of land degradation include: degradation
related to overgrazing by livestock, degradation attributable to soil Stalinization a buildup of
salts in soil that result from irrigation in certain situations, degradation related to soil erosion,
here related to inappropriate cultivation practices, degradation attributable to water logging
another problem related to irrigation and diversion of tropical forests to agriculture (crop or
pasture). Nkonya, et al, (2011) revealed that the immediate causes of land degradation
include biophysical causes and unsustainable land management practices. Contributing
biophysical causes include topography, which determines soil erosion hazard, and climatic
conditions, such as rainfall, wind, and temperature. Overgrazing by livestock can lead to land
degradation .Unsustainable land management practices, such as deforestation, forest
degradation, soil nutrient mining, and cultivation on steep slopes, are also direct contributors
to land degradation.
Estwaran, et al., (2001) revealed that Land degradation is a global problem, largely
related to agricultural use. The major causes include: Land clearance, such as clear cutting
and deforestation, agricultural depletion of soil nutrients through poor farming practices,
livestock including overgrazing and over drafting, inappropriate irrigation land over drafting,
Urban sprawl and commercial development oil contamination including, Vehicle off-loading
,Quarrying of stone, sand, ore and minerals, increase in field size due to economies of scale,
reducing shelter for wildlife, as hedgerows and copses disappear, exposure of naked soil after
harvesting by heavy equipment, monoculture, destabilizing the local ecosystem, dumping of
non-biodegradable trash, such as plastics. Lan and Ragnar, (2007) explained that Patterns of
degradation vary according to agro-ecological conditions, farming systems, levels of
intensification, and resource endowments, but these also interact in important ways with
social and economic systems. Temperate lands, for example, are generally more resilient to
degradation, but are also associated with societies that have more resources for investing in
maintaining and rehabilitating land quality – and for developing alternative sources of
livelihood for their citizens. Basic goods are nutrition, shelter/housing, water, and healthcare,
access to productive resources including education, working skills and tools and political and
����������������������������������������������Land Degradation, Soil Conservation and Poverty Status …. 1209�
�
�
civil rights to participate in decisions concerning socio-economic conditions (Steeten and
Burki, 2008).
3. METHODOLOGY
The study was conducted in Ilesha West Local Government Area of Osun State,
Nigeria. Its headquarter is in Oja Oba (Ereja square) on the outskirts of the city of Ilesha. It
has an area of 114km2 of land and size and it is located on 19
030
L south of the equator and 5
0-
570 West of the Greenwich meridian. Ilesha which is 30km from Oshogbo, Osun State shares
boundaries with Obokun LGA of Osun State in the North. Ilesha west has a contending home
based population commission which was conducted at the last 2006 census by Nigerian
Population Census (NPC, 2006) to be 103,555. Primary data were used for the study. The
data were collected through the use of a structured questionnaire. The population of the study
consists of farmers in Ilesha West Local Government Area of Osun State. Multi-stage random
sampling was used to select farmers within the Local Government Area. The villages in
Ilesha West Local Government Area are as follows; Ilaje, Ibala, Ilo, Ayegunle, Isokun, Omi
iru, Omi eran, Ereja, Ita ofa, Igbogi, Idasa, Omi oko, Odo esira, Egbe idi, Ijoka, Itakogun,
Biladu, Omofe and Odo iro. The first stage involves selection of some villages from the
above villages. The last stage involved random selection of farmers from each village, 15
farmers from Ilaje, 10 farmers from Ibala, 13 farmers from Ilo, 6 farmers from Ayegunle, 14
farmers from Omi iru, 8 farmers from Omi eran, 12 farmers from Igbogi, 5 farmers from
Idasa, 7 farmers from Odo esira, 6 farmers from Ijoka, and 9 farmers from Biladu. Thus, 105
farmers were interviewed in the study area. Three different analytical techniques were
employed in analyzing the data which are; Descriptive Statistics, FGT 1984 poverty index
and Probit regression model. Following Foster et al (1984), poverty line was computed as
the 2/3rd of the mean per capita annual income of all the members of the sampled
households. The FGT index allows for the quantitative measurement of poverty status among
subgroups of a population (i.e., incorporating any degree of concern about poverty) and has
been widely used (Kakwani, 1990). The headcount ratio measures the ratio of the number of
poor individuals or simply measures the poverty incidence (i.e., the percent of the poor in the
total sample). The analysis of poverty incidence using FGT measure usually starts with
ranking of expenditures in ascending order Yi � Y, � ... �; Yn:
1210 Amao J.O., Ayantoye K. and Aluko A.M.
α
�
���
� −= � =
Zi
YiZi
NP
q
i 1
1
1-1
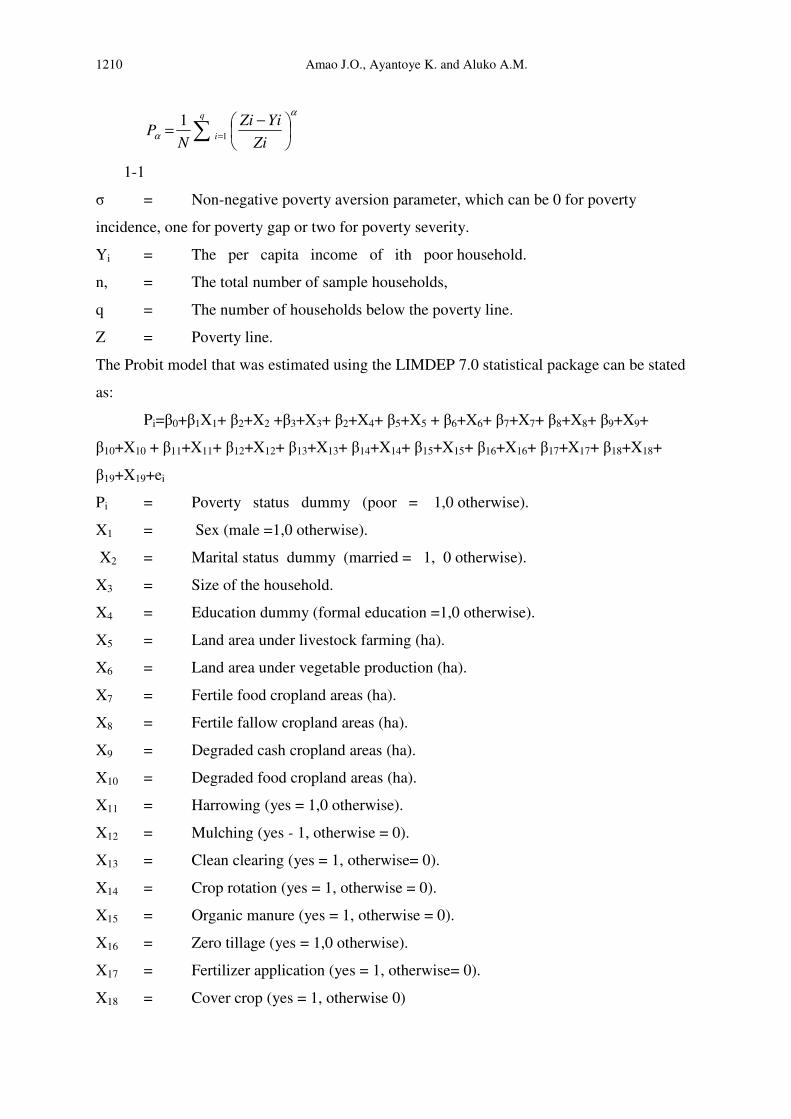
� = Non-negative poverty aversion parameter, which can be 0 for poverty
incidence, one for poverty gap or two for poverty severity.
Yi = The per capita income of ith poor household.
n, = The total number of sample households,
q = The number of households below the poverty line.
Z = Poverty line.
The Probit model that was estimated using the LIMDEP 7.0 statistical package can be stated
as:
Pi=�0+�1X1+ �2+X2 +�3+X3+ �2+X4+ �5+X5 + �6+X6+ �7+X7+ �8+X8+ �9+X9+
�10+X10 + �11+X11+ �12+X12+ �13+X13+ �14+X14+ �15+X15+ �16+X16+ �17+X17+ �18+X18+
�19+X19+ei
Pi = Poverty status dummy (poor = 1,0 otherwise).
X1 = Sex (male =1,0 otherwise).
X2 = Marital status dummy (married = 1, 0 otherwise).
X3 = Size of the household.
X4 = Education dummy (formal education =1,0 otherwise).
X5 = Land area under livestock farming (ha).
X6 = Land area under vegetable production (ha).
X7 = Fertile food cropland areas (ha).
X8 = Fertile fallow cropland areas (ha).
X9 = Degraded cash cropland areas (ha).
X10 = Degraded food cropland areas (ha).
X11 = Harrowing (yes = 1,0 otherwise).
X12 = Mulching (yes - 1, otherwise = 0).
X13 = Clean clearing (yes = 1, otherwise= 0).
X14 = Crop rotation (yes = 1, otherwise = 0).
X15 = Organic manure (yes = 1, otherwise = 0).
X16 = Zero tillage (yes = 1,0 otherwise).
X17 = Fertilizer application (yes = 1, otherwise= 0).
X18 = Cover crop (yes = 1, otherwise 0)
����������������������������������������������Land Degradation, Soil Conservation and Poverty Status …. 1211�
�
�
X19 = Number of time sick during cropping season
ei = Error term.
4. RESULTS AND DISCUSSION OF THE FINDINGS
4.1 Distribution of farmers according to their socio economic characteristics in the
study area
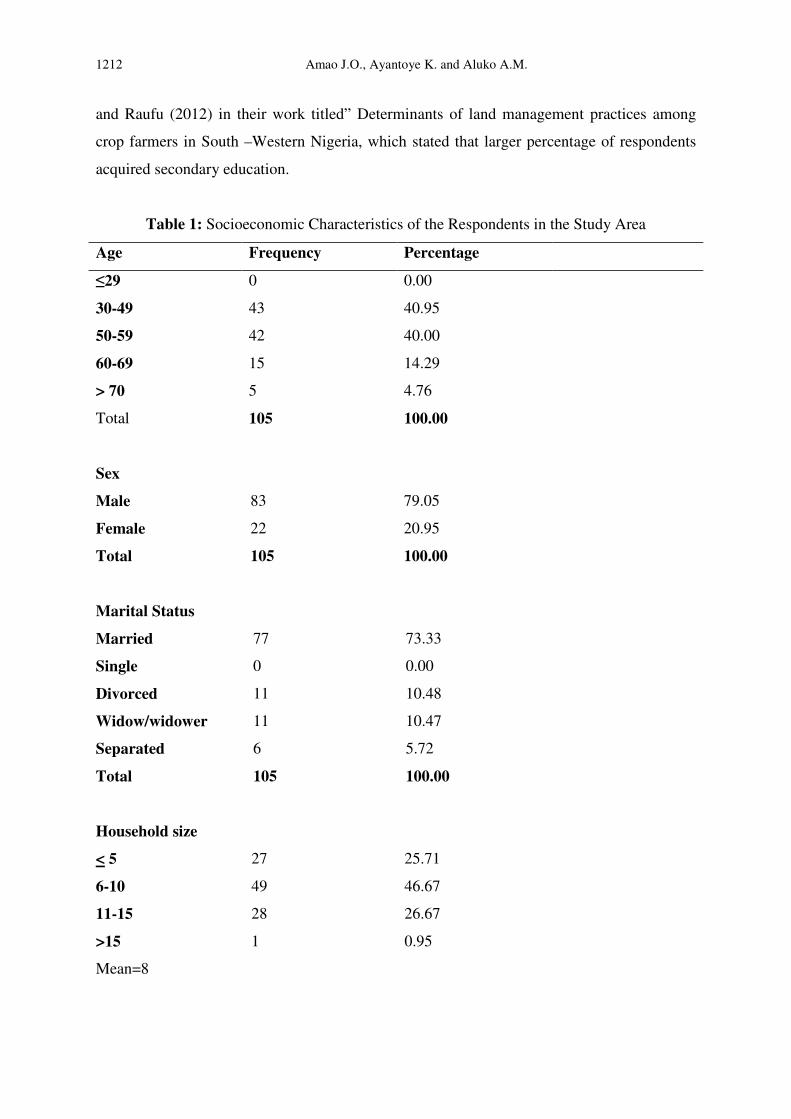
Table 1 revealed that 40.95% were between ages 30-49 years, 40% were between 50-
59 years, 14.29% were between 60-69 years and 4.76% were between 70 years and above
which means that most of the respondents were between 30-59years. The mean age is 51.66
years. This result is in line with the findings of Umukoro and Akinnagbe, (2011) in their
work titled Farmers Perception of the Effects of Land Degradation on Agricultural Activities
in Ethiope East Local Government area of Delta state, Nigeria with mean age of 53.17years.
Table 1 revealed that 79.05% were male while 20.95% constituted the female out of 105
farmers sampled which means that most of the respondents were male involved in farming
and female in farm produce processing. This result corroborated with the findings of Oyekale
(2008) in his work titled Land Degradation, soil conservation practices and poverty incidence
in South Western Nigeria with the majority being male. Table 1 showed that 73.33% of the
respondents were married, 10.48% were divorced, 10.47% were widow/widower and 5.72%
were separated which means that most of the respondents in the study area were married
having the highest percentage of 73.33%. This result tally with the work of Umukoro and
Akinnagbe (2011) in his work titled “Farmers Perception of the Effects of Land Degradation
on Agricultural Activities in Ethiope East Local Government Area of Delta State, Nigeria.
Table 1 showed that farmers household with less than or equal to 5 members had a
percentage of 25.71%, household farmers with members had a percentage of 46.67 and
farmers with household size between eleven and fifteen members had a percentage of 26.67,
this implies that majority of the respondents had a large household family size, which could
however be used as family labour. The mean household size was 8 members.
This conforms to Adetunji and Raufu (2012) in their work titled “Determinants of land
management practices among crop farmers in south-western Nigeria with a mean household
size of 8 members. Table 1 showed that 16.19% of the farmers had no formal education, 20%
with primary education, 49.52% with second any education while 14.29% of the farmers had
tertiary education. This implies that more than half of the farmers may have access to
information associated with land management. This result is in line with the work of Adetunji
1212 Amao J.O., Ayantoye K. and Aluko A.M.
and Raufu (2012) in their work titled” Determinants of land management practices among
crop farmers in South –Western Nigeria, which stated that larger percentage of respondents
acquired secondary education.
Table 1: Socioeconomic Characteristics of the Respondents in the Study Area
Age Frequency Percentage
�29 0 0.00
30-49 43 40.95
50-59 42 40.00
60-69 15 14.29
> 70 5 4.76
Total 105 100.00
Sex
Male 83 79.05
Female 22 20.95
Total 105 100.00
Marital Status
Married 77 73.33
Single 0 0.00
Divorced 11 10.48
Widow/widower 11 10.47
Separated 6 5.72
Total 105 100.00
Household size
< 5 27 25.71
6-10 49 46.67
11-15 28 26.67
>15
Mean=8
1 0.95
����������������������������������������������Land Degradation, Soil Conservation and Poverty Status …. 1213�
�
�
Total 105 100.00
Educational level
No formal 17 16.19
Pry 21 20.00
Sec 52 49.52
Tertiary 15 14.29
Total 105 100.00
Source: Field Survey, 2012.
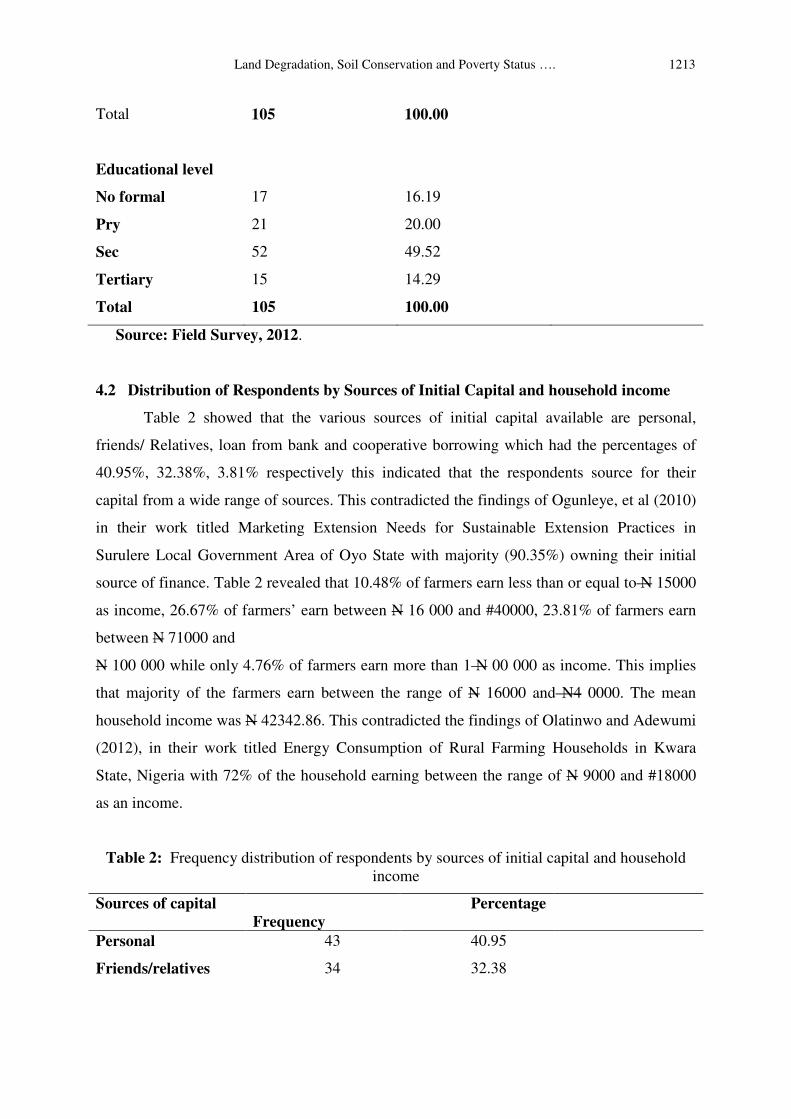
4.2 Distribution of Respondents by Sources of Initial Capital and household income
Table 2 showed that the various sources of initial capital available are personal,
friends/ Relatives, loan from bank and cooperative borrowing which had the percentages of
40.95%, 32.38%, 3.81% respectively this indicated that the respondents source for their
capital from a wide range of sources. This contradicted the findings of Ogunleye, et al (2010)
in their work titled Marketing Extension Needs for Sustainable Extension Practices in
Surulere Local Government Area of Oyo State with majority (90.35%) owning their initial
source of finance. Table 2 revealed that 10.48% of farmers earn less than or equal to N 15000
as income, 26.67% of farmers’ earn between N 16 000 and #40000, 23.81% of farmers earn
between N 71000 and
N 100 000 while only 4.76% of farmers earn more than 1 N 00 000 as income. This implies
that majority of the farmers earn between the range of N 16000 and N4 0000. The mean
household income was N 42342.86. This contradicted the findings of Olatinwo and Adewumi
(2012), in their work titled Energy Consumption of Rural Farming Households in Kwara
State, Nigeria with 72% of the household earning between the range of N 9000 and #18000
as an income.
Table 2: Frequency distribution of respondents by sources of initial capital and household
income
Sources of capital
Frequency
Percentage
Personal 43 40.95
Friends/relatives 34 32.38
1214 Amao J.O., Ayantoye K. and Aluko A.M.
Bank 4 3.81
Cooperative 24 22.86
Total 105 100.00
Household income(N)
< 15000 11 10.48
1600 -25000 28 26.67
2600 -40000 28 26.67
41000 – 70000 25 23.81
71000 – 10000 8 7.62
>100 000 5 4.76
Mean= 42342.86
Total 105 100.00
Source: Field Survey, 2012.
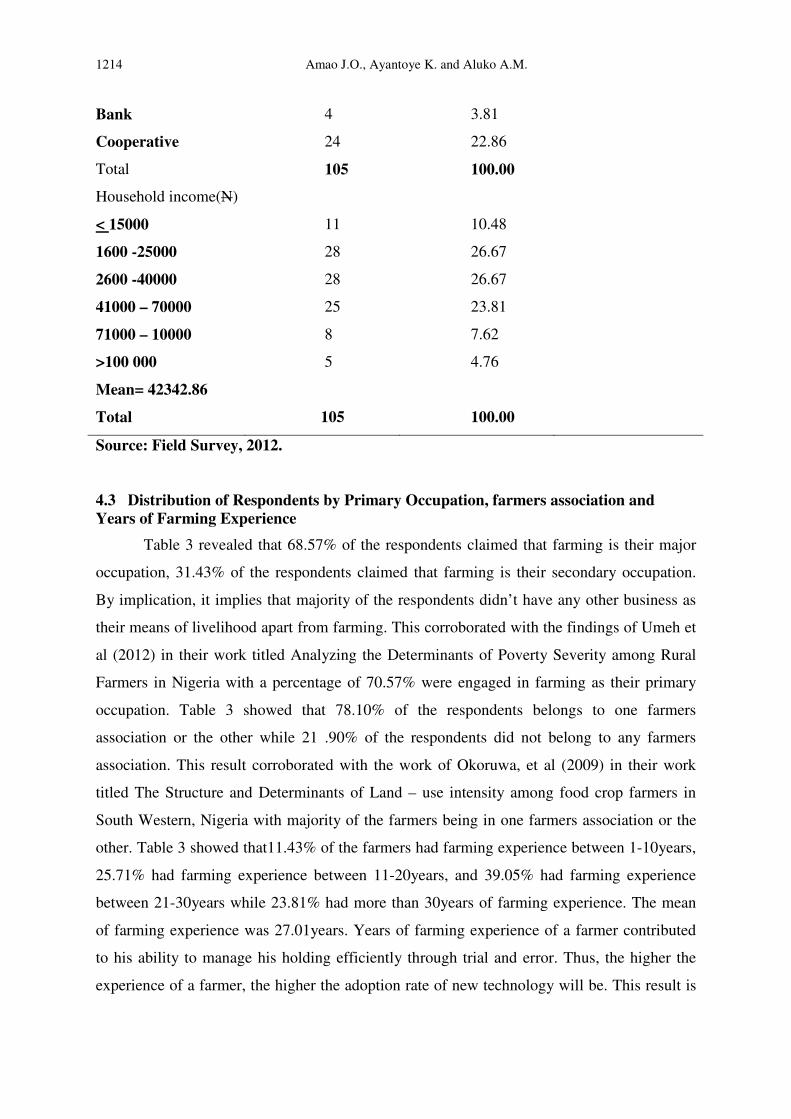
4.3 Distribution of Respondents by Primary Occupation, farmers association and
Years of Farming Experience
Table 3 revealed that 68.57% of the respondents claimed that farming is their major
occupation, 31.43% of the respondents claimed that farming is their secondary occupation.
By implication, it implies that majority of the respondents didn’t have any other business as
their means of livelihood apart from farming. This corroborated with the findings of Umeh et
al (2012) in their work titled Analyzing the Determinants of Poverty Severity among Rural
Farmers in Nigeria with a percentage of 70.57% were engaged in farming as their primary
occupation. Table 3 showed that 78.10% of the respondents belongs to one farmers
association or the other while 21 .90% of the respondents did not belong to any farmers
association. This result corroborated with the work of Okoruwa, et al (2009) in their work
titled The Structure and Determinants of Land – use intensity among food crop farmers in
South Western, Nigeria with majority of the farmers being in one farmers association or the
other. Table 3 showed that11.43% of the farmers had farming experience between 1-10years,
25.71% had farming experience between 11-20years, and 39.05% had farming experience
between 21-30years while 23.81% had more than 30years of farming experience. The mean
of farming experience was 27.01years. Years of farming experience of a farmer contributed
to his ability to manage his holding efficiently through trial and error. Thus, the higher the
experience of a farmer, the higher the adoption rate of new technology will be. This result is
����������������������������������������������Land Degradation, Soil Conservation and Poverty Status …. 1215�
�
�
in line with Subair (2009) in his work titled “Environment-productivity relationship in the
South West Nigeria’s Agriculture with a mean of 29.07years of farming experience.
Table 3: Frequency distribution of respondents by primary occupation, Farmers Association
and Years of farming experience
Occupation
Frequency
Percentage
Farming 72 68.57
0thers 33 31.43
Total 105 100.00
Farmers association
Yes 82 78.10
No 23 21.90
Total 105 100.00
Years of farming experience
1 – 10 12 11.43
11-20 27 25.71
21-30 41 39.05
> 30 25 23.81
Mean = 27.01
Total 105 100.00
Source Field Survey, 2012.
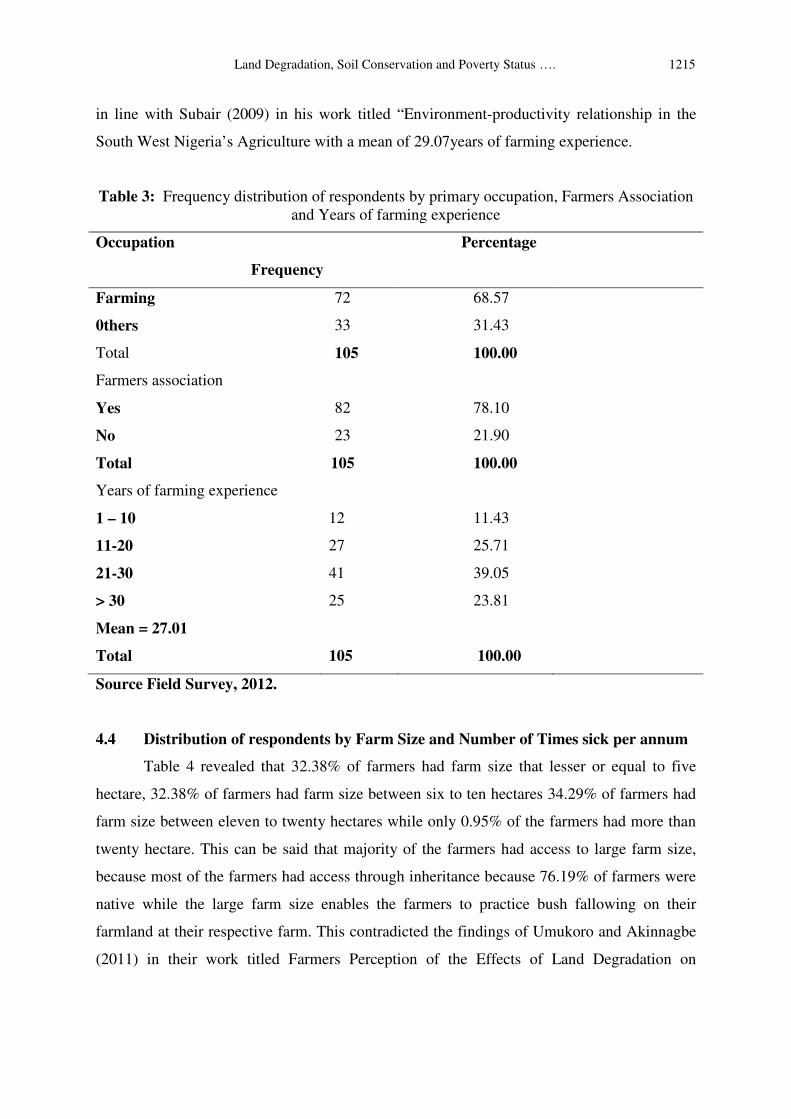
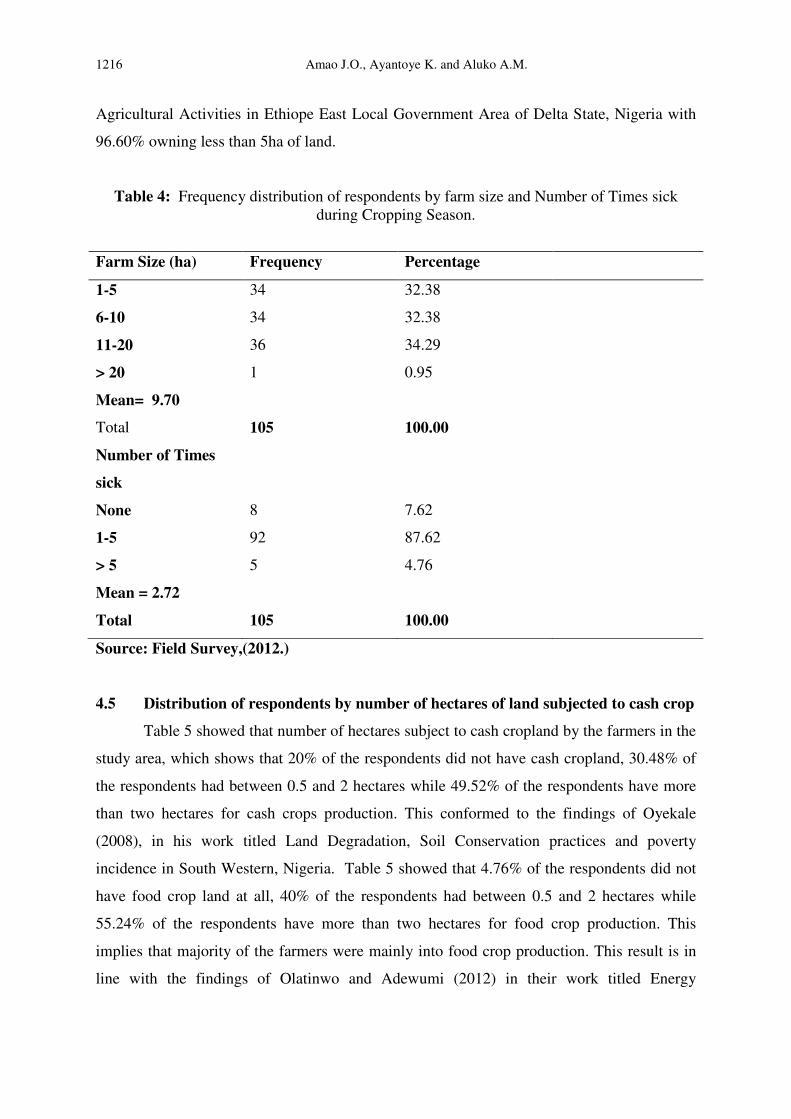
4.4 Distribution of respondents by Farm Size and Number of Times sick per annum
Table 4 revealed that 32.38% of farmers had farm size that lesser or equal to five
hectare, 32.38% of farmers had farm size between six to ten hectares 34.29% of farmers had
farm size between eleven to twenty hectares while only 0.95% of the farmers had more than
twenty hectare. This can be said that majority of the farmers had access to large farm size,
because most of the farmers had access through inheritance because 76.19% of farmers were
native while the large farm size enables the farmers to practice bush fallowing on their
farmland at their respective farm. This contradicted the findings of Umukoro and Akinnagbe
(2011) in their work titled Farmers Perception of the Effects of Land Degradation on
1216 Amao J.O., Ayantoye K. and Aluko A.M.
Agricultural Activities in Ethiope East Local Government Area of Delta State, Nigeria with
96.60% owning less than 5ha of land.
Table 4: Frequency distribution of respondents by farm size and Number of Times sick
during Cropping Season.
Farm Size (ha) Frequency Percentage
1-5 34 32.38
6-10 34 32.38
11-20 36 34.29
> 20 1 0.95
Mean= 9.70
Total 105 100.00
Number of Times
sick
None 8 7.62
1-5 92 87.62
> 5 5 4.76
Mean = 2.72
Total 105 100.00
Source: Field Survey,(2012.)
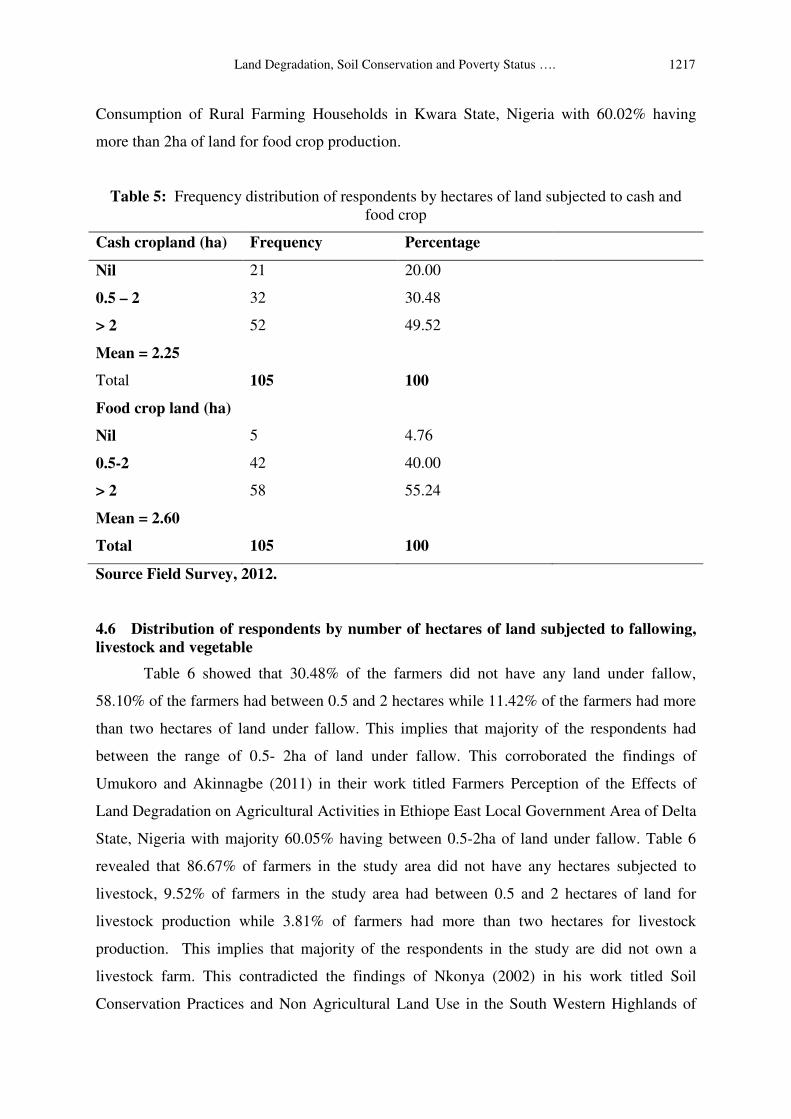
4.5 Distribution of respondents by number of hectares of land subjected to cash crop
Table 5 showed that number of hectares subject to cash cropland by the farmers in the
study area, which shows that 20% of the respondents did not have cash cropland, 30.48% of
the respondents had between 0.5 and 2 hectares while 49.52% of the respondents have more
than two hectares for cash crops production. This conformed to the findings of Oyekale
(2008), in his work titled Land Degradation, Soil Conservation practices and poverty
incidence in South Western, Nigeria. Table 5 showed that 4.76% of the respondents did not
have food crop land at all, 40% of the respondents had between 0.5 and 2 hectares while
55.24% of the respondents have more than two hectares for food crop production. This
implies that majority of the farmers were mainly into food crop production. This result is in
line with the findings of Olatinwo and Adewumi (2012) in their work titled Energy
����������������������������������������������Land Degradation, Soil Conservation and Poverty Status …. 1217�
�
�
Consumption of Rural Farming Households in Kwara State, Nigeria with 60.02% having
more than 2ha of land for food crop production.
Table 5: Frequency distribution of respondents by hectares of land subjected to cash and
food crop
Cash cropland (ha) Frequency Percentage
Nil 21 20.00
0.5 – 2 32 30.48
> 2 52 49.52
Mean = 2.25
Total 105 100
Food crop land (ha)
Nil 5 4.76
0.5-2 42 40.00
> 2 58 55.24
Mean = 2.60
Total 105 100
Source Field Survey, 2012.
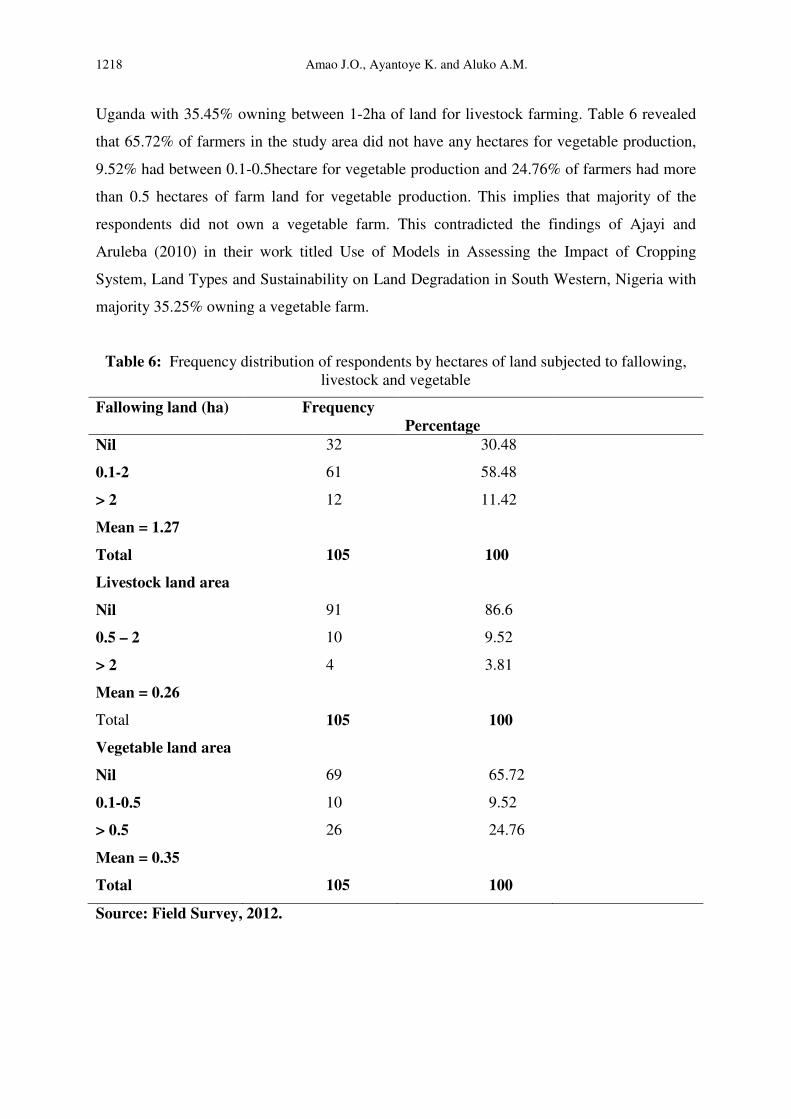
4.6 Distribution of respondents by number of hectares of land subjected to fallowing,
livestock and vegetable
Table 6 showed that 30.48% of the farmers did not have any land under fallow,
58.10% of the farmers had between 0.5 and 2 hectares while 11.42% of the farmers had more
than two hectares of land under fallow. This implies that majority of the respondents had
between the range of 0.5- 2ha of land under fallow. This corroborated the findings of
Umukoro and Akinnagbe (2011) in their work titled Farmers Perception of the Effects of
Land Degradation on Agricultural Activities in Ethiope East Local Government Area of Delta
State, Nigeria with majority 60.05% having between 0.5-2ha of land under fallow. Table 6
revealed that 86.67% of farmers in the study area did not have any hectares subjected to
livestock, 9.52% of farmers in the study area had between 0.5 and 2 hectares of land for
livestock production while 3.81% of farmers had more than two hectares for livestock
production. This implies that majority of the respondents in the study are did not own a
livestock farm. This contradicted the findings of Nkonya (2002) in his work titled Soil
Conservation Practices and Non Agricultural Land Use in the South Western Highlands of
1218 Amao J.O., Ayantoye K. and Aluko A.M.
Uganda with 35.45% owning between 1-2ha of land for livestock farming. Table 6 revealed
that 65.72% of farmers in the study area did not have any hectares for vegetable production,
9.52% had between 0.1-0.5hectare for vegetable production and 24.76% of farmers had more
than 0.5 hectares of farm land for vegetable production. This implies that majority of the
respondents did not own a vegetable farm. This contradicted the findings of Ajayi and
Aruleba (2010) in their work titled Use of Models in Assessing the Impact of Cropping
System, Land Types and Sustainability on Land Degradation in South Western, Nigeria with
majority 35.25% owning a vegetable farm.
Table 6: Frequency distribution of respondents by hectares of land subjected to fallowing,
livestock and vegetable
Fallowing land (ha) Frequency
Percentage
Nil 32 30.48
0.1-2 61 58.48
> 2 12 11.42
Mean = 1.27
Total 105 100
Livestock land area
Nil 91 86.6
0.5 – 2 10 9.52
> 2 4 3.81
Mean = 0.26
Total 105 100
Vegetable land area
Nil 69 65.72
0.1-0.5 10 9.52
> 0.5 26 24.76
Mean = 0.35
Total 105 100
Source: Field Survey, 2012.
����������������������������������������������Land Degradation, Soil Conservation and Poverty Status …. 1219�
�
�
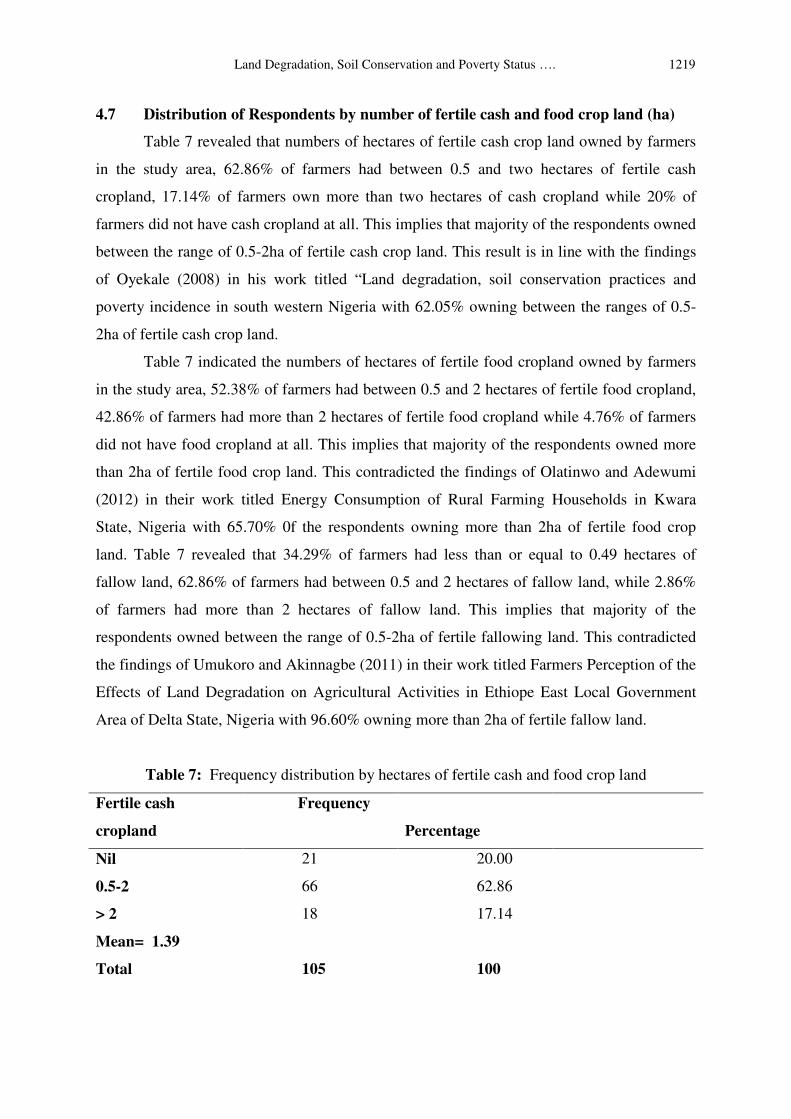
4.7 Distribution of Respondents by number of fertile cash and food crop land (ha)
Table 7 revealed that numbers of hectares of fertile cash crop land owned by farmers
in the study area, 62.86% of farmers had between 0.5 and two hectares of fertile cash
cropland, 17.14% of farmers own more than two hectares of cash cropland while 20% of
farmers did not have cash cropland at all. This implies that majority of the respondents owned
between the range of 0.5-2ha of fertile cash crop land. This result is in line with the findings
of Oyekale (2008) in his work titled “Land degradation, soil conservation practices and
poverty incidence in south western Nigeria with 62.05% owning between the ranges of 0.5-
2ha of fertile cash crop land.
Table 7 indicated the numbers of hectares of fertile food cropland owned by farmers
in the study area, 52.38% of farmers had between 0.5 and 2 hectares of fertile food cropland,
42.86% of farmers had more than 2 hectares of fertile food cropland while 4.76% of farmers
did not have food cropland at all. This implies that majority of the respondents owned more
than 2ha of fertile food crop land. This contradicted the findings of Olatinwo and Adewumi
(2012) in their work titled Energy Consumption of Rural Farming Households in Kwara
State, Nigeria with 65.70% 0f the respondents owning more than 2ha of fertile food crop
land. Table 7 revealed that 34.29% of farmers had less than or equal to 0.49 hectares of
fallow land, 62.86% of farmers had between 0.5 and 2 hectares of fallow land, while 2.86%
of farmers had more than 2 hectares of fallow land. This implies that majority of the
respondents owned between the range of 0.5-2ha of fertile fallowing land. This contradicted
the findings of Umukoro and Akinnagbe (2011) in their work titled Farmers Perception of the
Effects of Land Degradation on Agricultural Activities in Ethiope East Local Government
Area of Delta State, Nigeria with 96.60% owning more than 2ha of fertile fallow land.
Table 7: Frequency distribution by hectares of fertile cash and food crop land
Fertile cash
cropland
Frequency
Percentage
Nil 21 20.00
0.5-2 66 62.86
> 2 18 17.14
Mean= 1.39
Total 105 100
1220 Amao J.O., Ayantoye K. and Aluko A.M.
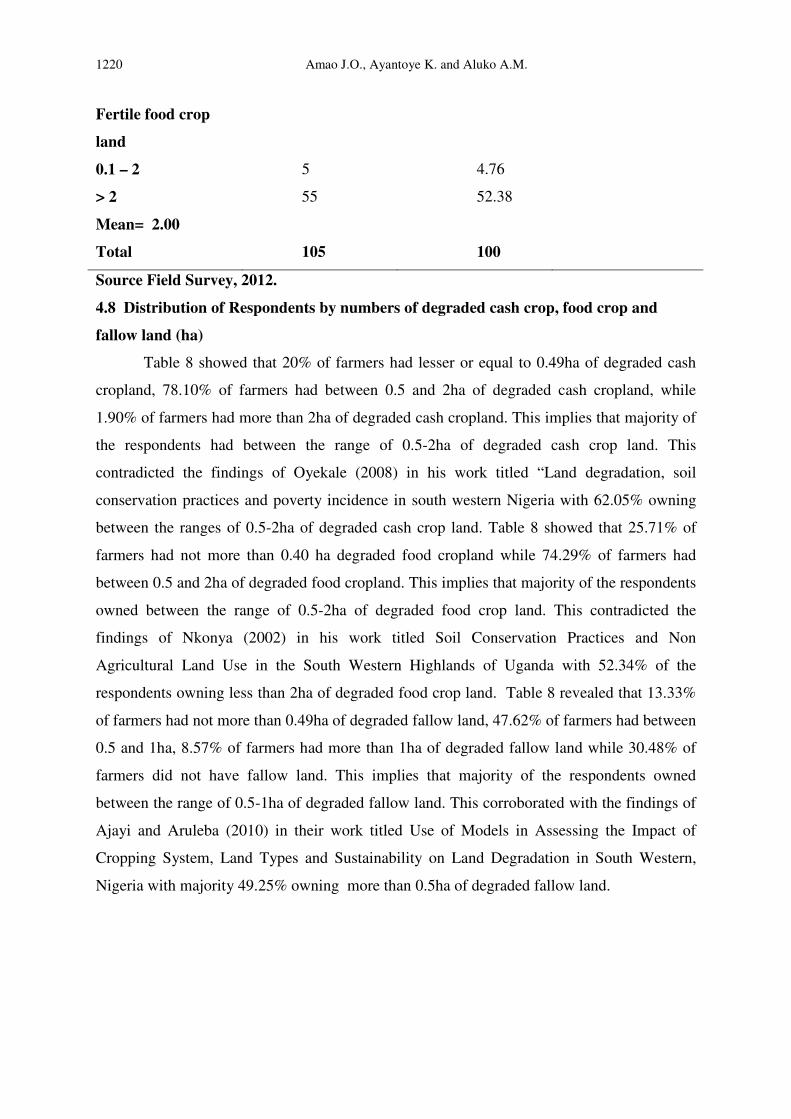
Fertile food crop
land
0.1 – 2 5 4.76
> 2 55 52.38
Mean= 2.00
Total 105 100
Source Field Survey, 2012.
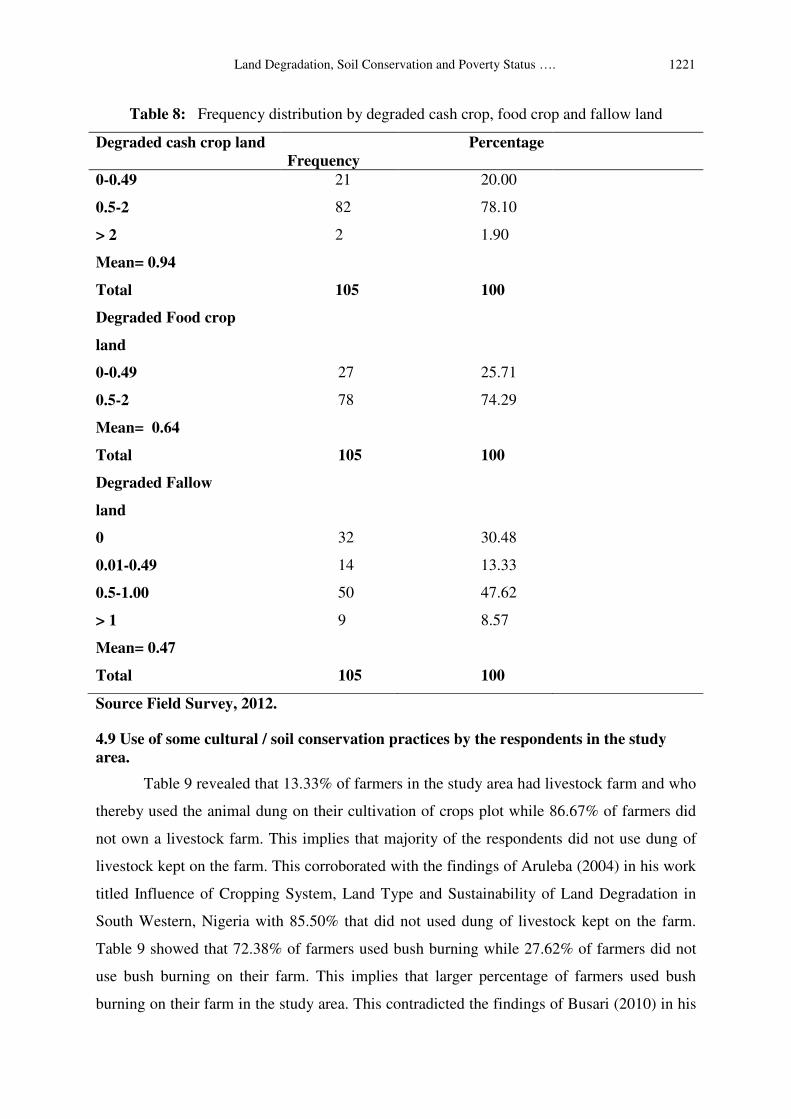
4.8 Distribution of Respondents by numbers of degraded cash crop, food crop and
fallow land (ha)
Table 8 showed that 20% of farmers had lesser or equal to 0.49ha of degraded cash
cropland, 78.10% of farmers had between 0.5 and 2ha of degraded cash cropland, while
1.90% of farmers had more than 2ha of degraded cash cropland. This implies that majority of
the respondents had between the range of 0.5-2ha of degraded cash crop land. This
contradicted the findings of Oyekale (2008) in his work titled “Land degradation, soil
conservation practices and poverty incidence in south western Nigeria with 62.05% owning
between the ranges of 0.5-2ha of degraded cash crop land. Table 8 showed that 25.71% of
farmers had not more than 0.40 ha degraded food cropland while 74.29% of farmers had
between 0.5 and 2ha of degraded food cropland. This implies that majority of the respondents
owned between the range of 0.5-2ha of degraded food crop land. This contradicted the
findings of Nkonya (2002) in his work titled Soil Conservation Practices and Non
Agricultural Land Use in the South Western Highlands of Uganda with 52.34% of the
respondents owning less than 2ha of degraded food crop land. Table 8 revealed that 13.33%
of farmers had not more than 0.49ha of degraded fallow land, 47.62% of farmers had between
0.5 and 1ha, 8.57% of farmers had more than 1ha of degraded fallow land while 30.48% of
farmers did not have fallow land. This implies that majority of the respondents owned
between the range of 0.5-1ha of degraded fallow land. This corroborated with the findings of
Ajayi and Aruleba (2010) in their work titled Use of Models in Assessing the Impact of
Cropping System, Land Types and Sustainability on Land Degradation in South Western,
Nigeria with majority 49.25% owning more than 0.5ha of degraded fallow land.
����������������������������������������������Land Degradation, Soil Conservation and Poverty Status …. 1221�
�
�
Table 8: Frequency distribution by degraded cash crop, food crop and fallow land
Degraded cash crop land
Frequency
Percentage
0-0.49 21 20.00
0.5-2 82 78.10
> 2 2 1.90
Mean= 0.94
Total 105 100
Degraded Food crop
land
0-0.49 27 25.71
0.5-2 78 74.29
Mean= 0.64
Total 105 100
Degraded Fallow
land
0 32 30.48
0.01-0.49 14 13.33
0.5-1.00 50 47.62
> 1 9 8.57
Mean= 0.47
Total 105 100
Source Field Survey, 2012.
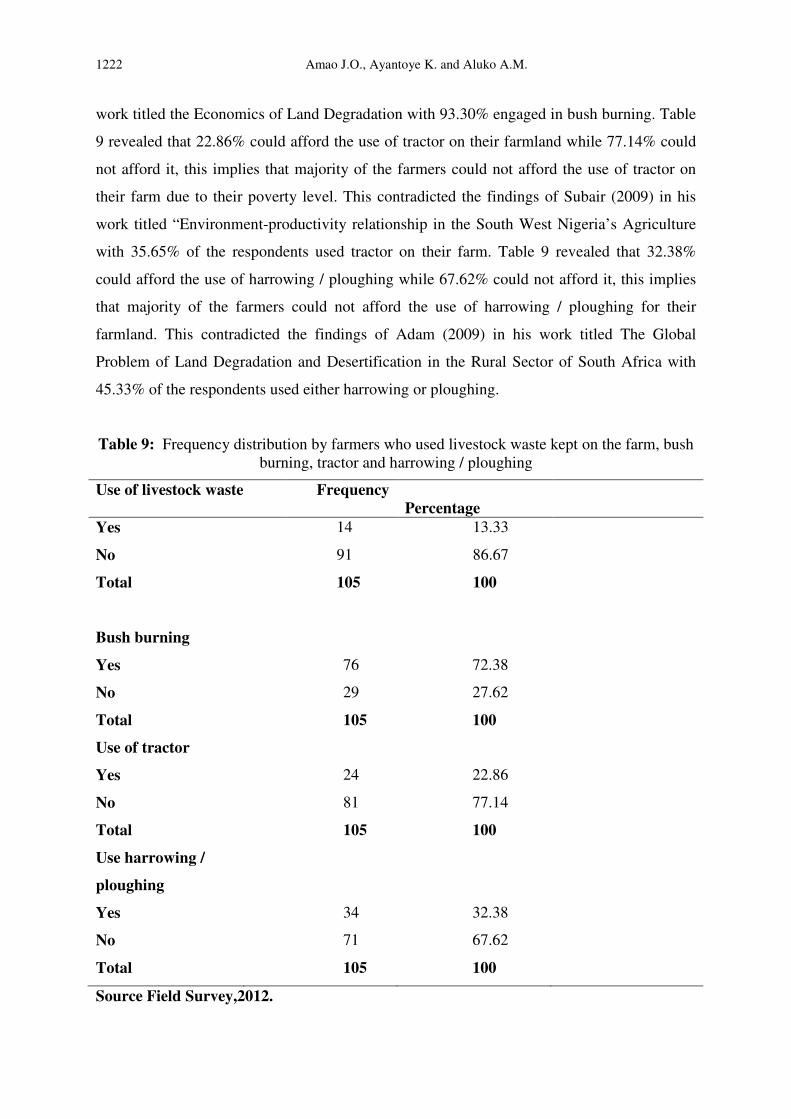
4.9 Use of some cultural / soil conservation practices by the respondents in the study
area.
Table 9 revealed that 13.33% of farmers in the study area had livestock farm and who
thereby used the animal dung on their cultivation of crops plot while 86.67% of farmers did
not own a livestock farm. This implies that majority of the respondents did not use dung of
livestock kept on the farm. This corroborated with the findings of Aruleba (2004) in his work
titled Influence of Cropping System, Land Type and Sustainability of Land Degradation in
South Western, Nigeria with 85.50% that did not used dung of livestock kept on the farm.
Table 9 showed that 72.38% of farmers used bush burning while 27.62% of farmers did not
use bush burning on their farm. This implies that larger percentage of farmers used bush
burning on their farm in the study area. This contradicted the findings of Busari (2010) in his
1222 Amao J.O., Ayantoye K. and Aluko A.M.
work titled the Economics of Land Degradation with 93.30% engaged in bush burning. Table
9 revealed that 22.86% could afford the use of tractor on their farmland while 77.14% could
not afford it, this implies that majority of the farmers could not afford the use of tractor on
their farm due to their poverty level. This contradicted the findings of Subair (2009) in his
work titled “Environment-productivity relationship in the South West Nigeria’s Agriculture
with 35.65% of the respondents used tractor on their farm. Table 9 revealed that 32.38%
could afford the use of harrowing / ploughing while 67.62% could not afford it, this implies
that majority of the farmers could not afford the use of harrowing / ploughing for their
farmland. This contradicted the findings of Adam (2009) in his work titled The Global
Problem of Land Degradation and Desertification in the Rural Sector of South Africa with
45.33% of the respondents used either harrowing or ploughing.
Table 9: Frequency distribution by farmers who used livestock waste kept on the farm, bush
burning, tractor and harrowing / ploughing
Use of livestock waste Frequency
Percentage
Yes 14 13.33
No 91 86.67
Total 105 100
Bush burning
Yes 76 72.38
No 29 27.62
Total 105 100
Use of tractor
Yes 24 22.86
No 81 77.14
Total 105 100
Use harrowing /
ploughing
Yes 34 32.38
No 71 67.62
Total 105 100
Source Field Survey,2012.
����������������������������������������������Land Degradation, Soil Conservation and Poverty Status …. 1223�
�
�
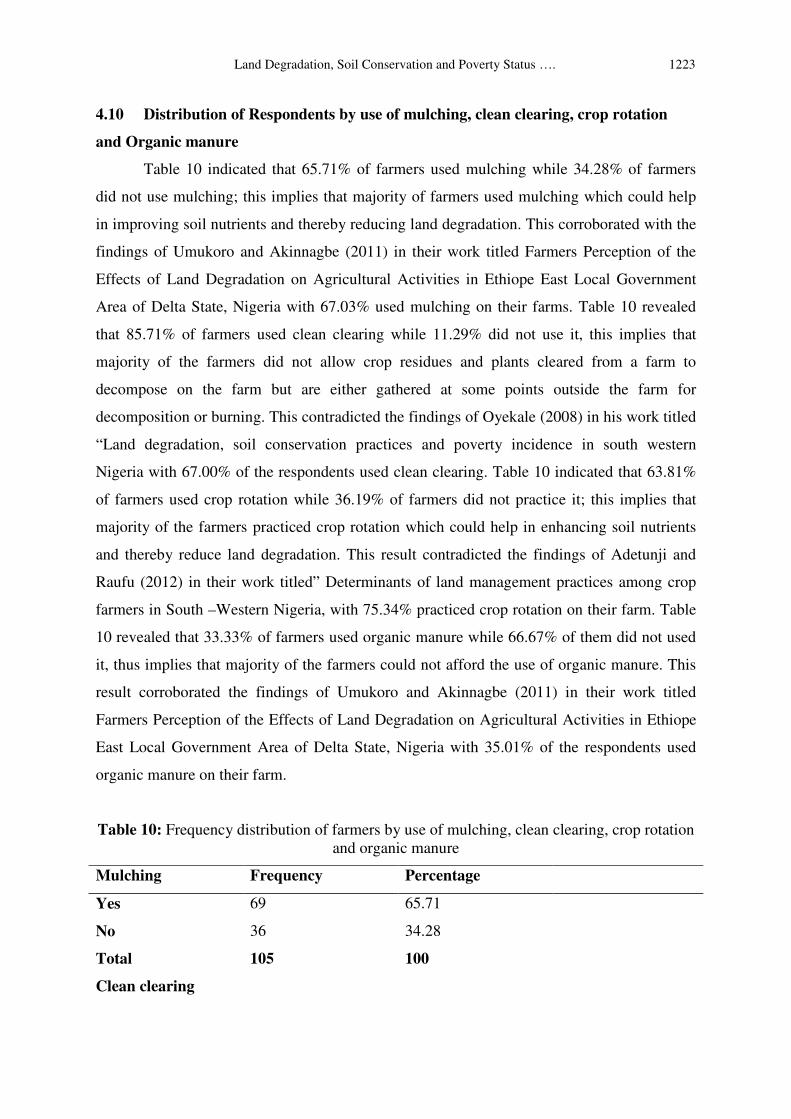
4.10 Distribution of Respondents by use of mulching, clean clearing, crop rotation
and Organic manure
Table 10 indicated that 65.71% of farmers used mulching while 34.28% of farmers
did not use mulching; this implies that majority of farmers used mulching which could help
in improving soil nutrients and thereby reducing land degradation. This corroborated with the
findings of Umukoro and Akinnagbe (2011) in their work titled Farmers Perception of the
Effects of Land Degradation on Agricultural Activities in Ethiope East Local Government
Area of Delta State, Nigeria with 67.03% used mulching on their farms. Table 10 revealed
that 85.71% of farmers used clean clearing while 11.29% did not use it, this implies that
majority of the farmers did not allow crop residues and plants cleared from a farm to
decompose on the farm but are either gathered at some points outside the farm for
decomposition or burning. This contradicted the findings of Oyekale (2008) in his work titled
“Land degradation, soil conservation practices and poverty incidence in south western
Nigeria with 67.00% of the respondents used clean clearing. Table 10 indicated that 63.81%
of farmers used crop rotation while 36.19% of farmers did not practice it; this implies that
majority of the farmers practiced crop rotation which could help in enhancing soil nutrients
and thereby reduce land degradation. This result contradicted the findings of Adetunji and
Raufu (2012) in their work titled” Determinants of land management practices among crop
farmers in South –Western Nigeria, with 75.34% practiced crop rotation on their farm. Table
10 revealed that 33.33% of farmers used organic manure while 66.67% of them did not used
it, thus implies that majority of the farmers could not afford the use of organic manure. This
result corroborated the findings of Umukoro and Akinnagbe (2011) in their work titled
Farmers Perception of the Effects of Land Degradation on Agricultural Activities in Ethiope
East Local Government Area of Delta State, Nigeria with 35.01% of the respondents used
organic manure on their farm.
Table 10: Frequency distribution of farmers by use of mulching, clean clearing, crop rotation
and organic manure
Mulching Frequency Percentage
Yes 69 65.71
No 36 34.28
Total 105 100
Clean clearing
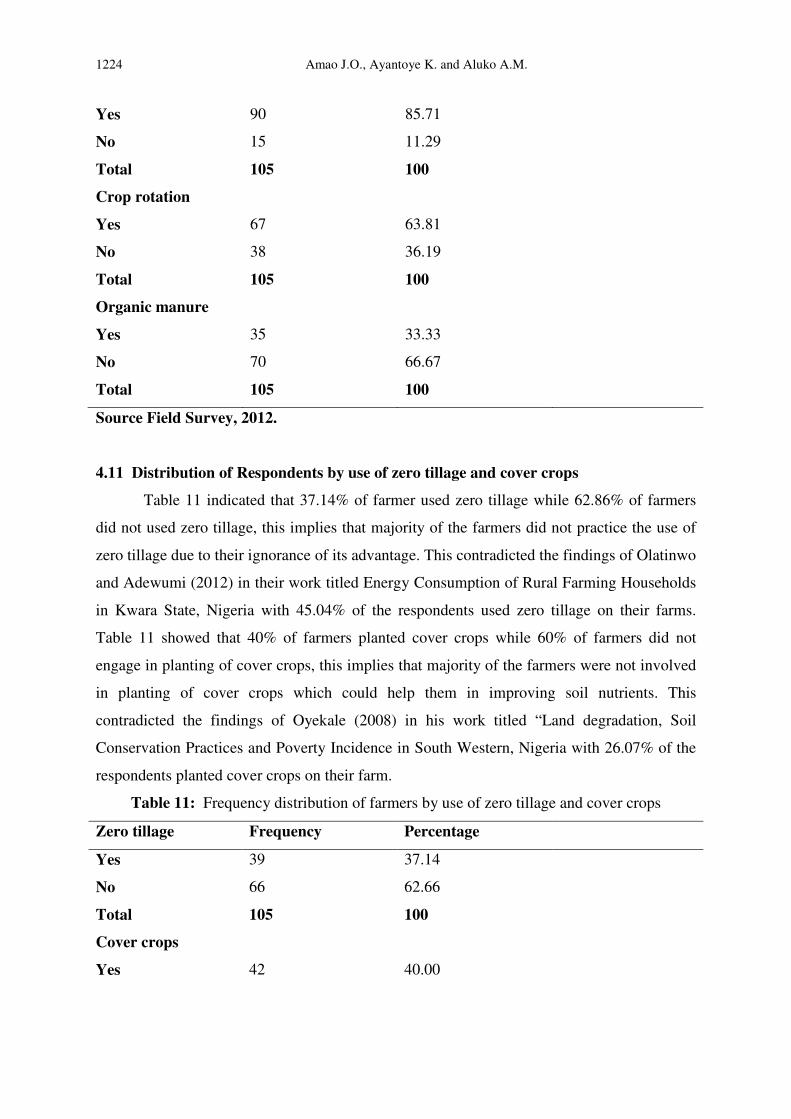
1224 Amao J.O., Ayantoye K. and Aluko A.M.
Yes 90 85.71
No 15 11.29
Total 105 100
Crop rotation
Yes 67 63.81
No 38 36.19
Total 105 100
Organic manure
Yes 35 33.33
No 70 66.67
Total 105 100
Source Field Survey, 2012.
4.11 Distribution of Respondents by use of zero tillage and cover crops
Table 11 indicated that 37.14% of farmer used zero tillage while 62.86% of farmers
did not used zero tillage, this implies that majority of the farmers did not practice the use of
zero tillage due to their ignorance of its advantage. This contradicted the findings of Olatinwo
and Adewumi (2012) in their work titled Energy Consumption of Rural Farming Households
in Kwara State, Nigeria with 45.04% of the respondents used zero tillage on their farms.
Table 11 showed that 40% of farmers planted cover crops while 60% of farmers did not
engage in planting of cover crops, this implies that majority of the farmers were not involved
in planting of cover crops which could help them in improving soil nutrients. This
contradicted the findings of Oyekale (2008) in his work titled “Land degradation, Soil
Conservation Practices and Poverty Incidence in South Western, Nigeria with 26.07% of the
respondents planted cover crops on their farm.
Table 11: Frequency distribution of farmers by use of zero tillage and cover crops
Zero tillage Frequency Percentage
Yes 39 37.14
No 66 62.66
Total 105 100
Cover crops
Yes 42 40.00
����������������������������������������������Land Degradation, Soil Conservation and Poverty Status …. 1225�
�
�
No 63 60.00
Total 105 100
Source Field Survey, 2012.
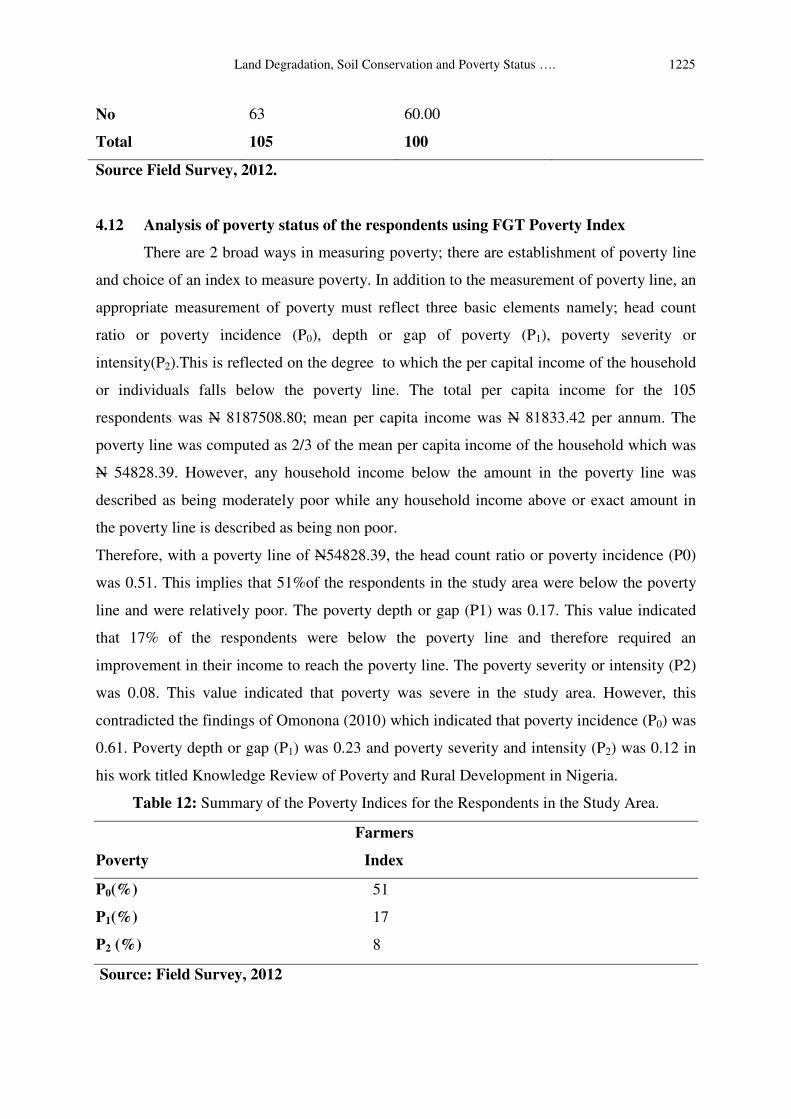
4.12 Analysis of poverty status of the respondents using FGT Poverty Index
There are 2 broad ways in measuring poverty; there are establishment of poverty line
and choice of an index to measure poverty. In addition to the measurement of poverty line, an
appropriate measurement of poverty must reflect three basic elements namely; head count
ratio or poverty incidence (P0), depth or gap of poverty (P1), poverty severity or
intensity(P2).This is reflected on the degree to which the per capital income of the household
or individuals falls below the poverty line. The total per capita income for the 105
respondents was N 8187508.80; mean per capita income was N 81833.42 per annum. The
poverty line was computed as 2/3 of the mean per capita income of the household which was
N 54828.39. However, any household income below the amount in the poverty line was
described as being moderately poor while any household income above or exact amount in
the poverty line is described as being non poor.
Therefore, with a poverty line of N54828.39, the head count ratio or poverty incidence (P0)
was 0.51. This implies that 51%of the respondents in the study area were below the poverty
line and were relatively poor. The poverty depth or gap (P1) was 0.17. This value indicated
that 17% of the respondents were below the poverty line and therefore required an
improvement in their income to reach the poverty line. The poverty severity or intensity (P2)
was 0.08. This value indicated that poverty was severe in the study area. However, this
contradicted the findings of Omonona (2010) which indicated that poverty incidence (P0) was
0.61. Poverty depth or gap (P1) was 0.23 and poverty severity and intensity (P2) was 0.12 in
his work titled Knowledge Review of Poverty and Rural Development in Nigeria.
Table 12: Summary of the Poverty Indices for the Respondents in the Study Area.
Farmers
Poverty Index
P0(%) 51
P1(%) 17
P2 (%) 8
Source: Field Survey, 2012
1226 Amao J.O., Ayantoye K. and Aluko A.M.
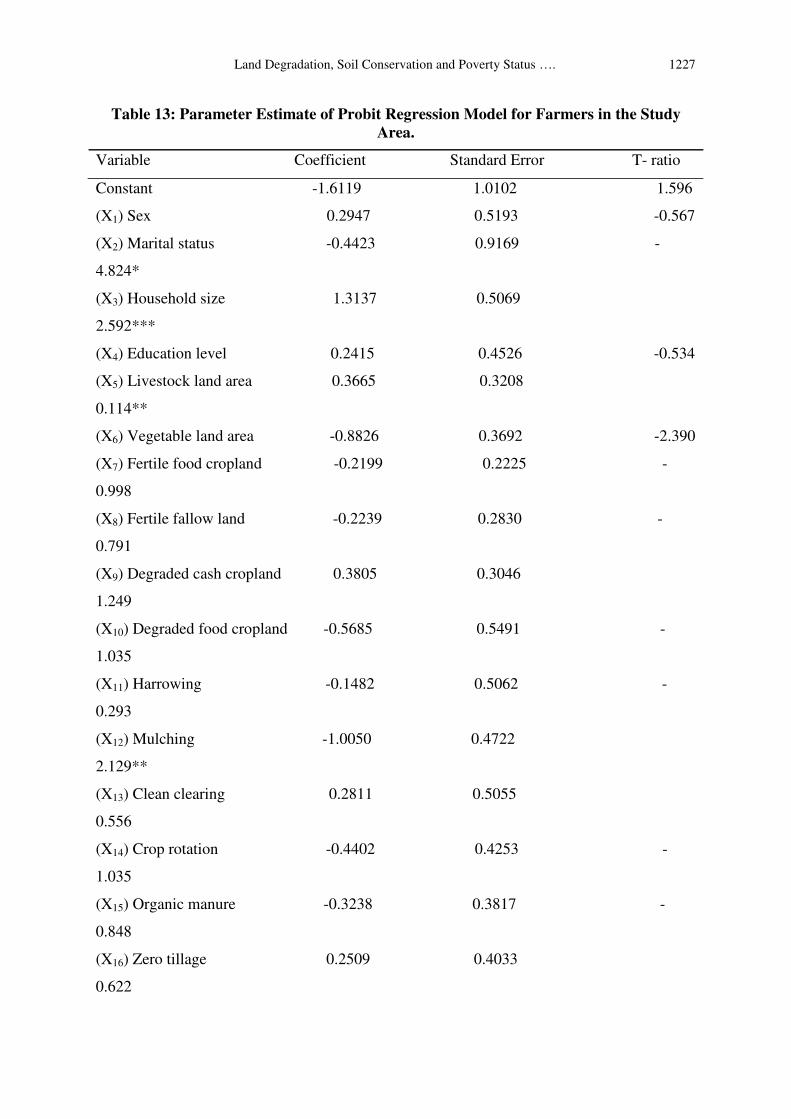
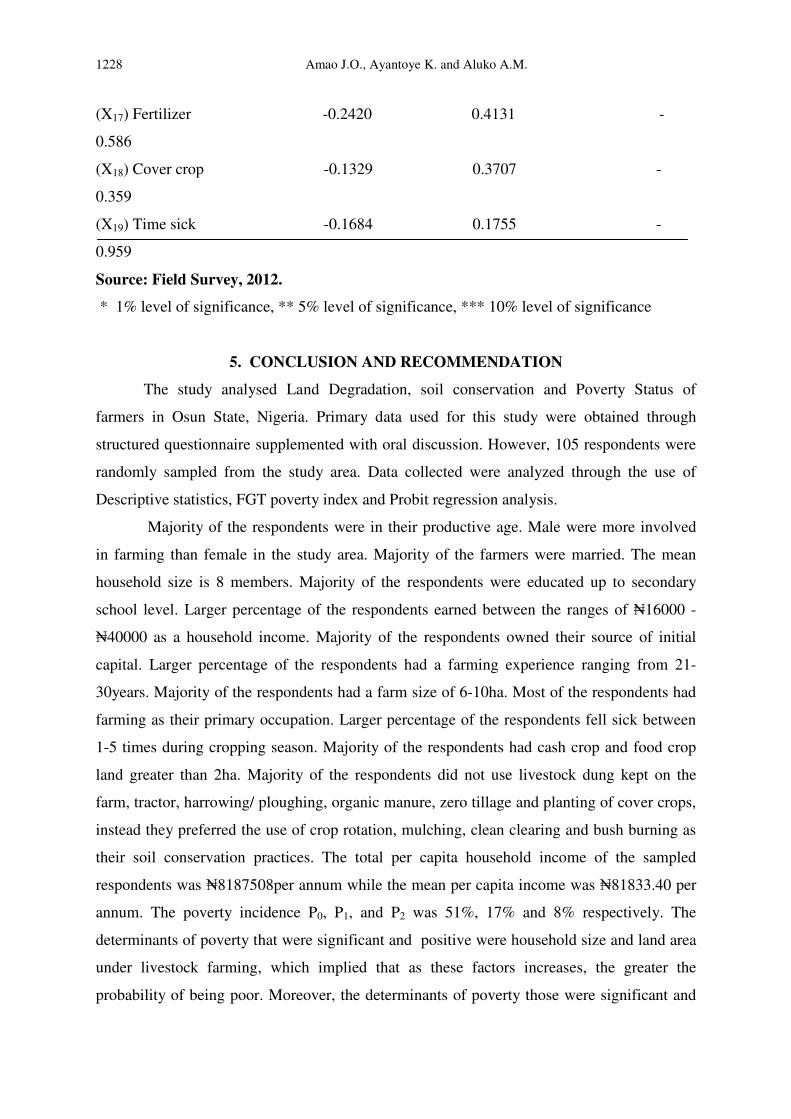
4.13 Determinants of Poverty among Respondents in the Study Area.
Table 13 showed the determinants of poverty in the study area using Probit regression
model. The following variables had a positive and a direct relationship: Sex (X1) of the
respondents which implies that as they move from male to female there is probability of
being poor, Household size (X3) of the respondents, which implies that as the household size
increases the greater the probability of being poor among the farmers, Educational
qualification (X4), which implies as the level of education increases the greater the
probability of being poor, Land area under livestock farming (ha) (X5), which implies that
increasing land areas devoted for livestock production increases the probability of being poor,
Degraded cash cropland(ha) (X9),which implies an increase in the hectare of degraded cash
cropland increases the probability of being poor, Clean clearing(X13),Zero tillage(X16),which
implies an increase in the practice of zero tillage increases the probability of being poor in the
study area. This contradicted the findings of Oyekale (2008) in his study of Land
Degradation, Soil Conservation Practices and Poverty Incidence in South Western, Nigeria
where educational qualification had a negative coefficient and an inverse relationship.
The following variables had a negative coefficient and an inverse relationship; Marital
status (X2), which implies that as the marital status increases the lower the probability of
being poor, Land area under vegetable production (X6),Fertile food cropland areas (X7),(
Fertile fallow land (ha) X8), Degraded food cropland(ha) (X10), Harrowing(X11), Crop
rotation(X14),Organic manure(X15), Fertilizer Application(X17),Cover crops(X18) and number
of times sick during cropping season(X19) which implies that the more the respondents
engaged themselves in the above , the lower the probability of being poor. This contradicted
the findings of Subair (2009) in his work titled “Environment-productivity relationship in the
South West Nigeria’s Agriculture, where degraded food cropland and degraded cash cropland
both had a positive coefficient and direct relationship. The following variables were
significant at 1%, 5%, and 10% level: Marital status(X2) was significant at 1% level;
Household size was significant at 10% level, Land area under livestock production (ha) (X5)
was significant at 5% level and Mulching (X12) at 5% level. This showed that all these
variables were important factors that determined the level of poverty among the respondents
in the study area. This contradicted the findings of Oyekale (2008) in his study of Land
Degradation, Soil Conservation Practices and Poverty Incidence in South Western, Nigeria
where mulching was not a significant factor in determining poverty in the study area.
����������������������������������������������Land Degradation, Soil Conservation and Poverty Status …. 1227�
�
�
Table 13: Parameter Estimate of Probit Regression Model for Farmers in the Study
Area.
Variable Coefficient Standard Error T- ratio
Constant -1.6119 1.0102 1.596
(X1) Sex 0.2947 0.5193 -0.567
(X2) Marital status -0.4423 0.9169 -
4.824*
(X3) Household size 1.3137 0.5069
2.592***
(X4) Education level 0.2415 0.4526 -0.534
(X5) Livestock land area 0.3665 0.3208
0.114**
(X6) Vegetable land area -0.8826 0.3692 -2.390
(X7) Fertile food cropland -0.2199 0.2225 -
0.998
(X8) Fertile fallow land -0.2239 0.2830 -
0.791
(X9) Degraded cash cropland 0.3805 0.3046
1.249
(X10) Degraded food cropland -0.5685 0.5491 -
1.035
(X11) Harrowing -0.1482 0.5062 -
0.293
(X12) Mulching -1.0050 0.4722
2.129**
(X13) Clean clearing 0.2811 0.5055
0.556
(X14) Crop rotation -0.4402 0.4253 -
1.035
(X15) Organic manure -0.3238 0.3817 -
0.848
(X16) Zero tillage 0.2509 0.4033
0.622
1228 Amao J.O., Ayantoye K. and Aluko A.M.
(X17) Fertilizer -0.2420 0.4131 -
0.586
(X18) Cover crop -0.1329 0.3707 -
0.359
(X19) Time sick -0.1684 0.1755 -
0.959
Source: Field Survey, 2012.
* 1% level of significance, ** 5% level of significance, *** 10% level of significance
5. CONCLUSION AND RECOMMENDATION
The study analysed Land Degradation, soil conservation and Poverty Status of
farmers in Osun State, Nigeria. Primary data used for this study were obtained through
structured questionnaire supplemented with oral discussion. However, 105 respondents were
randomly sampled from the study area. Data collected were analyzed through the use of
Descriptive statistics, FGT poverty index and Probit regression analysis.
Majority of the respondents were in their productive age. Male were more involved
in farming than female in the study area. Majority of the farmers were married. The mean
household size is 8 members. Majority of the respondents were educated up to secondary
school level. Larger percentage of the respondents earned between the ranges of �16000 -
�40000 as a household income. Majority of the respondents owned their source of initial
capital. Larger percentage of the respondents had a farming experience ranging from 21-
30years. Majority of the respondents had a farm size of 6-10ha. Most of the respondents had
farming as their primary occupation. Larger percentage of the respondents fell sick between
1-5 times during cropping season. Majority of the respondents had cash crop and food crop
land greater than 2ha. Majority of the respondents did not use livestock dung kept on the
farm, tractor, harrowing/ ploughing, organic manure, zero tillage and planting of cover crops,
instead they preferred the use of crop rotation, mulching, clean clearing and bush burning as
their soil conservation practices. The total per capita household income of the sampled
respondents was �8187508per annum while the mean per capita income was �81833.40 per
annum. The poverty incidence P0, P1, and P2 was 51%, 17% and 8% respectively. The
determinants of poverty that were significant and positive were household size and land area
under livestock farming, which implied that as these factors increases, the greater the
probability of being poor. Moreover, the determinants of poverty those were significant and
����������������������������������������������Land Degradation, Soil Conservation and Poverty Status …. 1229�
�
�
negative were marital status and mulching, which implied that as these determinants
increases the lower the probability of being poor among the respondents in the study area.
Based on the findings of this study; it was observed that an increase in household size
will increase the probability of being poor. It is thereby recommended that efforts should be
made to sensitize farmers in Osun State on the need and way of population control to yield
positive results and also help reduce their poverty level. As it was observed from this study
that respondents preferred food crop production which tend to increase their probability of
being poor than cash crop production, it is thereby recommended that there should be
diversification into cash crop production to increase their level of household income. As it
was revealed in the course of this study that majority of the respondents preferred the use of
crop rotation, mulching, clean clearing and bush burning, it is thereby recommended that
agricultural extension officers should liaise with research institutes in order to disseminate
proven soil management techniques to the farmers.
REFERENCES
[1] Adetunji M.O and Raufu M.O. (2012); Determinant of Land Management Practices
among Crop Farmers in South-Western Nigeria. Global Journal GJSFR 12 (1): 9-14.
[2] Ajayi, A. S. and Aruleba, J.O. (2010): Use of Models in Assessing the Impact of
Cropping System, Land Types and Suitability on Land Degradation in South Western,
Nigeria African journal of Agricultural Research, Vol.5(23), PP 3169 – 3175.
[3] Akamigbo, F.O.R (2005). Increased agricultural activities in the South East and South-
South geopolitical zones: Environmental Imperatives. Delivered at the 20th REFILS
workshop at NRCRI, Umudike
[4] Aruleba, J.O (2004): Influence of Cropping System, Land Type and Sustainability of
Land Degradation in South Western, Nigeria. A Ph.D Thesis of University of Ibadan, pp
244.
[5] Bangladesh, C.A, (2001): Erosion and Soil Productivity in Africa. Journal of Soil and
Water Conservation, 45(3), 431–436.
[6] Busari, O. (2010): The Economics of Land Degradation and Rural Poverty Linkage.
Journal of Environmental Affairs, Vol. 12(1), PP 319 – 328.
[7] Dixon, G. and Peter, C.B. (2001): The Role of the State and Individual in Sustainable
Land Management in the Developing Countries. Journal of Agricultural and Environmental
Ethics, Vol. 10 No.2, PP. 41 – 54.
1230 Amao J.O., Ayantoye K. and Aluko A.M.
[8] Eniola, D. I., Upla, J. I., Oko, C. O. Obiefuna, J. N. and Njar, G. N. (2010): Effects of
Land Degradation on Soil Productivity in Calabar South Local Government Area, Nigeria.
European Journal of Social Sciences – Volume 18, No. 1, pp. 166-171.
[9] Estwaran, H., Lal, R. and Reich, P.F. (2001): An Overview in Responses to Land
Degradation. 2nd
international conference on Land Degradation, PP 1- 4.
[10] FAO, (2003): Food and Agricultural Organization, Nigeria Land Resource Management
Study. Main Report and Annex 1. Rome: FAO, pp 6.
[11] Fitsum, H; Pender, J. and Nega, G. (2009): Land Degradation in the Highland of Tigray
and Strategies for Sustainable Land Management. Socio-economic and Policy research
working Paper No.2, pp 113-122.
[12] Foster, J.E, Greer, J. and Thorbecke E. (1984): A Class of Decomposable Poverty
Measure. Econometrica, 52 (1): 761 – 766.
[13] Kakwani, N., (1990): Poverty and Economic growth with application of Cote D’Ivoire.
Living Standards Measurement Survey No 63.
[14] Lan, C. and Ragnar, O. (2007): Land Degradation, environmental degradation and
diversification in Africa. American Jour. of Agricultural Economics, 88 (5), pp 1135 – 1146.
[15] Nkonya, E. (2002): Soil Conservation Practices and Non Agricultural Land Use in the
South Western Highlands of Uganda. International Food Policy Research Institute (IFPRI),
Vol. 6(2), pp 63-75.
[16] Nkonya, E., Nicolas, G. Joachin, V.B and Alex D.P. (2011): Economics of Land
Degradation in South Asia. International Food Policy Research Institute (IFPRI), Issue 68,
pp 56-72.
[17] NPC, (2006): National Population Commission, Population Figure. Federal Republic of
Nigeria, Abuja. Retrieved from http://www.npc.gov
[18] Olatinwo, K.B and Adewumi, M.O (2012): Energy Consumption of Rural farming
Households in Kwara State, Nigeria. Journal of Sustainable Development in Africa, 14(2)67-
70.
[19] Okoruwa V.O, Omobowale, A.O and Oyekale, A.S (2009): The Structure and
Determinants of Land-Use intensity among crop farmers in South Western, Nigeria. Journal
of Agricultural Sciences 3(1) 456 – 475.
[20] Ogunleye, K.Y., Thomas,K. and Oyebade, S.O (2010): Marketing Extension Needs for
Sustainable Extension Practices among Cassava Farmers in Surulere Local Government of
Oyo State. Journal of Agricultural Extension, Vol. 14(1), PP. 4 – 6.
����������������������������������������������Land Degradation, Soil Conservation and Poverty Status …. 1231�
�
�
[21] Oyekale, A.S. (2008): Land Degradation, Soil conservation Practices and Poverty
incidence in South Western Nigeria. Agricultural Journal 3 (6): 482 -487.
[22] Omonona, B.T. (2010): Knowledge Review of Poverty and Rural Development in
Nigeria. International Food Policy Research Institute (IFPRI) No.03, Pp 1 -3.
[23] Sara, J.S. and Satya, Y. (2009): Soil Degradation: A Threat to Developing Country Food
Security by 2020. International Food Policy Research Institute.14(3)17-48.
[24] Senjobi, B.A. (2007). Parametric and conventional approaches for soil potential
evaluation in three ecological zones of southern Nigeria. Moor Journal of Agricultural
Research 2(2): 91-102.
[25] Senjobi, B. A and Ogunkunle, A.O (2010): Effect of Different Land Use types and their
Implications on Land Degradation and Productivity in Ogun State, Nigeria. Journal of
Agricultural Biotechnology and Sustainable Development 3(1): 7 – 18.
[26] Steeten, P. and Burki, S.J (2008): Analytical Framework for Poverty Reduction.
American Journal of agricultural Economics, 4(6)224 -227.
[27] Subair, K. (2009): Environment – Productivity Relationship in the South West Nigeria’s
Agriculture. International Journal of Environmental Affairs, 27(1); 75 – 84.
[28] Titilola S.O. and Jeje, L.K, (2008): Environmental Degradation and its Implications for
Agricultural and Rural Development: The Issue of Land Erosion. Journal of Sustainable
Development in Africa,10 (2): 116-146.
[29] Umeh J.C, Okwoche B.C and Asogwa B.C (2012): Analyzing the Determinants of
Poverty Severity among Rural Farmers in Nigeria. American Research Journal of
Contemporary Research, Vol 2, No. 5, Pp 94 – 97.
[30] Umukoro, E. and Akinnagbe, O. (2011): Farmers’ Perception of the Effects of Land
Degradation on Agricultural Activites in Ethiope East Local Government Area of Delta
State, Nigeria. Scientific Journals of Croatia, 76(2)135 -141.
�