Embed Size (px)
Citation preview
LAND USE/LAND COVER CHANGES AND ASSOCIATED DRIVING FORCES IN
BALE ECO-REGION, ETHIOPIA
MSc. THESIS
BY: ADANE MEZGEBU NIGUSSIE
HAWASSA UNIVERSITY WONDO GENET COLLEGE OF FORESTRY AND NATURAL
RESOURCES, WONDO GENET, ETHIOPIA
DECEMBER, 2016
LAND USE/LAND COVER CHANGES AND ASSOCIATED DRIVING FORCES IN
BALE ECO-REGION, ETHIOPIA
BY: ADANE MEZGEBU NIGUSSIE
A THESIS SUBMITTED TO SCHOOL OF NATURAL RESOURCE AND
ENVIRONMENTAL STUDIES, HAWASSA UNIVERSITY WONDO GENET COLLEGE
OF FORESTRY AND NATURAL RESOURCES, HAWASSA UNIVERSITY, WONDO
GENET, ETHIOPIA
IN PARTIAL FULFILLMENT OF THE REQUIREMENT FOR THE DEGREE OF
MASTER OF SCIENCE IN CLIMATE CHANGE AND DEVELOPMENT
DECEMBER, 2016
Approval sheet I
This is to certify that the thesis entitled “Land Use/Land Cover Changes and Associated
Driving Forces in Bale Eco-Region, Ethiopia” submitted in partial fulfillment of the
requirement for the degree of Master’s with specialization in Climate change and
Development, the graduate program of the school of Natural Resources and Environmental
Studies, and has been carried out by Adane Mezgebu Id. No MSc/CcDe/R002/07, under my
supervision. Therefore, I recommend that the student has fulfilled the requirements and hence
hereby can submit the thesis to the department.
Motuma Tolera (PhD) _______________ ____________
Name of Major Advisor Signature Date
Menfese Tadesse (PhD) _________________ ____________
Name of co-advisor Signature Date
Approval sheet II
We the undersigned members of the Board of Examiners of the final open defense by Adane
Mezgebu have read and evaluated his thesis entitled “Land Use/Land Cover Changes and
Associated Driving Forces in Bale Eco-Region, Ethiopia” and examined the candidate.
Accordingly this is to certify that the thesis has been accepted in partial fulfillment of the
requirement for the degree of Master of Science.
__________________ _______________ ____________
Name of the Chairperson Signature Date
_____________________ _________________ ____________
Name of Major Advisor Signature Date
________________________ _______________ ____________
Name of Internal Examiner Signature Date
________________________ _________________ ____________
Name of External Examiner Signature Date
i
Acknowledgement
First of all my everlasting thanks go for the Almighty God to his eternal love and kindness.
This thesis has been possible with the help of many peoples. My special thanks go to my two
advisors Dr. Motuma Tolera and Dr. Menfese Tadesse for their indispensable support in all
stage of my thesis. I deeply thanks them for devoting their precious time in reading,
commenting and correcting my thesis.
I am also thankful to Bale Zone agriculture bureau, Wereda offices in Goba, Harena Buluk
and Delo Mena, farmers and field guides for their immeasurable cooperation and participation
during the course of data collection.
Many thanks also go to the SHARE Bale project in Bale Eco-Region for facilitating and
financing this study and to Hawassa University for allowing me to stud my MSc. in Wondo
Genet
I thank my beloved friend Mr. Getachew Werkineh who took his precious time to review and
comment my thesis. And I am thankful to my family Ato Mezgebu Nigussie and W/ro Abebu
Asefa and my aunt Abonesh Nigussie for their endless support and encouragement.
At last but not the least I thank all my classmates in Wondo Genet College of Forestry and
Natural resource, Climate change and Development department for their support and
suggestions.
.
ii
Table of Contents
Acknowledgement ....................................................................................................................... i
Table of Contents ....................................................................................................................... ii
Dedication ................................................................................................................................... v
Acronyms and Abbreviations .................................................................................................... vi
List of Tables .......................................................................................................................... viii
List of Figures ............................................................................................................................ ix
List of Appendixes ...................................................................................................................... x
1 INTRODUCTION ............................................................................................................... 1
1.1 Background .................................................................................................................. 1
1.2 Statement of the Problem ............................................................................................. 3
1.3 Objectives of the Study ................................................................................................ 5
1.3.1 General Objective ................................................................................................. 5
1.3.2 Specific Objectives ............................................................................................... 5
1.4 Research Questions ...................................................................................................... 6
1.5 Significance of the Study ............................................................................................. 6
1.6 Scope of the Study ....................................................................................................... 7
2 LITERATURE REVIEW .................................................................................................... 8
2.1 Land Use/ Land Cover Change: Definition and Concepts ........................................... 8
2.2 Drivers of Land Use/Land Cover Change .................................................................... 9
2.2.1 Proximate Causes ................................................................................................ 10
2.2.2 Underlying Causes .............................................................................................. 10
2.3 Application of Remote Sensing and GIS Techniques for LU/LCC Study................. 13
2.4 Modeling Land Use/Land Cover Change .................................................................. 14
iii
2.4.1 Markov Chain Modeling ..................................................................................... 15
2.5 LU/LCC at Global Perspective .................................................................................. 17
2.6 State of LU/LCC in Ethiopia...................................................................................... 18
3 METHODS AND MATERIALS ...................................................................................... 21
3.1 Description of Study Area .......................................................................................... 21
3.1.1 Location .............................................................................................................. 21
3.1.2 Demographic and Socio-Economic Characteristics ........................................... 22
3.1.3 Biophysical Characteristics................................................................................. 23
3.2 Study Site Selection Procedures................................................................................. 25
3.3 Sources and Types of Data ......................................................................................... 27
3.4 Data Acquisition......................................................................................................... 27
3.4.1 Satellite Image and GIS Data Collection ............................................................ 27
3.4.2 Field Survey and Data Collection ....................................................................... 29
3.5 Data Analysis ............................................................................................................. 32
3.5.1 Satellite Image Analysis ..................................................................................... 32
3.5.2 Data Analysis for Driving Forces of LU/LCC ................................................... 35
3.6 Land Use/Land Cover Change Modeling .................................................................. 35
3.7 Data presentation ........................................................................................................ 36
4 RESULTS AND DISCUSSION........................................................................................ 38
4.1 Characteristics of LU/LC units .................................................................................. 38
4.2 Land use/Land Covers of the Study Area in 1986, 1996, 2006 and 2016 ................. 40
4.3 Land Use/Land Cover Change Detection .................................................................. 42
4.3.1 Trend of LU/LCC in Bale Eco-Region ............................................................... 42
4.3.2 Land Use/Land Cover Change Matrix ................................................................ 48
4.4 LU/LCC under different institutional set-up in Bale Eco-Region ............................. 49
iv
4.5 Predicting LU/LCC Based on the Markov Model ..................................................... 53
4.6 Causes of LU/LCCs in Bale Eco-Region ................................................................... 54
4.6.1 Proximate (Direct) Causes .................................................................................. 54
4.6.2 Underlying Causes .............................................................................................. 58
5 CONCLUSION AND RECOMMENDATION ................................................................ 67
5.1 Conclusion ................................................................................................................. 67
5.2 Recommendation........................................................................................................ 69
6 References ......................................................................................................................... 71
v
Dedication
To my beloved friend Getachew Werkineh and my family Ato Mezgebu Nigussie and W/ro
Abebu Asefa
vi
Acronyms and Abbreviations
BERSMP Bale Eco-Region Sustainable Management Plan
BER Bale Eco-Region
BMNP Bale Mountain National Park
CSA Central Statistical Agency
DAs Development Agents
ETM+ Enhanced Thematic Mapper Plus
FDRE Federal Democratic Republic of Ethiopia
FGD Focus Group Discussion
FZS Frankfurt Zoological Society
GIS Geographic Information System
GPS Global Positioning System
GTP Ground Truthing Points
IWMI International Water Management Institute
KII Key Informant Interview
LU/LCC Land Use/Land Cover Change
LU/LC Land Use/Land Cover
MCM Markov Chain Model
vii
MoME Ministry of Mines and Energy
MSS Multispectral Scanner
NTFPs Non-Timber Forest Products
OFWE Oromia Forest and Wildlife Enterprise
OLI/TIRS Operational Land Imager/Thermal Infrared Sensor
PA Peasant Association
PFM Participatory Forest Management
PHEEC People Health and Environment Ethiopia Consortium
PRM Participatory Rangeland Management
RS Remote Sensing
SHARE European Union’s Support for Horn of Africa Resilience
TM Thematic Mapper
USGS-EROS United State Geological- Earth Resource Observation and Science
UTM Universal Transverse Mercator
WGS84 World Geodetic System 84
viii
List of Tables
Table 1: Summary of spatial data sets used in this study ......................................................... 28
Table 2: Software used in the course of the study .................................................................... 29
Table 3: Description of major LU/LC types identified in Bale Eco-Region ............................ 39
Table 4: Rate and percentage change of LU/LCs in Bale Eco-Region .................................... 44
Table 5: LU/LCC under different institutional arrangements in BER, Note: NP = National
park, W.admin = Wereda administration, PFM = participatory forest management
and PRM = participatory rangeland management. .................................................. 50
Table 6: Underlying Causes of LU/LCC in BER ..................................................................... 59
Table 7: LU/LCC matrix between 1986 and 1996 ................................................................... 86
Table 8: LU/LCC matrix between 1996 and 2006 ................................................................... 86
Table 9: LU/LCC matrix between 2006 and 2016 ................................................................... 87
Table 10: Transitional probability matrix derived from LU/LC map of 2006 and 2016 .......... 87
Table 11: LU/LCC matrix between 1986 and 2016 ................................................................. 88
Table 12: Error matrix for the LU/LC map of 1986 ................................................................. 89
Table 13: Error matrix for the LU/LC map of 1996 ................................................................. 90
Table 14: Error matrix for LU/LC map of 2006 ....................................................................... 91
Table 15: Error matrix for LU/LC map of 2016 ....................................................................... 92
ix
List of Figures
Figure 1: Study area map. Note: the intervention Weredas with olive color in figure (d)
indicates Weredas used for LU/LCC analysis, whereas sample Weredas and
Kebeles describe in figure (a) indicates Weredas and Kebeles selected for filed data
collection. BER in figure (d) represents Bale Eco-Region. ..................................... 22
Figure 2: Flow chart that shows the general methodology of this research. Adopted from Sang
(2010) and Shiferaw (2011) with some modification .............................................. 37
Figure 3: Area of LU/LC units at different periods in Bale Eco-Region ................................. 40
Figure 4: Map of LU/LC types of Bale Eco-Region produced based on unprocessed satellite
images obtained from USGS.................................................................................... 41
Figure 5: Trend of LU/LCC in Bale Eco-region....................................................................... 43
Figure 6: Map that shows LU/LCC across different intuitions in BER.................................... 53
Figure 7: Population growth in seven Weredas of BER (1994-2016) drived from CSA (Central
Statistical Agency). Note: Due to the data gap from the CSA total population for the
years between 1994 and 2004 and 2009 were not available for use. ....................... 61
x
List of Appendixes
Appendix 1: Land Use/Land Cover Change Matrixes .............................................................. 86
Appendix 2: Error Matrixes ...................................................................................................... 89
Appendix 3: Field Observation Sheet Format .......................................................................... 93
Appendix 4: Checklist for Focus Group Discussion and Key Informant Interview ................. 93
xi
Land Use/Land Cover Changes and Associated Driving Forces in Bale Eco-Region,
Ethiopia
Adane Mezgebu Nigussie
Mobile phone: +251-9-18470641 E-mail: [email protected]
Abstract
Land Use/ Land Cover Change (LU/LCC) is one of the major human induced global changes.
Information on LU/LCC and the forces and processes behind such changes are essential for
proper understanding of how land was being used in the past, what type of changes have
occurred and are expected in the future. This study was carried out to examine land use/land
cover changes and driving forces behind the changes in the Bale Eco-Region, Ethiopia. It was
conducted using satellite image of Landsat5 TM 1986 and 1996, Landsat7 ETM+ 2006 and
Landsat8 OIL/TIROS 2016. In addition, field observations, Key informant interview (KII) and
Focus Group Discussion (FGD) were also conducted. ERDAS Imagine 9.2, ArcGIS 9.3 and
IDRSI Selva 17.00, softwares were used for satellite image processing and map preparation
and LU/LCC prediction respectively. The main finding of this study revealed an expansion of
agriculture/settlement and reduction of woodland and forest over the last 30 years between
1986 and 2016. Agriculture/settlement increased by 173369 ha, with a corresponding 296692
ha and 85184 ha decline in the area of woodland and forest respectively. If the current rate of
LU/LCC continues, agriculture/settlement is predicted to increase by 28% in 2026. In contrast
woodland and forest are predicted to shrink by 24% and 17% respectively. Analysis of
LU/LCC under different institutional set-ups between 2006 and 2016 showed highest
expansion (1285 ha/year) of agriculture/settlement in the lowland Kebele under Wereda land
administration followed by 290 ha/year in Kebele under the national park. LU/LCC in the
BER is a result of several proximate and underlying drivers. The major proximate driving
forces of LU/LCC in the BER are agricultural expansion, fire, illegal logging and fuel wood
extraction, overgrazing and expansion of illegal and unplanned settlements. Demographic,
economic, technological, institution and policy, socio-cultural and biophysical factors
constitute the major underlying drivers of LU/LCC in the BER. Hence, the right policy
packages are required to control the expansion of agriculture at the expance of woodland and
forest resources in the study area.
Key words: Bale Eco-Region, Change prediction, Drivers, Institutions, Land use/Land cover
1
1 INTRODUCTION
1.1 Background
Land is an essential natural resource which has numerous social, economic, and biophysical
uses. It used to create wealth and employment, grow economies and also use as a source of
water, food and energy. It provides services such as conserving biodiversity, storing carbon,
purifying and storing water and regulating the Earth’s climate by absorbing the heat from the
sun as well (Molla, 2014; Sall, 2014). These services will continue if only the land is not
destroyed or degraded by human induced actions.
According to Agarwal et al. (2002) increase in atmospheric carbon- dioxide concentrations;
alterations in the biochemistry of the global nitrogen cycle; and on-going Land Use/ Land
Cover Change (LU/LCC) are the three major human induced global changes. LU/LCC is an
endless process taking place on the earth surface starting from ancient time (Shiferaw, 2011;
Worku et al., 2014). Expansion of agriculture to meet the demand of growing population such
as food and fiber at the expense of vegetated lands is the most significant historical change in
all parts of the world (Lambin et al., 2003). During the last 3 centuries around 1.2 million km2
of forest and woodland and 5.6 million km2 of grassland and pasture have been converted to
other uses globally, while cropland has increased by 12 million km2 (Agarwal et al., 2002).
Both natural and human activities are responsible for LU/LCC (Burka, 2008) while the latter
is increasingly recognized as a dominant force in LU/LCC (Lamichhane, 2008). Human
activities are responsible for the conversion and transformation of plentiful of the world’s
natural land covers (Hamza and Iyela, 2012). For instance, over the last 10,000 years, about
50% of the ice-free land surface has been changed by human activities (Lambin et al., 2003).
2
Since 1850 around 6 million km2 and 4.7 million km2 of forest/woodland and grassland areas
have been converted to agricultural land worldwide in that order, to meet the demand for food
and fiber (Lambin et al., 2003; Hamza and Iyela, 2012).
LU/LCC has negative consequences on both the quality of environment and life (Molla,
2014). Gashaw and Dinkayoh (2015) noted that the environmental consequences of LU/LCC
are as large as that of climate change. LU/LCC can affect food security, biodiversity,
biogeochemical cycles, soil fertility, hydrological cycles, energy balance, land productivity
and the sustainability of environmental service provision (Burka, 2008; Molla, 2014). Apart
from these, it also contributes to global warming (Molla, 2014).
Assessment of spatial and temporal distribution of LU/LC is essential pre-requisite for land
resources planning, management and monitoring programs (Mani and Krishnan, 2013). Ebro
et al. (2011) and Tefera (2011) have also noted that, precise information on LU/LCC and its
driving forces are essential to understand what type of changes have occurred and are
expected in the future. Moreover, analysis of LU/LCC and its drivers provides important
information for monitoring biodiversity loss and natural disasters (e.g. drought, floods,
wildfires), and for identifying areas threatened with severe land degradation (e.g.
deforestation, overgrazing, diversion of water resources, etc.) (Ebro et al., 2011).
GIS and Remote sensing technologies has made possible to assess and analyze LU/LCC in
less time, at low cost and with better accuracy (Abdullah et al., 2013; Mani and Krishnan,
2013). Availability of remote sensed data in various spatial and temporal resolutions made
mapping and assessing LU/LCC possible (Mani and Krishnan, 2013). On the other hand GIS
3
has tools for collecting, storing, analyzing and visualization of the outcome of analysis (Reis,
2008).
Being the second populous country in Africa, Ethiopia is experiencing enormous LU/LCC
(Kindu et al., 2013; Gashaw and Dinkayoh, 2015). These changes are mainly from natural
vegetation land to agricultural land and settlement. The LU/LCC problem is more severe in
the highlands of Ethiopia (Eshetu and Hogberg, 2000). It is because these areas were
characterized by high population pressure and cultivated for long period of time (Kindu et al.,
2013).The highland areas in Ethiopia cover nearly 45% of the country’s landmass (Tefera,
2011). Different studies have been conducted to quantify LU/LCC in both highland and
lowland parts of Ethiopia (Belay, 2002; Woldeamlak, 2002; Tefera, 2011; Kindu et al., 2013;
Molla, 2014; Alemu et al., 2015). According to these studies, the country is characterized by
reduction of forest, woodlands, grasslands and shrub lands, but a remarkable expansion of
agricultural land and bare lands in space and time. These studies also identified population
growth owing to natural increase, in-migration and resettlement; overgrazing by livestock;
climate change; land tenure arrangements; livelihood strategies and commercial agricultural
investments as the main driving forces for LU/LCC in Ethiopia.
1.2 Statement of the Problem
Bale Eco-Region (BER) which is characterized by wealth of biodiversity and ecosystem
services is one of the most important eco-region in Ethiopia and Sub-Saharan Africa (FARM
Africa, 2008). It is home of several fauna and flora including the endangered and endemic
species (FARM Africa, 2008). According to Watson (2013) the BER is one of 34 global
biodiversity hotspots which contain more than 1,500 species of vascular plants as endemics.
4
The Bale Mountains National Park (BMNP) which lies at the heart of the BER is also one of
the most important conservation areas in Ethiopia (Watson, 2013). The livelihood of millions
of people living in the eco-region depends on the ecosystem services provided from the eco-
region. The region is also well known in its water resources. These water resources are critical
for the livelihoods and wellbeing of hundreds of thousands of people in the highlands of
Southeast Ethiopia and an estimated 12 million people in the lowlands of Southeast Ethiopia,
Northern Kenya and Somalia (FARM Africa, 2008).
However, this globally important eco-region is under increasing threat from a growing human
population, fire and rapid immigration with unplanned and unrestricted settlement (SOS Sahel
Ethiopia, 2010; Teshoma, 2010). Disturbance of the water systems and deforestation and
forest degradation are occurring due to poor management of natural resources, the conversion
of natural habitat to farmland, overgrazing by livestock and unsustainable fuel wood and
timber extraction (Teshoma, 2010; Hailemariam et al., 2015). These, coupled with impacts
from climate change are influencing its unique flora and fauna and both lowland and highland
communities that depend on the BER’s ecosystem services (FARM Africa, 2008).
Gebrehiwet (2004), Oumer (2009), Molla et al. (2010), Muluneh (2010), Shiferaw (2011),
Tefera (2011), Gebreslassie (2014), Molla (2014), Tsegaye (2014), Alemu et al. (2015),
Gashaw and Dinkayoh (2015) have studied LU/LCC in different parts of Ethiopia using GIS
and Remote Sensing techniques. Few studies like Morie (2007), Walellegn (2007), and
Teshome et al. (2008) have been conducted to understand LU/LCC in BER. Even though,
these studies are found in the study area they dealt with quantifying LU/LCC using remote
sensing tools, which give quantitative descriptions, but fail to assess the drivers of LU/LCC.
5
Then again studies those links LU/LCC under different institutional arrangements of natural
resource management and predict how LU/LCC will unfold in the future are lacking in study
area. Therefore in view of the literature gaps indicated above this research analyzed the
LU/LCC and driving forces of change in BER from 1986 to 2016. It also analyzed LU/LCC
under different institutional arrangements (Federal/Bale Mountains National Park, Oromia
regional government, Participatory Forest Management (PFM) and Participatory Rangeland
Management (PRM)) from 2006 to 2016. The research predicted future LU/LCC in study area
as well.
1.3 Objectives of the Study
1.3.1 General Objective
This study generally aimed at assessing land use/land cover changes and driving forces behind
the changes in the Bale Eco-Region, Ethiopia.
1.3.2 Specific Objectives
The specific objectives of this study were to:
1. Assess historical land use/land cover change in the Bale Eco- Region between
1986 and 2016
2. Assess land use/land cover change under different institutional arrangements of
natural resource management in Bale Eco-Region between 2006 and 2016
3. Predict future land use/land cover changes in the Bale Eco- Region (from 2016 to
2026)
6
4. Identify major driving forces of land use/land cover changes in the Bale Eco-
Region
1.4 Research Questions
The Study has tried to answer the following research questions
1. What is the historical trend of land use/land cover change in the Bale Eco-Region
between 1986 and 2016?
2. What is the land use/land cover change look like under different institutional
arrangements of natural resource management in Bale Eco-Region?
3. What will the future land use/ land cover change look like in the Bale Eco-Region?
4. What are the major driving forces to land use/land cover change in the Bale Eco-
Region?
1.5 Significance of the Study
The study will have its own rationalities both for study site in one way and for
LU/LCC literatures. By analyzing the LU/LCC trend and driving forces behind the
changes, it helps to understand how land was being used in the past, what type of
changes have occurred and are expected in the future. Moreover it can provide data to
policy and decision makers to design appropriate policies and strategies for monitoring
resource degradiation and promote sustainable management of natural resources. More
sustainable management of natural resources in turn can enhance agricultural
productivity and builds the resilience of rural communities to shocks. A large number
7
of government or non-government development agencies, researchers and local
communities can benefit from the outputs of this research.
1.6 Scope of the Study
Conceptually, the study assessed LU/LCC and drivers of the change, and then it predicted
future LU/LCC. In its geographic scope it was undertaken in Bale Eco- Region covering an
area of 1,577,067 ha. Methodologically the study used different methods and approaches
(remote sensing, field observation, key informant interview, focus group discussion, and use
of secondary data). For predicting future LU/LCC the study used Markov chain Model.
8
2 LITERATURE REVIEW
2.1 Land Use/ Land Cover Change: Definition and Concepts
Land cover and land use are the two interrelated ways of observing earth’s surface (Duhamel,
2011). The former represents the biophysical state of the earth’s surface and immediate
subsurface, while the later indicates the manner human population manipulate the biophysical
attributes of the land and the purpose for which land is used (Meyer, 1995; Turner et al., 1995;
Lambin et al., 2003; Pellikka, 2008; Duhamel, 2011). Some examples of land use are grazing,
recreation, agriculture, urban development, logging and mining (Opeyemi, 2006).
The relationship between land use and land cover can be described as: change in land use can
affect and be affected by land cover, however the change in either of them is not necessarily
the product of the other. Single land use system may correspond to a single land cover or it
may involve several distinct covers (Briassoulis, 2011). For instance a farming system may
involve several distinct covers such as cultivated land, woodlots, improved pasture, and
settlements. On the other hand single class of cover may support multiple uses. For example
the area covered by natural forest can be used for hunting and gathering, fuel wood collection,
recreation and wild life preservation (Briassoulis, 2011; Verheye, 2011).
A change in land cover refers to conversion of one land cover type to a new cover type or
modification within one land cover category (Meyer and Turner, 1992; Lambin and Geist,
2003). On the other hand land use change refers to a conversion of land use due to the
interference of human being for different purposes such as for settlement, infrastructural
development, agriculture and recreational uses (Meyer and Turner, 1992; Turner et al., 1995).
9
LU/LCC refers to the human modification and conversion of the earth terrestrial surface
(Lambin et al., 2003; Hamza and Iyela, 2012; Shrestha, 2012). Modification occurs when the
change affect only the characteristics of the land cover without causing a complete shift from
one LU/LC type to the other. On the other hand conversion of LU/LC occurs when one
LU/LC type completely replaced by another (Turner et al., 1995; Lambin et al., 2003; Alemu
et al., 2015).
2.2 Drivers of Land Use/Land Cover Change
The world’s land surface estimated to cover about 13,340 million ha (Verheye, 2011). Of
which 54% of this land surface disturbed by both human activities and natural factors
(Briassoulis, 2011). The change in LU/LC at all level is associated with several natural and
human induced factors (Rahdary et al., 2008). The natural or biophysical causes of LU/LCC
include: slop, climate change, soil type, wildfire, pest infestation, flood and drought (Garedew,
2010; Shiferaw, 2011). Human induced or anthropogenic driving forces of LU/LCC grouped
as the direct effects of human activity (proximate causes) and indirect effects of human
activity (underlying driving forces) (EPA, 1999 report cited in Morie, 2007). The former
comprises agricultural expansion, wood extraction and infrastructure expansion while the later
includes demographic, economic, technological, policy and institutional and cultural factors
(Geist and Lambin, 2002). The human induced causative factors increasingly recognized as a
dominant force in LU/LCC (Lamichhane, 2008; Chang-Martínez et al., 2015). According to
Briassoulis (2011) one-third to one-half of the global land surface change by human activities
such as logging, agricultural expansion, over grazing, fire management, forest harvesting and
urban and suburban construction and development.
10
2.2.1 Proximate Causes
Proximate causes of LU/LCC are immediate actions of local communities and directly exerted
on land resources due to different underlying causes such as economic, social, political, etc
(Geist and Lambin, 2002; Shiferaw, 2011). They operate at the local level (individual farms,
households or communities) and explain how and why local land covers and ecosystem
processes are modified and converted directly by humans (Lambin et al., 2003; Lambin and
Geist, 2007).
According to Geist and Lambin (2002) agricultural expansion, wood extraction and
infrastructure expansion are major proximate causes of LU/LCC. De Sherbinin (2002)
explained that agricultural expansion is the dominant proximate cause for LU/LCC.
Agricultural expansion comprises permanent cultivation (large scale, smallholder subsistence
and commercial), shifting cultivation (slash & burn) and cattle ranching (large-scale and
smallholder) (Geist and Lambin, 2002). Crop land and pastures are now among the dominant
ecosystems on the planet, occupying more than 35% of the world’s ice-free land surface (Paul
and Lisa, 2011). Over 50% of the global agricultural lands increased in the past 100 years. In
the developing world, half of the land cover conversion occurred in just the past 50 years
(Houghton, 1994). In Ethiopia large areas, which were once under vegetation cover are now
changed to cultivated land and expose to soil erosion resulting into environmental degradation
and serious threat to the land (Amare, 2007).
2.2.2 Underlying Causes
Underlying causes of LU/LCC involves the structural (or systemic) factors that trigger the
proximate causes (Geist and Lambin, 2002; Lambin et al., 2003). They operate at the regional
11
(districts, provinces, or country) or even global levels by changing one or more proximate
causes (Lambin et al., 2003; Lambin and Geist, 2007). They are external to the local
communities and not controlled at the local level. According to De Sherbinin (2002) and
Geist and Lambin (2001, 2002) underlying causes of LU/LCC originate from a complex
interaction of social, policy and institutional, economic, demographic, technological, cultural
and biophysical factors.
Economic factor is one of the major underlying causes of LU/LCC particular for tropical
deforestation (Geist and Lambin, 2002). Economic variables such as low domestic costs (for
land, labor, fuel or timber), increase in product price (mostly for cash crops) influence land
use decision making, thereby impacting the land cover (Geist and Lambin, 2002). Besides
these, change in prices, taxes, and subsidies on land use inputs and products, change in the
costs of production and transportation and access to credit, market, and technology also plays
vital role in LU/LCC ( Lambin and Geist, 2007).
Political, legal, economic and traditional institutions and their interaction with individual
decision making also influence LU/LCC (Lambin and Geist, 2003; Lambin and Geist, 2007).
Institutional causes of LU/LCC must be considered both at large scale (international or
national level) and local level (Lambin et al., 2003). This is because the implementation of
large scale policies is practiced at local level and local people’s access to land, capital,
technology and information influenced by the structure of both local and large scale policies
(Lambin and Geist, 2003). On the other hand LU/LCC influenced significantly when local
institutions are undermined by large scale institutions (Lambin et al., 2003). Policy and
institutional cause of LU/LCC include; land tenure system, shift in land holding system from
12
communal (traditional) to formal (state), government policies on land use and economic
development, property-rights, environmental policies, decision-making systems for resource
management (e.g., decentralized, democratized, state-controlled, local and communal) and
social networks concerning distribution and access to resources (Geist and Lambin, 2002;
Lambin et al., 2003; Lambin and Geist, 2007).
Agro-technological changes such as the adoption of mechanized large scale agriculture,
modification of farming systems through intensification and extensification and poor
technological applications in the wood sector (leading to wasteful logging practices) are
amidst technological factors causing LU/LCC, particularly tropical deforestation (Geist and
Lambin, 2002).
Demographic changes are the dominant causes of LU/LCC in most of Africa, Asia and
L/America countries (Turner and Meyer, 1994). Demographic change include shifts in fertility
and mortality, changes in household structure, the breakdown of extended families into
multiple nuclear families and dynamics including; labor availability, migration, urbanization
(Geist and Lambin, 2002).
Cultural factors encompass motivations, collective memories, personal histories, attitudes,
values, beliefs, and perceptions of individuals, communities and land managers. These factors
influence land use decisions and land covers, sometimes profoundly (Lambin and Geist,
2007).
13
2.3 Application of Remote Sensing and GIS Techniques for LU/LCC Study
Geographical Information Systems (GIS) in conjunction with Remote Sensing (RS) has been
recognized as a powerful and effective tool in LU/LCC analysis (Weng, 2002; Rimal, 2011;
Abdullah et al., 2013). They provide accurate, cost effective and timely information and
methods for monitoring, modeling and mapping of LU/LCC across a range of spatial and
temporal scales. The information from GIS and RS also helps to assess the extent, direction,
causes, and effects of the LU/LCC (Reis, 2008; Oumer, 2009; Rimal, 2011). In LU/LCC
assessment some studies have utilized RS techniques; others have integrated remote sensing
techniques with GIS. GIS is the technology which has been used to view and analyze data
from a geographic perspective (Rimal, 2011).
It is a useful tool to measure the LU/LCC trends between two or more time by using statistical
and analytical functions (Abdullah et al., 2013). It provides a flexible environment for
collecting, storing, displaying and analyzing digital data necessary for LU/LCC detection and
tools for land use planning and modeling (Reis, 2008; Rimal, 2011). In the context of
LU/LCC, RS means the ability to detect change on the earth’s surface through space-borne
sensors (Abdullah et al., 2013). RS becomes useful tool for understanding landscape
dynamics over time and space, irrespective of the causal factors. This is because of the fact
that it provides multi-temporal and multi- spectral remotely sensed data (Oumer, 2009; Rimal,
2011). Application of RS for LU/LCC analysis depends on: (i) sensor capability, (ii) wealth of
information captured, (iii) objective of the intended study and (iv) spatial and spectral
properties of satellite images acquired by different versions of a particular sensor instrument
(Oumer, 2009). Landsat imagery provides a better understanding of land resources. The most
14
important reason for this is a continuous improvement in radiometric and spectral property of
images over time (Oumer, 2009). Since the starting of Landsat program in 1972 Landsat
Multispectral Scanner (MSS), Thematic Mapper (TM) and Enhanced Thematic Mapper Plus
(ETM+) data have been broadly employed in LU/LCC studies, mainly in forest and
agricultural areas (Reis, 2008).
2.4 Modeling Land Use/Land Cover Change
Models are used in a variety of fields including in LU/LCC studies (Brown et al., 2004). In
LU/LCC studies models have been developed to address the questions when, where and why
LU/LCC occurs (Brown et al., 2000). They usually involve empirically fitting the models to
some historical pattern of change, then extending those patterns into the future for prediction.
Modeling LU/LCC plays a significant role for understanding the factors that cause LU/LCC
and the impacts of the changes (Araya, 2009; Adedeji et al., 2015). Models are useful for
sorting out the complex groups of socio-economic and biophysical forces that influence the
rate and spatial pattern of LU/LCC and for estimating the impacts of changes in LU/LCC
(Verburg, 2004).
Furthermore, models can support prediction of future LU/LCCs under different scenario
conditions, based on past evidence (recent past) (Verburg, 2004; Chang-Martínez et al., 2015).
Models also enable the projection into the future of the expected effects of governmental
programs aiming at the conservation and utilization of resources. Assessing and predicting
LU/LCC would help for effective environmental management and sustainable resources use.
Additionally it would help to better understand the functioning of the LU/LC system and to
support land use planning and policy as well as development plans and decision making
15
(Araya, 2009). Numbers of LU/LCC modeling approaches have been described in different
literatures (Veldkamp and Lambin, 2001). Depending on the purpose they are designed, their
spatial and temporal scale, data availability, expertise knowledge and etc. there exist different
LU/LCC modeling approaches and they may differ from each other (Araya, 2009). There are
technically complex models which require advanced programming and expertise knowledge,
while some others are simple and provide user-friendly tools that someone can apply with
limited experiences, e.g. markove chain model (Veldkamp and Lambin, 2001; Araya, 2009).
2.4.1 Markov Chain Modeling
Markov chain model (MCM) has been used extensively for urban and rural LU/LCC modeling
(Brown et al., 2000; Arsanjani, 2012). It is a discrete-time stochastic model, describing the
probabilistic movement of one state (LU/LC type) to another state (LU/LC type) (Arsanjani,
2012; Sayemuzzaman and Jha, 2014; Iacono et al., 2015). MCM consider LU/LCC as a
stochastic process and different LU/LC categories are the states of a chain (Weng, 2002). The
model specifies both time and a finite set of states as discrete values (Iacono et al., 2015). The
applicability of MCM in LU/LCC modeling is promising because of its ability: (i) to represent
all of the possible directions of LU/LCC among all of the land use categories, (ii) to quantify
the states of conversion between LU/LC types and (iii) to quantify the rate of conversion
among the LU/LC types (Sang, 2011; Han et al., 2015).
For LU/LCC prediction MCM utilizes two historic LU/LC images as input and produces a
transition probability matrix, a transition areas matrix and a set of conditional probability
images (Eastman, 2006; Sayemuzzaman and Jha, 2014). The former represents the probability
that each land use/land cover category will change to every other category over the specified

16
number of time units, while the later represents the amount of pixels that are anticipated to
change from each land use/land cover type to each other land use/land cover type over the
specified number of time units (IDRISI Seva help system; Sang, 2011; Arsanjani, 2012). The
conditional probability images report the probability that each land cover type would be found
at each pixel after the specified number of time units (IDRISI Selva help system)
According to different authors (Weng, 2001; Sayemuzzaman and Jha, 2014; Adedeji et al.,
2015; Iacono et al., 2015; Mirkatouli et al., 2015) MCM have several assumptions. One basic
assumption is that a future state of LU/LC at a time (t+1) can be determined only as a function
of its current state (t). Mathematically this can be expressed as . Path of past
states Xt-1, Xt-2, Xt-3,…X0 that the process passed through in arriving at does not determine
the future state at It also assume that the observed trends of LU/LCC will remain the
same (stationary process), thus allowing their projection to the future.
The current state of LU/LC distributions (Xt) and the future state of LU/LC distributions at
(Xt + 1) time period, as well as a transition probability matrix (Pij) representing, m × m matrix
which expresses the probability that a site in state i at time t will transfer to state j at time t+1,
are used to construct the Markov model (Brown et al., 2000; Sang, 2011; Adedeji et al., 2015;
Han et al., 2015) which is expressed as follows:
Where Xt + 1 and Xt Represent the states of land use at given point t + 1 and t, respectively. The
matrix P is row-standardized, such that the sum of transition probabilities from a given state is
always equal to one.
17
2.5 LU/LCC at Global Perspective
LU/LCC occurs at local, regional and global scales and changes at local scales can have
cumulative impacts at broader scales (Burka, 2008). LU/LCC is as old as the age of human
kinds (Gebreslassie, 2014). Human land use activities spread over about 50% of the ice free
land surface starting from the control over fire and domestication of animals and plants
(Lambin and Geist, 2006). The spread of human land use activities were mainly at the expance
of forest lands, resulting reduction of global forest cover from 50% to less than 30% (Lambin
et al., 2003). Between 1700 and 1980 for instance, at the global scale total cultivated land was
estimated to have increased by 46% (Turner et al., 1992 Cited in Muluneh, 2003).
Furthermore, between the years 1700 and 1990, the area under cropland and pasture has
increased from an estimated 300-400 million ha to 1500-1800 million ha, and 500 million ha
to 3100 million ha respectively. This resulted in reduction of forests from around 5000-6200
million ha in 1700 to 4300-5300 million ha in 1990 and natural grasslands, steppes and
savannas from around 3200 million ha in 1700 to 1800- 2700 million ha in 1990 (Lambin et
al., 2003).
However LU/LCC is not homogeneous across all parts of the world (WIREs Climate Change,
2014). There are regions still with relatively undisturbed land cover such as parts of tropics
and Polar Regions. Some other regions experienced huge LU/LCC mainly expansion of
agricultural lands at the expance of vegetated lands. This is true in regions with a shorter
history of human development such as Africa, south and Southeast Asia and Latin America
countries. Since 1850, these regions have experienced dramatic increases in cropland,
especially during the second half of the twentieth century (Lambin et al., 2003; WIREs
18
Climate Change, 2014). On the other hand expansion of agricultural lands reduced in
European countries (WIREs Climate Change, 2014).
2.6 State of LU/LCC in Ethiopia
As per Ministry of Mines and Energy (MoME, 2003) the total area of Ethiopia covers above
1.12 million km2. About 55% of this area is below 1500m a.m.s.l. which is lowland, whereas
the remaining 45% of the area, with an altitude of greater than 1500m is highland (Tefera,
2011). In Ethiopia the land is dominantly used for mixed farming system, by smallholders
who farm for subsistence (Tefera, 2011; Geremew, 2013).
The country also kwon by several environmental, climatic, and socio-economic problems such
as: environmental degradation, erratic rainfall, recurrent droughts and drought-related
distressing famines, prevalence of malaria and HIV/AIDS, widespread poverty and poor
governance (Tefera, 2011). The aforementioned problems are directly or indirectly linked
with Climate change and LU/LCC.
LU/LCC including forest cover change is one of the major environmental problems in
Ethiopia (Alemu et al., 2015). Albeit, most of the researches were conducted in the northern
highland, there are numbers of LU/LCC studies carried out in Ethiopia, at catchment, zone,
watershed and village levels. For instance Zeleke and Hurni (2001) in Dembecha area of
Gojjam; Woldeamlak (2002) in Chemago watershed, Gojjam; Garedew (2010) in the Semi-
Arid Areas of Central Rift Valley of Ethiopia; Gebrehiwot et al. (2010) in Koga watershed at
the headwaters of the Blue Nile Basin; Tsegaye et al. (2010) in North eastern Afar range
lands; Ebro et al. (2011) in Adami Tulu and Fantale Weredas, in the rift valley of Ethiopia;
19
Tefera (2011) in Nonno Wereda, Central Ethiopia; Fentahun and Gashaw (2014) in Bantneka
Watershed, Ethiopia; Molla (2014) in Arsi Negele District, Central Rift Valley Region of
Ethiopia; Worku et al. (2014) in Ameleke Watershed, South Ethiopia; Gashaw and Dinkayoh
(2015) in Hulet Wogedamea Kebele, Northern Ethiopia. Most of these researches reported the
decline of grassland and natural vegetation including forests, shrub lands and woodlands due
to conversion to croplands, grazing lands, open areas and settlements areas. This idea is in line
with (Munchen, 2012) who stated that almost all LU/LCC studies conducted in Ethiopia have
common characteristics, such as expansion of agriculture land and the loss of natural
vegetation, combined with a loss of biodiversity.
In the highland parts of Ethiopia there was expansion of agriculture at the expance of
vegetated lands mainly shrub land, woodland and forest land since 1860s (Girma, 2014).
However according to the author expansion of agriculture at the expance of vegetated lands
worsened since 1980s.
In Ethiopia expansion of agricultural land and loss of natural vegetation are associated with
population growth, poor economic condition, unclear land tenure right and several other
biophysical and socio-political factors (Melaku, 2003). According to Sege (1994) and Turner
and Meyer (1994) in most developing countries including Africa, Asia and L/America
countries population growth and LU/LCC have a strong statistical correlation. In agreement
to these different studies undertaken in different parts of Ethiopia also reported population
growth as a major cause for LU/LCC. Population growth was the major cause for the
expansion of agriculture and reduction of vegetation covers in Ethiopian highlands (Muluneh,
2010), Borena Wereda South Wello Highland (Shiferaw, 2011); Nono Wereda, Central
20
Ethiopia (Tefera, 2011), West Guna Mountain South Gondar (Tsegaye, 2014) and Northwest
lowland of Ethiopia (Alemu et al., 2015). The total population of Ethiopia during the first
population and housing census (1984) was 39,868,572. However, during the census of 1994
and 2007 it increased to 53,477,265 and 73,918,505 respectively (Minale, 2012). This implies
that between 1984 and 2007 the total population of the country increased by more than 34
million persons. This population growth has led to expansion of agriculture and settlement by
clearing forest, grass and woodlands (Minale, 2012).
21
3 METHODS AND MATERIALS
3.1 Description of Study Area
3.1.1 Location
Bale Eco-Region (BER) situated within the Oromia Regional State, forming part of the Bale
and West Arsi Zonal administration in the south eastern Ethiopian Highlands (Watson, 2013).
The astronomical location of BER ranges between 5°16ꞌ54ꞌꞌ and 7°52ꞌ55ꞌꞌN latitude and
38°37ꞌ52ꞌꞌ and 41°13ꞌ0ꞌꞌE longitude. BER covers 2,217,600 ha over 16 Woredas: Adaba,
Agarfa, Berbere, Dinsho, Dodola, Gasera, Goba, Gololcha, Goro, Harena Bulluk, Kokosa,
Delo Mena, Nensebo, Mede Welabu, Gora Damole and Sinana (Hailemariam et al., 2015).
However, the intervention Weredas for LU/LCC analysis of this study were only seven
namely Adaba, Dinsho, Goba, Harena Bulluk, Delo Mena, Mede Welabu and Berbere. Hence
hereafter BER in this study refers only these seven Weredas. These Woredas composed of 120
Kebeles, which are the smallest local government unit.
22
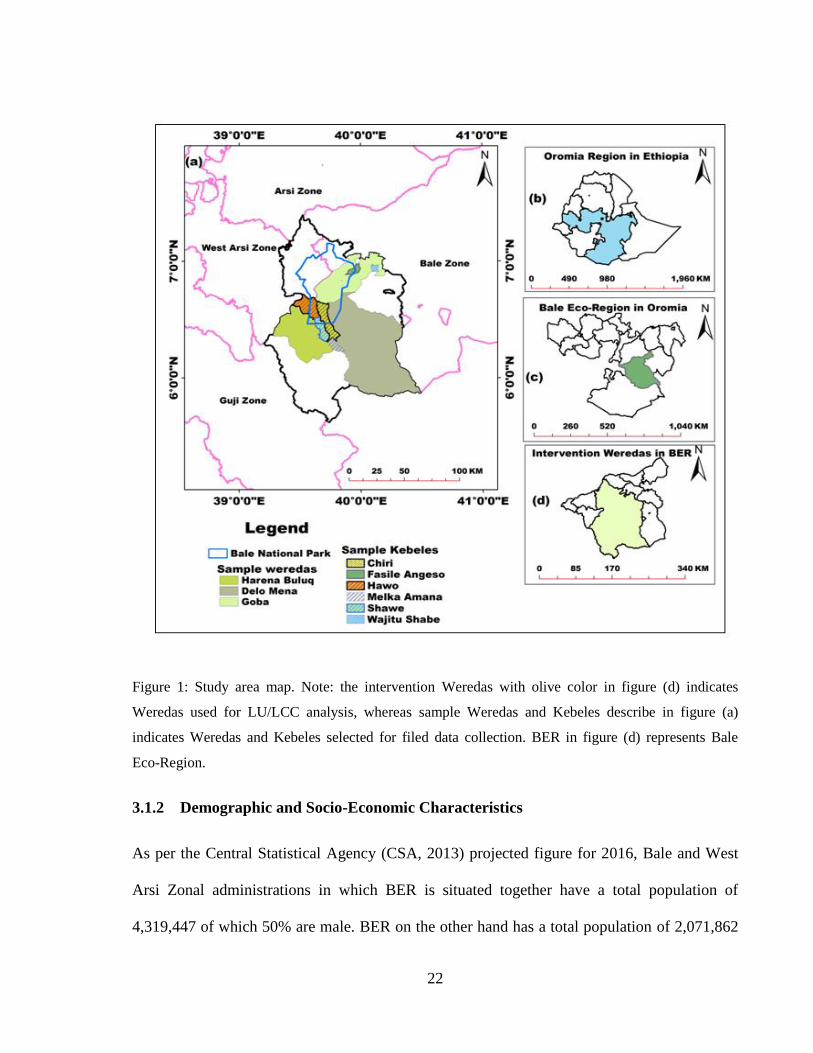
Figure 1: Study area map. Note: the intervention Weredas with olive color in figure (d) indicates
Weredas used for LU/LCC analysis, whereas sample Weredas and Kebeles describe in figure (a)
indicates Weredas and Kebeles selected for filed data collection. BER in figure (d) represents Bale
Eco-Region.
3.1.2 Demographic and Socio-Economic Characteristics
As per the Central Statistical Agency (CSA, 2013) projected figure for 2016, Bale and West
Arsi Zonal administrations in which BER is situated together have a total population of
4,319,447 of which 50% are male. BER on the other hand has a total population of 2,071,862
23
of which 1,036,206 are male. The total population for the seven intervention Weredas is
878,493. About 797,123 (91%) and 81,370 (9%) of this population live in rural and urban
areas respectively. Small-scale subsistence agriculture using traditional technologies is the
major sector that supports the livelihood of households and communities in the area (World
Bank, 2007; Rosell, 2011). It contributes about 85% to household’s economy. Agriculture in
the BER involves two major activities: Farming and Livestock husbandry (BMNP GMP,
2007). Farmers in the region grow cereal crops (e.g. Corn, Barley, Teff and Wheat), cash
crops (chat, coffee and rice) and horticultural crops particularly vegetables (e.g. onion, potato
and cabbage). Cattle, Goats, Sheep, Horses, Mule and Donkeys are important livestock species
reared by farmers in the BER for destructive (skins, selling and meat), and non-destructive
(transport, ploughing, reproduction and milk) purposes (BMNP GMP, 2007). Rural
households also generate significant portions of their income from forest products including
firewood and charcoal and non-timber forest products (NTFPs) such as honey, Arabica Coffee
and medicinal plants (Hailemariam et al., 2015). According to the estimation by Tesfaye et al.
(2011) about 34% of per capita income in the BER obtained from forest and forest products.
This implies that farming, livestock husbandry and forest are the three main livelihood sources
of local communities in BER.
3.1.3 Biophysical Characteristics
BER is a high land area with a vertical expansion ranging from 1500 to 3500 meter above sea
level (FARM/SOS, 2007). However the central afro-alpine plateau of the eco-region reaches
more than 4000 meters above sea level. The climate of BER is influenced by low level
easterly winds from the Indian Ocean (Walelegn, 2007) and characterized by eight months
24
rainy season (March to October) and four months dry season (November to February)
(Hailemariam et al., 2015). The annual rainfall of the region ranges from 1000 to 1400mm
(Walelegn, 2007). Temperature records from the BER indicate that the wet seasons are
comparatively warm and the dry seasons are characterized by extremely cold night and warm
day time. The lowest recorded temperature at highest plateau of Bale (Sanette) was -15 ºc and
the maximum record was 26 ºc in Delo Mena Wereda. Similarly the lowest recorded
temperature in Dinsho area is -6 ºc (Hillman, 1986; Hailemariam et al., 2015).
BER, with the BMNP at its heart is the largest Afro-alpine area left in Africa and
characterized by forest areas, afro-alpine plateau, mountains and valleys, grasslands and
agricultural land (FARM Africa, 2008). The Afro-alpine plateau and forests in BER are home
of globally unique and diverse fauna and flora, including a significant number of rare and
endemic species (FARM Africa, 2008). BER is named as a ‘water tower’ of south-eastern
Ethiopia, Somalia and Northern Kenya. This is because over 40 streams and springs and five
major rivers namely; the Web, Wabi Shebele, Welmel, Dumal and Ganale arise from this area
supplying water for around 12 million people in the lowlands of southeast Ethiopia, Northern
Kenya and Somalia (FARM Africa, 2008; OFWE et al., 2014). The ecosystem also provides
several goods and services for millions of peoples living in the highland and lowland part of
the region. The Harena forest including its large genetic pool of wild Arabica Coffee and vast
carbon store is the second largest stand of moist tropical forest in Ethiopia (Watson, 2013).
Main soil types in the BER are Cambisols, Vertisols, Luvisols, Lithosols and Nitosols (OFWE
et al., 2014).
25
3.2 Study Site Selection Procedures
There are about 16 Weredas in the BER. Currently the SHARE Bale Eco-Region project
“sustainable biodiversity conservation and improved local livelihoods at Bale Eco-Region” is
running by a consortium of organizations, which are Farm Africa, SOS Sahel Ethiopia,
Frankfurt Zoological Society (FZS), Population Health Environment Ethiopia Consortium
(PHEEC) and International Water Management Institute (IWMI) in the Bale Eco-Region. This
project is implementing its activities in seven Weredas namely; Adaba, Dinsho, Goba
(Highland Woredas), Harena Buluk (Mid altitude Woreda) and Delo Mena, Meda Welabu,
Berbere (Low altitude Woredas). Accordingly this research focused on these intervention
Weredas with a financial support from SHARE Bale Eco-Region project.
For focus group discussion and key informant interview three Woredas were selected by using
multistage sampling technique. First, the existing seven Weredas were stratified agro-
ecologically into highland, midland and lowland Weredas. Then three Weredes, (one from
each agro-ecology) were selected purposively to represent the three agro-ecologies. Basically
these sample Weredas were selected based on four purposive criteria. The first was an area
where rapid population growth and associated natural resource degradation was observed,
secondly, livelihood strategies of the local communities (high dependency on forest resource
and livestock production), thirdly Weredas under PFM (participatory forest management) and
PRM (Participatory rangeland management) projects and national park interactions. This is
important for comparative analysis of LU/LCC under different institutional arrangements in
BER. The fourth criterion was their accessibility for the researcher. Information for the
aforementioned criteria was gathered during reconnaissance filed survey and from
26
unsupervised image classification information undertaken preliminary to major field survey.
Accordingly Goba (from highland Woredas), Harena Buluk (from mid altitude Woredas) and
Delo Mena (from low altitude Woredas) were sample geographic units selected for this study.
Each Weredas composed of Kebeles which are the smallest local administrative units. Out of
all Kebeles existing in the sampled Weredas, six Kebeles (two from each representative
Weredas) were selected purposely. Representative Kebeles were selected purposively based
on their membership in target project area of SHARE Bale Eco-region project and their
accessibility for the researcher.
For the analysis of LU/LCC under different institutional set-up in the BER seven sample
Kebeles were selected from the three agro-ecologies purposively. The main criteria used to
select sample Kebeles were representativeness of Kebeles to major LU/LC types namely;
woodland, forest and grazing land, existing natural resource management institutions such as
Federal government /BMNP, Oromia regional government land administration, PFM and
PRM and existing proximate drivers of LU/LCC such as agricultural expansion. Accordingly
Wagitu Shabe, Tosha, Rira from Goba Wereda (highland agro-ecology), Hawo and Shawe
from Harena Buluk Wereda (midland agro-ecology) and Berak and Naniga Dera from Delo
Mena Wereda (lowland agro-ecology) are sample Kebeles selected for LU/LCC analysis
under different institutional set-up. Wagitu Shabe and Shawe are Kebeles under PFM and
Tosha and Berak are under Wereda land administration. Rira and Naniga Dera are Kebeles
under the Federal government /BMNP and PRM respectively. Hawo is the only Kebele
situated under three institutional set-ups namely; Federal government /BMNP, PFM and
Wereda land administration.
27
3.3 Sources and Types of Data
To meet the objectives of this research, different kinds of data were collected from both
primary and secondary data sources. Data from primary sources include satellite imagery and
field data. Secondary data such as census records and unpublished official documents and
reports were gathered from Central Statistical Authority (CSA) of Ethiopia and offices of
Agricultural and Rural Development, and Land and Environmental Protection respectively.
Additionally past research works were used as supportive secondary data sources.
3.4 Data Acquisition
3.4.1 Satellite Image and GIS Data Collection
Time series Landsat images of 1986, 1996, 2006 and 2016 were used to analyze LU/LCC of
entire BER. The reason why images of these years were selected was in order to match the RS
data with major events undertaken during these years. These are the 1985/86 resettlement
program by the Derge government, implementation of participatory forest management (PFM)
by GIZ and Oromia region agricultural bureau starting from 1995 and finally implementation
of PFM by Farm Africa and SOS Sahel starting from 2006. On the other hand Landsat images
of 2006 and 2016 were used for analysis of LU/LCC under different institutional arrangements
(Federal government /BMNP, Oromia regional government land administration, PFM and
PRM). All data were collected from U.S. Geological Survey Center for Earth Resources
Observation and Science (USGS-EROS) (http://geography.usgs.gov) which comprised of the,
Landsat Thematic Mapper (TM), Enhanced Thematic Mapper Plus (ETM+) and Operational
Land Imager/Thermal Infrared Sensor (OLI/TIRS). All images used in this study had 30 m
spatial resolution and below 10% cloud cover. Detailed characteristics of the sources of data
28
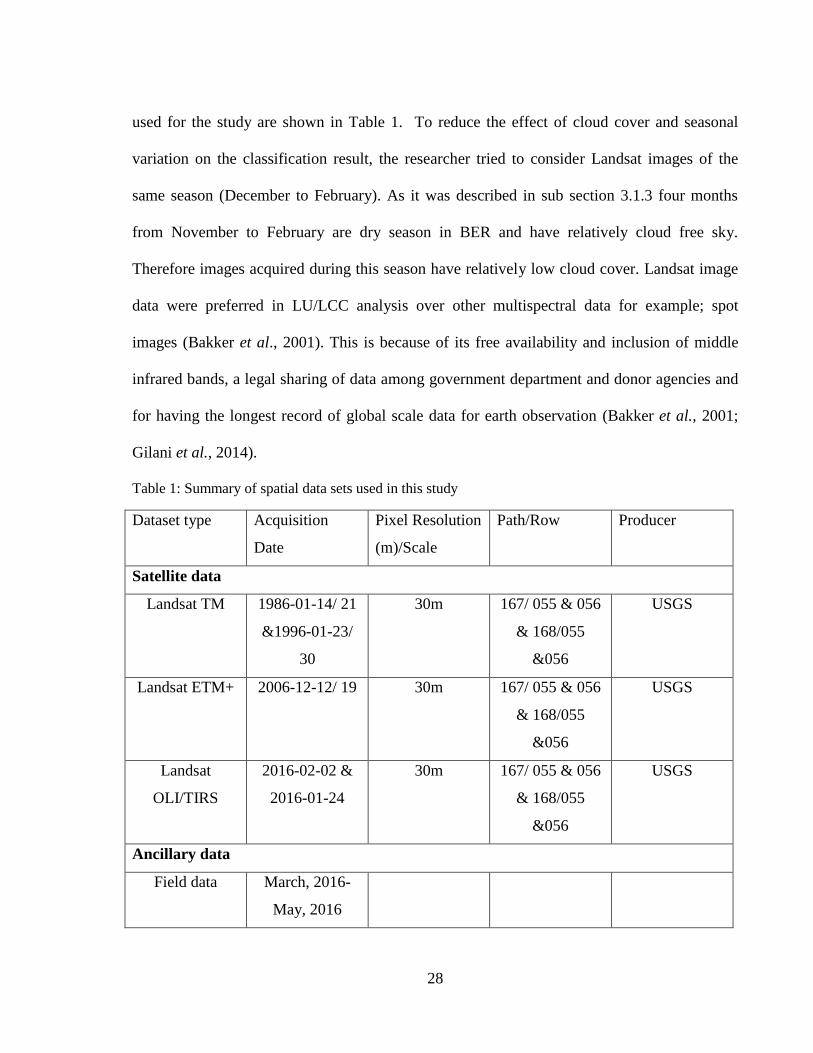
used for the study are shown in Table 1. To reduce the effect of cloud cover and seasonal
variation on the classification result, the researcher tried to consider Landsat images of the
same season (December to February). As it was described in sub section 3.1.3 four months
from November to February are dry season in BER and have relatively cloud free sky.
Therefore images acquired during this season have relatively low cloud cover. Landsat image
data were preferred in LU/LCC analysis over other multispectral data for example; spot
images (Bakker et al., 2001). This is because of its free availability and inclusion of middle
infrared bands, a legal sharing of data among government department and donor agencies and
for having the longest record of global scale data for earth observation (Bakker et al., 2001;
Gilani et al., 2014).
Table 1: Summary of spatial data sets used in this study
Dataset type Acquisition
Date
Pixel Resolution
(m)/Scale
Path/Row Producer
Satellite data
Landsat TM 1986-01-14/ 21
&1996-01-23/
30
30m 167/ 055 & 056
& 168/055
&056
USGS
Landsat ETM+ 2006-12-12/ 19 30m 167/ 055 & 056
& 168/055
&056
USGS
Landsat
OLI/TIRS
2016-02-02 &
2016-01-24
30m 167/ 055 & 056
& 168/055
&056
USGS
Ancillary data
Field data March, 2016-
May, 2016
29
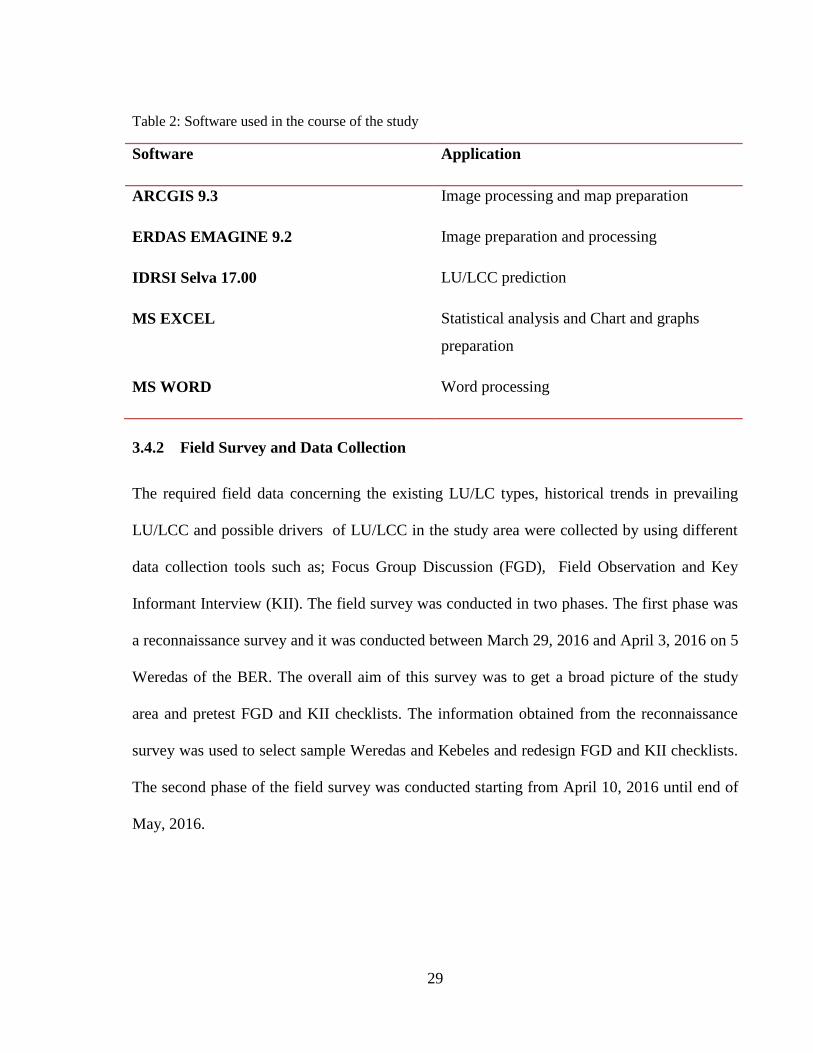
Table 2: Software used in the course of the study
Software Application
ARCGIS 9.3 Image processing and map preparation
ERDAS EMAGINE 9.2 Image preparation and processing
IDRSI Selva 17.00 LU/LCC prediction
MS EXCEL Statistical analysis and Chart and graphs
preparation
MS WORD Word processing
3.4.2 Field Survey and Data Collection
The required field data concerning the existing LU/LC types, historical trends in prevailing
LU/LCC and possible drivers of LU/LCC in the study area were collected by using different
data collection tools such as; Focus Group Discussion (FGD), Field Observation and Key
Informant Interview (KII). The field survey was conducted in two phases. The first phase was
a reconnaissance survey and it was conducted between March 29, 2016 and April 3, 2016 on 5
Weredas of the BER. The overall aim of this survey was to get a broad picture of the study
area and pretest FGD and KII checklists. The information obtained from the reconnaissance
survey was used to select sample Weredas and Kebeles and redesign FGD and KII checklists.
The second phase of the field survey was conducted starting from April 10, 2016 until end of
May, 2016.
30
I). Reconnaissance Survey
Before starting the fieldwork a reconnaissance survey was carried out in the month of March.
During the reconnaissance survey informal interviews and meetings were conducted with Bale
Zone agricultural bureau, Wereda pastoral office staff, Wereda natural resource management
experts, SHARE project site coordinators, Kebele administration staff, and elder peoples.
Information such as the current land use practices, natural resource management institutional
set-ups, status of forest and land resources and population and livelihood strategies in terms of
their pressure on land resources has been obtained during the reconnaissance survey.
II). Focus Group Discussion (FGD)
As suggested by many authors like Single (1996) cited in Bhawana (2015), Robinson (1999)
and Jayasekara (2012), based on theme of study and researchers interest the number of
participants in FGD can range from 4 to 10. Accordingly, groups containing 8-10 elderly
people were used in this study. One female group and two male groups from each sample
Kebele were formed. Totally 18 groups were formed from six Kebeles. The reason for
forming separate male and female groups was traditionally in the study area females are not
allowed to sit and speak out full in front of males. The participants of FGDs were selected
purposively from both sexes. Two purposive criteria were used to select participants in FGD.
The first was age of participants i.e. elder people who have lived long time in the study area
and had detail information about the past and present situations of the study sites. A second
criterion is capability to understand the topics and express their feelings and opinions. The
selection was performed with the help of Development Agents (DAs) and peasant associations
(PA) councils. The FGDs was guided by a list of questions as a checklist (Appendix IV). The
aim of FGD was to assess and analyze the extent and trend of changes that discussants
31
perceived to have occurred on their lands and their surroundings in the past 30 year period
between 1986 and 2016 and the driving forces behind such change. This can help to compare
discussants perception with GIS and remote sensing analysis.
III). Key Informant Interview (KII)
With the intention of obtaining in-depth information and cross-checking the data collected
from focus group discussions, few key informant interviews were conducted. In this, one elder
person from each sampled Kebeles, one Wereda Natural Resource Conservation and
Management Expert from each sampled Weredas, one Wereda Environmental and Land
Administration Office Coordinator from each sample Weredas, one PFM /PRM Coordinator
from each sample Weredas and one Kebele Administrator from each sample Kebeles were
involved. Totally, 15 key informants (5 from each Weredas) were selected. The selection of
elder key informants was executed using snowball sampling method with the help of FGD
participants.
IV). Field Observation
All studied Kebeles were visited with one local assistant from each Kebeles to gain insight of
knowledge. Field observation was carried out continuously throughout the data collection
period in the field. During field observation Ground Truthing Points (GTPs) and photos of
existing LU/LC types were collected by using handheld GPS (Global Positioning System) and
digital camera to aid different steps of image processing, classification and accuracy
assessment. This field observation also helped to validate information obtained from FGD and
KII.
32
3.5 Data Analysis
3.5.1 Satellite Image Analysis
Image pre-processing
The study area covers four scenes (Table 1). Therefore firstly the four scenes were
downloaded from USGS-EROS using the path and rows indicated in (Table 1). Secondly the
panchromatic bands in each scene were stacked together so as to produce a multispectral
image for each scene. Thirdly a mosaic of four scenes covering the study area was created by
merging the stacked image via mosaic operation. Subsequently geometric and radiometric
corrections and image enhancement were conducted. All the above mentioned pre-process
were performed on ERDAS IMAGINE 9.2 software prior to the image classification.
Geometric correction involves conversion of data to ground coordinates e.g. UTM by removal
of distortions from sensor geometry. Radiometric correction on the other hand involves
correcting unwanted sensor or atmospheric noise and correcting the data for sensor
irregularities (Seyoum, 2012). Image enhancement is to improve the appearance of the
imagery to assists in image analysis, classification and visual interpretation (Bakker et al.,
2001). Accordingly in order to have all the data in the same coordinate system and ensure
consistency between datasets during analysis all maps and satellite images used in this study
were projected to Universal Transverse Mercator (UTM) projection system Zone 37N and
datum of World Geodetic System 84 (WGS84). Radiometric corrections such as haze
reduction and cutting dark areas were executed as well. To increase the tonal distinction
between various features in the image and to enhance specific spatial patterns in an image two
enhancement function namely contrast stretching and spatial filtering were executed. Finally
33
after passing the aforementioned processes each image are clipped using the boundary of BER
and selected Kebeles for institutional analysis.
Image classification
Image classification involves categorizing raw remotely sensed satellite images into a fewer
number of individual LU/LC classes, based on the reflectance values (Adedeji et al., 2015).
This study used a hybrid classification method involving both unsupervised and supervised
image classification techniques. First unsupervised classification was carried out before field
work to understand the general LU/LC classes of the study area and to select sample training
sites for data collection during field work. This is because unsupervised classification is
automatic and requires little knowledge of the study area. And then after the field work
maximum likelihood supervised classification was carried out to categorize the images using
training sites. Training sites were defined by using original images, the results of unsupervised
classification, field study knowledge and ancillary data (Google Earth). Image classification
was performed by using ERDAS IMAGINE 9.2 software. Ground Truthing Points and
ancillary data (Google Earth) were used to define training sites for the recent image
(OLI/TIRS) classification. Training sites for classification of older images (TM and ETM+)
were defined based on the result of unsupervised classification, spectral values of recent image
and information obtained from elder peoples. In this study a total of 250 Ground Truthing
Points(GTPs) (50 from agriculture/settlement, 50 from forest, 50 from woodland, 50 from
grassland/rangeland and 50 from scrub/bush land) were collected from the field using hand
held global positioning system (GPS). Of the total GTPs collected during the field work 40%
or 100 GTPs (20 from each LU/LC types) were used to assist classification of recent year
34
image (OLI/TIRS), while the remaining 60% (150 GTPs) were used for classification
accuracy assessment of the 2016 image. For classification accuracy assessment of older
images (TM and ETM+) a total test samples of 150 were randomly selected from the original
mosaic image of the respective years.
Accuracy Assessment
To verify to what extent the produced classification is compatible with what actually exists on
the ground it is important to evaluate the accuracy of classification results. Accordingly error
matrix was produced for all images in this study. An error matrix is a square array of rows and
columns and presents the relationship between the classes in the classified and reference data.
The reference data used for accuracy assessment were obtained from GPS points during field
work and original mosaic image. The GPS points used in classification accuracy assessment
were independent of the ground truths used in the classification. Based on the error matrix
overall accuracy and kappa statistics were used to illustrate the classification accuracy.
Therefore an overall accuracy of 86%, 87%, 89% and 87% was achieved for the Landsat TM
of 1986 and 1996; Landsat ETM+ of 2006 and Landsat OLI/TIRS of 2016 respectively
(Appendix II). These imply excellent classifications of Landsat images.
LU/LCC Detection analysis
LU/LCC statistics were computed in three different ways:
1) Total LU/LCC in hectare calculated by
35
Where, Area is extent of each LU/LC type. Positive values suggest an increase whereas
negative values imply a decrease in extent.
2) Percentage LU/LCC calculated using the following equation:
Where, Area is extent of each LU/LC type. Positive values suggest an increase whereas
negative values imply a decrease in extent.
3) Rate of LU/LCC: computed using the following simple formula
Where, r, Q2, Q1 and t indicates rate of change, recent year LU/LC in ha, initial year LU/LC
in ha and interval year between initial and recent year in that order
3.5.2 Data Analysis for Driving Forces of LU/LCC
Data concerning the driving force of LU/LCC collected via FGD and KII were analyzed
qualitatively. Speech transcription and comprehension of speeches techniques were applied.
LU/LCC drivers category provided by Geist & Lambin (2001, 2002) were used to structure
the assessment and analysis of LU/LCC drivers.
3.6 Land Use/Land Cover Change Modeling
Markov chain model implemented in IDIRIS Selva were used to predict LU/LCC for the year
2026. MCM provides transition probability matrix, a transition areas matrix and a set of
conditional probability images. The former represents the probability that each land cover
36
category will change to every other category and the later represents the number of pixels that
are expected to change from each land cover type to each other land cover type over the
specified number of time units. The conditional probability images report the probability that
each land cover type would be found at each pixel after the specified number of time units
(Sang, 2011).
Prior to predicting future LU/LC in 2026 the predictive power of the model was first validated
by predicting the LU/LC for the year 2016. Araya (2009) stated that comparing the result of
the model prediction for time t2 (in this case 2016) to the real map of time t2 (2016) is the only
way to quantify the predictive power of the model. Accordingly the LU/LC for the year 2016
was predicted considering the LU/LC map of 1996 and 2006. This helped to compare the
result of the prediction with the actual LU/LC in 2016. After validating the performance of the
model, a real “prediction” for the year 2026 was carried out. LU/LCC maps for the year 2006
and 2016 were used to predict the land requirement in 2026. This is because the model
determines the prediction result based on the observed pattern between the initial year (2006)
and base year (2016). The year 2026 is selected for prediction, because Markov chain model
requires the time interval between base year (2016) and predicted year (2026) to be analogous
with the time interval between the initial year (2006) and base year (2016).
3.7 Data presentation
The result from both field work and image analysis, were presented in the form of figures, (i.e.
maps and graphs) and tables. Graphs were prepared using Microsoft excel 2007 and Microsoft
word 2007.
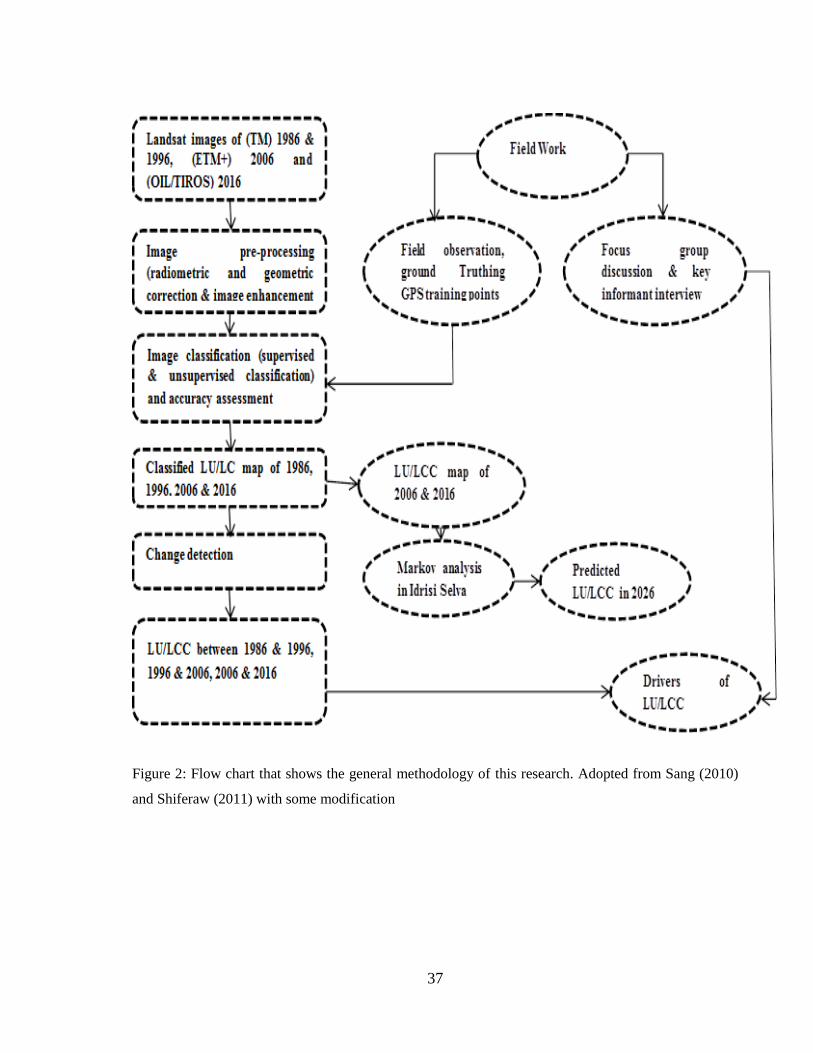
37
Figure 2: Flow chart that shows the general methodology of this research. Adopted from Sang (2010)
and Shiferaw (2011) with some modification
38
4 RESULTS AND DISCUSSION
4.1 Characteristics of LU/LC units
Five, major LU/LC types were identified by using the field data and satellite images of
Landsat TM, 1986. These were forest, woodland, scrub/bush land, grassland/rangeland and
agriculture/settlement (Table 3). Water was added as a new LU/LC type in the Landsat images
of TM 1996, ETM+ 2006 and OIL/TIROS 2016 owing to the presence of dam in these
images. Rivers, streams and springs were not included in the classification. This is due to
resolution problem of the image (30m), the very low likelihood of identifying springs and
rivers from riverine vegetation. In the classification forest was made to include human made
plantation forest, riverine forests, dry ever green forest and moist mountain forest. This is
because as they had the same spectral nature on the images, it was difficult to differentiate one
from the other. This classification is in line with Tesfaye et al. (2014) who grouped both
natural forest and plantation forests under forest category. On the other hand it was difficult to
identify settlements especially rural settlements from agricultural land on 30m spatial
resolution image and in most cases the two are spatially integrated. Therefore settlements were
grouped under agricultural land covers. This classification is in agreement with Desalegn et al.
(2014) who grouped agriculture and settlement under one class for the same reason listed
above.
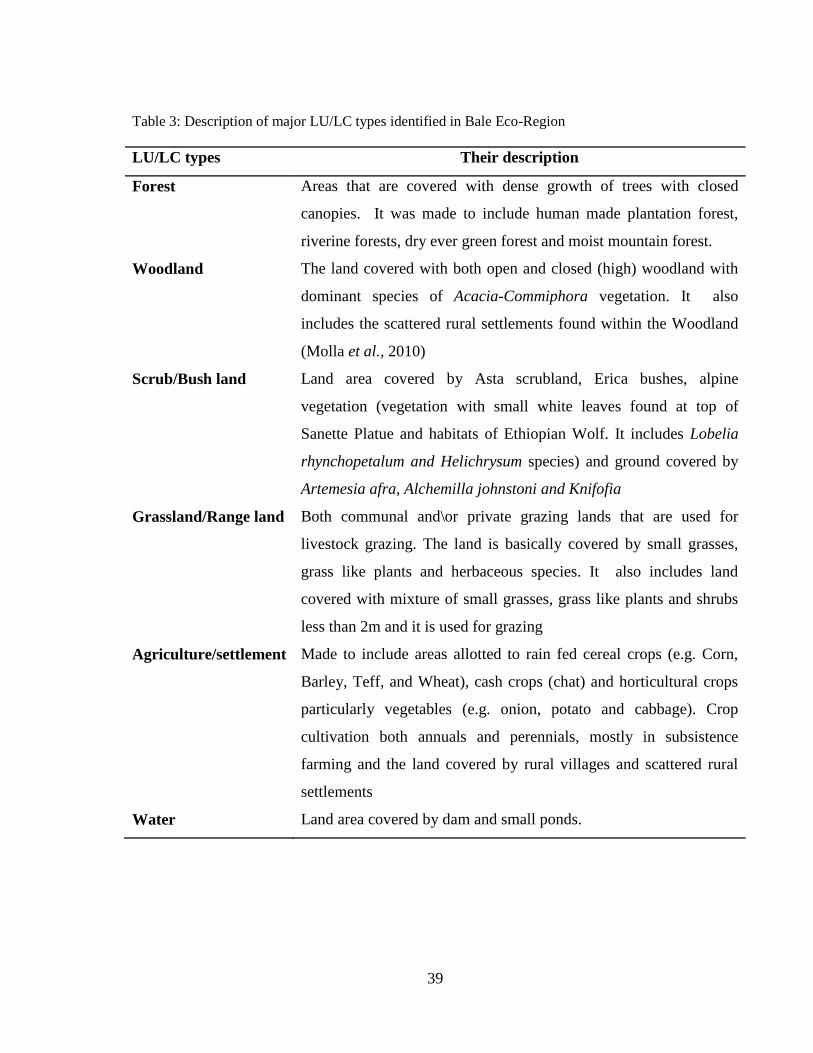
39
Table 3: Description of major LU/LC types identified in Bale Eco-Region
LU/LC types Their description
Forest Areas that are covered with dense growth of trees with closed
canopies. It was made to include human made plantation forest,
riverine forests, dry ever green forest and moist mountain forest.
Woodland The land covered with both open and closed (high) woodland with
dominant species of Acacia-Commiphora vegetation. It also
includes the scattered rural settlements found within the Woodland
(Molla et al., 2010)
Scrub/Bush land Land area covered by Asta scrubland, Erica bushes, alpine
vegetation (vegetation with small white leaves found at top of
Sanette Platue and habitats of Ethiopian Wolf. It includes Lobelia
rhynchopetalum and Helichrysum species) and ground covered by
Artemesia afra, Alchemilla johnstoni and Knifofia
Grassland/Range land Both communal and\or private grazing lands that are used for
livestock grazing. The land is basically covered by small grasses,
grass like plants and herbaceous species. It also includes land
covered with mixture of small grasses, grass like plants and shrubs
less than 2m and it is used for grazing
Agriculture/settlement Made to include areas allotted to rain fed cereal crops (e.g. Corn,
Barley, Teff, and Wheat), cash crops (chat) and horticultural crops
particularly vegetables (e.g. onion, potato and cabbage). Crop
cultivation both annuals and perennials, mostly in subsistence
farming and the land covered by rural villages and scattered rural
settlements
Water Land area covered by dam and small ponds.
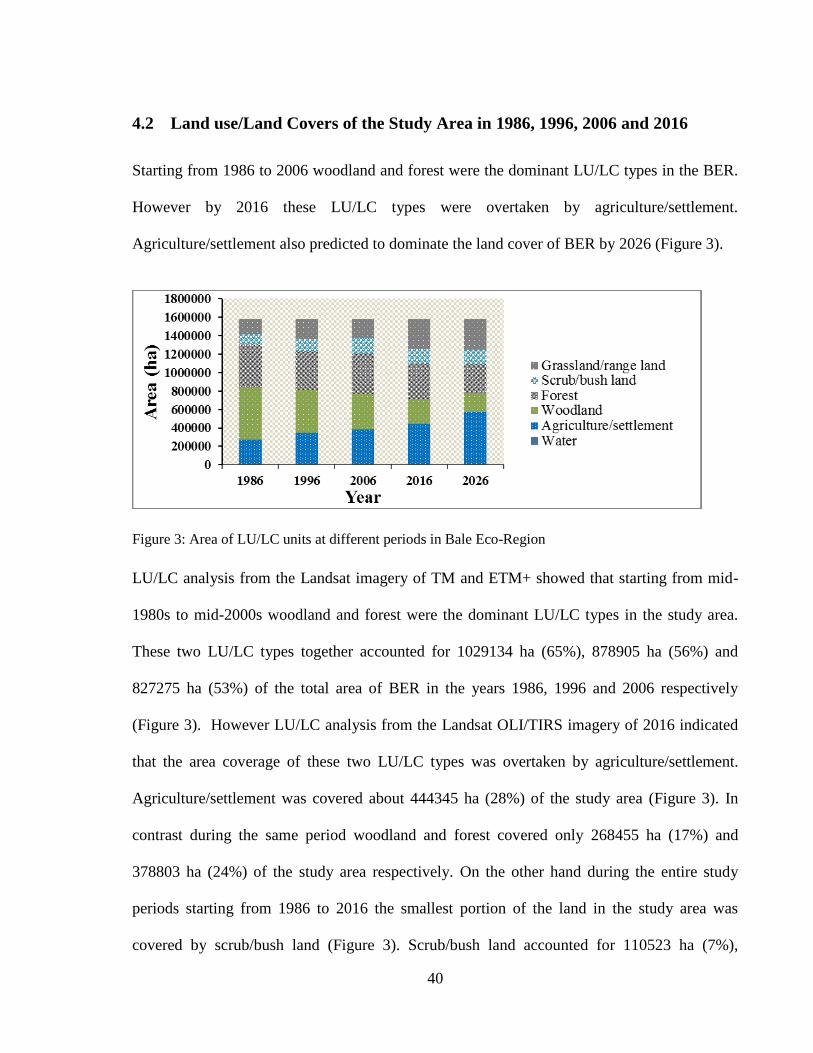
40
4.2 Land use/Land Covers of the Study Area in 1986, 1996, 2006 and 2016
Starting from 1986 to 2006 woodland and forest were the dominant LU/LC types in the BER.
However by 2016 these LU/LC types were overtaken by agriculture/settlement.
Agriculture/settlement also predicted to dominate the land cover of BER by 2026 (Figure 3).
Figure 3: Area of LU/LC units at different periods in Bale Eco-Region
LU/LC analysis from the Landsat imagery of TM and ETM+ showed that starting from mid-
1980s to mid-2000s woodland and forest were the dominant LU/LC types in the study area.
These two LU/LC types together accounted for 1029134 ha (65%), 878905 ha (56%) and
827275 ha (53%) of the total area of BER in the years 1986, 1996 and 2006 respectively
(Figure 3). However LU/LC analysis from the Landsat OLI/TIRS imagery of 2016 indicated
that the area coverage of these two LU/LC types was overtaken by agriculture/settlement.
Agriculture/settlement was covered about 444345 ha (28%) of the study area (Figure 3). In
contrast during the same period woodland and forest covered only 268455 ha (17%) and
378803 ha (24%) of the study area respectively. On the other hand during the entire study
periods starting from 1986 to 2016 the smallest portion of the land in the study area was
covered by scrub/bush land (Figure 3). Scrub/bush land accounted for 110523 ha (7%),
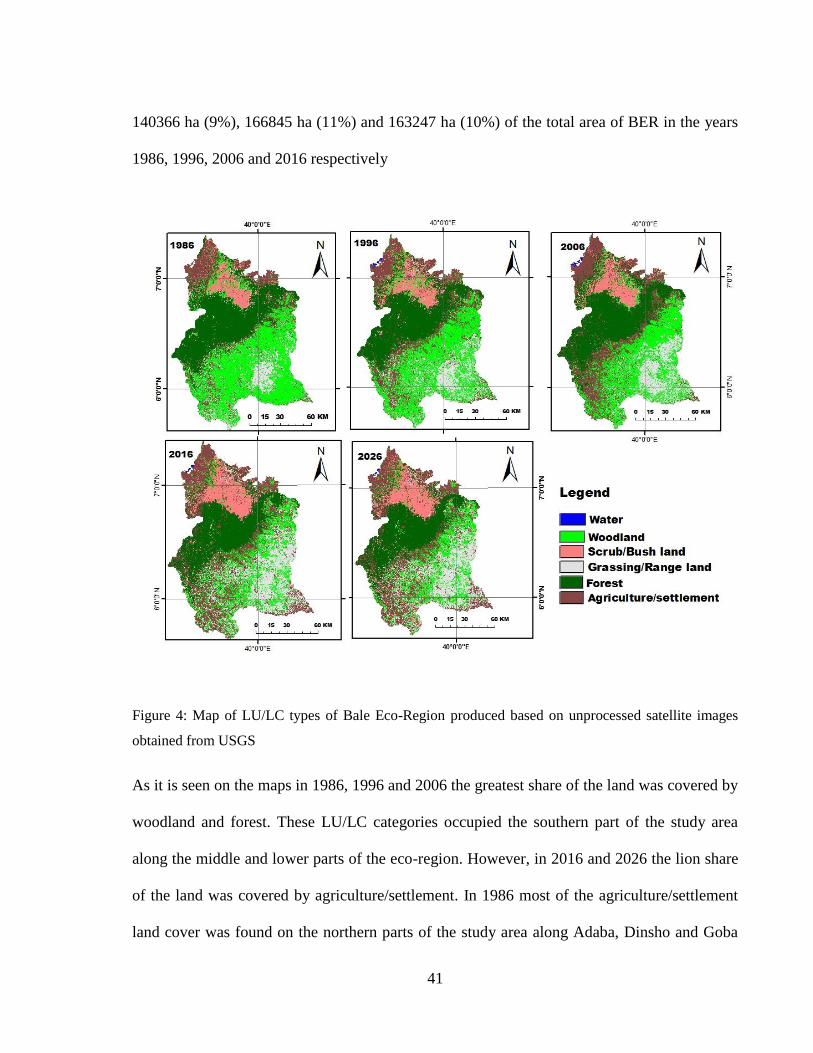
41
140366 ha (9%), 166845 ha (11%) and 163247 ha (10%) of the total area of BER in the years
1986, 1996, 2006 and 2016 respectively
Figure 4: Map of LU/LC types of Bale Eco-Region produced based on unprocessed satellite images
obtained from USGS
As it is seen on the maps in 1986, 1996 and 2006 the greatest share of the land was covered by
woodland and forest. These LU/LC categories occupied the southern part of the study area
along the middle and lower parts of the eco-region. However, in 2016 and 2026 the lion share
of the land was covered by agriculture/settlement. In 1986 most of the agriculture/settlement
land cover was found on the northern parts of the study area along Adaba, Dinsho and Goba
42
Weredas. However, starting from 1996 to 2016 this LU/LC type was greatly expanded to the
southern part of the Harena forest and throughout the low land areas. It also expected to
expand for the year 2026 as well. In all maps the majority of scrub/bush land were occupied
the northern part of the study area above 3800 meters above sea level at Sanette Platue. In
contrast the majority of grassland/rangeland was located at southern part of the Harena forest
and throughout the lowland areas. There is a great expansion of agriculture/settlement and
grassland/rangelands along the southern part of the study area throughout the whole years.
4.3 Land Use/Land Cover Change Detection
4.3.1 Trend of LU/LCC in Bale Eco-Region
Bale Eco-region experienced different LU/LCC between 1986 and 2016. The land under
woodland decreased continuously between the indicated years. In contrast the area of forest,
scrub/bush land and grassland/rangeland showed a fluctuating trend between the study periods
(Figure 5).
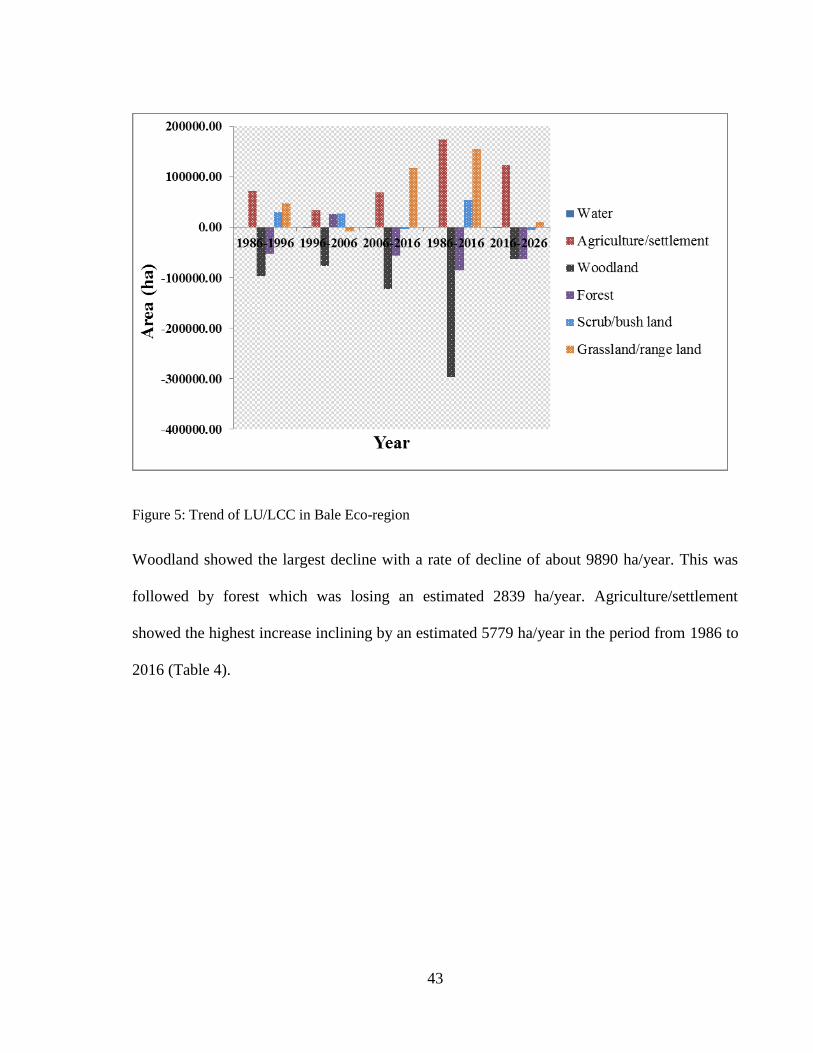
43
Figure 5: Trend of LU/LCC in Bale Eco-region
Woodland showed the largest decline with a rate of decline of about 9890 ha/year. This was
followed by forest which was losing an estimated 2839 ha/year. Agriculture/settlement
showed the highest increase inclining by an estimated 5779 ha/year in the period from 1986 to
2016 (Table 4).
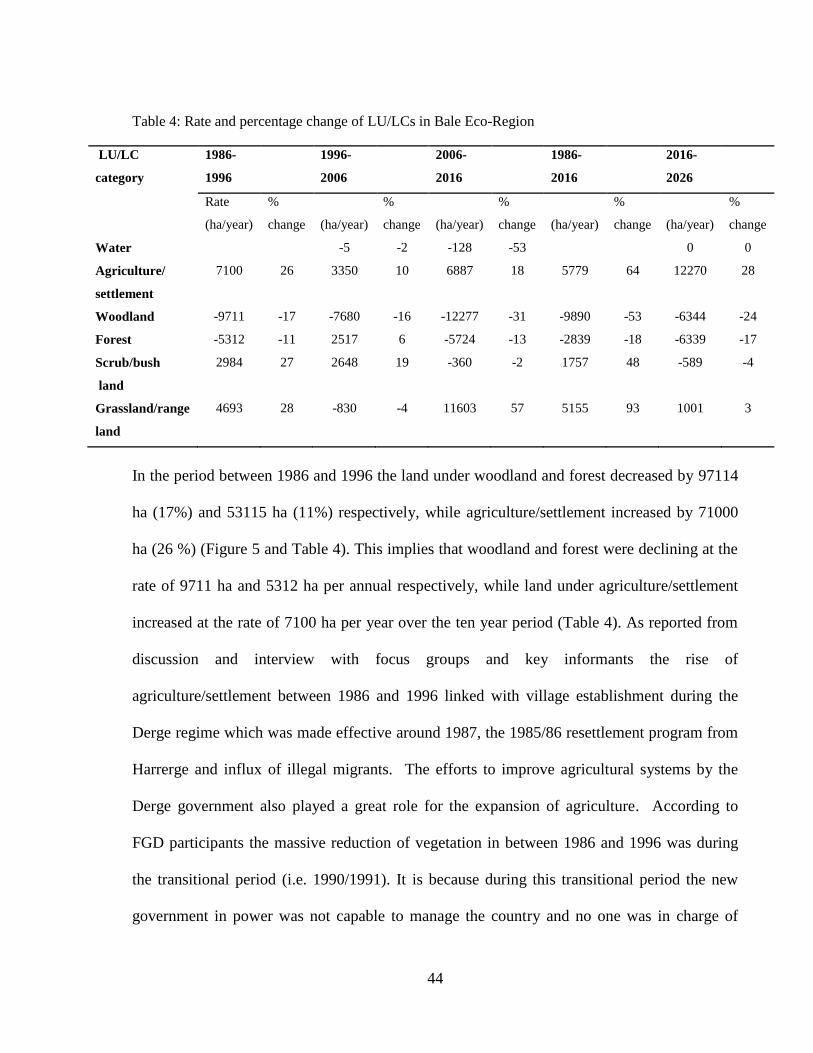
44
Table 4: Rate and percentage change of LU/LCs in Bale Eco-Region
LU/LC
category
1986-
1996
1996-
2006
2006-
2016
1986-
2016
2016-
2026
Rate
(ha/year)
%
change
(ha/year)
%
change
(ha/year)
%
change
(ha/year)
%
change
(ha/year)
%
change
Water -5 -2 -128 -53 0 0
Agriculture/ 7100 26 3350 10 6887 18 5779 64 12270 28
settlement
Woodland -9711 -17 -7680 -16 -12277 -31 -9890 -53 -6344 -24
Forest -5312 -11 2517 6 -5724 -13 -2839 -18 -6339 -17
Scrub/bush 2984 27 2648 19 -360 -2 1757 48 -589 -4
land
Grassland/range
land
4693 28 -830 -4 11603 57 5155 93 1001 3
In the period between 1986 and 1996 the land under woodland and forest decreased by 97114
ha (17%) and 53115 ha (11%) respectively, while agriculture/settlement increased by 71000
ha (26 %) (Figure 5 and Table 4). This implies that woodland and forest were declining at the
rate of 9711 ha and 5312 ha per annual respectively, while land under agriculture/settlement
increased at the rate of 7100 ha per year over the ten year period (Table 4). As reported from
discussion and interview with focus groups and key informants the rise of
agriculture/settlement between 1986 and 1996 linked with village establishment during the
Derge regime which was made effective around 1987, the 1985/86 resettlement program from
Harrerge and influx of illegal migrants. The efforts to improve agricultural systems by the
Derge government also played a great role for the expansion of agriculture. According to
FGD participants the massive reduction of vegetation in between 1986 and 1996 was during
the transitional period (i.e. 1990/1991). It is because during this transitional period the new
government in power was not capable to manage the country and no one was in charge of
45
protecting the natural resources of the country. Following the end of the war local peoples
participating in the war were returned to their environment and subsequently cleared the forest
to fulfill their livelihood requirements. Beside the local communities peoples coming from
other regions were also participated in the deforestation. Therefore lack of administration
coupled with lack of awareness among the local communities about the consequences of forest
conversion was the reasons behind this historic deforestation.
The result for the second period (1996-2006) indicated that the land under forest cover
increased by 25174 ha (6%) as compared to the first period (1986 - 1996) (Figure 5 and Table
4). On the other hand woodland and agriculture/settlement continued to decrease and increase
in the second period respectively. Woodland decreased by 76804 ha (16%), while
agriculture/settlement expanded by 33500 ha (10%). Increase in forest resource during this
period linked with different factors such as the integrated and participatory forest management
project which was implemented in the BER between 1995 and 2006 by GIZ and the Oromia
Bureau of Agriculture and Rural Development, extensive plantations carried out by the project
in Adaba Wereda and plantations by smallholder farmers in Goba Wereda. In line to the
finding of this study Tesfaye et al. (2014) reported increment in forest cover between 1986
and 2008 in Gilgel Tekeze catchment, Northern Ethiopia. The researcher has claimed that
increment in forest cover was due to tree plantation campaign and construction of terraces in
the hill slopes. Desalegn et al. (2014) also reported the rise in forest cover between 1975 and
1986 due to implementation of huge afforestation campaign by the Derge government in the
central highlands of Ethiopia.
46
The third period (2006-2016) result shows that grassland/rangeland increased greatly (i.e.
11603 ha/year (57%)) in the southern part of the Harena forest and throughout the low land
areas, with a corresponding decrease in woodland (12277 ha/year (31%)) (Table 4).
Grassland/rangeland increased at the expense of other LU/LC categories mainly woodland and
agriculture/settlement (Table 9). Shifting cultivation practices contributed for conversion of
woodlands to rangelands in the lowland parts of the eco-region creating huge openings in
woodland after cultivation is abandoned. On the other hand fallowing is one way of farmland
management practices in the study area, implying that the fallow farmlands used as a grazing
land for cattle. In some cases cultivated lands also permanently left for grazing. In agreement
to the finding of this study Alemayehu (2015) also reported expansion of grassland at the
expance of agricultural land in Fagita Lekoma Woreda, Awi Zone, North Western Ethiopia
between 1973 and 2015. Shiferaw (2011) also reported expansion of grassland at the expense
of forest and shrub land in Borena Woreda of South Wollo Highlands, between 1985 and
2003. Reduction of scrub/bush lands between 2006 and 2016 (Table 4) linked with deliberate
fire around scrub lands in order to expand grazing land. According to discussants of Goba
Wereda conversion of grazing lands in to agriculture and Eucalyptus tree plantation forced
inhabitants to send their livestock inside the afro-alpine scrub land to graze.
During the 30 year period between 1986 and 2016 the proportion of area covered by woodland
was continually decreasing as it was 565147 ha (36%) in 1986 and 268455 ha (17%) in 2016
(Figure 3). In contrast agriculture/settlement was continuously increasing as it was 270976 ha
(17%) in 1986 and 444345 ha (28%) in 2016 (Figure 3).
47
Generally the major finding from the analysis of Landsat images revealed a great reduction in
the area of woodland and forest and a corresponding increase in the area of
agriculture/settlement over the 30 year period. Focus group discussions and interviews
conducted in BER also support this trend showing increase in land under
agriculture/settlement over time with a corresponding reduction in land under forest and
woodland cover. In 1986 woodland and forest were the dominant LU/LC types in the study
area. This is because, during this time the area were characterized by relatively low population
pressure, small agricultural activities and to some extent undisturbed environmental condition.
However the largest part of lands that were covered by woodland and forest before 30 years
now replaced by agriculture and settlement. In agreement to the finding of this research,
studies conducted in dry and semi-dry land parts of Ethiopia such as Garedew (2010), Tefera
(2011), Alemu et al. (2015) documented reduction of area under woodland and increase in
area under agricultural land. Rapid reduction in woodland and forest and increase in
agriculture and settlement were also reported by Zeleke and Hurni (2001) in Dembecha area
of Gojjam, Molla et al. (2010) in the mountain landscape of Tera Gedam and adjacent agro-
ecosystem, Northwest Ethiopia and Kindu et al. (2013) in Munessa Shashemene landscape of
the Ethiopian highlands. However it is contrary to the work of Alemayehu (2015) who
reported expansion of forest land between 1973 and 2015 with corresponding reduction of
cultivated land in Fagita Lekoma Woreda, Awi Zone, Northwestern Ethiopia.
The information obtained from FGD participants and key informants, confirmed that the major
reasons for the continual expansion of agriculture/settlement between 1986 and 2016 in the
eco-region are rapid population growth, gradual change in the economic activities of
48
communities in the area from pure pastoralist to agro-pastoralist, loss of soil fertility,
vilagization and resettlement policies and poverty and food insecurity.
4.3.2 Land Use/Land Cover Change Matrix
Conversion matrixes were analyzed for each period to clearly show the source and destination
of the major LU/LCCs. Analysis of conversion matrix were computed by overlaying classified
images of two study year on ArcGIS 9.3. Results of the analysis are presented under Appendix
I. In all change matrixes the row of the table stand for the initial year and the column of the
table symbolize the final year of the change. More over except Table 11 all change matrixes
shows gross gain and loss of each land cover category during the study periods. The diagonal
numbers in bold show the unchanged pixels.
During the study period between 1986 and 2016 about 837446 ha (53%) of the study area
landscape remained unchanged. This implies around 47% of the total landscape of the study
area was converted from one LU/LC type to the other (Appendix I, Table 11). The level of
conversion varies amidst the LU/LC types. The woodland in the landscape was mainly
converted to grassland/rangeland and agriculture/settlement (Appendix I, Table 11). Forest
land was mainly converted to agriculture/settlement and woodland. Agriculture/settlement
replaced about 173117 ha of the land that used to be covered by other LU/LC types. The
major conversion were from woodland (150050 ha), forest (75989 ha) and grassland/range
land (37453 ha) (Appendix I, Table 11). Of all LU/LC types woodland experienced the lowest
persistence, whereas forest land was the most persistent cover type (Appendix I, Table 11).
Out of 567916 ha of woodland in 1986 about 390263 ha (69 %) were converted to other
LU/LC in 2016, while it is only 121,035 ha (26%) of forest land converted to other LU/LC
49
types between the indicated period. The net persistence for agriculture/settlement, woodland
and grassland/rangeland was large (relatively far from zero in both direction), whereas it is
closer to zero for the remaining LU/LC types (Appendix I, Table 11). The net persistence
closer to zero indicates the higher tendency of LU/LC types to persist rather than decline or
increase.
4.4 LU/LCC under different institutional set-up in Bale Eco-Region
Analysis of LU/LCC under different institutional set ups (Federal government /BMNP,
Oromia regional government land administration, PFM and PRM) showed considerable
difference in LU/LCC between 2006 and 2016. The most important change was the expansion
of agriculture/settlement and reduction of woodland and forest in all institutions, but with
differing rates (Table 5).
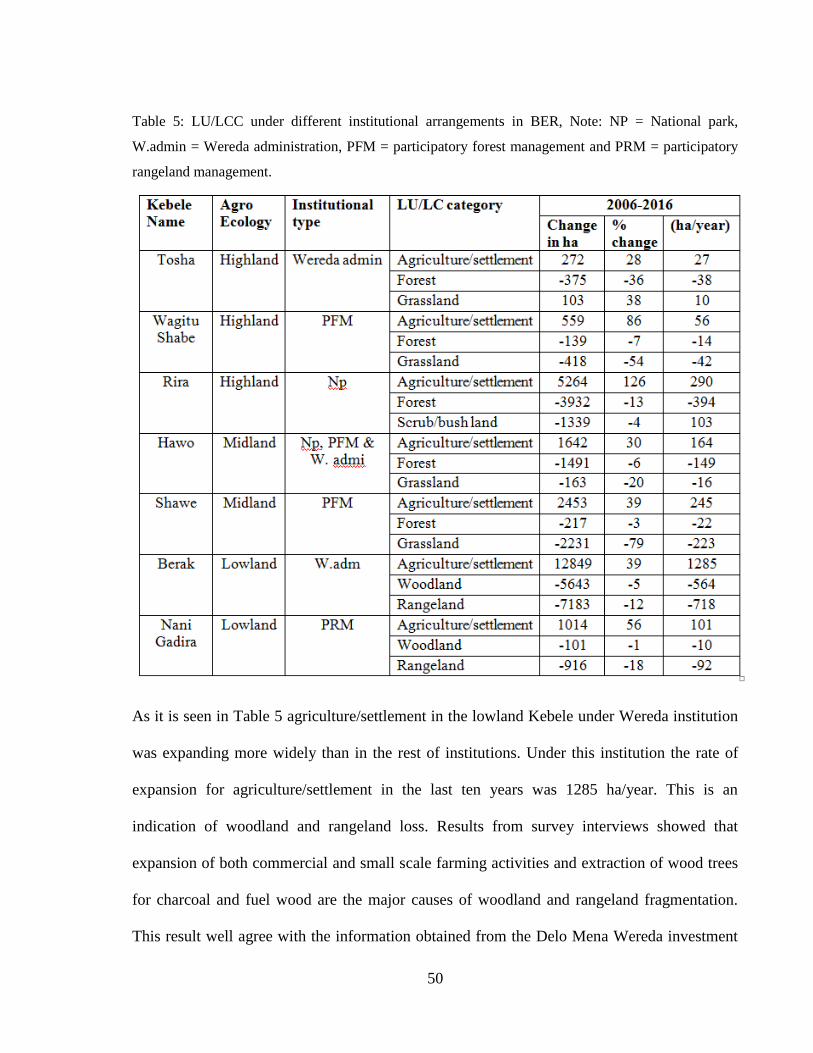
50
Table 5: LU/LCC under different institutional arrangements in BER, Note: NP = National park,
W.admin = Wereda administration, PFM = participatory forest management and PRM = participatory
rangeland management.
As it is seen in Table 5 agriculture/settlement in the lowland Kebele under Wereda institution
was expanding more widely than in the rest of institutions. Under this institution the rate of
expansion for agriculture/settlement in the last ten years was 1285 ha/year. This is an
indication of woodland and rangeland loss. Results from survey interviews showed that
expansion of both commercial and small scale farming activities and extraction of wood trees
for charcoal and fuel wood are the major causes of woodland and rangeland fragmentation.
This result well agree with the information obtained from the Delo Mena Wereda investment
51
office i.e. between 2011 and 2015/16 in Berak, Haya oda, Kale Golba and Naniga Dera
Kebeles about 6163 ha of rangeland and woodlands were given for agricultural investment. Of
this about 4952 ha (80%) is found in Berak Kebele. The result of this research under Table 11
is also consistence with this finding which documented the conversion of woodland and range
lands to agriculture/settlement.
Rira Kebele which is in highland agro-ecology and under national park is the second
institution where the rate of agriculture/settlement expansion was high followed by Kebeles
under PFM in midland agro-ecology. In the Kebele under national park agriculture/settlement
was expanding at the rate of 290 ha/year and it was at the expance of forestland. According to
the result of the LU/LCC analysis the rate of agriculture/settlement expansion is much smaller
in Tosha Kebele which is in the highland agro-ecology and under Wereda institution with 27
ha/year.
Comparing the loss of woodland and forest across different institutions, woodland in the
lowland Kebele under Wereda land administration showed the highest rate of reduction (564
ha/year) followed by forest in Kebele under federal institution (the national park) (394
ha/year). In contrast woodland in lowland Kebele under PRM and forest in highland and
midland Kebeles under PFM demonstrated the lowest rate of reduction. However, grassland in
Kebeles under PFM in highland and mid lands showed the highest rate of reduction (133
ha/year) over the last ten years as compared to other institutions.
From this one can conclude that between 2006 and 2016 much of the expansion in
agriculture/settlement was undertaken in the lowland and highland Weredas of BER especially
on the land under the Wereda administration and national park respectively. This expansion of
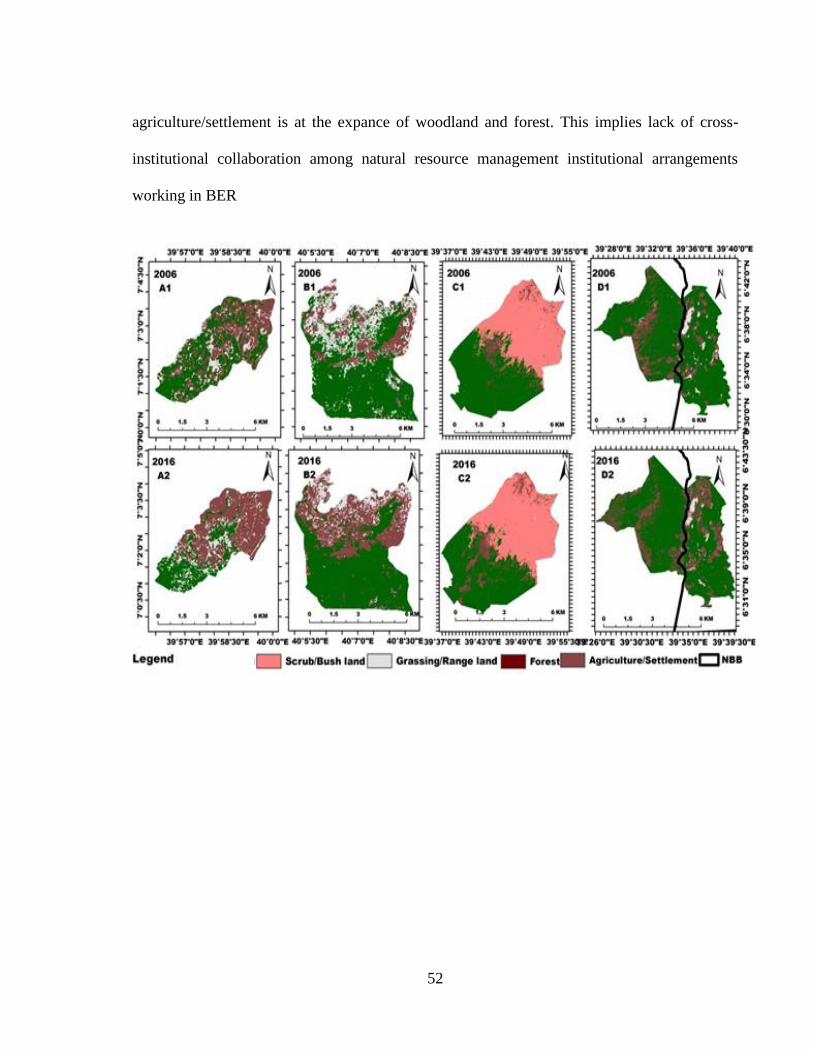
52
agriculture/settlement is at the expance of woodland and forest. This implies lack of cross-
institutional collaboration among natural resource management institutional arrangements
working in BER
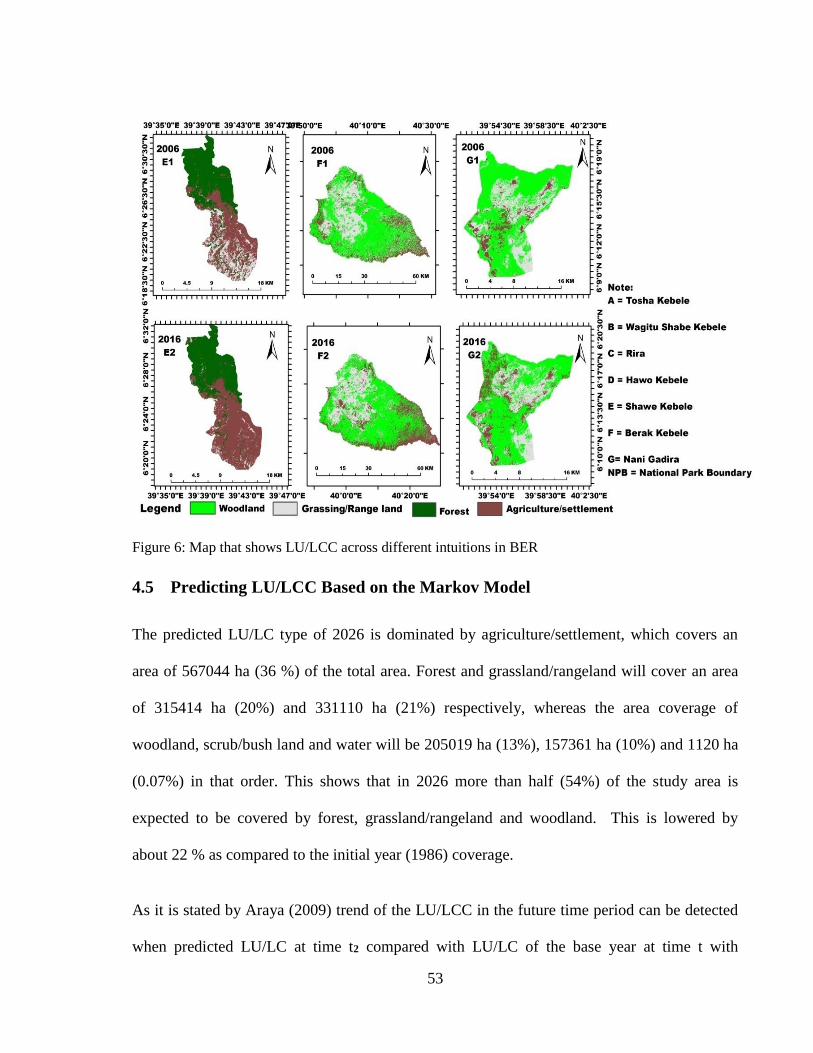
53
Figure 6: Map that shows LU/LCC across different intuitions in BER
4.5 Predicting LU/LCC Based on the Markov Model
The predicted LU/LC type of 2026 is dominated by agriculture/settlement, which covers an
area of 567044 ha (36 %) of the total area. Forest and grassland/rangeland will cover an area
of 315414 ha (20%) and 331110 ha (21%) respectively, whereas the area coverage of
woodland, scrub/bush land and water will be 205019 ha (13%), 157361 ha (10%) and 1120 ha
(0.07%) in that order. This shows that in 2026 more than half (54%) of the study area is
expected to be covered by forest, grassland/rangeland and woodland. This is lowered by
about 22 % as compared to the initial year (1986) coverage.
As it is stated by Araya (2009) trend of the LU/LCC in the future time period can be detected
when predicted LU/LC at time t2 compared with LU/LC of the base year at time t with
54
reference to the class area metrics. Therefore as compared to the base year 2016 in 2026
agriculture/settlement is predicted to increase by 28%, while woodland and forest are
predicted to decrease by 24% and 17% respectively (Table 4).
The growth of agriculture/settlement will come largely at the expense of scrub/bush land,
forest and woodland respectively. This is because as it is seen in the probability matrix
(Appendix I Table 10) the probability of these LU/LC categories to change to
agriculture/settlement is high i.e. 46, 40 and 33 percent in that order. As it is indicated in the
probability matrix (Appendix I Table 10) in 2026 we expect 12% of woodland and 24% of
forest to persist and 88% of woodland and 76% of forest to change to other LU/LC. However
these two LU/LC categories are expected to gain 54% and 74% from other LU/LC categories.
This implies that woodland and forest will have a net loss of 34% and 2% respectively.
4.6 Causes of LU/LCCs in Bale Eco-Region
LU/LCC in the BER is a result of several proximate and underlying causes.
4.6.1 Proximate (Direct) Causes
The series of discussions and interviews conducted with the FGD participants and key
informants in the study area indicated that five major proximate (direct) driving forces appear
to explain a large part of LU/LCC in the BER. These are; (i.) expansion of agriculture (ii.) fire
(iii.) illegal logging and fuel wood extraction (iv.) overgrazing and (v.) expansion of illegal
and unplanned settlements. Urban expansion and construction of infrastructures such as school
and road also take part in changing the LU/LC of the BER. However they have a minor role
on the LU/LCC of the eco-region.
55
As reported from discussion and interview with focus groups and key informants expansion of
agriculture including crop farming (both subsistence and commercial farming), forest-coffee
farming (by small-holder farmer) and other cash crop like chat farming are the major drivers
of LU/LCC in BER. Agriculture is expanding in all parts of the eco-region at the expanse of
grassland/rangeland, forest and woodlands. Subsistence crop farming is the major driving
forces for forest, grassland and scrub/bush land cover change in highland Weredas like Goba
and Dinsho. In Dinsho Wereda a number of hills which were previously covered by small
grass, bush and forest have been converted to small scale crop farms. Moreover, as per the
Goba Wereda investment office in 2015 alone about 100 ha of grassland was given to
agricultural investment in Ashuta Kebele. Chat and forest coffee farming are the major
drivers of forest and grassland cover change in Harena Buluk Wereda and in the high land
Kebeles of Delo Mena Wereda. Rangelands and woodlands in lowland Weredas like Delo
Mena, Mede Welabu and Berbere were converted to subsistence and commercial crop farms.
This is in agreement with Teshome (2010) who reported that between 1986 and 2006 about
65% and 10% of forest in Goba and Delo Mena respectively were converted to agriculture.
Participants in the FGD also identified fire as one of the major proximate causes of LU/LCC
next to agricultural expansion in the study area. They perceived two major fire incidents over
30 year period that caused destruction of woodland, forest and scrub/bush lands. These were
the 2000 and 2008 fires. The discussants stated that most of the forest and woodland areas
destroyed by these major fires are now converted to agriculture and settlement areas. There are
studies that quantified the destruction caused by these two major fire incidents and by the
1984 fire. Accordingly the fire occurred in 1984 destroyed about 195 km2 (Belayneh et al.,
2013) of vegetated lands in different parts of the eco-region, while in year 2000 fire destroyed
56
approximately 20,000 ha of moist evergreen forest (Wakjira, 2015). On the other hand in the
year 2008 fire destroyed 12, 825 ha of vegetated land in the eco-region (Belayneh et al.,
2013). Out of the 12, 825 ha destroyed by 2008 fire about 11,972 ha (93%) was destroyed
within the intervention Weredas. Abera and Kinahan (2011) also reported about 142 fire
incidents that occurred within the national park boundary between 1999 and 2008. According
to researcher the fires occurred within this range of period caused destruction of 38, 150 ha of
woodland, forest and Erica shrub. As it was stated by key informants and focus group
discussants the source of nearly all fire occurred in the eco-region were human during illegal
hunting, honey harvesting (in which smoke is used to protect the beekeepers) and farm land
clearing. Farmers also burn the afro-alpine scrub lands to initiate fresh grass for their cattle.
Illegal logging and fuel wood extraction in the form of charcoal and fire wood is also a major
driver for the diversion of forest and wood lands in BER. Especially in Goba, Delo Mena and
Berbere Weredas forests and woodlands are highly exploited for the purpose of charcoal
preparation and fire wood. According to key informants forests and woodlands provides the
major towns (i.e. Robe, Goba town, Delo Mena town and Haro Dumal town) with charcoal
and firewood as the energy source of majority of population living in these towns depend on
fuel wood. On the other hand discussants of this study also confirmed that rural population
especially those vulnerable to climatic change and those economically poor use charcoal and
firewood as a source of income to cope with the effects of climatic hardships and fulfill the
livelihood requirements of their family. In addition to this most of the migrants coming from
different parts of the country are highly involved in charcoal production and fire wood sale
besides to converting forest and woodlands in to farmland and settlement.
57
Overgrazing is another major proximate cause of LU/LCC identified by FGD participants and
key informants. They stated that increase in the number of livestock from time to time and
conversion of grasslands and rangelands to agriculture created livestock pressure on currently
existing grasslands and rangelands. This further forced the local communities to send their
livestock inside the forest and woodland resources for grazing, thereby exerting severe
pressure on the forest and woodland through browsing and trampling. This problem is most
common in woodland and forested Weredas of BER.
Results from survey interview and group discussion also indicated that expansion of Illegal
and unplanned settlements inside the dense forests and woodland are the other major
proximate driver of forest and woodland cover fragmentation in BER. They stated that such
settlement is the major problem in Harena forest. This is because a number of illegal migrants
from different parts of the country settled inside the Harena forest and cleared the forest for
the purpose of settlement and coffee farm. According to the discussants most of illegal settlers
of Harena forest came from South region especially from Sidama Zone, Amhara region
(Godjam and Gondar) and Oromia region from Shewa (north and west shewa), East and West
Harrage, and from the arid Arsi Zone. On the other hand illegal and unplanned settlements by
the local peoples to expand crop land and settlement also contributed for fragmentation of
forest and woodlands, especially for woodlands of lowland Weredas like Delo Mena.
Expansion of urban areas like Delo Mena, Angetu, Haro Dumal and Bidire towns and
construction of infrastructures like school and roads also contributed for the conversion of
grassland, forest and woodlands. As it is stated by discussants of this study the current schools
in their locality replaced the land that was covered by grassland and woodland before two to
58
three decades. On the other hand dense forests and woodland areas were opened through road
construction.
4.6.2 Underlying Causes
The above mentioned proximate causes were triggered by different underlying causes of
LU/LCC. From a range of demographic, economic, technological, institution and policy,
socio-cultural and biophysical factors more than 20 underlying drivers of LU/LCC were
identified by the FGD participants and key informants in the study area (Table 6). However
population growth, poverty and food insecurity, gradual change in the economic activities of
communities in the area from pure pastoralist to agro-pastoralist, weak law enforcement and
drought appear to explain a large part of underlying causes.
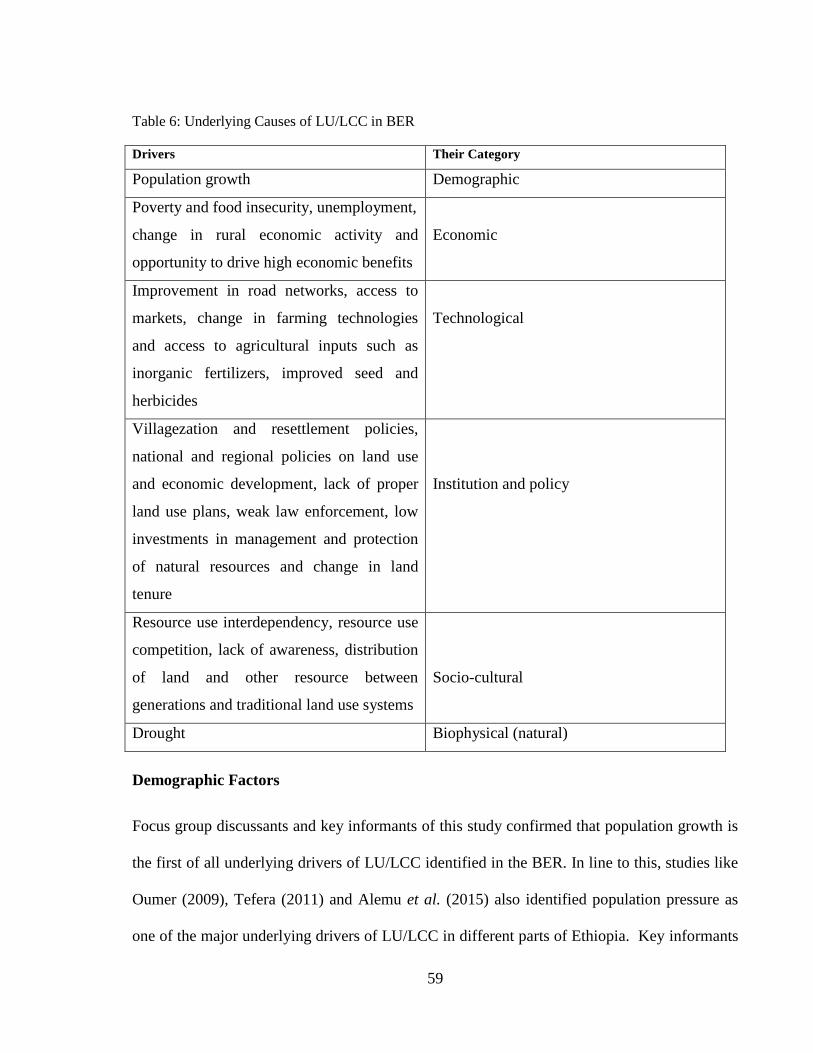
59
Table 6: Underlying Causes of LU/LCC in BER
Drivers Their Category
Population growth Demographic
Poverty and food insecurity, unemployment,
change in rural economic activity and
opportunity to drive high economic benefits
Economic
Improvement in road networks, access to
markets, change in farming technologies
and access to agricultural inputs such as
inorganic fertilizers, improved seed and
herbicides
Technological
Villagezation and resettlement policies,
national and regional policies on land use
and economic development, lack of proper
land use plans, weak law enforcement, low
investments in management and protection
of natural resources and change in land
tenure
Institution and policy
Resource use interdependency, resource use
competition, lack of awareness, distribution
of land and other resource between
generations and traditional land use systems
Socio-cultural
Drought Biophysical (natural)
Demographic Factors
Focus group discussants and key informants of this study confirmed that population growth is
the first of all underlying drivers of LU/LCC identified in the BER. In line to this, studies like
Oumer (2009), Tefera (2011) and Alemu et al. (2015) also identified population pressure as
one of the major underlying drivers of LU/LCC in different parts of Ethiopia. Key informants
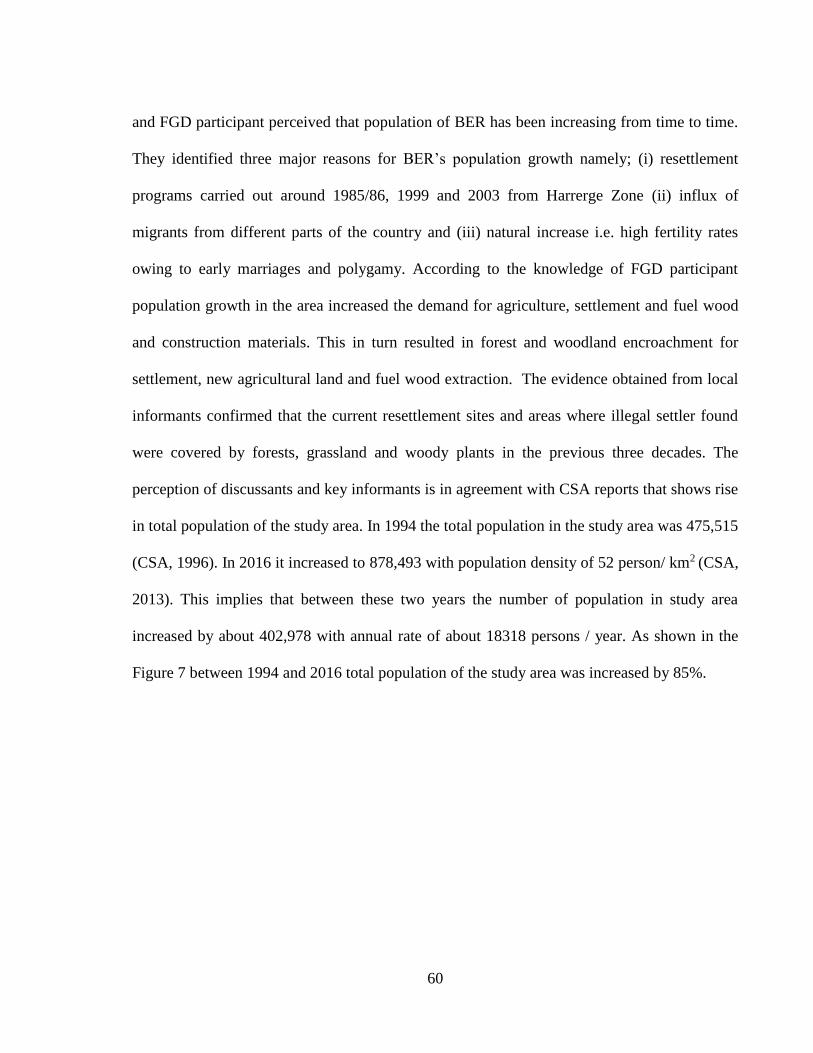
60
and FGD participant perceived that population of BER has been increasing from time to time.
They identified three major reasons for BER’s population growth namely; (i) resettlement
programs carried out around 1985/86, 1999 and 2003 from Harrerge Zone (ii) influx of
migrants from different parts of the country and (iii) natural increase i.e. high fertility rates
owing to early marriages and polygamy. According to the knowledge of FGD participant
population growth in the area increased the demand for agriculture, settlement and fuel wood
and construction materials. This in turn resulted in forest and woodland encroachment for
settlement, new agricultural land and fuel wood extraction. The evidence obtained from local
informants confirmed that the current resettlement sites and areas where illegal settler found
were covered by forests, grassland and woody plants in the previous three decades. The
perception of discussants and key informants is in agreement with CSA reports that shows rise
in total population of the study area. In 1994 the total population in the study area was 475,515
(CSA, 1996). In 2016 it increased to 878,493 with population density of 52 person/ km2 (CSA,
2013). This implies that between these two years the number of population in study area
increased by about 402,978 with annual rate of about 18318 persons / year. As shown in the
Figure 7 between 1994 and 2016 total population of the study area was increased by 85%.
61
Figure 7: Population growth in seven Weredas of BER (1994-2016) drived from CSA (Central
Statistical Agency). Note: Due to the data gap from the CSA total population for the years between
1994 and 2004 and 2009 were not available for use.
Economic Factors
The economic causes of LU/LCC in BER includes: poverty and food insecurity,
unemployment owing to lack of off-farm jobs (especially for landless and educated youth),
change in rural economic activity and opportunity to derive high economic benefits from the
sale of cash crops such as coffee and chat. Key informants and focus group discussants stated
that these were the major underlying economic factors behind the expansion of agriculture
especially coffee and chat farming inside the forest and illegal logging and fuel wood
extraction in the form of charcoal and fire wood. Due to lack of off-farm employment
opportunities adults in BER remain in their area as unemployed. This resulted in land
62
fragmentation due to sharing of lands from their families and encroachment of forest,
grassland and woodland in search of new agricultural land and fuel wood. To show the role of
poverty on environmental change the World Commission on Environment and Development
pointed out that people who are poor and hungry always destroy their immediate environment
in order to survive (Belay, 1995). Accordingly in the study area those economically poor and
landless households were engaged in fuel wood extraction in the form of charcoal and
firewood to fulfill the livelihood requirement of their family. Change in the rural economy
from pure pastoralism to agro-pastoralism and establishment of economic linkage between
rural and urban centers also played a greatest role for the expansion of agriculture in the BER.
Economic linkage between rural and urban areas was facilitated by infrastructural
developments such as road and markets. Traditionally the local peoples in almost all parts of
the BER were pure pastoralist. According to FGD participant agriculture started in the area
during Derge regime around 1975/76 following the “land to tiller” policy of the Derg
government. However, they agreed that more expansion was observed in the past two –three
decades. One of the reasons for this expansion was influx of legal and illegal migrants
especially in Harena Buluk Wereda. Influx of new migrants to the study area introduced new
livelihoods centered on crop farming. Subsequently non migrant local communities adopted
migrant’s livelihood and changed their livelihood from pure pastoralist to agro –pastoralist.
Technological Factors
According to discussants and key informants the technological factors responsible for
LU/LCC in BER were improvement in road networks, access to markets and change in
farming technologies (from hand tool (locally known as Haarkoo) to animal power and to
63
tractors) and access to agricultural inputs such as inorganic fertilizers, improved seed and
herbicides. Distance from the market and low road facilities decreases the share of agricultural
land. On the other hand it increases the share of forest, woodland, shrub and grasslands
(Girma and Hassan, 2014). This implies that access to market and improvement of road
network promotes the conversion of forest, woodland and grassland in to agricultural land.
FGD participants stated that during the Derge regime there were very few markets, with
average travel distance of 4-5 hours to get market. On the other hand they used to travel by
using traditional mode of transportation (animal power). But currently there are many rural
and urban market places and peoples are shifted from tradition mode of transportation to
modern i.e. using motor cycles and car subsequently reduced their travel hours to 1hour-
30minuets. All the above mentioned factors created a big motivation among the local
communities to increase their agricultural products through increasing their land holding size
and this can be at the expanse of vegetated lands mainly forest, woodland and grassland.
Policy & Institutional Factors
As per the information obtained from key informant villagezation policy during the Derge
regime where by people were clustered in villages called “Sefera” and the resettlement policy
contributed to expansion of settlements and agriculture. The other most important policy
contributed for agricultural expansion in the study area during the Derge regime was “ Land to
Tiller” where by privatization of communal lands were carried out. National and regional
policies on land use and economic development such as infrastructural expansion (e.g. roads,
schools, markets etc.), attaining food self-sufficiency through investment on agriculture are
the other factors contributing to LU/LCC. These lead to expansion of small and large scale
64
agriculture, construction of several infrastructures at the expanse of forest, woodland and
grassland
Lack of proper land use plans is another policy related driver of forest and woodland cover
change. It is characterized by encroachment of vegetated lands especially forest, woodlands
and national park for settlement, pasture and agriculture, cultivation of steep slope and
opening of very dense forest areas through road construction.
Weak law enforcement is also significant driver of LU/LCC. As per the information obtained
from FGD and KII, manifestations of weak law enforcements in the study area were
corruption, lack of benefit sharing and delay in decision making by the courts. These all are
the major reasons for inability of local institution and community based organizations to
discourage illegal settlements in vegetated areas and to control fire, livestock grazing inside
the forest and expansion of both small holder and commercial agriculture including forest
coffee farming at the expense of forests, woodland and grasslands. Lack of benefit sharing
between local communities and government and non-government organizations was raised as
problem especially for those Kebeles found under the jurisdiction of Oromia Forest and
Wildlife Enterprise (OFWE) and Bale Mountain National Park (BMNP). The other policy and
institutional related drivers of LU/LCC was change in institutional power on land use from
shared and customary systems to privatization and formal institutional system.
Change in land tenure system was another policy related driver of forest and woodland cover
change. Participants of the FGD informed that during the Derge regime huge size of forest ,
grassland and woodlands in BER had been converted to other land use types due to change in
the land policy of the previous government. Distribution of land and resource among small
65
scale farmers following the 1975 land to tiller policy and launch of state farms resulted in
conversion of vegetated lands to agricultural land. However in FDRE government land is a
public property and administered by government (Tefera, 2011). Rural peoples have the right
to use land indefinitely and to lease/rent, and transfer the land; correspondingly the land policy
of the FDRE government looks better as compared to the Derge regime (Tefera, 2011).
However in the study area participants of the FGD agreed that farmers are still lacking
confidence and feel as they have no right over their land. This coupled with a very low land
holding per household motivated local farmers to encroach in to vegetated lands for cropping,
grazing and settlement.
Socio-cultural Factor
Resource use interdependency between lowland and highland communities and resource use
competition among non-migrant local communities and between migrant and non-migrant
communities are the major socio-cultural causes of LU/LCC identified by discussants and key
informants of this study. They stated that resource use competition between the migrant and
non-migrant local communities is the most sever and it was responsible for the conversion of
forest and woodlands to agriculture. This problem is common in the areas where there are high
migrants. Local peoples in these areas are not happy with migrants assuming that these people
are overriding future resources of their children. On the other hand during the dry season and
drought years, transhumance peoples migrate from the lowland Weredas and Kebeles to the
highland part of the eco-region in search of pasture to their cattle. These people use forests and
grasslands in the mid land as pasture and shade to their livestock. On the other hand highland
communities expand agriculture in lowland parts of the eco-region at the expance of woodland
66
and rangelands. This shows resource use interdependency between lowland and highland
communities.
Lack of awareness about the negative impacts of forest conversion, distribution of land and
other resource between generations and traditional land use systems brought by incoming
migrants such as Chat and other crop farming like maize and rice are also the other socio-
cultural causes for the expansion of agricultural lands at the expance of other LU/LC types
mainly woodland and forest.
Biophysical (Natural) Factors
The biophysical factor considered in this study was drought. It was mentioned by participants
of the FGD as one of the factors contributing for LU/LCC in the study area especially in low
land Weredas like Delo Mena. Focus group discussants in Delo Mena Wereda perceived two
drought years over 30 year period i.e. 1997 and 2011. They stated that during the drought
years people in their locality highly involve in extraction of fuel wood in the form of charcoal
and fire wood to fulfill the livelihood requirement of their family. On the other hand people
also migrate to midland and highland parts of the eco-region in search of pasture and water to
their livestock. This demonstrates the potential threat of such activities to woodlands and
rangelands in the lowland and forests and grasslands in high and mid altitude.
67
5 CONCLUSION AND RECOMMENDATION
5.1 Conclusion
Bale Eco-region has been experiencing different LU/LC changes. The main finding of this
study revealed a continual increase in agriculture/settlement at the expense of woodland and
forest between 1986 and 2016. During 30 years period agriculture/settlement increased by
173369 ha (64%), with a corresponding 296692 ha (52%) and 85184 ha (18%) decline in the
area of woodland and forest. If the current rate of LU/LCC continues agriculture/settlement is
predicted to increase by 122699 ha (28%) in 2026. On the other hand woodland and forest are
predicted to shrink by 63436 ha (24%) and 63389 ha (17%) respectively.
Findings of the LU/LCC analysis under different institutional arrangements between 2006 and
2016 showed expansion of agriculture/settlement and reduction of woodland and forests under
all institutions, but with differing rates. The rate of agriculture/settlement expansion was high
in lowland Kebele under Wereda land administration with (1285 ha/year) followed by Kebele
under the national park with (290 ha/year) and Kebele under PFM in mid lands with (245
ha/year). In contrast rate of agriculture/settlement expansion was much smaller in the highland
Kebele under the Wereda institution with 27 ha/year. On the other hand rate of woodland and
forest loss was high in parts of BER that are managed by Wereda and national park with 564
ha/year and 394 ha/year respectively. On the contrary the rate of deforestation is low in forests
and woodlands managed under PFM and PRM institutional arrangements.
LU/LCC in the BER is a result of different interactions between proximate and underlying
causes. The major proximate driving forces of LU/LCC in the BER are expansion of
agriculture, fire, illegal logging and fuel wood extraction, overgrazing and illegal and

68
unplanned settlement. On the other hand from a range of demographic, economic,
technological, policy and institution, socio-cultural and biophysical factors more than 20
underlying drivers of LU/LCC are identified by key informant and focus group discussants of
this study. However population growth, poverty and food insecurity, gradual change in the
economic activities of communities in the area from pure pastoralist to agro-pastoralist, weak
law enforcement and drought appear to explain a large part of underlying causes.
69
5.2 Recommendation
Expansion of agriculture especially small scale agriculture by small holder farmers is
the major proximate/direct causes of LU/LCC in BER causing loss of several hectares
of forest and woodlands. Therefore, controlling the expansion of agriculture at the
expense of forest and woodlands requires the right policy packages by national and
regional governments such as livelihood diversification and improving the productivity
of existing farm lands through the provision of improved production inputs.
Population growth is the major root cause for LU/LCC in the study area. Traditional
practices such as early marriages and polygamy and illegal migrations are the reasons
for population growth. Therefore, controlling the population growth and its associated
impacts on the natural environment requires the right policy packages by national and
regional governments such as awareness creation, provision of family planning
services, increasing productivity, working on the pushing factors of migration and
controlling illegal settlements. Working on the pushing factors of migration may
require a joint action between the senders and recipients of migrants. Currently there
are undergoing efforts in the study area but these efforts should be strengthened more.
Poverty and food insecurity were the other most important root cause for land use/land
cover change in the study area. Combating this problem therefore requires designing of
good polices and strategies. Thus both national and regional governments should
design policies and strategies like creating and strengthening environmental friendly
non-farm/off-farm income generating activities and provision of safety net programs
PFM project which is implemented by Farm Africa and OFWE have brought several
positive benefits especially on forest resources. However implementation problems
70
such as lack of benefit sharing were reported by local communities. Hence
performance assessment is required for all institutions working in the study area to
better understand existing problems and make immediate corrections.
Even though there are some positive benefits especially on forest resources under the
jurisdiction of PFM/PRM still there is resource degradation. The finding of this study
also revealed high loss of resources such as forest, woodland and range lands under the
jurisdiction of Wereda administrations and Bale Mountain National Park as compared
to areas under PFM/PRM. In this regard, two major recommendations are forwarded
by the researcher. First currently ongoing efforts under PFM/PRM should be
strengthened more. Secondly the successes achieved in PFM/PRM should be extended
to other institutional arrangements in BER.
This study addressed only the change in LU/LC and driving forces behind the change.
Therefore, further study is required to assess impacts brought by LU/LCC.
71
6 References
Abdullah, F., Alqurashi and Kumar, L. 2013. Investigating the Use of Remote Sensing and
GIS Techniques to Detect Land Use and Land Cover Change: A Review. Advances in
Remote Sensing (2): 193-204.
Abera, K. and Kinahan, A. A. 2011. Factors Affecting Fire Extent and Frequency in the Bale
Mountains National Park. Walia Journal of the Ethiopian Wildlife and Natural History
Society pp.146-157.
Adedeji, O. H., Tope-Ajayi, O. O. and Abegunde, O. L. 2015.Assessing and Predicting
Changes in the Status of Gambari Forest Reserve, Nigeria Using Remote Sensing and
GIS Techniques. Journal of Geographic Information System (7): 301-318.
Agarwal, C., Green, G. M., Grove, J. M., Evans, T. P. and Schweik, C. M. 2002. A Review
and Assessment of Land-Use Change Models: Dynamics of Space, Time, and Human
Choice. Gen. Tech. Rep. NE-297. Newtown Square, PA: U.S. Department of
Agriculture, Forest Service, Northeastern Research Station.
Alemayehu, B. 2015. GIS and Remote Sensing Based Land Use/Land Cover Change
Detection and Prediction in Fagita LekomaWoreda, Awi Zone, North Western
Ethiopia. MSc. thesis, Addis Ababa University, Ethiopia.
Alemu, B., Garedew, E., Eshetu, Z. and Kassa, H. 2015. Land Use and Land Cover Changes
and Associated Driving Forces in North Western Lowlands of Ethiopia. International
Research Journal of Agricultural Science and Soil Science 5(1): 28-44.
72
Amare, B. 2007. Landscape transformation and opportunities for sustainable land management
along the eastern escarpment of Wello (EEW). Doctoral thesis, University Bern.
Araya, Y. H., 2009. Urban Land Use Change Analysis and Modeling: a Case Study of Setúbal
and Sesimbra, Portugal. MSc. thesis, University of Münster.
Arsanjani, J. 2012. Dynamic Land Use/Cover Change Simulation: Geosimulation and Multi
Agent-Based Modelling. Springer-Verlag Berlin Heidelberg. Doctoral thesis, Ausrtia.
Bakker, W. H., Gorte, B. G. H., Janssen, L. L. E., Pohl, C., Prakash, A., Reeves, C. V., Weir,
M. J. C. and Woldai, T. 2001. Principle of Remote Sensing; ICT: The Netherlands, 180
P.
Bale Mountains National park general Management Plan (BMNP GMP), 2007. Bale
Mountains National Park General Management Plan. (Frankfurt Zoological Society,
eds.), Ethiopia.
Belay, T. 1995. Population pressure and problems of arable land degradation in Ethiopia.
Proceedings of the Workshop on Integration of Population, Environment Equitable and
Sustainable Development Issues into the Curriculum of the Demographic Training and
Research Centre of the Institute of Development Research at Addis Ababa University,
Wabe Shebelle Hotel, Addis Ababa.
Belay, T. 2002. Land cover/ use changes in the Derekolli catchment of the South Welo Zone
of Amhara Region, Ethiopia. Eastern Africa Social Science Research Review 18 (1): 1-
20.
73
Belayneh, A., Yohannes, T. and Worku, A. 2013. Recurrent and extensive forest fire incidence
in the Bale Mountains National Park (BMNP), Ethiopia : Extent, Cause and
Consequences 2(1): 29–39.
Bhawana, K. C. 2015. Land Use and Land Cover Change In relation to Internal Migration and
Human Settlement in the Middle Mountain of Nepal. MSc. thesis, University of
Twente, Nepal.
Briassoulis, H. 2011. Factors Influencing Land Use Land Cover Change. Journal of Land Use,
Land Cover and Soil Science1.
Brown, D. G., Pijanowski, B. C. and Duh, J. D. 2000. Modeling the Relationships Between
Land Use and Land Cover on Private Lands in the Upper Midwest, USA. Journal of
Environmental Management (59): 000–000, available online at
http://www.idealibrary.com.
Brown, D. G., Walker, R., Manson, S., Seto, K. 2004. Modeling Land-Use and Land-Cover
Change.
Burka, A. 2008. Land Use /Land Cover Dynamics in Prosopis juliflora invaded area of
Metehara and the Surrounding Districts Using Remote Sensing & GIS Techniques.
MSc. thesis, Addis Ababa University, Ethiopia.
Chang-Martínez, L. A., Mas, J. F., Valle, N. T., Torres, P. S. U. and Folan, W. J. 2015.
Modeling Historical Land Cover and Land Use: A Review from Contemporary
Modeling. ISPRS International Journal of Geo-Information (4): 1791-1812.
74
De Sherbinin, A. 2002. Land-Use and Land-Cover Change, A CIESIN Thematic Guide,
Palisades, NY. Center for International Earth Science Information Network of
Columbia University.
Desalegn, T., Cruz, F., Kindu, M., Turrión, M. B. and Gonzalo, J. 2014. Land-Use/Land-
Cover (LULC) Change and Socioeconomic Conditions of Local Community in the
Central Highlands of Ethiopia. International Journal of Sustainable Development &
World Ecology.
Duhamel, C. 2011. Land Use and Land Cover, Including their Classification. Journal of land
use, land cover and soil sciences I.
Eastman, J.R. 2006. IDRISI Andes tutorial. Clark Labs, Worcester, MA.
Ebro, A., Shenkute, B., Haile, G., Sauerborn, J. and Treydte, A. C. 2011. Land use / land
cover dynamics in the rift valley of Ethiopia: Implications on food security. Food
Security Center (FSC) brief No. 12.
Eshetu, Z. and Hogberg, P. 2000. Reconstruction of forest site history in Ethiopian highlands
based on C13 natural abundance of soils. Ambio (29): 83–89.
FARM Africa / SOS Sahel Ethiopia, 2007. The Key Steps in Establishing Participatory Forest
Management: A field manual to guide practitioners in Ethiopia, Addis Ababa.
FARM Africa, 2008. Bale Mountains Eco-Region Sustainable Development Plan: Report
Phase I and II planning Workshops, Addis Ababa: FARM Africa.
75
FDRE-CSA, 1996. The 1994 Population and Housing Census of Ethiopia, Result for Oromia
Region Volume I: Part I Statistical report on Population Size and Characteristics,
Addis Ababa, Ethiopia.
FDRE-CSA, 2013. Population Projection of Ethiopia for all Regions at Wereda Level from
2014 – 2017.
Fentahun, T. and Gashaw, T. 2014. Evaluation of land use/land cover changes of Bantneka
Watershed, Ethiopia. Merit Research Journal of Agricultural Science and Soil
Sciences 2(7): 081-085.
Garedew, E. 2010. Land-Use and Land-Cover Dynamics and Rural Livelihood Perspectives,
in the Semi-Arid Areas of Central Rift Valley of Ethiopia. Doctoral thesis, Swedish
University of Agricultural Sciences, Umeå.
Gashaw, T. and Dinkayoh, T. 2015. Land use/land Cover Dynamics in Hulet Wogedamea
Kebele, Northern Ethiopia. Current Research in Agricultural Sciences 2(1): 36-41.
Gebrehiwet, K. B. 2004. Land Use and Land Cover Changes in the Central Highlands of
Ethiopia: The Case of Yerer Mountain and its Surroundings. MSc. thesis, Addis Ababa
University, Ethiopia.
Gebrehiwot, S., Taye, A. and Bishop, K. 2010. Forest cover and stream flow in a headwater of
the Blue Nile: Complementing observational data analysis with community perception.
Ambio (39): 284–294.
76
Gebreslassie, H. 2014. Land Use-Land Cover dynamics of Huluka watershed, Central Rift
Valley, Ethiopia. International Soil and Water Conservation Research 2(4): 25-33.
Geist, H. J. and Lambin, E. F. 2001. What drives tropical deforestation? LUCC Report Series
No.4. Louvain-la-Neuve: CIACO.
Geist, H. J. and Lambin, E. F. 2002. Proximate Causes and Underlying Driving Forces of
Tropical Deforestation. BioScience 52(2): 143-150.
Geremew, A. A. 2013. Assessing the Impacts of Land Use and Land Cover Change on
Hydrology of Watershed: A Case study on Gilgel–Abbay Watershed, Lake Tana
Basin, Ethiopia. MSc. thesis, Universitat Jaume-I.
Girma, H. M. 2014. Drivers of Land Use Change and Forest Conservation Under Uncertain
Markets for Forest Ecosystem Services in Ethiopia. Doctoral thesis, University of
Pretoria, Pretoria.
Girma, H. M. and Hassan, R. M. 2014. Drivers of land-use change in the Southern Nations,
Nationalities and People’s Region of Ethiopia. African Journal of Agriculture and
Resource Economics 9 (2): 148-164.
Hailemariam, S. N., Soromessa, T. and Teketay, D. 2015. Non-carbon benefits for effective
implementation of REDD+: The case of Bale Mountains Eco-Region, Southeastern
Ethiopia. African Journal of Environmental Science and Technology 9(10): 747-764.
77
Hamza, I. A. and Iyela, A. 2012. Land Use Pattern, Climate Change, and Its Implication for
Food Security in Ethiopia: a review. Ethiopian Journal of Environmental Studies and
Management 5(1): 26-31.
Han, H., Yang, C. and Song, J. 2015. Scenario Simulation and the Prediction of Land Use and
Land Cover Change in Beijing, China. Sustainability (7): 4260-4279 .
Hillman, J. C. 1986. Bale Mountains National Park, Management Plan. Ethiopian Wildlife
Conservation Organisation, AddisAbaba, Ethiopia.
Houghton, R. A. 1994. The world wide of extent of land-use change. Bioscience (44): 305-
313.
Iacono, M., Levinson, D., El-Geneidy, A. and Wasfi, R. 2015. A Markov chain model of land
use change in the Twin Cities, 1958-2005. Tema. Journal of Land Use, Mobility and
Environment 8 (3): 49-62.
Jayasekara, R. S. 2012. Focus groups in nursing research: Methodological perspective.
Nursing Outlook 60 (6): 411-6.
Kindu, M., Schneider, T., Teketay, D. and Knoke, T. 2013. Land Use/Land Cover Change
Analysis Using Object-Based Classification Approach in Munessa-Shashemene
Landscape of the Ethiopian Highlands. Journal of Remote Sensing (5): 2411-2435.
Lambin, E. F. and Geist, H. J. 2003. Global land-use and land-cover change: what have we
learned so far? Global Change News Letter (46): 27- 30.
78
Lambin, E. F. and Geist, H. J. 2007. Causes of land-use and land-cover change. Retrieved
from http://www.eoearth.org/view/article/51cbed2f7896bb431f6905af.
Lambin, E. F. and Geist, H. J. (eds.), 2006. Land-Use and Land- Cover Change, Local Process
and Global impacts. pp.71-116.
Lambin, E. F., Geist, H. J. and Lepers, E. 2003. Dynamics of land-use and land-cover change
in Tropical regions. Annual Review of Environment and Resources 28(1): 205-241.
Lamichhane, B. B. 2008. Dynamics and Driving Forces of Land Use/Forest Cover Change and
Indication of Climate Change in a Mountain Sub-watershed of Gorkha. MSc. thesis,
Tribhuvan University, Institute of Forestery, Nepal.
Mani, N. D. and Krishnan, N. R. 2013. Assessment of Changes in Land Use/ Land Cover in
Tamil Nadu State in India Using GIS. African Journal of Science and Research 2(6):
01-06.
Muchen, M. 2012. Land Use Land Cover Change in the Ketar Catchment, Ziway Watershed,
Ethiopia. Georg-August-Universitat, Gottingen.
Melaku, B. 2003. Forest property rights, the role of the state and institutional exigency: The
Ethiopian experience. Doctoral thesis, Swedish University of Agricultural Sciences,
Uppsala.
Meyer, W. B. and Turner, B. L. II, 1992. Human Population Growth and Global Land-
Use/Cover Change. Annual Review of Ecology and Systematics (23): 39-57.
79
Meyer, W. B. 1995. Past and Present Land-Use and Land –Cover in the U.S.A. Consequences
PP. 24-33.
Minale, A. S. 2012. Population and Environment Interaction: the case of Gilgel Abbay
Catchment, Northwestern Ethiopia. Journal of Environmental Research and
Management 4(1): 0153-0162.
Ministry of Mines and Energy, 2003. Geological Survey of Ethiopia: Industrial Minerals and
Rocks Resource Potentials of Ethiopia. MoME: Addis Ababa.
Mirkatouli, J., Hosseini, A. and Neshat, A. 2015. Analysis of land use and land cover spatial
pattern based on Markov chains modelling. Open Journal of City, Territory and
Architecture 2(4): 1-9.
Molla, E., Gebrekidan, H., Mamo, T. and Assen, M. 2010. Patterns of Land Use/Cover
Dynamics in the Mountain Landscape of Tara Gedam and Adjacent Agro-Ecosystem,
Northwest Ethiopia. SINET: Ethiop. J. Sci. 33(2): 75–88.
Molla, M. B. 2014. Land Use/ land cover dynamics in the Central Rift Valley Region of
Ethiopia: The Case of Arsi Negele District. Academia Journal of Environmental
Sciences 2(5): 074-088.
Morie, N. D. 2007. Land Use and Land Cover Changes in Harena Forest and Surrounding
Area, Bale Mountains National Park, Oromia National Regional State, Ethiopia. MSc.
thesis, Addis Ababa University, Ethiopia.
80
Muluneh, A. 2010. Synthesis of Research on Land Use and Land Cover Dynamics in the
Ethiopian Highlands. UNU-Land Restoration Training Programme, Keldnaholt, 112
Reykjavik, Iceland.
Muluneh, W. 2003. Impact of Population Pressure on Land Use and Land Cover Changes,
Agricultural System and Income Diversification in West Gurague Land, Ethiopia.
Doctoral thesis, Norwegian university of science and technology (NTNU), Trondheim.
OFWE, FARM Africa, SOS Sahel Ethiopia, 2014. Bale Mountains Eco-Region Reduction of
Emission from Deforestation and Forest Degradation (REDD+) Project-Ethiopia.
Addis Ababa: FARM Africa and SOS Sahel.
Opeyemi, Z. A. 2006. Change Detection in Land Use and Land Cover Using Remote Sensing
Data and GIS: (A case study of Ilorin and its environs in Kwara State.).
Oumer, H. A. 2009. Land Use and Land Cover Change, Drivers and Its Impact: A
Comparative Study From Kuhar Michael and Lenche Dima of Blue Nile and Awash
Basins of Ethiopia. MSc. thesis, Graduate School of Cornell University.
Paul, W. B. and Lisa, A. S. 2011. Agricultural landscape change (1937–2002) in three
townships in Iowa, USA. Landscape and urban planning (100): 202–212.
Pellikka, P. 2008. Land Use and Land Cover Changes in Africa – from Local to Continental.
HERC seminar.
Rahdary, V., Soffianian, A., Najfabdai, S. M., Khajeddin, S. J. and Pahlavanravi, 2008. Land
Use and Land Cover Change Detection of Mouteh Wildlife Refuge Using Remotely
81
Sensed Data and Geographic Information System. World Applied Sciences Journal
3(1): 113-118.
Reis, S. 2008. Analyzing Land Use/Land Cover Changes Using Remote Sensing and GIS in
Rize, North-East Turkey. Sensors, www.mdpi.org/sensors.
Rimal, B. 2011. Application of Remote Sensing and GIS, Land Use/Land Cover Change in
Kathmandu Metropolitan City, Nepal. Journal of Theoretical and Applied Information
Technology pp. 80-86.
Robinson, N. 1999. The use of focus group methodology – with selected examples from
sexual health research. Journal of Advanced Nursing 29(4): 905-913.
Rosell, S. 2011. Regional perspective on rainfall change and variability in the central
highlands of Ethiopia, 1978-2007. Applied Geography (31): 329-338.
Sall, M. 2014. Land-based Adaptation and Resilience Powered by Nature.
Sang, L., Zhang, C., Yang, J., Zhu, D. and Yun, W. 2011. “Simulation of land use spatial
pattern of towns and villages based on CA-Markov model”. Mathematical and
Computer Modelling (54): 938-943.
Sayemuzzaman, M. and Jha, M. K. 2014. Modeling of Future Land Cover Land Use Change
in North Carolina Using Markov Chain and Cellular Automata Model. American
Journal of Engineering and Applied Sciences 7 (3): 295-306.
82
Sege, C. 1994. Population and Income. A Global perspective. pp 263-285. Cambridge
university press: Cambridge.
Seyoum, B. A. 2012. Land Use /Land Cover Change and its Effect on Existing Forest
Condition: The Case of Shakiso Natural Forest, Southeast Ethiopia. MSc. thesis,
Wondo Genet College of Forestery and Natural resource, Wondo Genet, Ethiopia
Shiferaw, A. 2011. Evaluating the Land Use and Land Cover Dynamics in Borena Woreda of
South Wollo Highlands, Ethiopia. Journal of Sustainable Development in Africa 13
(1): 87-107.
Shrestha, S. 2012. Drivers of Land Use Change: A Study from Sundarijal Catchment,
Shivapuri Nagarjun National Park. MSc. thesis, Kathmandu University.
SOS Sahel Ethiopia, 2010. Annual Accomplishment Report for 2009. Submitted to Charities
and Societies Agency (CSA), Addis Ababa, Ethiopia.
Tefera, M. M. 2011. Land-use/land-cover Dynamics in Nonno District, Central Ethiopia.
Journal of Sustainable Development in Africa 13(1): 123-141.
Tesfaye, S., Guyassa, E., Raj, A. J., Birhane, E. and Wondim, G. T. 2014. Land Use and Land
Cover Change, and Woody Vegetation Diversity in Human Driven Landscape of
Gilgel Tekeze Catchment, Northern Ethiopia. International Journal of Forestry
Research.
83
Tesfaye, Y., Roos, A., Campbell, B. M. and Bohlin, F. 2011. Livelihood strategies and the role
of forest income in participatory-managed forests of Dodola area in the Bale
Highlands, southern Ethiopia. Forest Policy and Economics (13): 258-265.
Teshoma, A. J. 2010. Determinating Factors for a Successful Establishment of Participatory
Forest Management: A Comparative Study of Goba and Dello Districts, Ethiopia.
MSc. thesis, University of Agder, Kristiansand, Norway.
Teshome, E., Kinahan, A. and Randall, D. 2008. Land Cover Change Study of the Bale
Mountain National Park. Frankfrt Zoological Society, Bale mountains National Park,
Robe, Ethiopia.
Tsegaye, D., Moe, S. R., Vedeld, P. and Aynekulu, E. 2010. Land-use/cover dynamics in
Northern Afar rangelands, Ethiopia. Journal of Agriculture, Ecosystems and
Environment (139): 174–180.
Tsegaye, L. 2014. Analysis of Land Use and Land Cover Change and Its Drivers Using GIS
and Remote Sensing: The Case of West Guna Mountain, Ethiopia. International
Journal of Remote Sensing and GIS 3(3): 53-63.
Turner, B. L., Skole, D., Sanderson, S., Fischer, G., Fresco, L. and Leemans, R. 1995. Land-
Use and Land-cover change Science/Research Plan. Joint publication of the
International Geosphere-Biosphere Programme (Report No. 35) and the Human
Dimensions of Global Environmental Change Programme (Report No. 7). Stockholm:
Royal Swedish Academy of Sciences.
84
Turner, II B. L. and Meyer, W. B. 1994. Global land-use and land-cover change: An
overview. In changes in land-use and land-cover: A global perspective. Cambridge:
Cambridge University Press. 3-10.
Veldkamp, A. and Lambin, E. F. 2001. Predicting land-use change. Agriculture, Ecosystems &
Environment 85(1): 1–6.
Verburg, P., Schot, P. P., Dijst, M. J. and Veldkamp, A. 2004. Land use change modelling:
current practice and research priorities. GeoJournal (61): 309–324.
Verheye, W. 2011. Land Cover, Land Use and the Global Change. Journal of Land Use, Land
Cover and Soil Science I.
Wakjira, D. T. 2015. Migration and Conservation in the Bale Mountains Ecosystem. IISD
report.
Walellegn, A. 2007. Assessments of land use land cover dynamics at Bale Mountains
National Park using GIS and remote sensing. MSc. thesis, Addis Ababa University,
Ethiopia.
Watson, C. 2013. Forest Conservation for Communities and Carbon: The Economics of
Community Forest Management in the Bale Mountains Eco-Region, Ethiopia.
Doctoral thesis, London School of Economics and Political Science.
Weng, Q. 2002. Land Use Change Analysis in the Zhujiang Delta of China Using Satellite
Remote Sensing, GIS and Stochastic Modeling. Journal of Environmental
Management (64): 273–284.
85
WIREs Climate Change, 2014, Interactions between Climate Change and Land use Change on
Biodiversity: Attribution Problems, Risks, and Opportunities (5): 317–335.
Woldeamlak, B. 2002. Land Cover Dynamics since 1950s in Chemoga Watershed, Blue Nile
Basin, Ethiopia. Mountain Research and Development 22(3): 263-269.
Worku, G., Amare, B. A. and Habtamu, T. H. 2014. Land use and land cover change in
Ameleke Watershed, South Ethiopia. Journal of Natural Sciences Research 4(14): 42-
47.
World Bank, 2007. Measuring the Economic Impact of Climate Change on Ethiopian
Agriculture: Ricardian Approach. Washington DC: World Bank.
Zeleke, G. and Hurni, H. 2001. Implications of land use and land cover dynamics for
mountain resource degradation in the northwestern Ethiopian highlands. Mountain
Research and Development 21 (2): 184–191
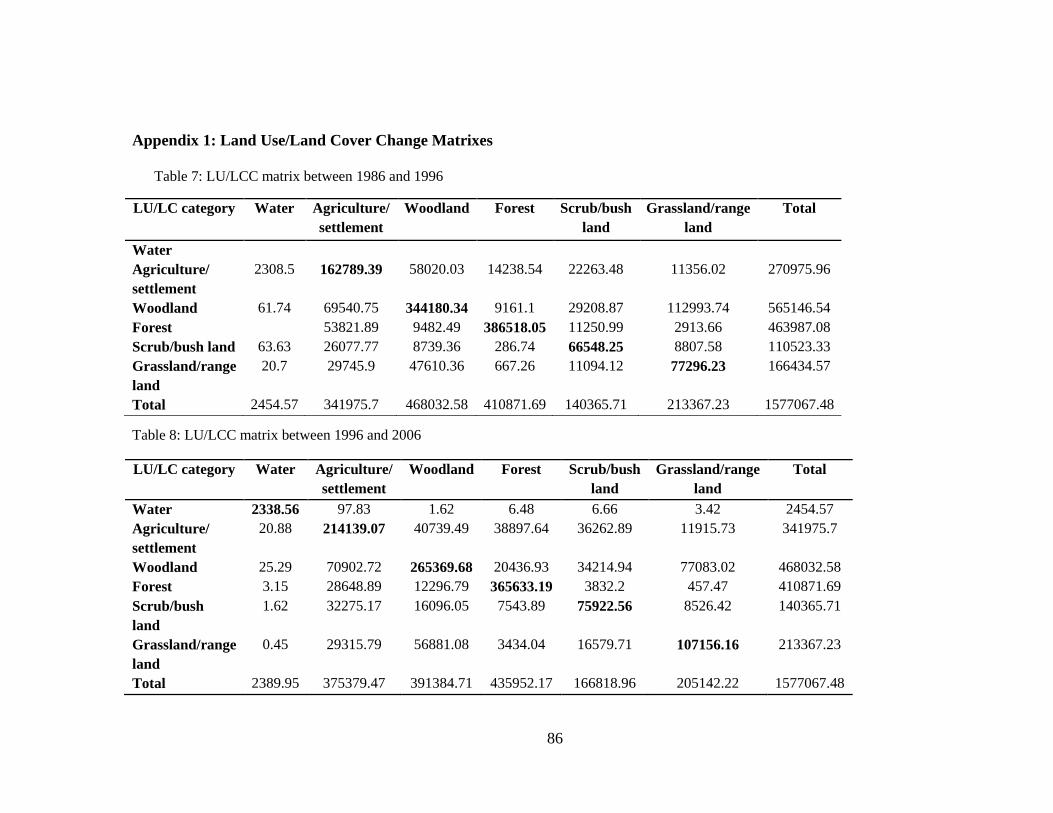
86
Appendix 1: Land Use/Land Cover Change Matrixes
Table 7: LU/LCC matrix between 1986 and 1996
Table 8: LU/LCC matrix between 1996 and 2006
LU/LC category Water Agriculture/
settlement
Woodland Forest Scrub/bush
land
Grassland/range
land
Total
Water 2338.56 97.83 1.62 6.48 6.66 3.42 2454.57
Agriculture/
settlement
20.88 214139.07 40739.49 38897.64 36262.89 11915.73 341975.7
Woodland 25.29 70902.72 265369.68 20436.93 34214.94 77083.02 468032.58
Forest 3.15 28648.89 12296.79 365633.19 3832.2 457.47 410871.69
Scrub/bush
land
1.62 32275.17 16096.05 7543.89 75922.56 8526.42 140365.71
Grassland/range
land
0.45 29315.79 56881.08 3434.04 16579.71 107156.16 213367.23
Total 2389.95 375379.47 391384.71 435952.17 166818.96 205142.22 1577067.48
LU/LC category Water Agriculture/
settlement
Woodland Forest Scrub/bush
land
Grassland/range
land
Total
Water
Agriculture/
settlement
2308.5 162789.39 58020.03 14238.54 22263.48 11356.02 270975.96
Woodland 61.74 69540.75 344180.34 9161.1 29208.87 112993.74 565146.54
Forest 53821.89 9482.49 386518.05 11250.99 2913.66 463987.08
Scrub/bush land 63.63 26077.77 8739.36 286.74 66548.25 8807.58 110523.33
Grassland/range
land
20.7 29745.9 47610.36 667.26 11094.12 77296.23 166434.57
Total 2454.57 341975.7 468032.58 410871.69 140365.71 213367.23 1577067.48
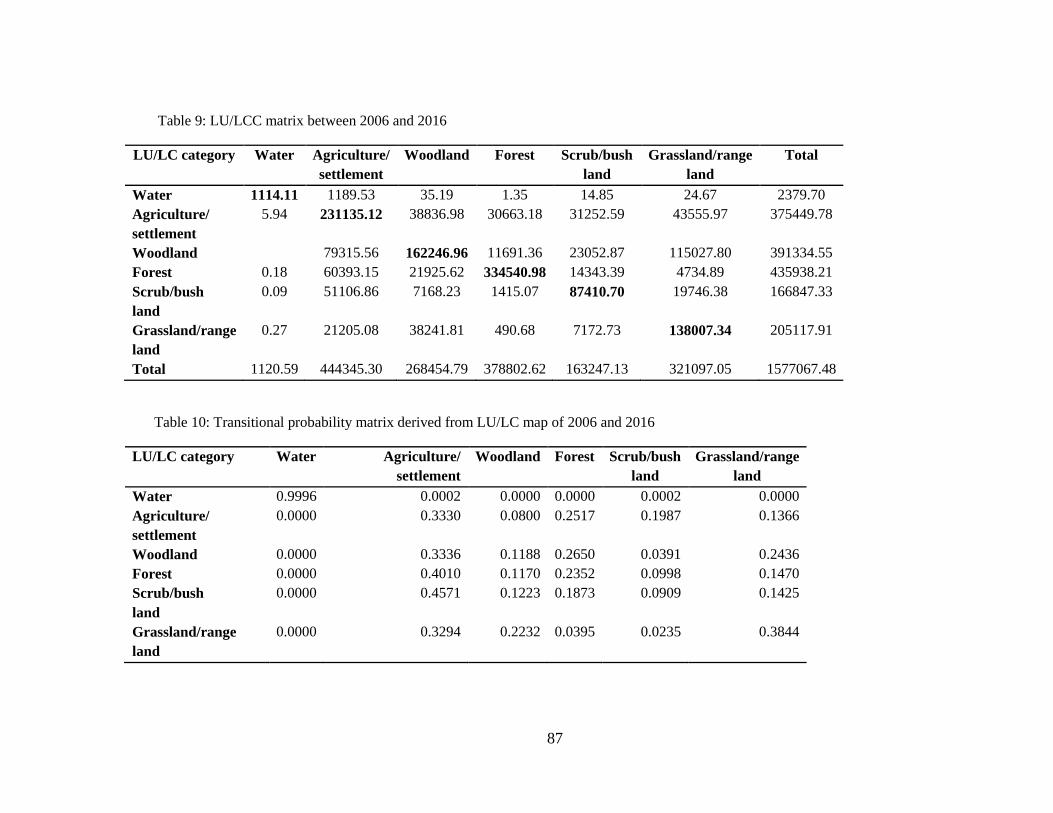
87
Table 9: LU/LCC matrix between 2006 and 2016
LU/LC category Water Agriculture/
settlement
Woodland Forest Scrub/bush
land
Grassland/range
land
Total
Water 1114.11 1189.53 35.19 1.35 14.85 24.67 2379.70
Agriculture/
settlement
5.94 231135.12 38836.98 30663.18 31252.59 43555.97 375449.78
Woodland 79315.56 162246.96 11691.36 23052.87 115027.80 391334.55
Forest 0.18 60393.15 21925.62 334540.98 14343.39 4734.89 435938.21
Scrub/bush
land
0.09 51106.86 7168.23 1415.07 87410.70 19746.38 166847.33
Grassland/range
land
0.27 21205.08 38241.81 490.68 7172.73 138007.34 205117.91
Total 1120.59 444345.30 268454.79 378802.62 163247.13 321097.05 1577067.48
Table 10: Transitional probability matrix derived from LU/LC map of 2006 and 2016
LU/LC category Water Agriculture/
settlement
Woodland Forest Scrub/bush
land
Grassland/range
land
Water 0.9996 0.0002 0.0000 0.0000 0.0002 0.0000
Agriculture/
settlement
0.0000 0.3330 0.0800 0.2517 0.1987 0.1366
Woodland 0.0000 0.3336 0.1188 0.2650 0.0391 0.2436
Forest 0.0000 0.4010 0.1170 0.2352 0.0998 0.1470
Scrub/bush
land
0.0000 0.4571 0.1223 0.1873 0.0909 0.1425
Grassland/range
land
0.0000 0.3294 0.2232 0.0395 0.0235 0.3844
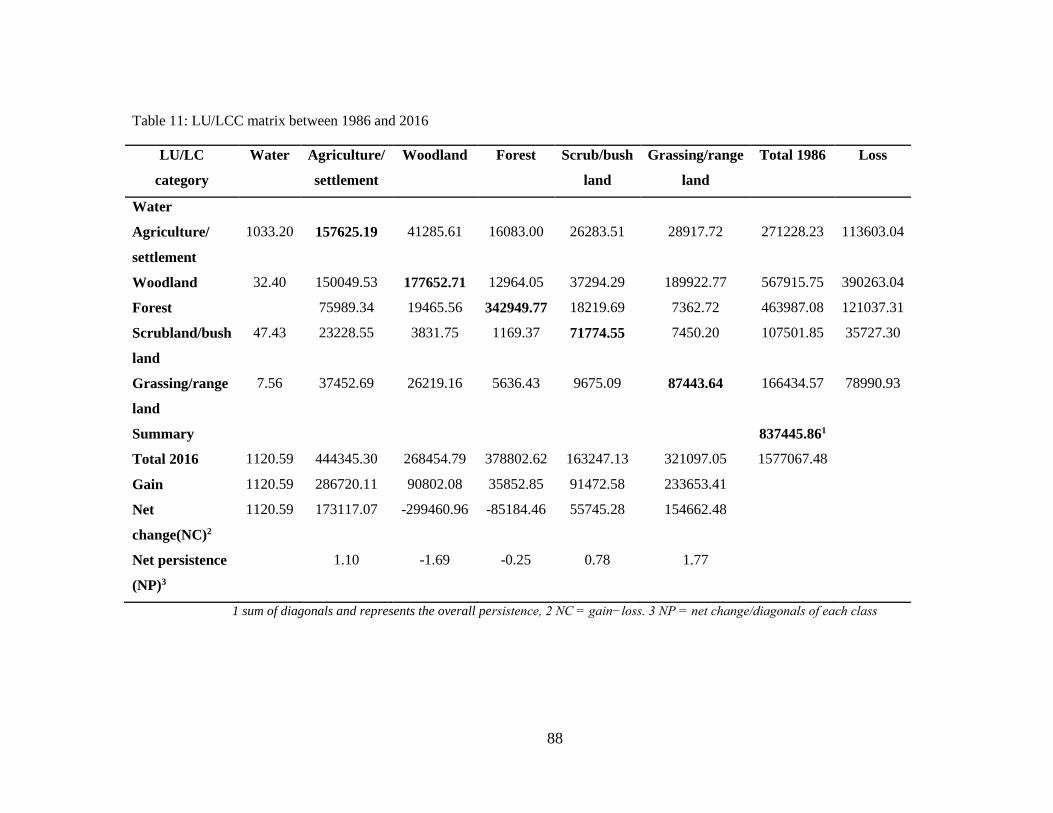
88
Table 11: LU/LCC matrix between 1986 and 2016
LU/LC
category
Water Agriculture/
settlement
Woodland Forest Scrub/bush
land
Grassing/range
land
Total 1986 Loss
Water
Agriculture/
settlement
1033.20 157625.19 41285.61 16083.00 26283.51 28917.72 271228.23 113603.04
Woodland 32.40 150049.53 177652.71 12964.05 37294.29 189922.77 567915.75 390263.04
Forest 75989.34 19465.56 342949.77 18219.69 7362.72 463987.08 121037.31
Scrubland/bush
land
47.43 23228.55 3831.75 1169.37 71774.55 7450.20 107501.85 35727.30
Grassing/range
land
7.56 37452.69 26219.16 5636.43 9675.09 87443.64 166434.57 78990.93
Summary 837445.861
Total 2016 1120.59 444345.30 268454.79 378802.62 163247.13 321097.05 1577067.48
Gain 1120.59 286720.11 90802.08 35852.85 91472.58 233653.41
Net
change(NC)2
1120.59 173117.07 -299460.96 -85184.46 55745.28 154662.48
Net persistence
(NP)3
1.10 -1.69 -0.25 0.78 1.77
1 sum of diagonals and represents the overall persistence, 2 NC = gain−loss. 3 NP = net change/diagonals of each class
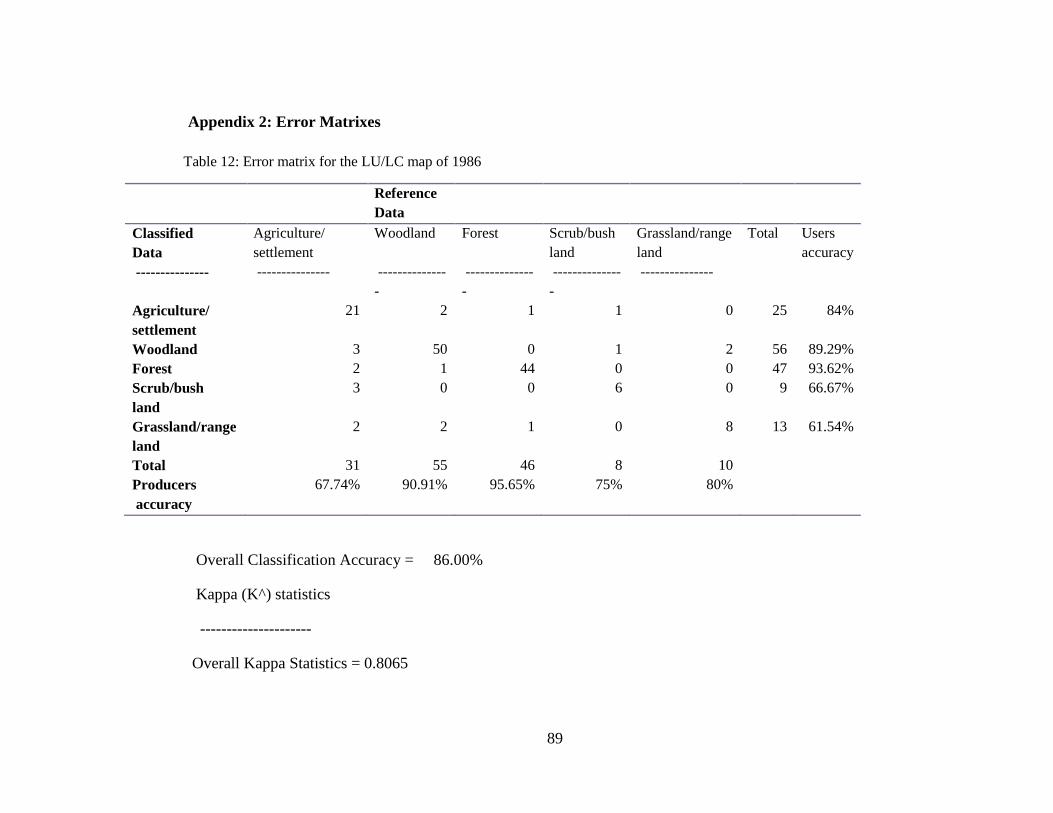
89
Appendix 2: Error Matrixes
Table 12: Error matrix for the LU/LC map of 1986
Reference
Data
Classified
Data
Agriculture/
settlement
Woodland Forest Scrub/bush
land
Grassland/range
land
Total Users
accuracy
--------------- --------------- --------------
-
--------------
-
--------------
-
---------------
Agriculture/
settlement
21 2 1 1 0 25 84%
Woodland 3 50 0 1 2 56 89.29%
Forest 2 1 44 0 0 47 93.62%
Scrub/bush
land
3 0 0 6 0 9 66.67%
Grassland/range
land
2 2 1 0 8 13 61.54%
Total 31 55 46 8 10
Producers
accuracy
67.74% 90.91% 95.65% 75% 80%
Overall Classification Accuracy = 86.00%
Kappa (K^) statistics
---------------------
Overall Kappa Statistics = 0.8065
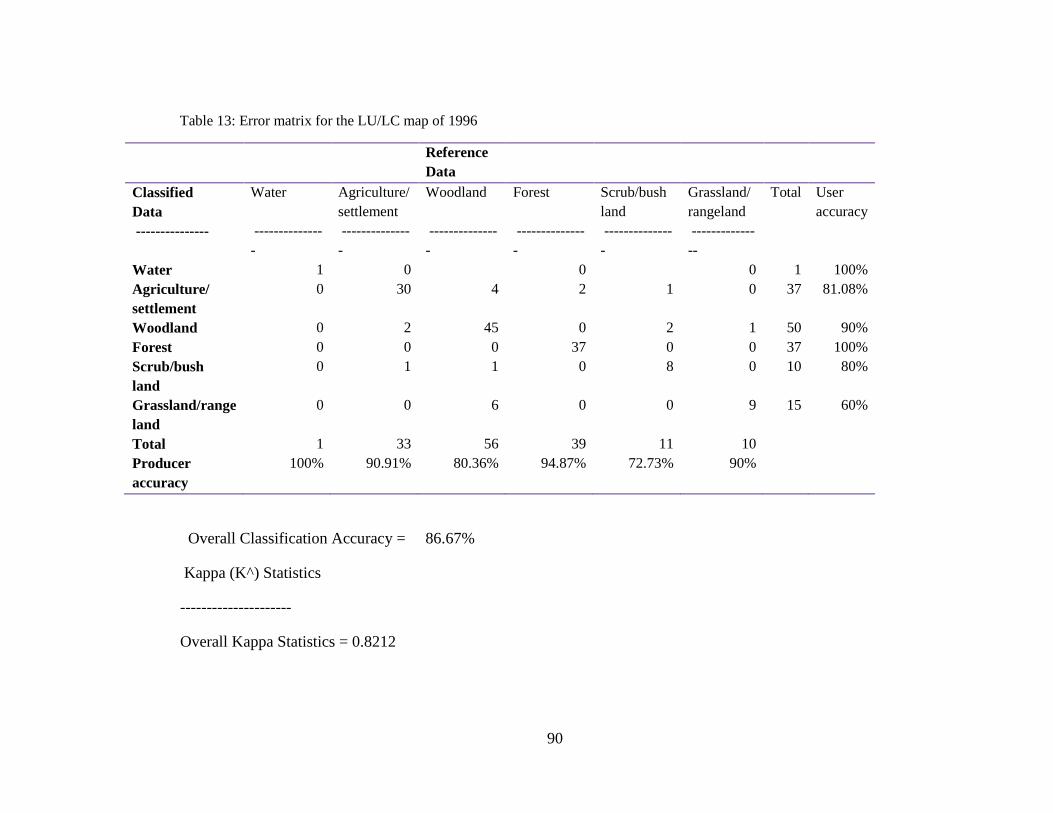
90
Table 13: Error matrix for the LU/LC map of 1996
Reference
Data
Classified
Data
Water Agriculture/
settlement
Woodland Forest Scrub/bush
land
Grassland/
rangeland
Total User
accuracy
--------------- --------------
-
--------------
-
--------------
-
--------------
-
--------------
-
-------------
--
Water 1 0 0 0 1 100%
Agriculture/
settlement
0 30 4 2 1 0 37 81.08%
Woodland 0 2 45 0 2 1 50 90%
Forest 0 0 0 37 0 0 37 100%
Scrub/bush
land
0 1 1 0 8 0 10 80%
Grassland/range
land
0 0 6 0 0 9 15 60%
Total 1 33 56 39 11 10
Producer
accuracy
100% 90.91% 80.36% 94.87% 72.73% 90%
Overall Classification Accuracy = 86.67%
Kappa (K^) Statistics
---------------------
Overall Kappa Statistics = 0.8212
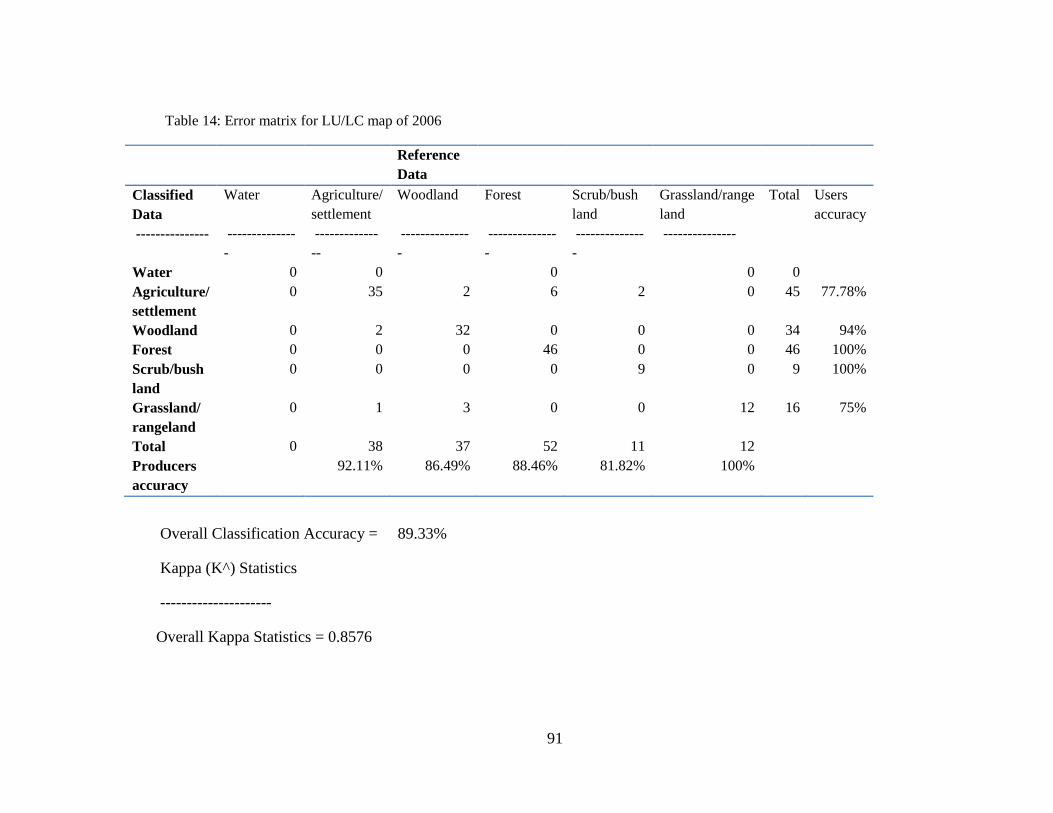
91
Table 14: Error matrix for LU/LC map of 2006
Reference
Data
Classified
Data
Water Agriculture/
settlement
Woodland Forest Scrub/bush
land
Grassland/range
land
Total Users
accuracy
--------------- --------------
-
-------------
--
--------------
-
--------------
-
--------------
-
---------------
Water 0 0 0 0 0
Agriculture/
settlement
0 35 2 6 2 0 45 77.78%
Woodland 0 2 32 0 0 0 34 94%
Forest 0 0 0 46 0 0 46 100%
Scrub/bush
land
0 0 0 0 9 0 9 100%
Grassland/
rangeland
0 1 3 0 0 12 16 75%
Total 0 38 37 52 11 12
Producers
accuracy
92.11% 86.49% 88.46% 81.82% 100%
Overall Classification Accuracy = 89.33%
Kappa (K^) Statistics
---------------------
Overall Kappa Statistics = 0.8576
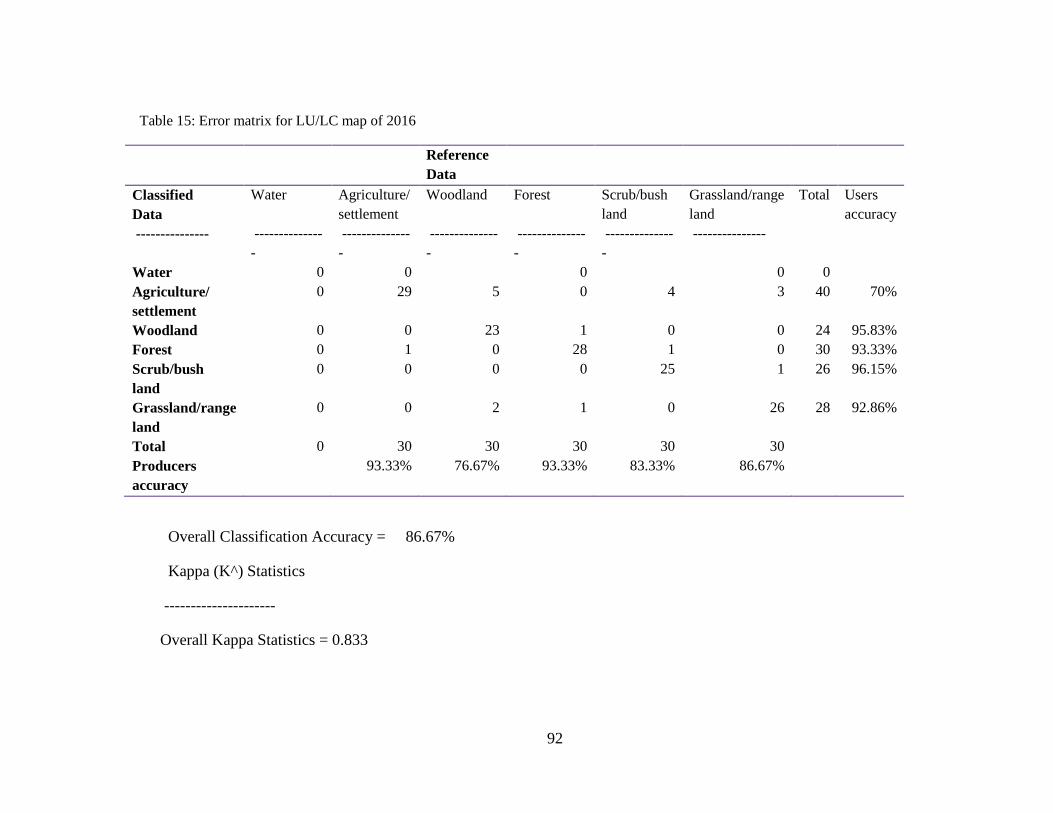
92
Table 15: Error matrix for LU/LC map of 2016
Reference
Data
Classified
Data
Water Agriculture/
settlement
Woodland Forest Scrub/bush
land
Grassland/range
land
Total Users
accuracy
--------------- --------------
-
--------------
-
--------------
-
--------------
-
--------------
-
---------------
Water 0 0 0 0 0
Agriculture/
settlement
0 29 5 0 4 3 40 70%
Woodland 0 0 23 1 0 0 24 95.83%
Forest 0 1 0 28 1 0 30 93.33%
Scrub/bush
land
0 0 0 0 25 1 26 96.15%
Grassland/range
land
0 0 2 1 0 26 28 92.86%
Total 0 30 30 30 30 30
Producers
accuracy
93.33% 76.67% 93.33% 83.33% 86.67%
Overall Classification Accuracy = 86.67%
Kappa (K^) Statistics
---------------------
Overall Kappa Statistics = 0.833
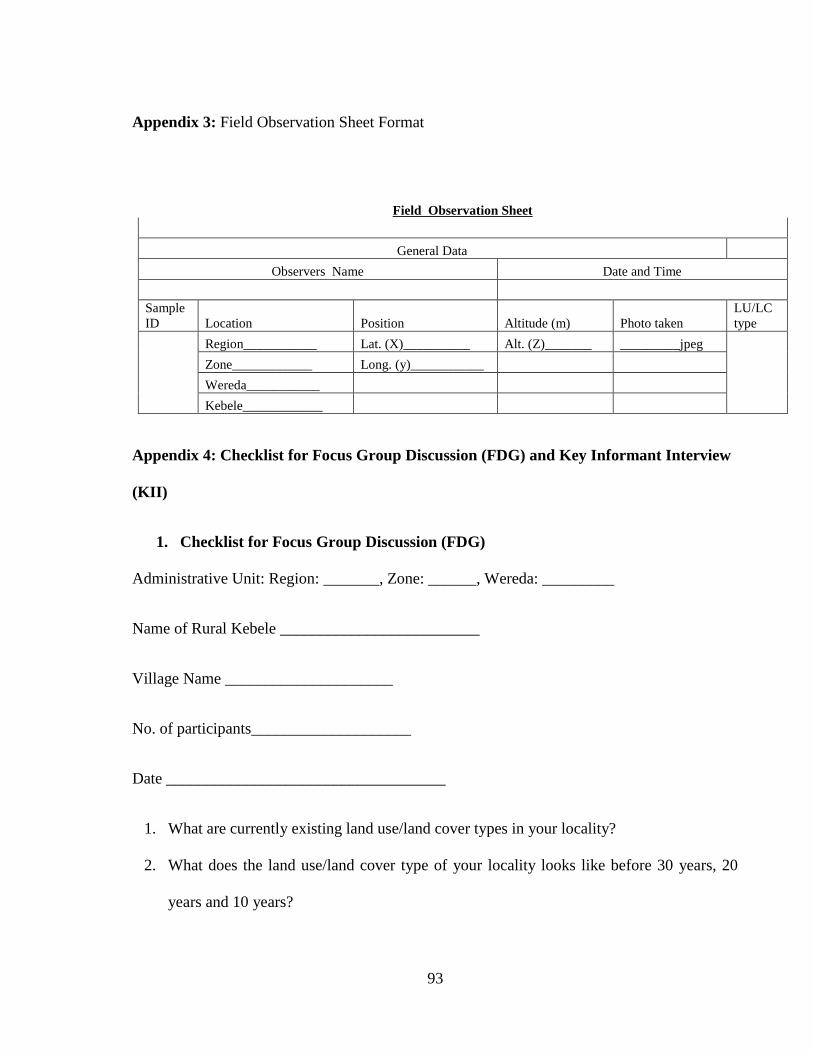
93
Appendix 3: Field Observation Sheet Format
Field Observation Sheet
General Data
Observers Name Date and Time
Sample
ID Location Position Altitude (m) Photo taken
LU/LC
type
Region___________ Lat. (X)__________ Alt. (Z)_______ _________jpeg
Zone____________ Long. (y)___________
Wereda___________
Kebele____________
Appendix 4: Checklist for Focus Group Discussion (FDG) and Key Informant Interview
(KII)
1. Checklist for Focus Group Discussion (FDG)
Administrative Unit: Region: _______, Zone: ______, Wereda: _________
Name of Rural Kebele _________________________
Village Name _____________________
No. of participants____________________
Date ___________________________________
1. What are currently existing land use/land cover types in your locality?
2. What does the land use/land cover type of your locality looks like before 30 years, 20
years and 10 years?
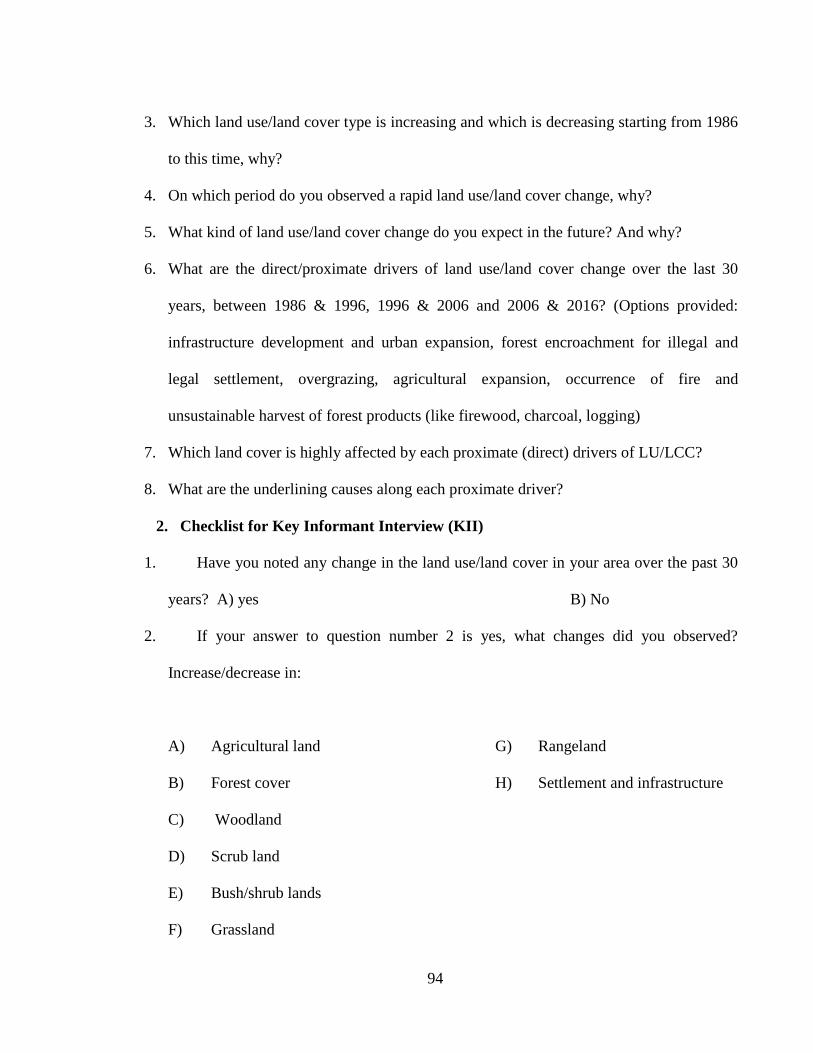
94
3. Which land use/land cover type is increasing and which is decreasing starting from 1986
to this time, why?
4. On which period do you observed a rapid land use/land cover change, why?
5. What kind of land use/land cover change do you expect in the future? And why?
6. What are the direct/proximate drivers of land use/land cover change over the last 30
years, between 1986 & 1996, 1996 & 2006 and 2006 & 2016? (Options provided:
infrastructure development and urban expansion, forest encroachment for illegal and
legal settlement, overgrazing, agricultural expansion, occurrence of fire and
unsustainable harvest of forest products (like firewood, charcoal, logging)
7. Which land cover is highly affected by each proximate (direct) drivers of LU/LCC?
8. What are the underlining causes along each proximate driver?
2. Checklist for Key Informant Interview (KII)
1. Have you noted any change in the land use/land cover in your area over the past 30
years? A) yes B) No
2. If your answer to question number 2 is yes, what changes did you observed?
Increase/decrease in:
A) Agricultural land
B) Forest cover
C) Woodland
D) Scrub land
E) Bush/shrub lands
F) Grassland
G) Rangeland
H) Settlement and infrastructure
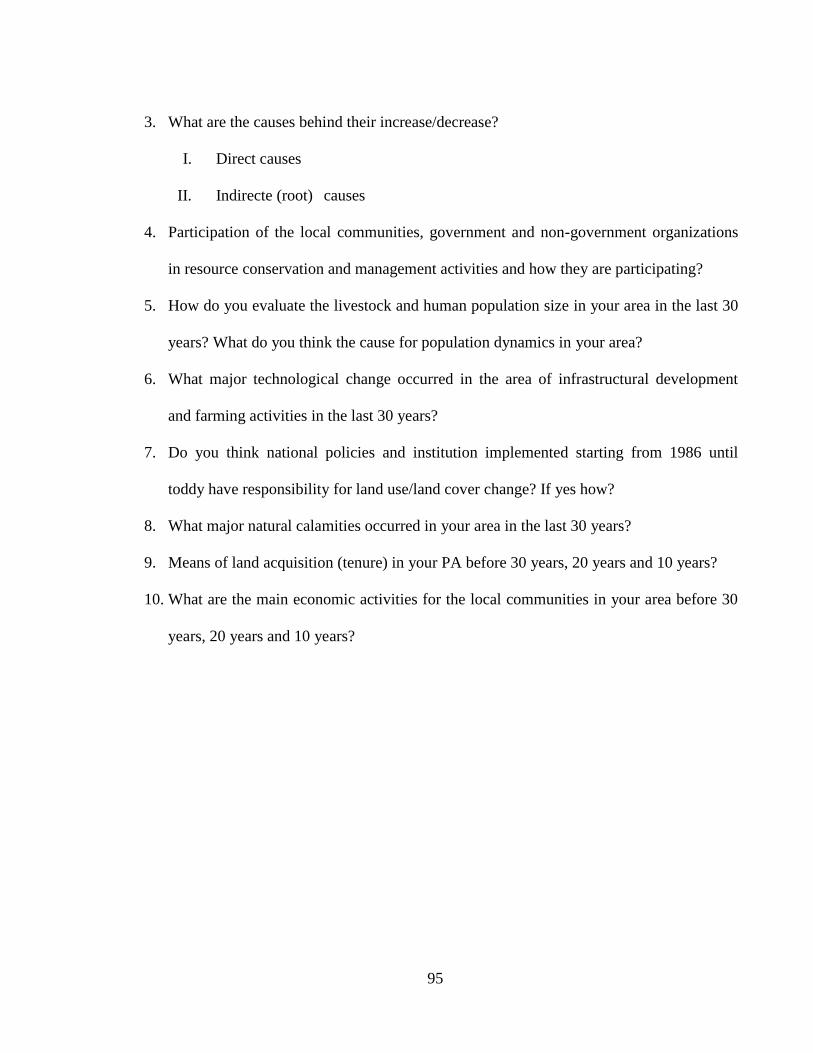
95
3. What are the causes behind their increase/decrease?
I. Direct causes
II. Indirecte (root) causes
4. Participation of the local communities, government and non-government organizations
in resource conservation and management activities and how they are participating?
5. How do you evaluate the livestock and human population size in your area in the last 30
years? What do you think the cause for population dynamics in your area?
6. What major technological change occurred in the area of infrastructural development
and farming activities in the last 30 years?
7. Do you think national policies and institution implemented starting from 1986 until
toddy have responsibility for land use/land cover change? If yes how?
8. What major natural calamities occurred in your area in the last 30 years?
9. Means of land acquisition (tenure) in your PA before 30 years, 20 years and 10 years?
10. What are the main economic activities for the local communities in your area before 30
years, 20 years and 10 years?