Embed Size (px)
Citation preview
Department of the Interior U.S. Geological Survey
PRODUCT GUIDE LANDSAT SURFACE REFLECTANCE-DERIVED SPECTRAL INDICES
Version 3.6 December 2017
Landsat Spectral Indices Product Guide - ii - Version 3.6
Executive Summary
This document describes relevant characteristics of the Spectral Indices products derived from Landsat Surface Reflectance to facilitate use in the land remote sensing community.
Landsat Spectral Indices Product Guide - iii - Version 3.6
Document History
Document Version Publication Date Change Description
Version 1.0 11/10/2013 Initial Draft
Version 1.1 12/01/2013 Revised after Peer Review
Version 1.2 12/17/2013 Corrected typographical error on page 15
Version 2.0 03/28/2014 Revised to accommodate new file format options
Version 2.1 07/24/2014 Updated ESPA product access and product packaging
Version 2.2 08/05/2014 Revised HDF file characteristics
Version 2.3 09/16/2014 Corrected typographical error in EVI equation.
Version 2.4 12/23/2014 Added Provisional Landsat 8 Surface Reflectance information (product guide references, SI equation updates.)
Version 2.5 03/06/2015
Updated default EarthExplorer file format output information. Replaced Appendix D Metadata Fields with example directly from XML metadata file.
Version 2.6 04/03/2015 Corrected typo in Landsat 8 Enhanced Vegetation Index (EVI) equation.
Version 2.7 6/26/2015 Updated URLS in Source Products and added L8SR comparison images. Revised Data Access.
Version 2.8 12/01/2015
Corrected minor typos and revised the formatting of citations. Added details pertaining to values >+1.0 or <-1.0 being set to 10000 and -10000, respectively. Updated “User Services” section with correct information. Updated “File Characteristics” appendix to be more accurate.
Version 2.9 03/01/2016 Fixed broken hyperlink to L8SR product guide. Updated Default File Characteristics (Appendix A).
Version 3.0 07/01/2016
Updated reference and links to Landsat 8 Surface Reflectance Code (LaSRC) algorithm product and product guide. Added unavailability notice of LaSRC products between 2016-050 and 2016-058 due to MODIS Terra safe mode.
Version 3.1 10/07/2016 Added NetCDF file format. Added unavailable data range for L4-7 SR products.
Version 3.2 12/07/2016 Replaced links to Landsat Missions Website
Version 3.3 12/13/2016 Corrected typographical error in EVI formula
Landsat Spectral Indices Product Guide - iv - Version 3.6
Version 3.4 03/31/2017
Added Landsat Collection 1 examples in product section(s) and appendices. Removed “Provisional” from all Surface Reflectance algorithms (C1 only.) Updated caveats to reflect most up-to-date SR data gap information found on Landsat website. Added pixel_qa band (C1 only.) Updated acknowledgements.
Version 3.5 04/06/2017 Removal of Pre-Collection Landsat information.
Version 3.6 12/04/2017 Added “top of atmosphere” before “brightness temperature” to clarify that BT products are not atmospherically corrected.
Landsat Spectral Indices Product Guide - 5 - Version 3.6
Contents
Executive Summary ...................................................................................................... ii
Document History ........................................................................................................ iii
Contents ......................................................................................................................... 5
List of Tables ................................................................................................................. 6
List of Figures ............................................................................................................... 6
Section 1 Introduction .............................................................................................. 7
Section 2 Caveats and Constraints ......................................................................... 8
Section 3 Source Products .................................................................................... 10
Section 4 Product Access ...................................................................................... 12
Section 5 Product Packaging ................................................................................ 13
Section 6 Product Characteristics ........................................................................ 14
6.1 Vegetation Indices (VI) ..................................................................................... 14 6.1.1 Normalized Difference Vegetation Index (NDVI) ...................................... 14 6.1.2 Enhanced Vegetation Index (EVI) ............................................................ 14
6.1.3 Soil Adjusted Vegetation Index (SAVI)..................................................... 15 6.1.4 Modified Soil Adjusted Vegetation Index (MSAVI) ................................... 16
6.2 Normalized Difference Moisture Index (NDMI) ................................................. 16 6.3 Normalized Burn Ratio (NBR) .......................................................................... 17 6.4 Normalized Burn Ratio 2 (NBR2) ..................................................................... 17
6.5 Pixel Quality Assurance ................................................................................... 18 Section 7 Citation Information ............................................................................... 20
Section 8 Acknowledgments ................................................................................. 21
Section 9 User Services ......................................................................................... 22
Section 10 References ............................................................................................. 23
Appendix A Default File Characteristics ................................................................... 25
Appendix B HDF File Characteristics ........................................................................ 26
Appendix C Binary File Characteristics .................................................................... 28
Appendix D Metadata Fields ...................................................................................... 29
Appendix E Acronyms ................................................................................................ 30
Landsat Spectral Indices Product Guide - 6 - Version 3.6
List of Tables
Table 6-1 NDVI Specifications ...................................................................................... 14 Table 6-2 EVI Specifications ......................................................................................... 15 Table 6-3 SAVI Specifications ....................................................................................... 15
Table 6-4 MSAVI Specifications .................................................................................... 16 Table 6-6-5 NDMI Specifications ................................................................................... 16 Table 6-6 NBR Specifications ....................................................................................... 17 Table 6-7 NBR2 Specifications ..................................................................................... 18 Table 6-8 Pixel Quality Assurance (pixel_qa) for Landsat 4-5 and Landsat 7 ............... 18
Table 6-9 Pixel Quality Assurance (pixel_qa) for Landsat 8 .......................................... 19 Table 11-0-1 Default File Characteristics ...................................................................... 25 Table 12-0-1 Default File Characteristics ...................................................................... 26
Table 13-0-1 Binary File Characteristics ....................................................................... 28
List of Figures
Figure 3-1 Example of LEDAPS atmospheric correction. Left, Top of Atmosphere (TOA) Reflectance composite (bands 3,2,1) for Landsat-7 ETM+ image of San Francisco Bay (July 7, 1999); Right, Surface Reflectance composite. Both images are linearly scaled from p = 0.0 to 0.15. ....................................................................... 10
Landsat Spectral Indices Product Guide - 7 - Version 3.6
Section 1 Introduction
Landsat satellite data have been produced, archived, and distributed by the U.S. Geological Survey (USGS) since 1972. Users rely on these data for historical study of land surface change, but shoulder the burden of post-production processing to create applications-ready data sets. In compliance with guidelines established through the Global Climate Observing System, USGS has embarked on production of higher-level Landsat data products to support land surface change studies. One such product is Surface Reflectance, from which spectral indices can be derived to further the ease of user application in land remote sensing science. USGS is currently offering these 30-meter (m) Landsat Surface Reflectance-derived spectral indices products for Landsat 4–5 Thematic Mapper (TM), Landsat 7 Enhanced Thematic Mapper Plus (ETM+), and Landsat 8 Operational Land Imager (OLI)/Thermal Infrared Sensor (TIRS):
Normalized Difference Vegetation Index (NDVI)
Enhanced Vegetation Index (EVI)
Soil Adjusted Vegetation Index (SAVI)
Modified Soil Adjusted Vegetation Index (MSAVI)
Normalized Difference Moisture Index (NDMI)
Normalized Burn Ratio (NBR)
Normalized Burn Ratio 2 (NBR2)
This product guide describes the characteristics of each product, as well as data access and available user services.
Landsat Spectral Indices Product Guide - 8 - Version 3.6
Section 2 Caveats and Constraints
The spectral indices products are under the same constraints as the source Landsat Surface Reflectance products.
1. The following date ranges apply to the availability of the Landsat archive for spectral indices processing, with the exceptions noted below.
Landsat 4 TM: July 1982 to December 1993
Landsat 5 TM: March 1984 to May 2012
Landsat 7 ETM+: April 1999 to within one week of present
Landsat 8 OLI/TIRS (LC8 or LC08): March 2013 to within one week of present
2. Spectral indices can only be processed on day-lit scenes (descending node).
3. Landsat 4 TM scenes processed through the National Landsat Archive Processing System (NLAPS) cannot be used to generate spectral indices products. NLAPS scenes are formatted and calibrated differently than those processed through the standard Landsat Product Generation System (LPGS).
A list of known NLAPS scenes can be found online (https://landsat.usgs.gov/sites/default/files/documents/L4-5TM_NLAPS.xlsx).
NLAPS-based scenes will be automatically removed from user orders. The order status will be updated with this action and the remaining scenes will continue processing.
4. Landsat 7 ETM+ scenes acquired on the day of the Scan Line Corrector (SLC) failure (May 31, 2003) cannot be used to generate spectral indices products. See https://landsat.usgs.gov/using-landsat-7-data for information on Landsat 7 SLC-off data products.
5. Landsat 7 ETM+ SLC-off inputs (acquired after May 31, 2003) are not gap-filled in spectral indices production.
6. For some time periods, Surface Reflectance cannot be run due to missing auxiliary data. The most up-to-date information regarding data gaps is in the “Caveats and Constraints” section of https://landsat.usgs.gov/landsat-surface-reflectance-high-level-data-products.
7. Spectral indices cannot be processed for products not on the WRS-2 system.
8. Spectral indices products may have increased uncertainties, inherited from the Surface Reflectance source data, in areas where atmospheric correction is affected by adverse conditions, including:
Hyper-arid or snow-covered regions
Low sun angle conditions
Coastal regions where land area is small relative to adjacent water
Landsat Spectral Indices Product Guide - 9 - Version 3.6
Areas with extensive cloud contamination
9. Surface Reflectance is not run on scenes with a solar zenith angle greater than or equal to 76 degrees.
10. Users are cautioned against requesting spectral indices products for areas in high latitudes (> 65 degrees North or South).
11. Spectral indices products do not carry any quality information, however, saturated pixels are identified in the outputs. Surface Reflectance data products and the pixel quality assurance band (pixel_qa) can be utilized to obtain quality information for the scene.
12. Any pixel values resulting in a spectral index less than/equal to -1.0 will be set to -10000, and a spectral index greater than/equal to +1.0 will be set to 10000 in the output product.
Landsat Spectral Indices Product Guide - 10 - Version 3.6
Section 3 Source Products
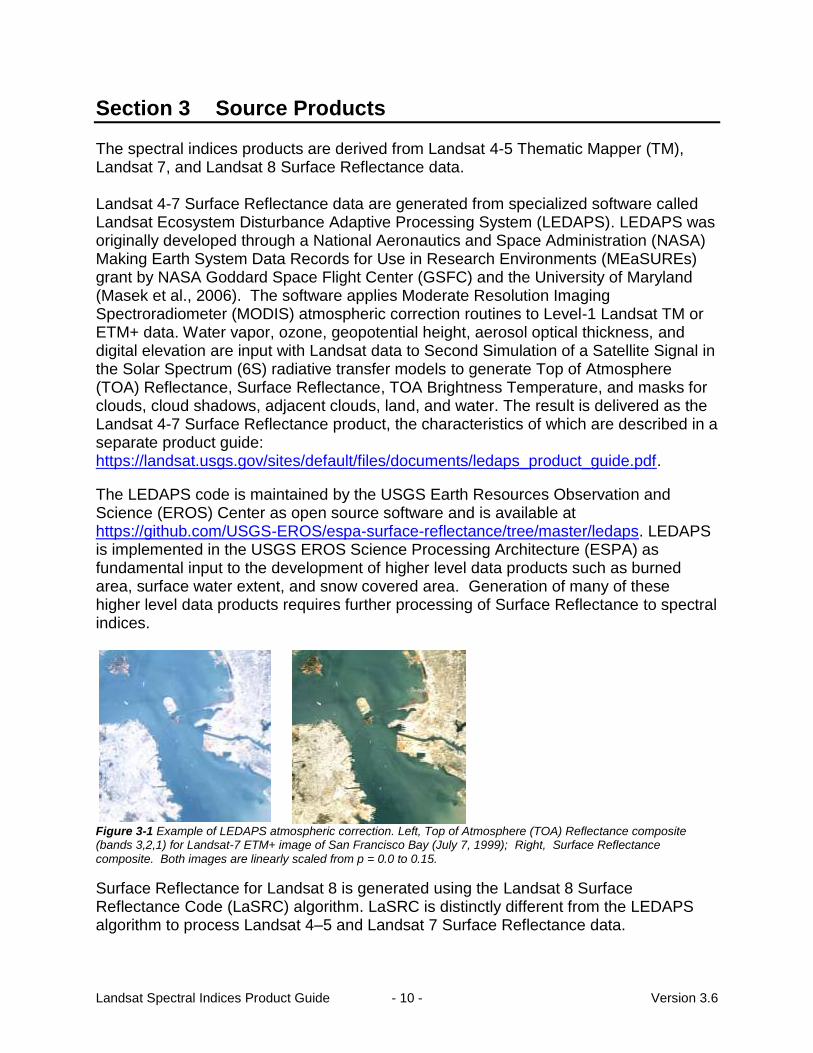
The spectral indices products are derived from Landsat 4-5 Thematic Mapper (TM), Landsat 7, and Landsat 8 Surface Reflectance data. Landsat 4-7 Surface Reflectance data are generated from specialized software called Landsat Ecosystem Disturbance Adaptive Processing System (LEDAPS). LEDAPS was originally developed through a National Aeronautics and Space Administration (NASA) Making Earth System Data Records for Use in Research Environments (MEaSUREs) grant by NASA Goddard Space Flight Center (GSFC) and the University of Maryland (Masek et al., 2006). The software applies Moderate Resolution Imaging Spectroradiometer (MODIS) atmospheric correction routines to Level-1 Landsat TM or ETM+ data. Water vapor, ozone, geopotential height, aerosol optical thickness, and digital elevation are input with Landsat data to Second Simulation of a Satellite Signal in the Solar Spectrum (6S) radiative transfer models to generate Top of Atmosphere (TOA) Reflectance, Surface Reflectance, TOA Brightness Temperature, and masks for clouds, cloud shadows, adjacent clouds, land, and water. The result is delivered as the Landsat 4-7 Surface Reflectance product, the characteristics of which are described in a separate product guide: https://landsat.usgs.gov/sites/default/files/documents/ledaps_product_guide.pdf.
The LEDAPS code is maintained by the USGS Earth Resources Observation and Science (EROS) Center as open source software and is available at https://github.com/USGS-EROS/espa-surface-reflectance/tree/master/ledaps. LEDAPS is implemented in the USGS EROS Science Processing Architecture (ESPA) as fundamental input to the development of higher level data products such as burned area, surface water extent, and snow covered area. Generation of many of these higher level data products requires further processing of Surface Reflectance to spectral indices.
Figure 3-1 Example of LEDAPS atmospheric correction. Left, Top of Atmosphere (TOA) Reflectance composite (bands 3,2,1) for Landsat-7 ETM+ image of San Francisco Bay (July 7, 1999); Right, Surface Reflectance
composite. Both images are linearly scaled from p = 0.0 to 0.15.
Surface Reflectance for Landsat 8 is generated using the Landsat 8 Surface Reflectance Code (LaSRC) algorithm. LaSRC is distinctly different from the LEDAPS algorithm to process Landsat 4–5 and Landsat 7 Surface Reflectance data.
Landsat Spectral Indices Product Guide - 11 - Version 3.6
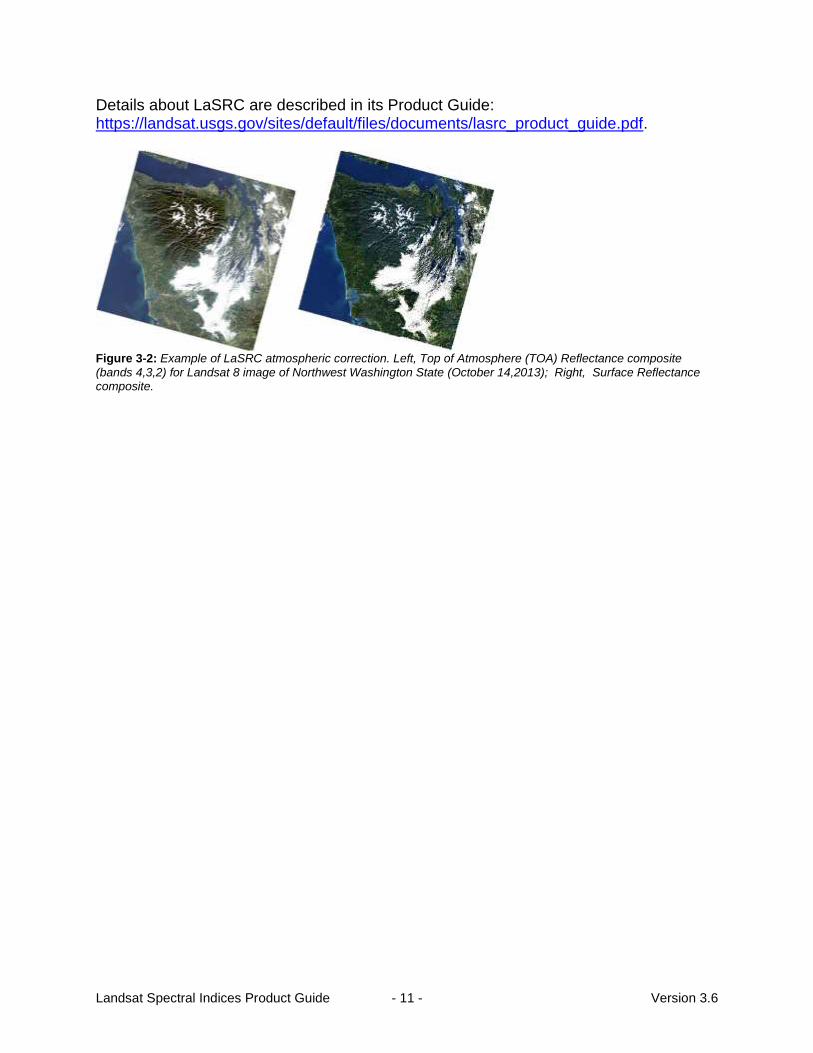
Details about LaSRC are described in its Product Guide: https://landsat.usgs.gov/sites/default/files/documents/lasrc_product_guide.pdf.
Figure 3-2: Example of LaSRC atmospheric correction. Left, Top of Atmosphere (TOA) Reflectance composite
(bands 4,3,2) for Landsat 8 image of Northwest Washington State (October 14,2013); Right, Surface Reflectance composite.
Landsat Spectral Indices Product Guide - 12 - Version 3.6
Section 4 Product Access
Landsat Spectral Indices can be requested on the USGS Earth Resources Observation and Science (EROS) Center Science Processing Architecture (ESPA) On Demand Interface: https://espa.cr.usgs.gov. Details about the ESPA On Demand Interface can be found in the ESPA On-Demand Interface User Guide: https://landsat.usgs.gov/sites/default/files/documents/espa_odi_userguide.pdf.
Landsat Spectral Indices Product Guide - 13 - Version 3.6
Section 5 Product Packaging
Surface Reflectance data acquired from EarthExplorer will are supplied in a gzip file (“.tar.gz”). Unzipping this file produces a tarball (“.tar”), and then will untar to a GeoTIFF (“.tif”) file. Each GeoTIFF filename has the suffix “_sr_” after the sceneID to denote the Surface Reflectance transformation. Files acquired from ESPA will are supplied in a gzip file (“.tar.gz”). Unzipping this file produces a tarball (“.tar”), and then will untar to GeoTIFF (“.tif”) (default), HDF-EOS2 (“.hdf”), NetCDF (“.nc”) or ENVI binary (“.img”) files. The naming convention used in these products builds on the filenames of the Landsat original input scenes. An example breaking down the components of a typical Landsat product is:
LXSS_LLLL_PPPRRR_YYYYMMDD_yyyymmdd_CX_TX_prod_band.ext (e.g., LE07_L1TP_039037_20080728_20170314_01_T1_sr_ndvi.tif) L Landsat X Sensor (“E” = ETM+; “T” = TM) SS Satellite (“07” = Landsat 7; “05” = Landsat 5; “04” = Landsat 4) LLLL Processing correction level (“L1TP” = Precision Terrain; “L1GT” =
Systematic Terrain; “L1GS” = Systematic) PPP Path RRR Row YYYY Year of acquisition MM Month of acquisition DD Day of acquisition yyyy Year of processing mm Month of processing dd Day of processing CX Collection number (“01”, “02”, etc.) TX Collection category (“RT” = Real-Time; “T1” = Tier 1; “T2” = Tier 2) prod Product, such as “toa” or “sr” band Band, such as “band<1-7>,” “qa,” or spectral index. ext File format extension, such as “tif,” “tfw,” “xml,” “hdf,” “hdr,” “nc,” or “img”
Landsat Spectral Indices Product Guide - 14 - Version 3.6
Section 6 Product Characteristics
6.1 Vegetation Indices (VI)
The vegetation indices options include NDVI, EVI, SAVI, and MSAVI. Products are generated at 30-m spatial resolution on a Universal Transverse Mercator (UTM) or Polar Stereographic (PS) mapping grid. The default file format is GeoTIFF, but options for delivery in Hierarchical Data Format (HDF) and binary are available through the ESPA Ordering Interface. Likewise, processing services can be requested such as reprojection and spatial sub-setting. Temporal coverage varies depending on the selected sensor, with the exceptions noted in Section 2 Caveats and Constraints.
6.1.1 Normalized Difference Vegetation Index (NDVI)
NDVI is calculated as a ratio between the red (R) and near infrared (NIR) values in traditional fashion. (NIR - R) / (NIR + R) In Landsat 4-7, NDVI = (Band 4 – Band 3) / (Band 4 + Band 3). In Landsat 8, NDVI = (Band 5 – Band 4) / (Band 5 + Band 4). NDVI is a single band product specified as shown in the table below. A full listing of all associated metadata fields is found in Appendix D. Table 6-1 NDVI Specifications
Attribute Value Long Name Normalized Difference Vegetation Index
Short Name LC8NDVI, LE7NDVI, LT5NDVI, or LT4NDVI
Data Type Signed 16-bit Integer
Units Spectral Index (Band Ratio)
Valid Range -10,000 – 10,000
Fill Value -9999
Saturate Value 20,000
Scale Factor *0.0001
6.1.2 Enhanced Vegetation Index (EVI)
EVI incorporates an “L” value to adjust for canopy background, “C” values as coefficients for atmospheric resistance, and values from the blue band (B). These enhancements allow for index calculation as a ratio between the R and NIR values, while reducing the background noise, atmospheric noise, and saturation in most cases. EVI = G * ((NIR - R) / (NIR + C1 * R – C2 * B + L))
Landsat Spectral Indices Product Guide - 15 - Version 3.6
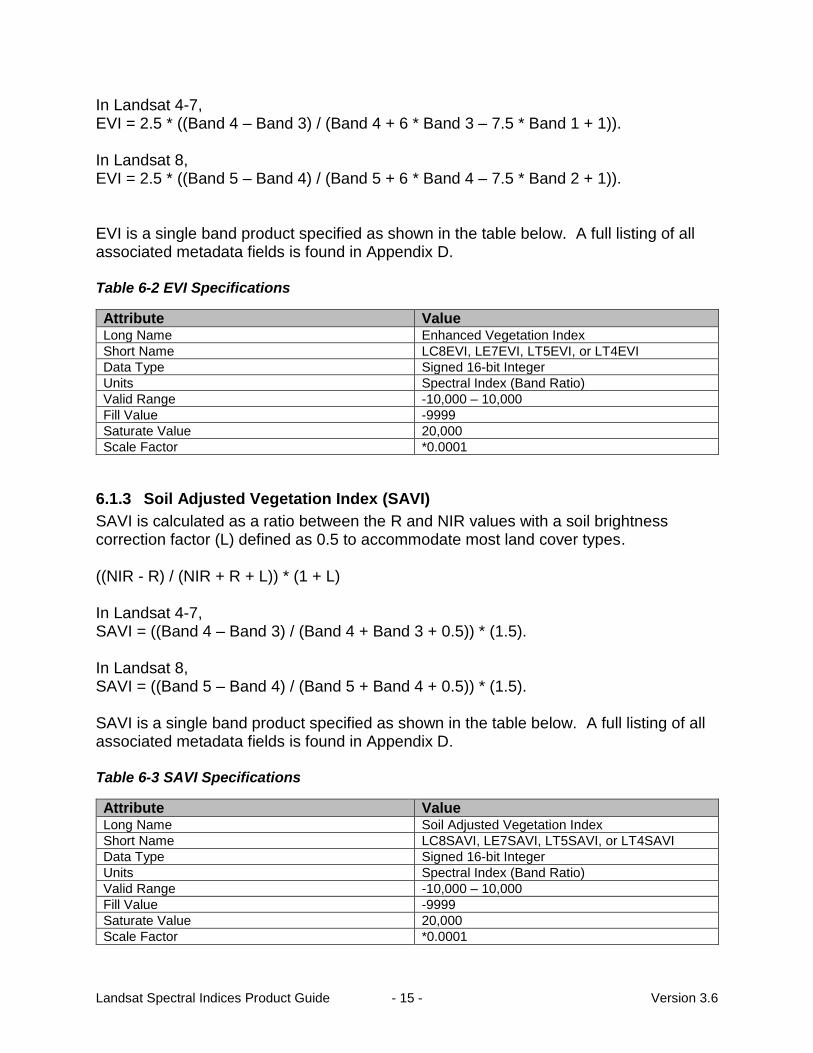
In Landsat 4-7, EVI = 2.5 * ((Band 4 – Band 3) / (Band 4 + 6 * Band 3 – 7.5 * Band 1 + 1)). In Landsat 8, EVI = 2.5 * ((Band 5 – Band 4) / (Band 5 + 6 * Band 4 – 7.5 * Band 2 + 1)). EVI is a single band product specified as shown in the table below. A full listing of all associated metadata fields is found in Appendix D. Table 6-2 EVI Specifications
Attribute Value Long Name Enhanced Vegetation Index
Short Name LC8EVI, LE7EVI, LT5EVI, or LT4EVI
Data Type Signed 16-bit Integer
Units Spectral Index (Band Ratio)
Valid Range -10,000 – 10,000
Fill Value -9999
Saturate Value 20,000
Scale Factor *0.0001
6.1.3 Soil Adjusted Vegetation Index (SAVI)
SAVI is calculated as a ratio between the R and NIR values with a soil brightness correction factor (L) defined as 0.5 to accommodate most land cover types. ((NIR - R) / (NIR + R + L)) * (1 + L) In Landsat 4-7, SAVI = ((Band 4 – Band 3) / (Band 4 + Band 3 + 0.5)) * (1.5). In Landsat 8, SAVI = ((Band 5 – Band 4) / (Band 5 + Band 4 + 0.5)) * (1.5). SAVI is a single band product specified as shown in the table below. A full listing of all associated metadata fields is found in Appendix D. Table 6-3 SAVI Specifications
Attribute Value Long Name Soil Adjusted Vegetation Index
Short Name LC8SAVI, LE7SAVI, LT5SAVI, or LT4SAVI
Data Type Signed 16-bit Integer
Units Spectral Index (Band Ratio)
Valid Range -10,000 – 10,000
Fill Value -9999
Saturate Value 20,000
Scale Factor *0.0001
Landsat Spectral Indices Product Guide - 16 - Version 3.6
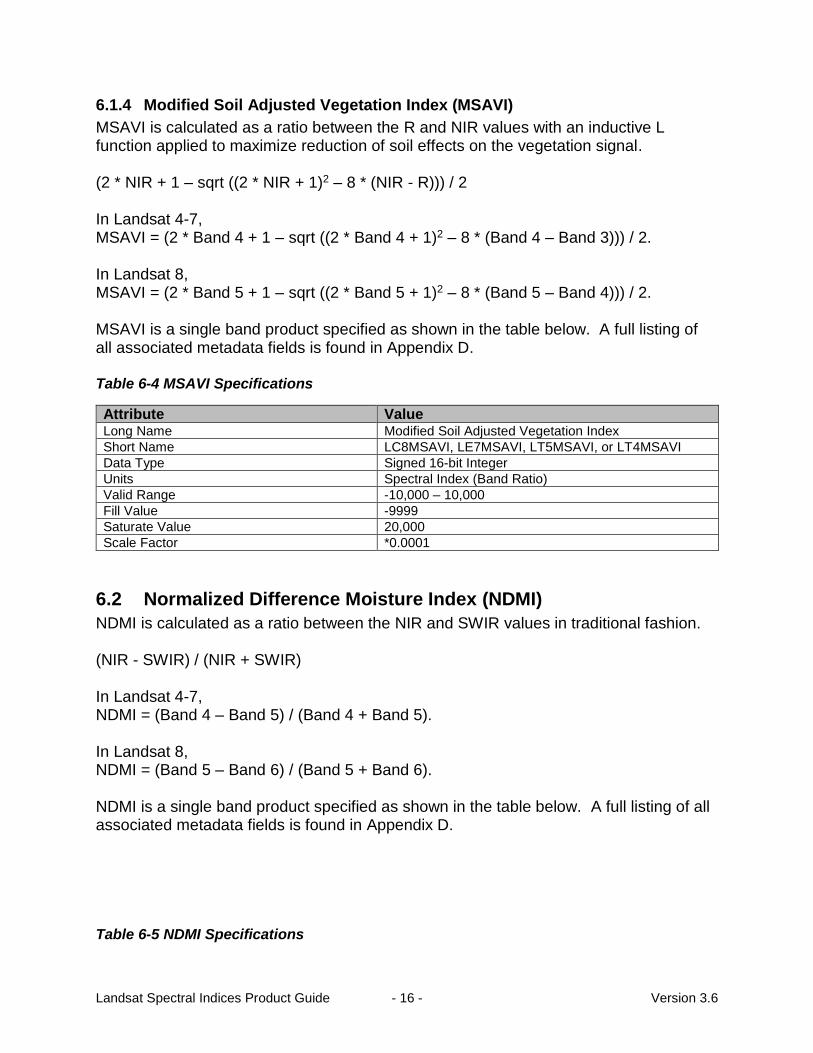
6.1.4 Modified Soil Adjusted Vegetation Index (MSAVI)
MSAVI is calculated as a ratio between the R and NIR values with an inductive L function applied to maximize reduction of soil effects on the vegetation signal. (2 * NIR + 1 – sqrt ((2 * NIR + 1)2 – 8 * (NIR - R))) / 2 In Landsat 4-7, MSAVI = (2 * Band 4 + 1 – sqrt ((2 * Band 4 + 1)2 – 8 * (Band 4 – Band 3))) / 2. In Landsat 8, MSAVI = (2 * Band 5 + 1 – sqrt ((2 * Band 5 + 1)2 – 8 * (Band 5 – Band 4))) / 2. MSAVI is a single band product specified as shown in the table below. A full listing of all associated metadata fields is found in Appendix D. Table 6-4 MSAVI Specifications
Attribute Value Long Name Modified Soil Adjusted Vegetation Index
Short Name LC8MSAVI, LE7MSAVI, LT5MSAVI, or LT4MSAVI
Data Type Signed 16-bit Integer
Units Spectral Index (Band Ratio)
Valid Range -10,000 – 10,000
Fill Value -9999
Saturate Value 20,000
Scale Factor *0.0001
6.2 Normalized Difference Moisture Index (NDMI)
NDMI is calculated as a ratio between the NIR and SWIR values in traditional fashion. (NIR - SWIR) / (NIR + SWIR) In Landsat 4-7, NDMI = (Band 4 – Band 5) / (Band 4 + Band 5). In Landsat 8, NDMI = (Band 5 – Band 6) / (Band 5 + Band 6). NDMI is a single band product specified as shown in the table below. A full listing of all associated metadata fields is found in Appendix D. Table 6-5 NDMI Specifications
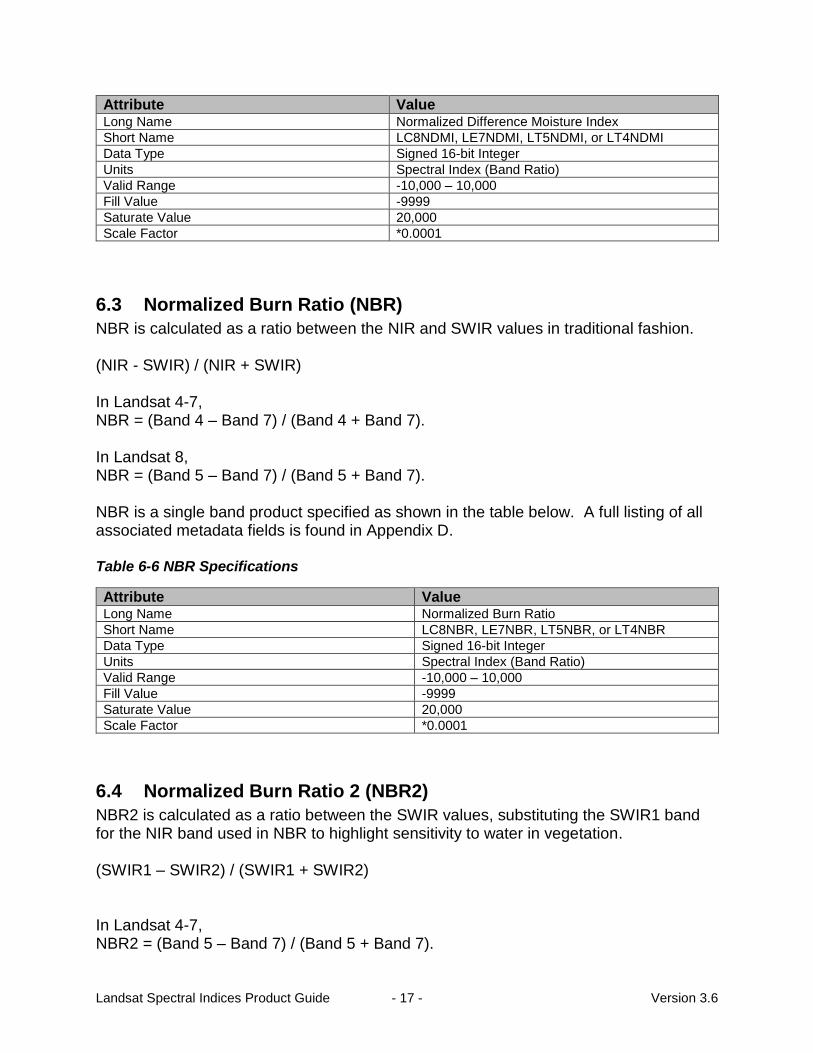
Landsat Spectral Indices Product Guide - 17 - Version 3.6
Attribute Value Long Name Normalized Difference Moisture Index
Short Name LC8NDMI, LE7NDMI, LT5NDMI, or LT4NDMI
Data Type Signed 16-bit Integer
Units Spectral Index (Band Ratio)
Valid Range -10,000 – 10,000
Fill Value -9999
Saturate Value 20,000
Scale Factor *0.0001
6.3 Normalized Burn Ratio (NBR)
NBR is calculated as a ratio between the NIR and SWIR values in traditional fashion. (NIR - SWIR) / (NIR + SWIR) In Landsat 4-7, NBR = (Band 4 – Band 7) / (Band 4 + Band 7). In Landsat 8, NBR = (Band 5 – Band 7) / (Band 5 + Band 7). NBR is a single band product specified as shown in the table below. A full listing of all associated metadata fields is found in Appendix D. Table 6-6 NBR Specifications
Attribute Value Long Name Normalized Burn Ratio
Short Name LC8NBR, LE7NBR, LT5NBR, or LT4NBR
Data Type Signed 16-bit Integer
Units Spectral Index (Band Ratio)
Valid Range -10,000 – 10,000
Fill Value -9999
Saturate Value 20,000
Scale Factor *0.0001
6.4 Normalized Burn Ratio 2 (NBR2)
NBR2 is calculated as a ratio between the SWIR values, substituting the SWIR1 band for the NIR band used in NBR to highlight sensitivity to water in vegetation. (SWIR1 – SWIR2) / (SWIR1 + SWIR2) In Landsat 4-7, NBR2 = (Band 5 – Band 7) / (Band 5 + Band 7).
Landsat Spectral Indices Product Guide - 18 - Version 3.6
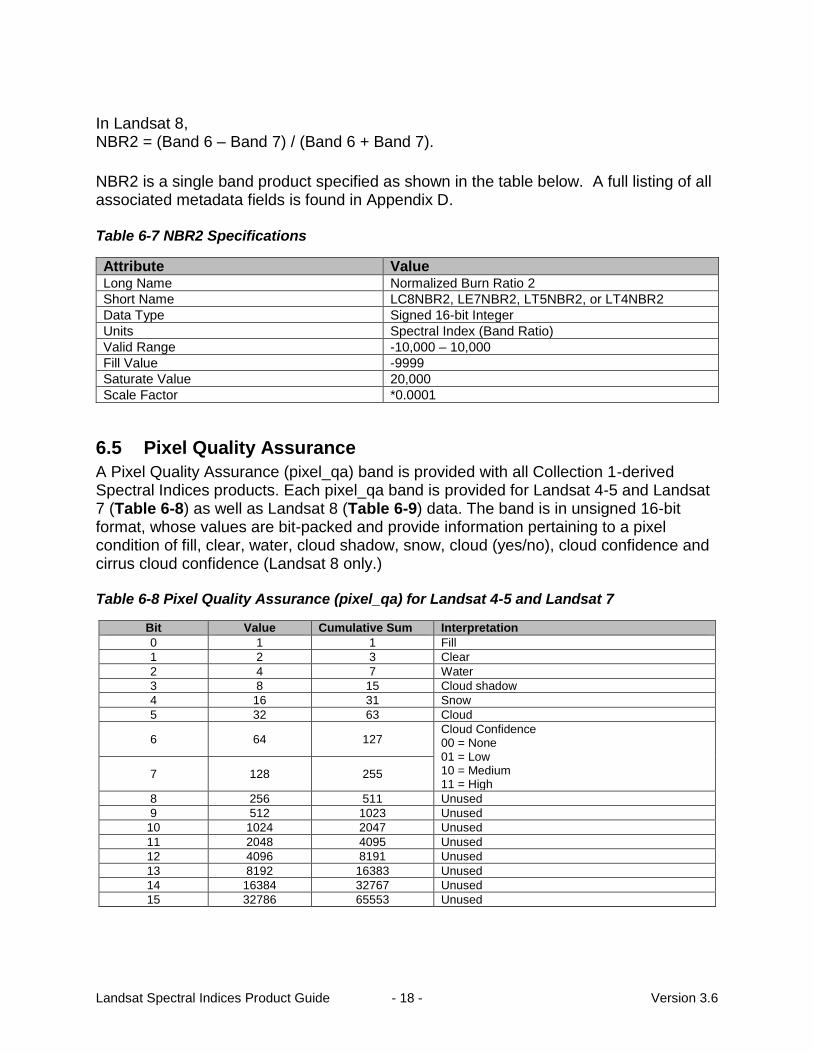
In Landsat 8, NBR2 = (Band 6 – Band 7) / (Band 6 + Band 7).
NBR2 is a single band product specified as shown in the table below. A full listing of all associated metadata fields is found in Appendix D. Table 6-7 NBR2 Specifications
Attribute Value Long Name Normalized Burn Ratio 2
Short Name LC8NBR2, LE7NBR2, LT5NBR2, or LT4NBR2
Data Type Signed 16-bit Integer
Units Spectral Index (Band Ratio)
Valid Range -10,000 – 10,000
Fill Value -9999
Saturate Value 20,000
Scale Factor *0.0001
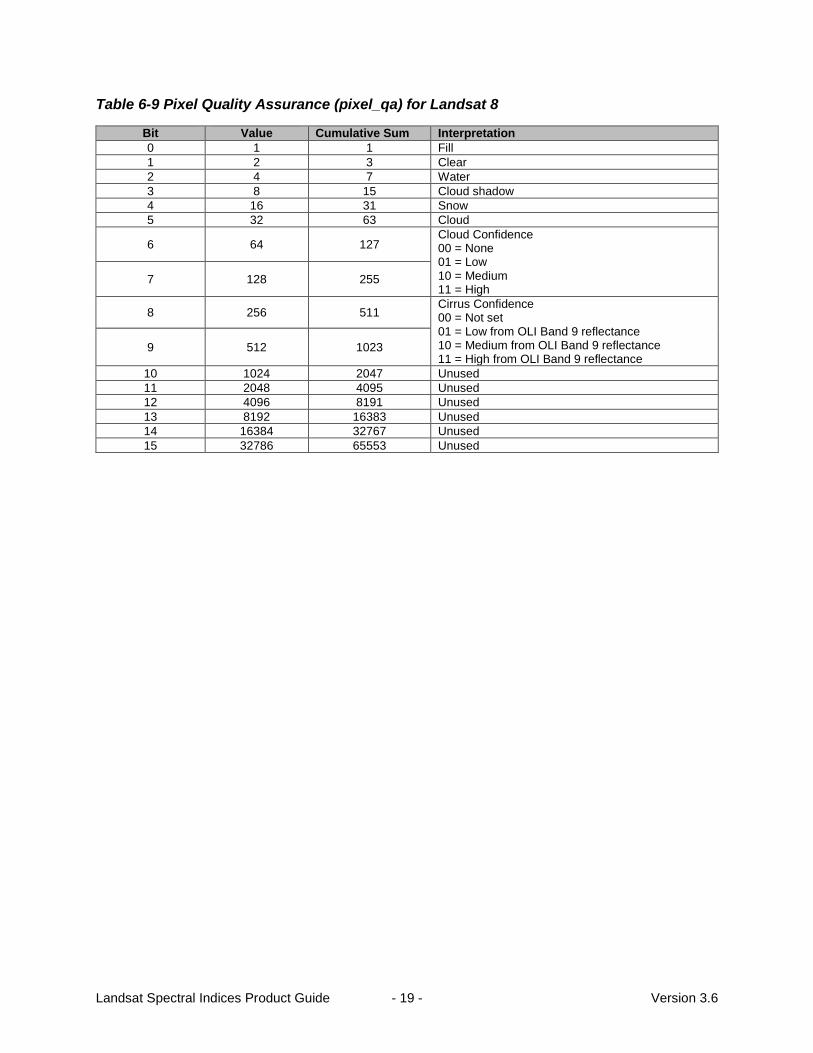
6.5 Pixel Quality Assurance
A Pixel Quality Assurance (pixel_qa) band is provided with all Collection 1-derived Spectral Indices products. Each pixel_qa band is provided for Landsat 4-5 and Landsat 7 (Table 6-8) as well as Landsat 8 (Table 6-9) data. The band is in unsigned 16-bit format, whose values are bit-packed and provide information pertaining to a pixel condition of fill, clear, water, cloud shadow, snow, cloud (yes/no), cloud confidence and cirrus cloud confidence (Landsat 8 only.) Table 6-8 Pixel Quality Assurance (pixel_qa) for Landsat 4-5 and Landsat 7
Bit Value Cumulative Sum Interpretation
0 1 1 Fill
1 2 3 Clear
2 4 7 Water
3 8 15 Cloud shadow
4 16 31 Snow
5 32 63 Cloud
6 64 127 Cloud Confidence 00 = None 01 = Low 10 = Medium 11 = High
7 128 255
8 256 511 Unused 9 512 1023 Unused
10 1024 2047 Unused
11 2048 4095 Unused
12 4096 8191 Unused
13 8192 16383 Unused
14 16384 32767 Unused
15 32786 65553 Unused
Landsat Spectral Indices Product Guide - 19 - Version 3.6
Table 6-9 Pixel Quality Assurance (pixel_qa) for Landsat 8
Bit Value Cumulative Sum Interpretation
0 1 1 Fill
1 2 3 Clear
2 4 7 Water
3 8 15 Cloud shadow
4 16 31 Snow
5 32 63 Cloud
6 64 127 Cloud Confidence 00 = None 01 = Low 10 = Medium 11 = High
7 128 255
8 256 511 Cirrus Confidence 00 = Not set 01 = Low from OLI Band 9 reflectance 10 = Medium from OLI Band 9 reflectance 11 = High from OLI Band 9 reflectance
9 512 1023
10 1024 2047 Unused
11 2048 4095 Unused
12 4096 8191 Unused
13 8192 16383 Unused
14 16384 32767 Unused
15 32786 65553 Unused
Landsat Spectral Indices Product Guide - 20 - Version 3.6
Section 7 Citation Information
There are no restrictions on the use of these high-level Landsat products. It is not a requirement of data use, but please include the following citation in publication or presentation materials based on these products to acknowledge the USGS as a data source, and to credit the original research. Landsat Spectral Indices products courtesy of the U.S. Geological Survey Earth Resources Observation and Science Center. For Landsat 4-5 TM or Landsat 7 ETM+: Masek, J.G., Vermote, E.F., Saleous, N., Wolfe, R., Hall, F.G., Huemmrich, F., Gao, F., Kutler, J., and Lim, T.K. (2006). A Landsat surface reflectance data set for North America, 1990-100, IEEE Geoscience and Remote Sensing Letters. 3:68-72. For Landsat 8 OLI/TIRS: Vermote, E., Justice, C., Claverie, M., & Franch, B. (2016). Preliminary analysis of the performance of the Landsat 8/OLI land surface reflectance product. Remote Sensing of Environment, 185, 46-56.
Reprints or citations of papers or oral presentations based on USGS data are welcome at the User Services addresses included in this guide. Such cooperation will help USGS stay informed of how the data are being used.
Landsat Spectral Indices Product Guide - 21 - Version 3.6
Section 8 Acknowledgments
The original LEDAPS software was developed by Eric Vermote, Nazmi Saleous, Jonathan Kutler, and Robert Wolfe with support from the NASA Terrestrial Ecology program (Principal Investigator: Jeff Masek). Subsequent versions were adapted by Dr. Feng Gao (GSFC/ERT Corp.) with support from the NASA Advancing Collaborative Connections for Earth System Science (ACCESS) and the USGS Landsat Programs.
The original Landsat 8 Surface Reflectance Code (LaSRC) algorithm was developed by Dr. Eric Vermote, NASA Goddard Space Flight Center (GSFC).

Landsat Spectral Indices Product Guide - 22 - Version 3.6
Section 9 User Services
Landsat high-level products and associated interfaces are supported by User Services staff at USGS EROS. Any questions or comments regarding data products or interfaces are welcomed through the Landsat “Contact Us” online correspondence form: https://landsat.usgs.gov/contact. E-mail can also be sent to the customer service address included below, with the same indication of topic. USGS User Services https://landsat.usgs.gov/contact [email protected] User support is available Monday through Friday from 8:00 a.m. – 4:00 p.m. Central Time. Inquiries received outside of these hours will be addressed during the next business day.
Landsat Spectral Indices Product Guide - 23 - Version 3.6
Section 10 References
Chander, G., Markham, B.L., and Helder, D.L. (2009). Summary of current radiometric calibration coefficients for Landsat MSS, TM, ETM+, and EO-1 ALI sensors. Remote Sensing of Environment 113:893-903.http://dx.doi.org/10.1016/j.rse.2009.01.007.
Claverie, M., Vermote, E. F., Franch, B., and Masek, J. G. (2015). Evaluation of the
Landsat-5 TM and Landsat-7 ETM+ surface reflectance products. Remote Sensing of Environment 169:390-403. http://dx.doi.org/10.1016/j.rse.2015.08.030.
Jones, J. W., Starbuck, M. J., and Jenkerson, C. B. (2013). Landsat surface reflectance
quality assurance extraction (version 1.7) (No. 11-C7). US Geological Survey. http://pubs.usgs.gov/tm/11/c07/pdf/tm11-c7.pdf.
Ju, J., Roy, D. P., Vermote, E., Masek, J., and Kovalskyy, V. (2012). Continental-scale
validation of MODIS-based and LEDAPS Landsat ETM+ atmospheric correction methods. Remote Sensing of Environment 122:175-184. http://dx.doi.org/10.1016/j.rse.2011.12.025.
Maiersperger, T., Scaramuzza, P., Leigh, L., Shrestha, S., Gallo, K., Jenkerson, C., and
Dwyer, J. (2013). Characterizing LEDAPS surface reflectance products by comparisons with AERONET, field spectrometer, and MODIS data. Remote Sensing of Environment 136:1-13. http://dx.doi.org/10.1016/j.rse.2013.04.007.
Masek, J.G., Huang, C., Wolfe, R., Cohen, W., Hall, F., Kutler, J., and Nelson, P.
(2008). North American forest disturbance mapped from a decadal Landsat record. Remote Sensing of Environment 112:2914-2926. http://dx.doi.org/10.1016/j.rse.2008.02.010.
Masek, J.G., Vermote, E.F., Saleous N.E., Wolfe, R., Hall, F.G., Huemmrich, K.F., Gao,
F., Kutler, J., and Lim, T-K. (2006). A Landsat surface reflectance dataset for North America, 1990–2000. IEEE Geoscience and Remote Sensing Letters 3(1):68-72. http://dx.doi.org/10.1109/LGRS.2005.857030.
Schmidt, G.L., Jenkerson, C.B., Masek, J., Vermote, E., and Gao, F. (2013). Landsat
ecosystem disturbance adaptive processing system (LEDAPS) algorithm description: U.S. Geological Survey Open-File Report 2013–1057, 17 p.
Vermote, E. F., and Kotchenova, S. (2008). Atmospheric correction for the monitoring of
land surfaces. Journal of Geophysical Research: Atmospheres (1984–2012) 113(D23). http://dx.doi.org/10.1029/2007JD009662.
Vermote, E.F., El Saleous, N., Justice, C.O., Kaufman, Y.J., Privette, J.L., Remer, L.,
Roger, J.C., and Tanre, D. (1997). Atmospheric correction of visible to middle-infrared EOS-MODIS data over land surfaces: Background, operational algorithm, and validation. Journal of Geophysical Research 102:17131-17141.
Landsat Spectral Indices Product Guide - 24 - Version 3.6
Vermote, E.F., Tanre, D., Deuze, J.L., Herman, M., and Morcrette, J.J. (1997). Second
simulation of the satellite signal in the solar spectrum, 6S: An overview. IEEE Transactions on Geoscience and Remote Sensing 35:675-686. http://dx.doi.org/10.1109/36.581987.
Vermote, E., Justice, C., Claverie, M., & Franch, B. (2016). Preliminary analysis of the
performance of the Landsat 8/OLI land surface reflectance product. Remote Sensing of Environment, 185, 46-56. http://dx.doi.org/10.1016/j.rse.2016.04.008.
Zhu, Z. and Woodcock, C. E. (2012). Object-based cloud and cloud shadow detection in Landsat imagery, Remote Sensing of Environment 118:83-94. http://dx.doi.org/10.1016/j.rse.2011.10.028.
Landsat Spectral Indices Product Guide - 25 - Version 3.6
Appendix A Default File Characteristics
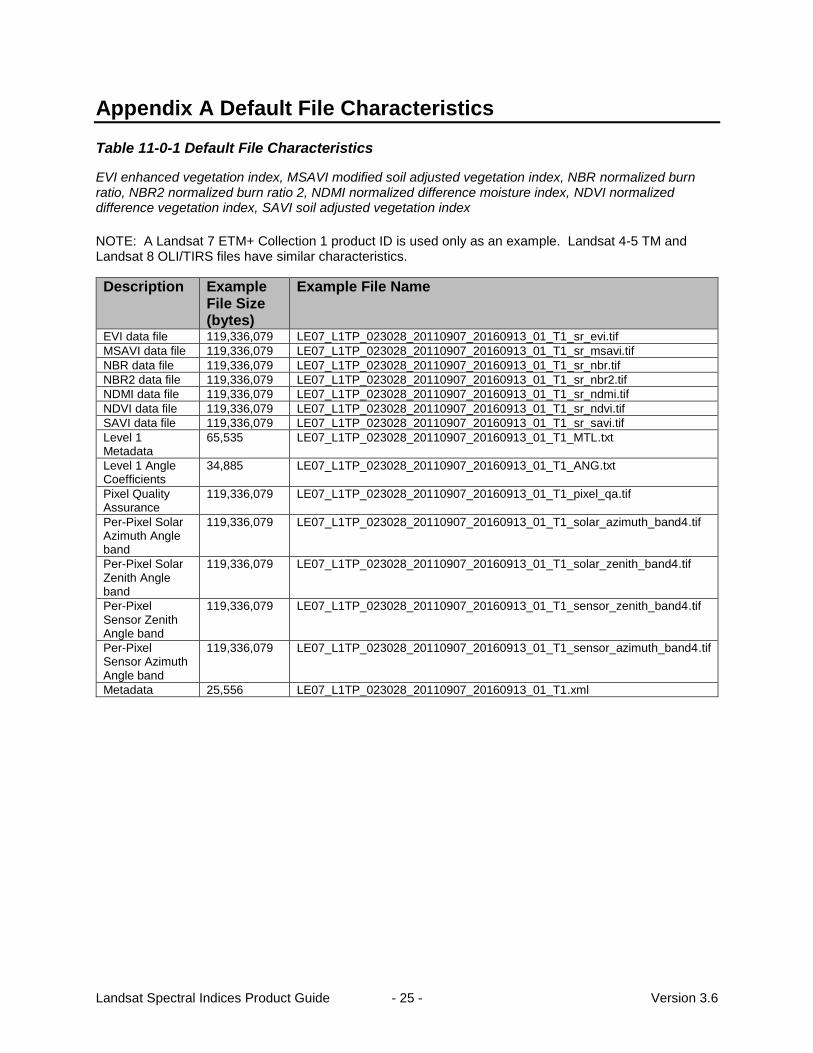
Table 11-0-1 Default File Characteristics
EVI enhanced vegetation index, MSAVI modified soil adjusted vegetation index, NBR normalized burn ratio, NBR2 normalized burn ratio 2, NDMI normalized difference moisture index, NDVI normalized difference vegetation index, SAVI soil adjusted vegetation index
NOTE: A Landsat 7 ETM+ Collection 1 product ID is used only as an example. Landsat 4-5 TM and Landsat 8 OLI/TIRS files have similar characteristics.
Description Example File Size (bytes)
Example File Name
EVI data file 119,336,079 LE07_L1TP_023028_20110907_20160913_01_T1_sr_evi.tif
MSAVI data file 119,336,079 LE07_L1TP_023028_20110907_20160913_01_T1_sr_msavi.tif
NBR data file 119,336,079 LE07_L1TP_023028_20110907_20160913_01_T1_sr_nbr.tif
NBR2 data file 119,336,079 LE07_L1TP_023028_20110907_20160913_01_T1_sr_nbr2.tif
NDMI data file 119,336,079 LE07_L1TP_023028_20110907_20160913_01_T1_sr_ndmi.tif
NDVI data file 119,336,079 LE07_L1TP_023028_20110907_20160913_01_T1_sr_ndvi.tif
SAVI data file 119,336,079 LE07_L1TP_023028_20110907_20160913_01_T1_sr_savi.tif
Level 1 Metadata
65,535 LE07_L1TP_023028_20110907_20160913_01_T1_MTL.txt
Level 1 Angle Coefficients
34,885 LE07_L1TP_023028_20110907_20160913_01_T1_ANG.txt
Pixel Quality Assurance
119,336,079 LE07_L1TP_023028_20110907_20160913_01_T1_pixel_qa.tif
Per-Pixel Solar Azimuth Angle band
119,336,079 LE07_L1TP_023028_20110907_20160913_01_T1_solar_azimuth_band4.tif
Per-Pixel Solar Zenith Angle band
119,336,079 LE07_L1TP_023028_20110907_20160913_01_T1_solar_zenith_band4.tif
Per-Pixel Sensor Zenith Angle band
119,336,079 LE07_L1TP_023028_20110907_20160913_01_T1_sensor_zenith_band4.tif
Per-Pixel Sensor Azimuth Angle band
119,336,079 LE07_L1TP_023028_20110907_20160913_01_T1_sensor_azimuth_band4.tif
Metadata 25,556 LE07_L1TP_023028_20110907_20160913_01_T1.xml
Landsat Spectral Indices Product Guide - 26 - Version 3.6
Appendix B HDF File Characteristics
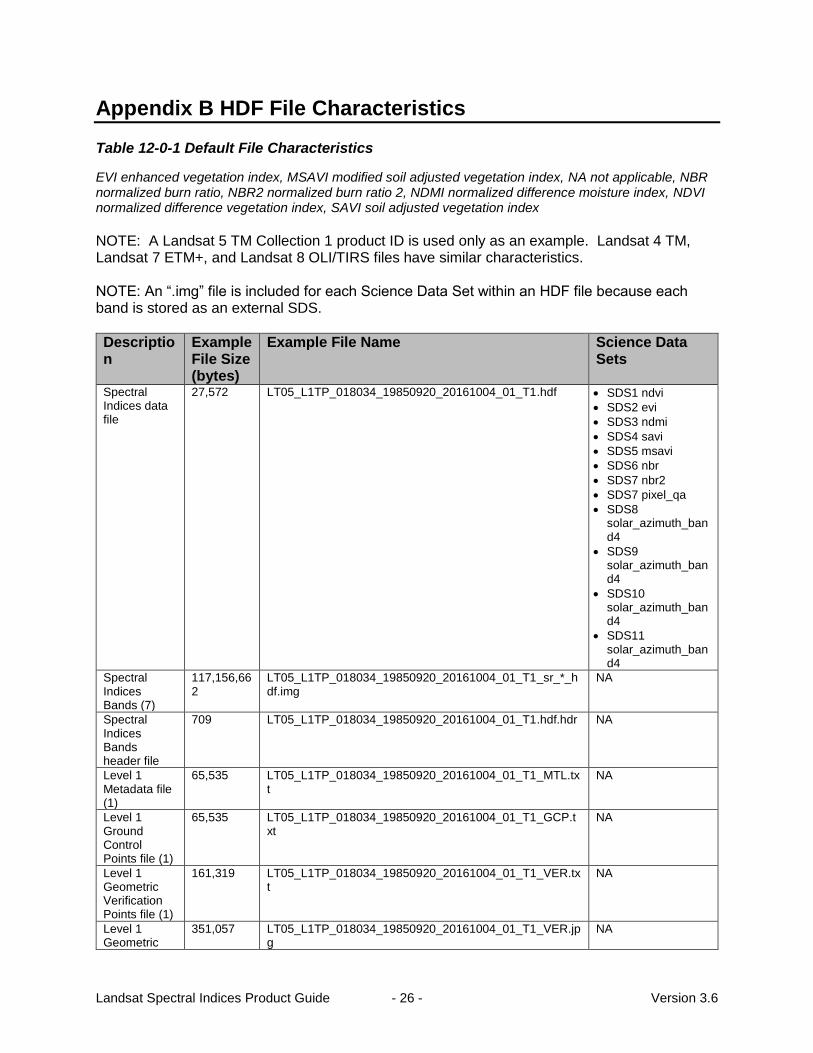
Table 12-0-1 Default File Characteristics
EVI enhanced vegetation index, MSAVI modified soil adjusted vegetation index, NA not applicable, NBR normalized burn ratio, NBR2 normalized burn ratio 2, NDMI normalized difference moisture index, NDVI normalized difference vegetation index, SAVI soil adjusted vegetation index
NOTE: A Landsat 5 TM Collection 1 product ID is used only as an example. Landsat 4 TM, Landsat 7 ETM+, and Landsat 8 OLI/TIRS files have similar characteristics. NOTE: An “.img” file is included for each Science Data Set within an HDF file because each band is stored as an external SDS.
Description
Example File Size (bytes)
Example File Name Science Data Sets
Spectral Indices data file
27,572 LT05_L1TP_018034_19850920_20161004_01_T1.hdf SDS1 ndvi
SDS2 evi
SDS3 ndmi
SDS4 savi
SDS5 msavi
SDS6 nbr
SDS7 nbr2
SDS7 pixel_qa
SDS8 solar_azimuth_band4
SDS9 solar_azimuth_band4
SDS10 solar_azimuth_band4
SDS11 solar_azimuth_band4
Spectral Indices Bands (7)
117,156,662
LT05_L1TP_018034_19850920_20161004_01_T1_sr_*_hdf.img
NA
Spectral Indices Bands header file
709 LT05_L1TP_018034_19850920_20161004_01_T1.hdf.hdr NA
Level 1 Metadata file (1)
65,535 LT05_L1TP_018034_19850920_20161004_01_T1_MTL.txt
NA
Level 1 Ground Control Points file (1)
65,535 LT05_L1TP_018034_19850920_20161004_01_T1_GCP.txt
NA
Level 1 Geometric Verification Points file (1)
161,319 LT05_L1TP_018034_19850920_20161004_01_T1_VER.txt
NA
Level 1 Geometric
351,057 LT05_L1TP_018034_19850920_20161004_01_T1_VER.jpg
NA
Landsat Spectral Indices Product Guide - 27 - Version 3.6
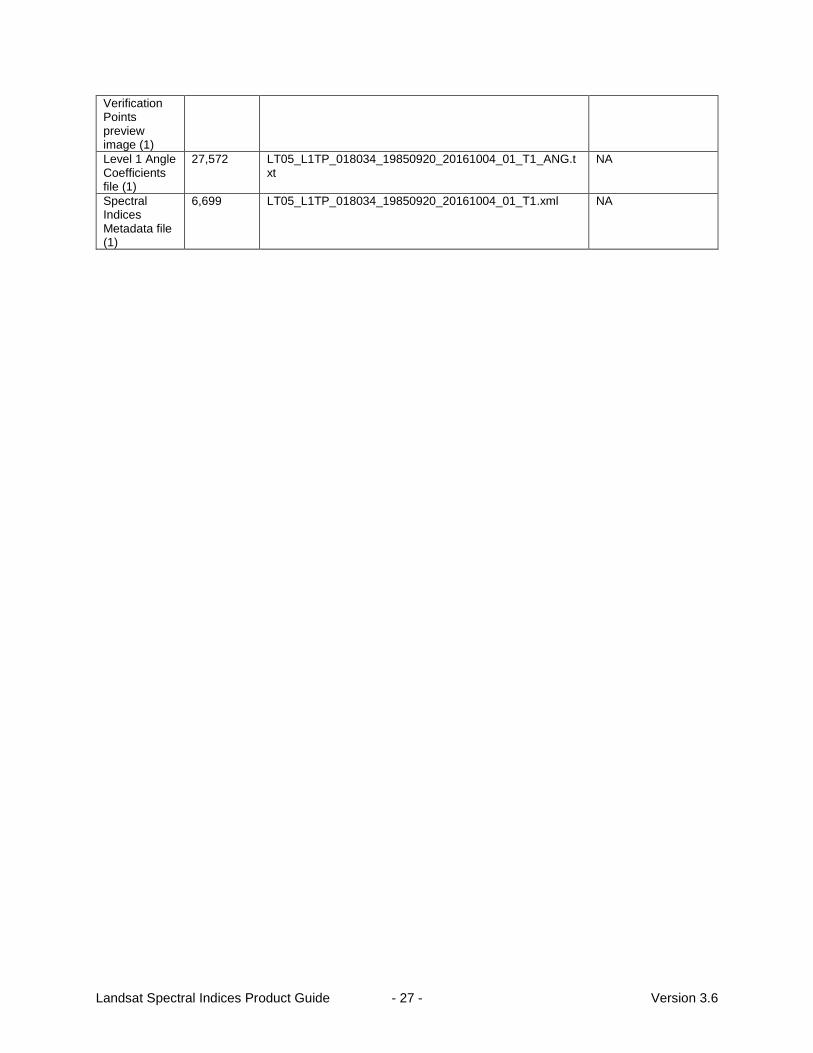
Verification Points preview image (1)
Level 1 Angle Coefficients file (1)
27,572 LT05_L1TP_018034_19850920_20161004_01_T1_ANG.txt
NA
Spectral Indices Metadata file (1)
6,699 LT05_L1TP_018034_19850920_20161004_01_T1.xml NA
Landsat Spectral Indices Product Guide - 28 - Version 3.6
Appendix C Binary File Characteristics
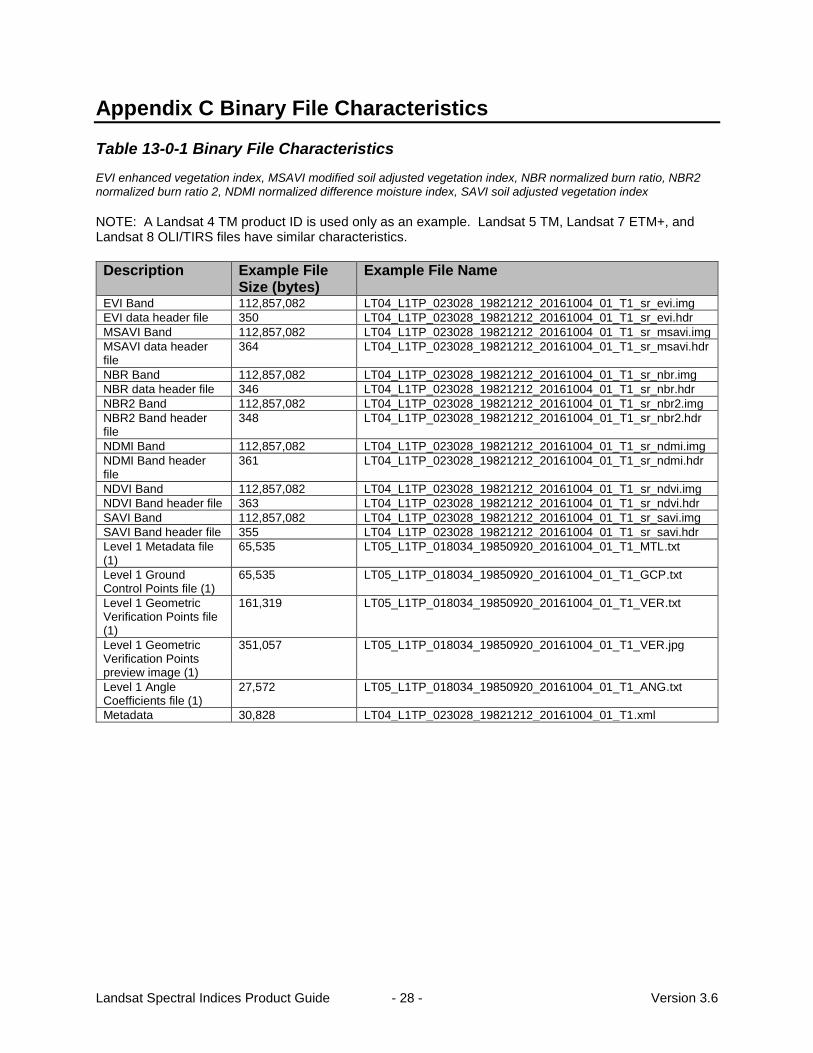
Table 13-0-1 Binary File Characteristics
EVI enhanced vegetation index, MSAVI modified soil adjusted vegetation index, NBR normalized burn ratio, NBR2 normalized burn ratio 2, NDMI normalized difference moisture index, SAVI soil adjusted vegetation index
NOTE: A Landsat 4 TM product ID is used only as an example. Landsat 5 TM, Landsat 7 ETM+, and Landsat 8 OLI/TIRS files have similar characteristics.
Description Example File Size (bytes)
Example File Name
EVI Band 112,857,082 LT04_L1TP_023028_19821212_20161004_01_T1_sr_evi.img
EVI data header file 350 LT04_L1TP_023028_19821212_20161004_01_T1_sr_evi.hdr
MSAVI Band 112,857,082 LT04_L1TP_023028_19821212_20161004_01_T1_sr_msavi.img
MSAVI data header file
364 LT04_L1TP_023028_19821212_20161004_01_T1_sr_msavi.hdr
NBR Band 112,857,082 LT04_L1TP_023028_19821212_20161004_01_T1_sr_nbr.img
NBR data header file 346 LT04_L1TP_023028_19821212_20161004_01_T1_sr_nbr.hdr
NBR2 Band 112,857,082 LT04_L1TP_023028_19821212_20161004_01_T1_sr_nbr2.img
NBR2 Band header file
348 LT04_L1TP_023028_19821212_20161004_01_T1_sr_nbr2.hdr
NDMI Band 112,857,082 LT04_L1TP_023028_19821212_20161004_01_T1_sr_ndmi.img
NDMI Band header file
361 LT04_L1TP_023028_19821212_20161004_01_T1_sr_ndmi.hdr
NDVI Band 112,857,082 LT04_L1TP_023028_19821212_20161004_01_T1_sr_ndvi.img
NDVI Band header file 363 LT04_L1TP_023028_19821212_20161004_01_T1_sr_ndvi.hdr
SAVI Band 112,857,082 LT04_L1TP_023028_19821212_20161004_01_T1_sr_savi.img
SAVI Band header file 355 LT04_L1TP_023028_19821212_20161004_01_T1_sr_savi.hdr
Level 1 Metadata file (1)
65,535 LT05_L1TP_018034_19850920_20161004_01_T1_MTL.txt
Level 1 Ground Control Points file (1)
65,535 LT05_L1TP_018034_19850920_20161004_01_T1_GCP.txt
Level 1 Geometric Verification Points file (1)
161,319 LT05_L1TP_018034_19850920_20161004_01_T1_VER.txt
Level 1 Geometric Verification Points preview image (1)
351,057 LT05_L1TP_018034_19850920_20161004_01_T1_VER.jpg
Level 1 Angle Coefficients file (1)
27,572 LT05_L1TP_018034_19850920_20161004_01_T1_ANG.txt
Metadata 30,828 LT04_L1TP_023028_19821212_20161004_01_T1.xml
Landsat Spectral Indices Product Guide - 29 - Version 3.6
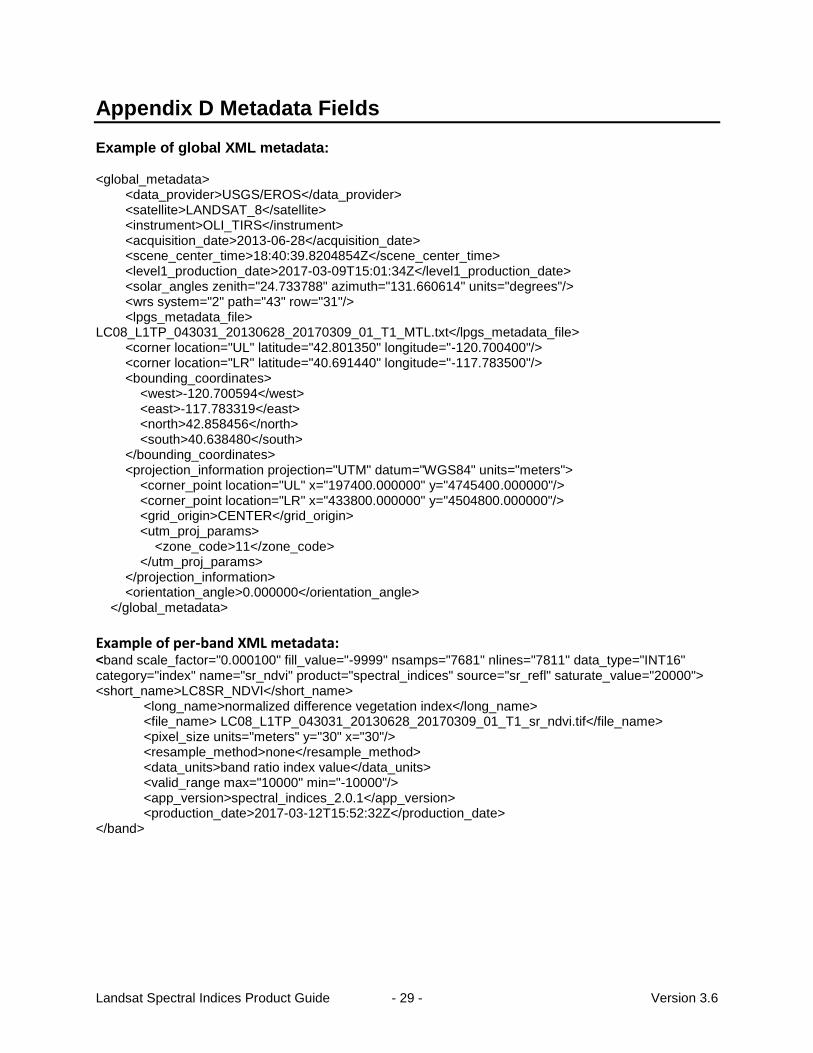
Appendix D Metadata Fields
Example of global XML metadata: <global_metadata> <data_provider>USGS/EROS</data_provider> <satellite>LANDSAT_8</satellite> <instrument>OLI_TIRS</instrument> <acquisition_date>2013-06-28</acquisition_date> <scene_center_time>18:40:39.8204854Z</scene_center_time> <level1_production_date>2017-03-09T15:01:34Z</level1_production_date> <solar_angles zenith="24.733788" azimuth="131.660614" units="degrees"/> <wrs system="2" path="43" row="31"/> <lpgs_metadata_file> LC08_L1TP_043031_20130628_20170309_01_T1_MTL.txt</lpgs_metadata_file> <corner location="UL" latitude="42.801350" longitude="-120.700400"/> <corner location="LR" latitude="40.691440" longitude="-117.783500"/> <bounding_coordinates> <west>-120.700594</west> <east>-117.783319</east> <north>42.858456</north> <south>40.638480</south> </bounding_coordinates> <projection_information projection="UTM" datum="WGS84" units="meters"> <corner_point location="UL" x="197400.000000" y="4745400.000000"/> <corner_point location="LR" x="433800.000000" y="4504800.000000"/> <grid_origin>CENTER</grid_origin> <utm_proj_params> <zone_code>11</zone_code> </utm_proj_params> </projection_information> <orientation_angle>0.000000</orientation_angle> </global_metadata>
Example of per-band XML metadata: <band scale_factor="0.000100" fill_value="-9999" nsamps="7681" nlines="7811" data_type="INT16" category="index" name="sr_ndvi" product="spectral_indices" source="sr_refl" saturate_value="20000"> <short_name>LC8SR_NDVI</short_name>
<long_name>normalized difference vegetation index</long_name> <file_name> LC08_L1TP_043031_20130628_20170309_01_T1_sr_ndvi.tif</file_name> <pixel_size units="meters" y="30" x="30"/> <resample_method>none</resample_method> <data_units>band ratio index value</data_units> <valid_range max="10000" min="-10000"/> <app_version>spectral_indices_2.0.1</app_version> <production_date>2017-03-12T15:52:32Z</production_date>
</band>
Landsat Spectral Indices Product Guide - 30 - Version 3.6
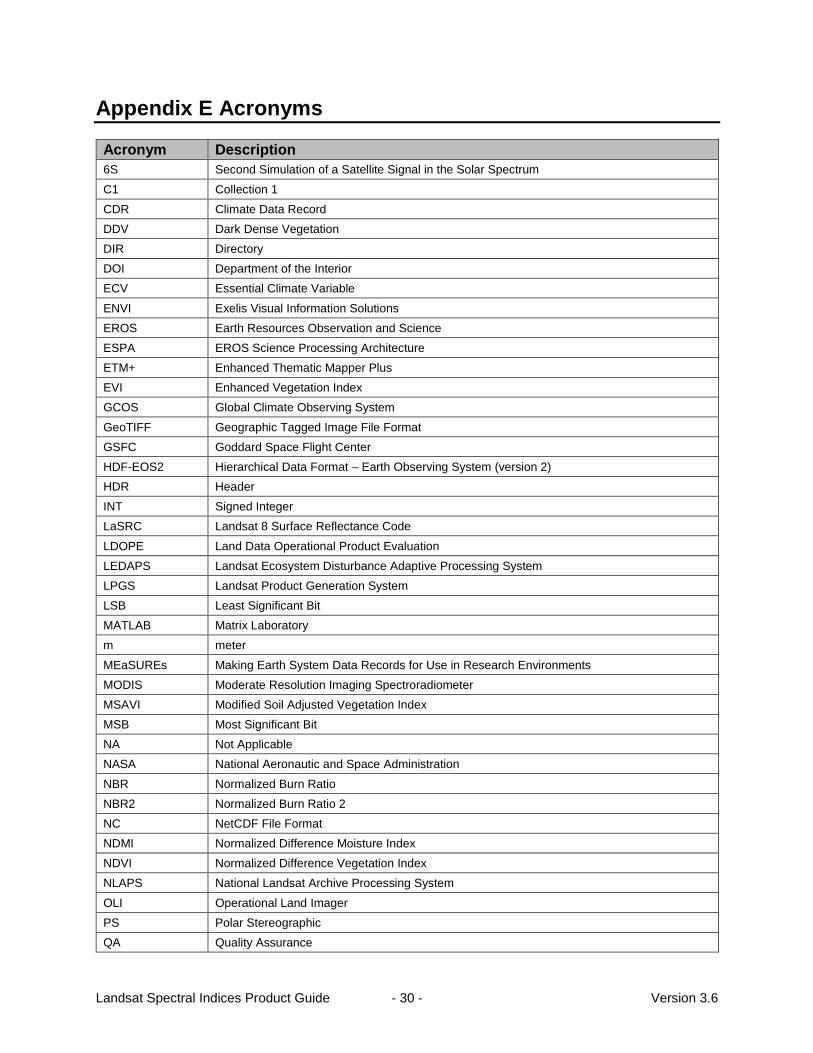
Appendix E Acronyms
Acronym Description
6S Second Simulation of a Satellite Signal in the Solar Spectrum
C1 Collection 1
CDR Climate Data Record
DDV Dark Dense Vegetation
DIR Directory
DOI Department of the Interior
ECV Essential Climate Variable
ENVI Exelis Visual Information Solutions
EROS Earth Resources Observation and Science
ESPA EROS Science Processing Architecture
ETM+ Enhanced Thematic Mapper Plus
EVI Enhanced Vegetation Index
GCOS Global Climate Observing System
GeoTIFF Geographic Tagged Image File Format
GSFC Goddard Space Flight Center
HDF-EOS2 Hierarchical Data Format – Earth Observing System (version 2)
HDR Header
INT Signed Integer
LaSRC Landsat 8 Surface Reflectance Code
LDOPE Land Data Operational Product Evaluation
LEDAPS Landsat Ecosystem Disturbance Adaptive Processing System
LPGS Landsat Product Generation System
LSB Least Significant Bit
MATLAB Matrix Laboratory
m meter
MEaSUREs Making Earth System Data Records for Use in Research Environments
MODIS Moderate Resolution Imaging Spectroradiometer
MSAVI Modified Soil Adjusted Vegetation Index
MSB Most Significant Bit
NA Not Applicable
NASA National Aeronautic and Space Administration
NBR Normalized Burn Ratio
NBR2 Normalized Burn Ratio 2
NC NetCDF File Format
NDMI Normalized Difference Moisture Index
NDVI Normalized Difference Vegetation Index
NLAPS National Landsat Archive Processing System
OLI Operational Land Imager
PS Polar Stereographic
QA Quality Assurance
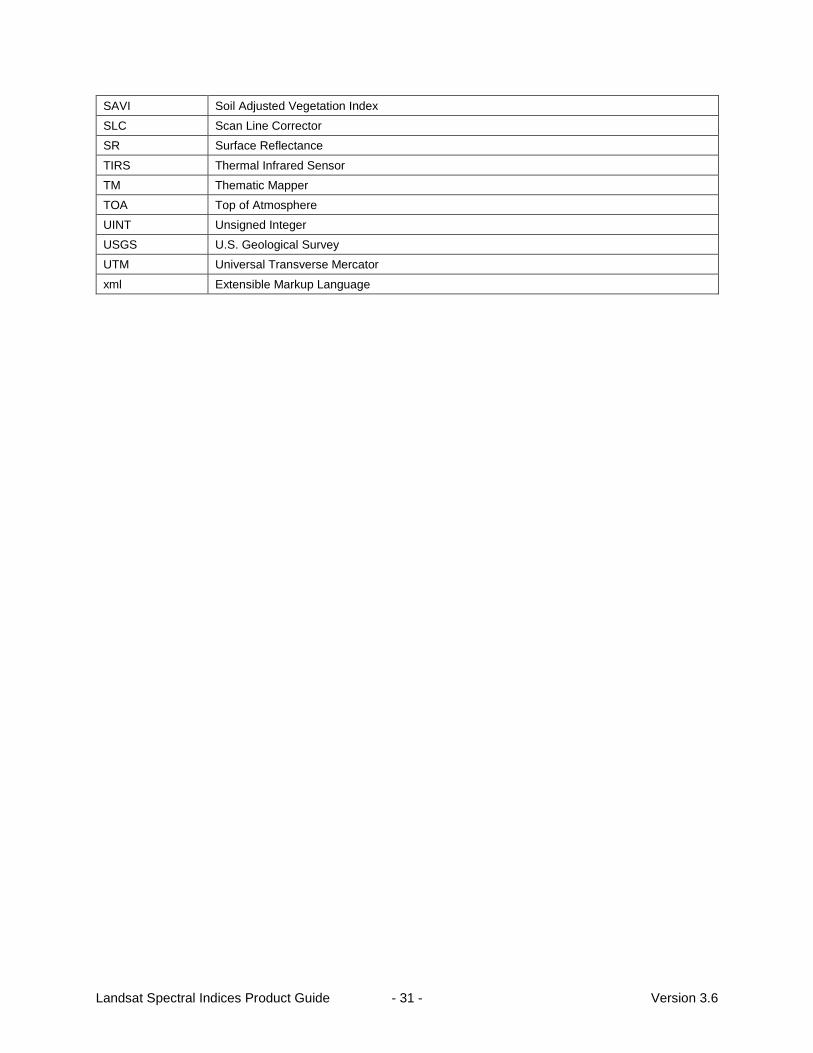
Landsat Spectral Indices Product Guide - 31 - Version 3.6
SAVI Soil Adjusted Vegetation Index
SLC Scan Line Corrector
SR Surface Reflectance
TIRS Thermal Infrared Sensor
TM Thematic Mapper
TOA Top of Atmosphere
UINT Unsigned Integer
USGS U.S. Geological Survey
UTM Universal Transverse Mercator
xml Extensible Markup Language


![Original Research Assessing Spectral Indices for Detecting ... Spectral...Landsat-7, Landsat-8, MERIS/OLCI, MODIS and Sentinel-2 satellites [22]. Satellite data are defined by spatial,](https://img.pdfslide.net/doc/110x75/606bd980c33c710a7661828a/original-research-assessing-spectral-indices-for-detecting-spectral-landsat-7.jpg)


![Vegetation Indices NDVI (Normalized Difference Vegetation Index) NDVI = [ρ NIR -ρ red ] / [ρ NIR +ρ red ], where ρ NIR/red is the measured reflectance](https://img.pdfslide.net/doc/110x75/5514ada4550346ea6e8b5fc3/vegetation-indices-ndvi-normalized-difference-vegetation-index-ndvi-nir-red-nir-red-where-nirred-is-the-measured-reflectance.jpg)