Embed Size (px)
Citation preview
NHESSD1, 73–109, 2013
Landslidesusceptibility
mapping in Creteisland
M. Kouli et al.
Title Page
Abstract Introduction
Conclusions References
Tables Figures
J I
J I
Back Close
Full Screen / Esc
Printer-friendly Version
Interactive Discussion
Discussion
Paper
|D
iscussionP
aper|
Discussion
Paper
|D
iscussionP
aper|
Nat. Hazards Earth Syst. Sci. Discuss., 1, 73–109, 2013www.nat-hazards-earth-syst-sci-discuss.net/1/73/2013/doi:10.5194/nhessd-1-73-2013© Author(s) 2013. CC Attribution 3.0 License.
EGU Journal Logos (RGB)
Advances in Geosciences
Open A
ccess
Natural Hazards and Earth System
Sciences
Open A
ccess
Annales Geophysicae
Open A
ccess
Nonlinear Processes in Geophysics
Open A
ccess
Atmospheric Chemistry
and Physics
Open A
ccess
Atmospheric Chemistry
and Physics
Open A
ccess
Discussions
Atmospheric Measurement
Techniques
Open A
ccess
Atmospheric Measurement
Techniques
Open A
ccess
Discussions
Biogeosciences
Open A
ccess
Open A
ccessBiogeosciences
Discussions
Climate of the Past
Open A
ccess
Open A
ccess
Climate of the Past
Discussions
Earth System Dynamics
Open A
ccess
Open A
ccess
Earth System Dynamics
Discussions
GeoscientificInstrumentation
Methods andData Systems
Open A
ccess
GeoscientificInstrumentation
Methods andData Systems
Open A
ccess
Discussions
GeoscientificModel Development
Open A
ccess
Open A
ccess
GeoscientificModel Development
Discussions
Hydrology and Earth System
Sciences
Open A
ccess
Hydrology and Earth System
Sciences
Open A
ccess
Discussions
Ocean Science
Open A
ccess
Open A
ccess
Ocean ScienceDiscussions
Solid Earth
Open A
ccess
Open A
ccess
Solid EarthDiscussions
The Cryosphere
Open A
ccess
Open A
ccess
The CryosphereDiscussions
Natural Hazards and Earth System
Sciences
Open A
ccess
Discussions
This discussion paper is/has been under review for the journal Natural Hazards and EarthSystem Sciences (NHESS). Please refer to the corresponding final paper in NHESS if available.
Comparing multi-criteria methods forlandslide susceptibility mapping inChania Prefecture, Crete Island, GreeceM. Kouli1, C. Loupasakis2, P. Soupios1, D. Rozos2, and F. Vallianatos1
1Laboratory of Geophysics and Seismology, Department of Natural Resources andEnvironment, Technological Educational Institute of Crete, Chania, Crete, Greece2Laboratory of Engineering Geology and Hydrogeology, Department of Geological Sciences,School of Mining and Metallurgical Engineering, National Technical University of Athens,Zografou Campus, Greece
Received: 8 January 2013 – Accepted: 16 January 2013 – Published: 29 January 2013
Correspondence to: M. Kouli ([email protected])
Published by Copernicus Publications on behalf of the European Geosciences Union.
73
NHESSD1, 73–109, 2013
Landslidesusceptibility
mapping in Creteisland
M. Kouli et al.
Title Page
Abstract Introduction
Conclusions References
Tables Figures
J I
J I
Back Close
Full Screen / Esc
Printer-friendly Version
Interactive Discussion
Discussion
Paper
|D
iscussionP
aper|
Discussion
Paper
|D
iscussionP
aper|
Abstract
In this work, two multi-criteria methods, an expert-based, semi-quantitative, relativeweighting – rating approach, the weighted linear combination (WLC) and a quantitative,statistical method, the weights of evidence (WoE) approach were applied for landslidesusceptibility zonation mapping in the Chania Prefecture of Crete Island, Greece. Sev-5
eral thematic maps representing various landslide casual factors, such as geologicalformations, faults proximity, elevation, slope gradient, aspect and curvature, rivers prox-imity, precipitation, roads proximity and land use types; have been generated in a GISenvironment. Two landslide susceptibility maps were created; one for each method.The maps were compared and validated using the success rate curve (SRC) analy-10
sis. The resulting landslide susceptibility maps have uncertainties introduced due tothe subjective knowledge of experts in the case of WLC method and to the quality ofthe recorded landslides sample in the case of the WoE method. Both approaches pro-duced almost equally accurate maps with the WoE method to produce slightly superiorpredictions.15
1 Introduction
Landslides are the most commonly occurring geological hazards worldwide and thesecond most frequent natural catastrophic events, after hydro-meteorological events.Landslides are considered to be one of the most catastrophic natural hazards due tothe fact that they cause extensive damages to constructions and infrastructures as well20
as thousand casualties annually (Saha et al., 2002; Akgun and Turk, 2007).Landslide hazard assessment and risk reduction can be accomplished by providing
the risk managers with easy accessible, continuous, and accurate information aboutthe landslide susceptibility. Thus, an accurate susceptibility mapping can be the keyinformation for a large variety of users from both private and public sectors, from25
74
NHESSD1, 73–109, 2013
Landslidesusceptibility
mapping in Creteisland
M. Kouli et al.
Title Page
Abstract Introduction
Conclusions References
Tables Figures
J I
J I
Back Close
Full Screen / Esc
Printer-friendly Version
Interactive Discussion
Discussion
Paper
|D
iscussionP
aper|
Discussion
Paper
|D
iscussionP
aper|
governmental departments and the scientific community and from local to internationallevels.
A landslide susceptibility map depicts areas likely to have landslides in the futureby correlating some of the principal factors that contribute to landslides with the pastdistribution of slope failures (Brabb, 1984; Fall et al., 2006). Crucial factors for the5
construction of reliable susceptibility maps are the quality and the amount of avail-able data and the selection of the best methodology analysis. The process of creat-ing these maps involves different approaches and methods distinguished as: qualita-tive, semi-quantitative and quantitative (Lee and Jones, 2004; Castellanos Abella andvan Westen, 2008). Quantitative methods are based on mathematical expressions of10
the correlation between controlling factors and landslides. The two types of commonlyused quantitative methods are the deterministic and the statistical (Ward et al., 1981;Nash, 1987; Terlien et al., 1995; Kramer, 1996; Atkinson and Massari, 1998; Aleottiand Chowdhury, 1999; Fall and Azzam, 2001a, b; Akgun and Bulut, 2007).The statisti-cal approach uses statistical and probabilistic methods. According to these methodolo-15
gies the previous landslides can be related to measurable elements of the landscape(Koukis and Ziourkas, 1991; Dai et al., 2002; Ohlmacher and Davis, 2003; Akgun andBulut, 2007) and these elements can be used to predict possible future landslides.Typical multivariate statistical approaches used to map landslide susceptibility are theweight of evidence (WoE) modeling method, a quantitative “data-driven” method used20
to combine datasets (Lee et al., 2002; van Westen and Lulie, 2003; Lee et al., 2004a;Thiery et al., 2007; Mathew et al.,. 2007; Neuhauser and Terhorst, 2007; Poli and Ster-lacchini, 2007; Rezaei Moghaddam et al., 2007; Dahal et al., 2008a, b; Sharma andKumar, 2008; Barbieri and Cambuli, 2009; Ghosh et al., 2009; Regmi et al., 2010) andthe logistic regression method (Wieczorek, 1996; Atkinson and Massari, 1998; Guzzetti25
et al., 1999; Gorsevski et al., 2000; Lee and Min, 2001; Dai et al., 2001; Dai and Lee,2002; Ohlmacher and Davis, 2003; Ayalew and Yamagishi, 2005).
Qualitative methods are based on expert opinions (Nash, 1987; Anbalagan, 1992;Fall et al., 1996; Evans et al., 1997; Leroi, 1997; Atkinson and Massari, 1998; Guzzetti
75
NHESSD1, 73–109, 2013
Landslidesusceptibility
mapping in Creteisland
M. Kouli et al.
Title Page
Abstract Introduction
Conclusions References
Tables Figures
J I
J I
Back Close
Full Screen / Esc
Printer-friendly Version
Interactive Discussion
Discussion
Paper
|D
iscussionP
aper|
Discussion
Paper
|D
iscussionP
aper|
et al., 1999; Fall et al., 2006). The basic types of qualitative methods simply use land-slide index to identify areas with alike geological and geomorphologic characteristicsthat are susceptible to landslides. However, there are qualitative methodologies whichuse weighting and rating and are regarded to be semi quantitative (Hutchinson andChandler, 1991; Siddle et al., 1991; Moon et al., 1992; Fell et al., 1996; Ayalew and5
Yamagishi, 2005, Kouli et al., 2010). Such kinds of methodologies are the analytic hi-erarchy process (AHP) by Saaty, 1980; Barredo et al., 2000; Yalcin, 2008; Mondal andMaiti, 2012 and the weighted linear combination (WLC) (Ayalew et al., 2004a, b; Ayalewet al., 2005; Kouli et al., 2010).
Furthermore, during the last decades, many studies (such as van Westen, 1994;10
Carrara et al., 1995; Aleotti and Chowdhury, 1999; Dai et al., 2002; Cevik and Topal,2003; Ayalew and Yamagishi, 2005; Fall et al., 2006; Carrara and Guzzetti, 1995; Car-rara et al., 1995; Dikau et al., 1996; Luzi et al., 2000; Miles and Ho, 1999; Miles andKeefer, 1999; Carrara et al., 1999; Fall, 2000; Refice and Capolongo, 2002; Fall et al.,2006; Kouli et al., 2010; Arnous, 2011) have been carried out to overview the use of15
GIS for landslide susceptibility assessment.In a geologically active country like Greece the intensive tectonic activity is not re-
lated only to earthquake events but also to other natural hazards. Active tectonics gen-erates steep morphological structures, strained geological formations and intensiveweathering procedures which are considered to be the main causal factors of landslide20
events.Crete Island is located in the southern part of the Hellenic fore-arc, an area of impor-
tant tectonic deformation and high seismic activity. This high seismic activity is causedby the subduction of the oceanic African lithosphere beneath the continental Anatolian–Aegean lithosphere (Papazachos and Comninakis, 1971; McKenzie, 1972; Angelier,25
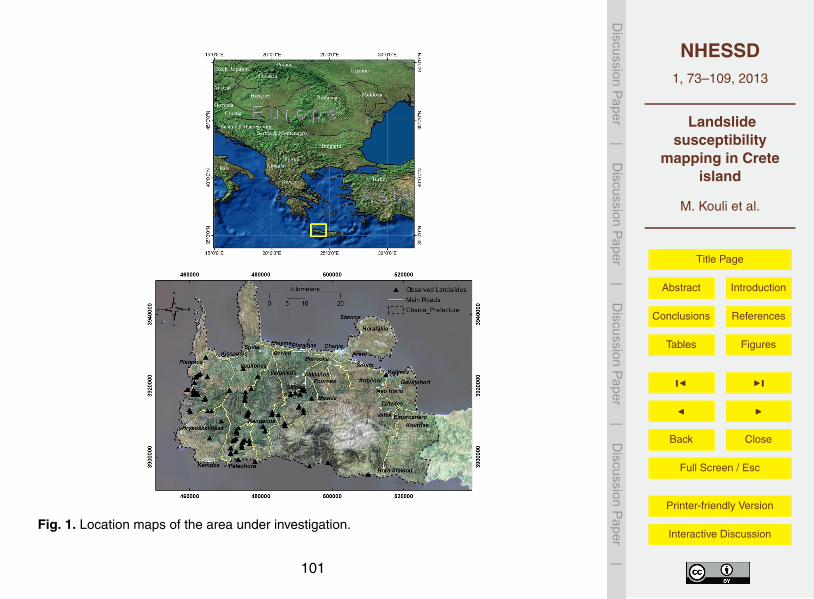
1979; Makropoulos and Burton, 1984).Chania Prefecture, located at the western part of the Island (Fig. 1), suffers from
severe landslide phenomena. The lack of a landslide susceptibility mapping in the ap-proximately 2330 km2 study area makes the risk management impossible for the local
76
NHESSD1, 73–109, 2013
Landslidesusceptibility
mapping in Creteisland
M. Kouli et al.
Title Page
Abstract Introduction
Conclusions References
Tables Figures
J I
J I
Back Close
Full Screen / Esc
Printer-friendly Version
Interactive Discussion
Discussion
Paper
|D
iscussionP
aper|
Discussion
Paper
|D
iscussionP
aper|
authorities. The landslide susceptibility analysis introduced in this study covers the en-tire Chania Prefecture and it is conducted by the application of the Weight of Evidence(WoE) statistical modeling method and the Weighted Linear Combination (WLC) semiquantitative approach. Besides the obvious benefit of providing landslide susceptibilitymaps, the study compares the efficiency of the applied methods.5
2 Geological framework of Chania prefecture
Crete Island is characterized by an extremely complicated geological structure withintensive tectonic fragmentation. Although many researchers through the years havestudied the geological evolution of the island (Tataris and Christodoulou, 1965; Bon-neau, 1973; Creutzburg, 1977; Fitrolakis, 1980; Tsiampaos, 1989), there are still many10
unsolved issues. Based on current theories, the island constitutes of repeated tectoniccovers consisting of variant geotectonic zones’ geological series.
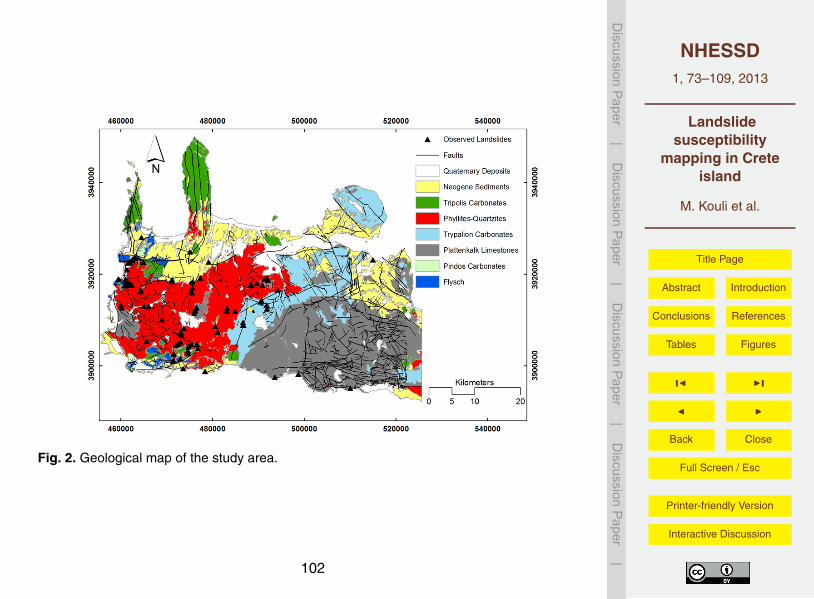
Considering the surficial geology of Chania prefecture (Fig. 2), Quaternary depositsforming depositional plains dominate especially at the northern part of the study area,as well as along the coast line. Miocene to Pliocene sediments crop out in the central15
and the northwestern part of the study area and carbonates of the Tripolis nappe in thenortheastern part. Dissected hills of phyllites and quartzites, a late Carboniferous tolate Triassic package of sedimentary rocks composed mostly of quartz-rich siliciclasticsediments, with minor limestone, gypsum, and volcanic rocks (Krahl et al., 1983) coverthe central part of the study area. Carbonates of the Trypalion nappe are exposed in the20
central-eastern part of the Chania Prefecture, extending from the north to the south,with a NE–SW direction. Limestones of the Plattenkalk zone are mainly exposed tothe most southeastern part of the study area. The tectonic regime of the study area ischaracterized by faults in NW–SE and E–W directions.
77
NHESSD1, 73–109, 2013
Landslidesusceptibility
mapping in Creteisland
M. Kouli et al.
Title Page
Abstract Introduction
Conclusions References
Tables Figures
J I
J I
Back Close
Full Screen / Esc
Printer-friendly Version
Interactive Discussion
Discussion
Paper
|D
iscussionP
aper|
Discussion
Paper
|D
iscussionP
aper|
3 Data layers-landslides casual factors
Geological, topographical, land use and precipitation data were collected and intro-duced in a Geographic Information System (GIS). By processing the primary data lay-ers the following landslide casual factors were selected and prepared as secondarydata layers: unified lithology, faults proximity, elevation, slope gradient, aspect and cur-5
vature, roads and rivers proximity, precipitation, and land use types.The geological maps of the Institute of Geology and Mineral Exploration (IGME)
presenting lithological and structural units, at a scale of 1 : 50 000 were digitized. TheDigital Elevation Model, with a cell size of 20 m, was generated from the topographicmaps of the Hellenic Military Geographical Service, at a scale of 1 : 50 000. Many10
terrain attributes such as slope angle, aspect, curvature and stream network werecomputed using the digital elevation model. Furthermore, the Corine Land Cover map2000 (CLC2000 100 m, version 1) of the European Environment Agency (EEA, Copen-hagen, 2000; http://www.eea.europa.eu) was adopted for the assignment of the landuse classes. Precipitation data covering a time period of 25 yr were also introduced15
in the GIS. The landslide inventory map of 108 landslide locations was created us-ing data coming up from field investigation, previously documented events and GoogleEarth satellite images interpretation (Fig. 3). At the inventory map all the landslides areintroduced as points because of the small scale enforced by the great extent of thestudy area. All thematic maps were generated using ArcGIS Desktop 9.1 software. All20
the raster layers were resampled using a cell size of 20×20 m.
3.1 Unified lithology
The geological formations type and condition are closely related to the landslide oc-currence. Considering the landslide susceptibility, the geological formations occupyingthe Chania prefecture (IGME, 1956, 1969, 1970, 1971, 1982, 1988, 1993a, 2002) were25
classified into five classes, ranging from the highest to the lowest susceptibility class asfollows: (a) flysch formations, (b) phyllites – quartzites unit (presenting thick weathering
78
NHESSD1, 73–109, 2013
Landslidesusceptibility
mapping in Creteisland
M. Kouli et al.
Title Page
Abstract Introduction
Conclusions References
Tables Figures
J I
J I
Back Close
Full Screen / Esc
Printer-friendly Version
Interactive Discussion
Discussion
Paper
|D
iscussionP
aper|
Discussion
Paper
|D
iscussionP
aper|
mantle), (c) loose Quaternary deposits, (d) Neogene formations and (e) limestones andmarbles. The weighting–rating values set to the above mentioned classes are clearlypresented in Table 1.
The formations of the first four classes compose of alternating layers with grate vari-ations in their mechanical and permeability properties setting the preparatory causal5
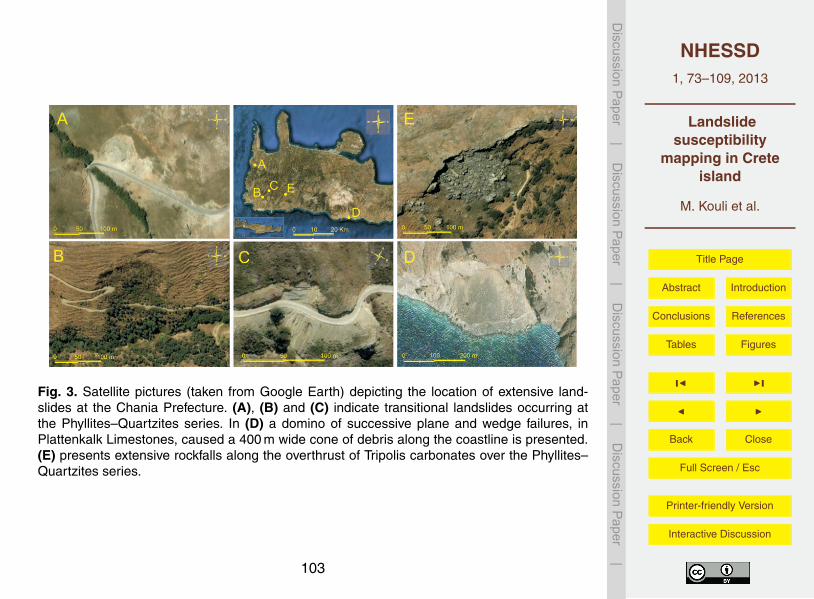
factors (Terzaghi, 1950; Popescu, 1994) for the manifestation of translational landslidesor creep movements. On the contrary, at the areas occupied by limestones and mar-bles only rock falls, determined by the fragmentation degree of the rock mass, can beexpected (Fig. 3).
3.2 Faults proximity10
Tectonic structures associate with extensive fractured zones and steep relief anoma-lies, especially in rock formations. As a result these zones present favorable conditionsfor the manifestation of landslides. Therefore, major tectonic structures, digitized fromthe IGME geological maps, were included as a secondary data layer in this study.
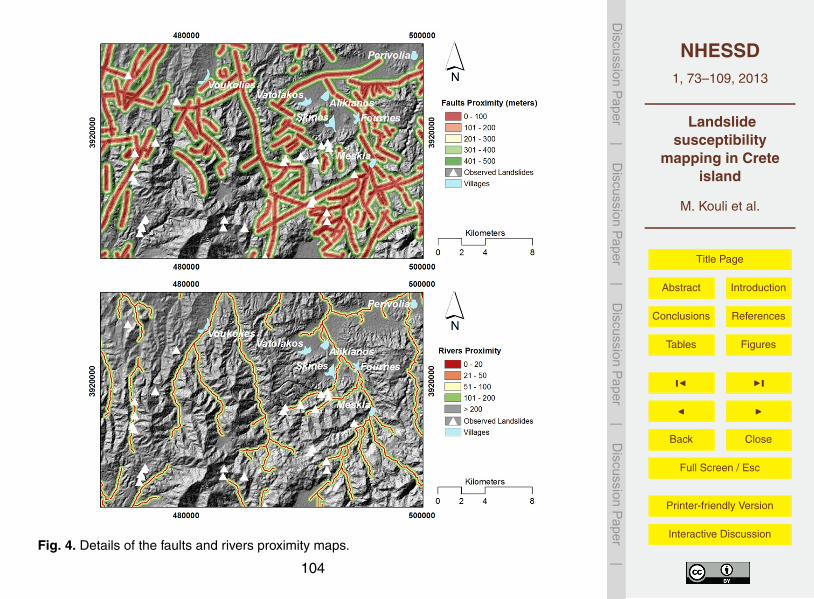
For the introduction of the tectonic structures influence, multiple buffer zones were15
generated around the faults lineament, at distances of 100 and 200 m (Fig. 4). Thethree classes generated by means of the above described procedure were rated ac-cordingly, as presented in Table 1.
3.3 Land use types
Land use is also related with the triggering and preparatory causal factors of the land-20
slides. For instance, the strong root system of the woody vegetation provides bothhydrological and mechanical effects that generally stabilize slopes. As a result, thelandslide events recorded in woodlands are much less than those of the un-vegetatedor irrigated cultivated areas.
79
NHESSD1, 73–109, 2013
Landslidesusceptibility
mapping in Creteisland
M. Kouli et al.
Title Page
Abstract Introduction
Conclusions References
Tables Figures
J I
J I
Back Close
Full Screen / Esc
Printer-friendly Version
Interactive Discussion
Discussion
Paper
|D
iscussionP
aper|
Discussion
Paper
|D
iscussionP
aper|
The role of vegetation in the slope stability was introduced by rating the main landuse classes of Chania prefecture, as mentioned at the Corine Land Use map 2000.The eight main land use classes were ranked as shown in Table 1.
3.4 Rivers proximity
The density of the drainage network is considered as an important factor in character-5
izing landslide susceptible areas. Fluvial erosion is one of the most common triggeringcausal factors of the landslides (WP/WLI, 1994), and it usually affects the slopes toe.
In this case study the drainage network was automatically extracted from the DEMand the drainage tributaries were classified according to Strahler’s system (Strahler,1957, 1964).10
A drainage network buffer zones data layer was produced considering the streamsorder (Fig. 4). Generally the streams of each order were multiply buffered at two to threedistances giving rise to three to four classes, respectively. The multiple buffer zonesapplied in each steam order as well as the rating values are analytically presented inTable 1.15
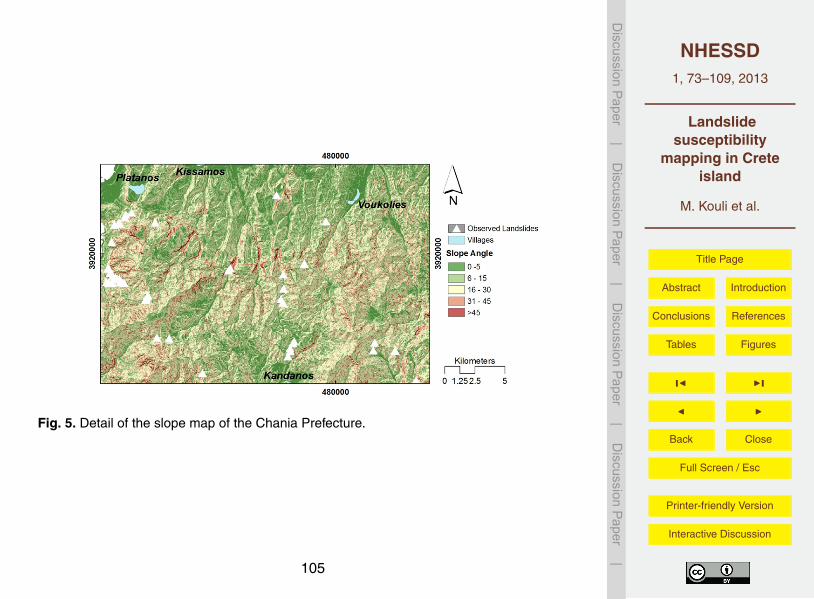
3.5 Slope angle and curvature
Slope geometry is a vital controlling factors in slope stability (Huang and Li, 1992; Wuet al., 2001), and a digital slope image is therefore a fundamental part of a hazardassessment model (Clerici et al., 2002; Saha et al., 2002; Cevik and Topal, 2003;Ercanoglu and Gokceoglu, 2004; Lee et al., 2004a, b; Yalcin, 2008). Slope angle was20
extracted from the DEM, and the derived slope angle map saw values ranging from 0◦
to 84◦. The produced slope image was reclassified into six slope angle classes (0◦–5◦,6◦–15◦, 16◦–30◦, 31◦–45◦, and > 45◦) (Table 1; Fig. 5).
Similarly, slope curvature has a strong influence on slope stability as in steep ter-rain either concentrates or disperses surface and subsurface water in the landscape25
80
NHESSD1, 73–109, 2013
Landslidesusceptibility
mapping in Creteisland
M. Kouli et al.
Title Page
Abstract Introduction
Conclusions References
Tables Figures
J I
J I
Back Close
Full Screen / Esc
Printer-friendly Version
Interactive Discussion
Discussion
Paper
|D
iscussionP
aper|
Discussion
Paper
|D
iscussionP
aper|
(Kayastha et al., 2012). Slope curvature was classified into three classes namely con-vex, flat and concave.
3.6 Slope aspect
The slope aspect is defined as the downslope direction of the maximum rate of eleva-tion change. Aspect can influence indirectly the landslide initiation because it controls5
the exposition to several climate conditions (duration of sunlight exposition, precipita-tion intensity, moisture retention, etc.) and as a result the vegetation cover (Wieczoreket al., 1997; Dai et al., 2002; Cevik and Topal, 2003; Suzen and Doyuran, 2004; Komac,2006).
Considering that in Greece, because of the major mountain chains orientation, the10
NW oriented slopes are more violently affected by rainfalls, the slope aspect was clas-sified accordingly. The nine slope aspect classes presented in Table 1 allow the appli-cation of rating values covering all possible climate conditions exposition.
3.7 Elevation
The elevation is a parameter secondarily related to the landslide occurrence. For in-15
stance, the high relief areas are usually occupied by the most cohesive formations(e.g., limestones), they are exposed in unfavorable climate conditions (e.g. intensiverainfalls), they are uninhabited and landslide events rarely take place and even morerelay are recorded there. The low elevation areas occupied by Quaternary and Neo-gene sediments, depending on the roughness of the morphology, can present low to20
very high landslide frequency. So there is not any general rule relating the landslideoccurrence with the elevation. The reclassification of the elevation data layer and therating values of the classes are highly depended on the expert’s opinion. The experthas to correlate as many geological and morphological factors as possible with theelevation in order to introduce correctly the elevation data layer to the Geographic In-25
formation System (GIS).
81
NHESSD1, 73–109, 2013
Landslidesusceptibility
mapping in Creteisland
M. Kouli et al.
Title Page
Abstract Introduction
Conclusions References
Tables Figures
J I
J I
Back Close
Full Screen / Esc
Printer-friendly Version
Interactive Discussion
Discussion
Paper
|D
iscussionP
aper|
Discussion
Paper
|D
iscussionP
aper|
In this study the higher rating values were given to the classes covering the elevationsfrom 700 to 1000 m (Table 1), presenting steep morphology and mainly occupied byflysch formations and the phyllites – quartzites unit.
3.8 Precipitation
High precipitation is characterized as the physical processes constituting the main trig-5
gering causal factors of landslides (WP/WLI 1994; Koukis et al., 1997; Polemio andSdao, 1999; Sdao and Simeone, 2007). For this work, precipitation data for a time-period of about 25 yr were collected from three different agencies; the Department ofHydrology and Water Resources – Crete Region (DHWR-CR), the National AgriculturalResearch Foundation located in Chania in Crete Island (NAGREF) and the Branch of10
the Institute of Geology and Mineral Exploration situated in Rethymnon in Crete Island(IGME) (Kouli et al., 2009). The average annual precipitation of the study area rangesfrom 800 to 1400 mm. Three classes were defined, using an equal interval of 200 mm(Table 1).
3.9 Roads proximity15
Road construction is related to extensive excavations, application of static and dynamicloads, vegetation removal etc. along natural and engineered slopes. These landslidetriggering actions (WP/WLI 1994) were considered in the design of the landslide sus-ceptibility maps by introducing a road network buffer zones data layer.
Multiple buffer zones were applied, within distances of 20, 50 and 100 m, to the road20
network producing four classes (Table 1).
4 Methodologies
At a first step, an expert based, relative weighting – rating approach (WLC) was used forthe landslide susceptibility mapping. According to this method, certain weights (Table 1)
82
NHESSD1, 73–109, 2013
Landslidesusceptibility
mapping in Creteisland
M. Kouli et al.
Title Page
Abstract Introduction
Conclusions References
Tables Figures
J I
J I
Back Close
Full Screen / Esc
Printer-friendly Version
Interactive Discussion
Discussion
Paper
|D
iscussionP
aper|
Discussion
Paper
|D
iscussionP
aper|
were assigned to each factor by taking into account the specific landslide occurrenceparameters of the study area. The lithology-based weighting–rating system introducedin Kouli et al. (2010) was adopted as it was proved to be satisfactory accurate. Afterthat, the rating values assigned to the different classes of the factors thematic layerswere introduced as attribute information in the GIS and an “attribute map” was gener-5
ated for each data layer representing a causative factor. The vector data layers werereclassified using the assigned rates and the related raster data layers were produced.Finally, the reclassified raster layers were used as input parameters for the raster cal-culator function. By means of the raster calculation the lithology-based weighted factormaps were overlaid (summed) to provide the landslide susceptibility maps.10
Moreover, the weight of evidence (WoE) method was applied using the 80 % of theinventory map landslides as the training set and the rest 20 % for accuracy assessmentpurposes.
The weight of evidence (WoE) modeling method was firstly developed for medicinepurposes (Spiegelhater and Knill-Jones, 1984), but it was also applied to the identi-15
fication of mineral deposits potential (Bonham-Carter et al., 1988, 1989), to landslidesusceptibility mapping (Lee et al., 2002; van Westen et al., 2003; Lee and Choi, 2004;Thiery et al., 2004, 2007; Mathew et al., 2007; Neuhauser and Terhorst, 2007; Poli andSterlacchini, 2007; Rezaei Moghaddam et al., 2007; Dahal et al., 2008a, b; Sharmaand Kumar, 2008; Barbieri and Cambuli, 2009; Ghosh et al., 2009; Regmi et al., 2010;20
Kayastha et al., 2012; Xu et al., 2012; Armas, 2012) and most recently to groundwatermapping (Lee et al., 2012).
Bonham-Carter et al. (1988, 1989) gave a detailed description of the mathemati-cal formulation of the method. Weights for each landslide predictive factor are calcu-lated based on the presence or absence of landslides within the different classes of a25
causative factor (Kayastha et al., 2012):
83
NHESSD1, 73–109, 2013
Landslidesusceptibility
mapping in Creteisland
M. Kouli et al.
Title Page
Abstract Introduction
Conclusions References
Tables Figures
J I
J I
Back Close
Full Screen / Esc
Printer-friendly Version
Interactive Discussion
Discussion
Paper
|D
iscussionP
aper|
Discussion
Paper
|D
iscussionP
aper|
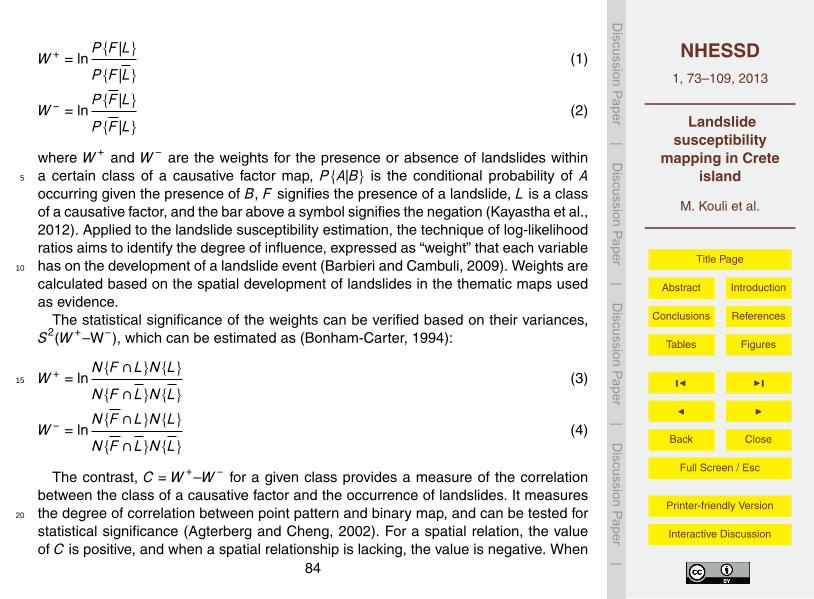
W + = lnP {F |L}
P {F |L}(1)
W − = lnP {F |L}
P {F |L}(2)
where W + and W − are the weights for the presence or absence of landslides withina certain class of a causative factor map, P {A|B} is the conditional probability of A5
occurring given the presence of B, F signifies the presence of a landslide, L is a classof a causative factor, and the bar above a symbol signifies the negation (Kayastha et al.,2012). Applied to the landslide susceptibility estimation, the technique of log-likelihoodratios aims to identify the degree of influence, expressed as “weight” that each variablehas on the development of a landslide event (Barbieri and Cambuli, 2009). Weights are10
calculated based on the spatial development of landslides in the thematic maps usedas evidence.
The statistical significance of the weights can be verified based on their variances,S2(W +–W−), which can be estimated as (Bonham-Carter, 1994):
W + = lnN{F ∩L}N{L}
N{F ∩L}N{L}(3)15
W − = lnN{F ∩L}N{L}
N{F ∩L}N{L}(4)
The contrast, C =W +–W − for a given class provides a measure of the correlationbetween the class of a causative factor and the occurrence of landslides. It measuresthe degree of correlation between point pattern and binary map, and can be tested for20
statistical significance (Agterberg and Cheng, 2002). For a spatial relation, the valueof C is positive, and when a spatial relationship is lacking, the value is negative. When
84
NHESSD1, 73–109, 2013
Landslidesusceptibility
mapping in Creteisland
M. Kouli et al.
Title Page
Abstract Introduction
Conclusions References
Tables Figures
J I
J I
Back Close
Full Screen / Esc
Printer-friendly Version
Interactive Discussion
Discussion
Paper
|D
iscussionP
aper|
Discussion
Paper
|D
iscussionP
aper|
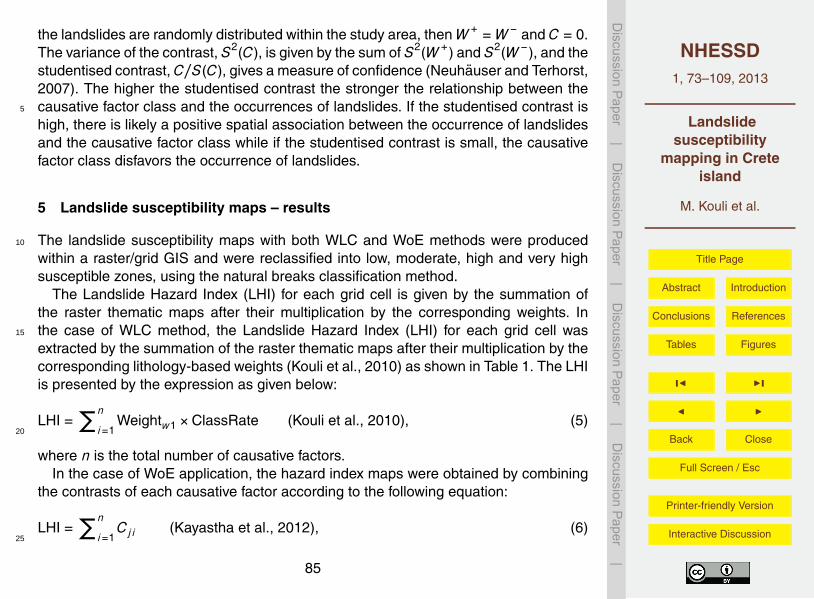
the landslides are randomly distributed within the study area, then W + =W − and C = 0.The variance of the contrast, S2(C), is given by the sum of S2(W +) and S2(W −), and thestudentised contrast, C/S(C), gives a measure of confidence (Neuhauser and Terhorst,2007). The higher the studentised contrast the stronger the relationship between thecausative factor class and the occurrences of landslides. If the studentised contrast is5
high, there is likely a positive spatial association between the occurrence of landslidesand the causative factor class while if the studentised contrast is small, the causativefactor class disfavors the occurrence of landslides.
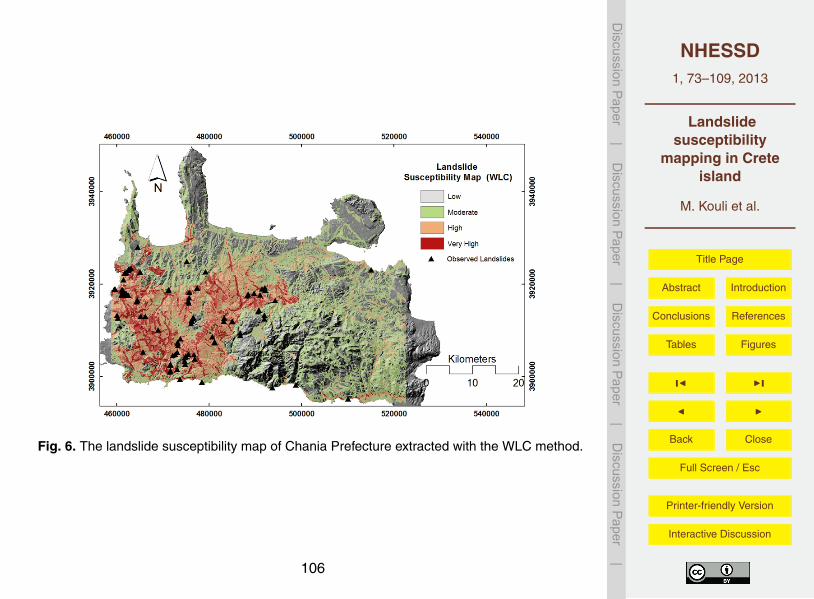
5 Landslide susceptibility maps – results
The landslide susceptibility maps with both WLC and WoE methods were produced10
within a raster/grid GIS and were reclassified into low, moderate, high and very highsusceptible zones, using the natural breaks classification method.
The Landslide Hazard Index (LHI) for each grid cell is given by the summation ofthe raster thematic maps after their multiplication by the corresponding weights. Inthe case of WLC method, the Landslide Hazard Index (LHI) for each grid cell was15
extracted by the summation of the raster thematic maps after their multiplication by thecorresponding lithology-based weights (Kouli et al., 2010) as shown in Table 1. The LHIis presented by the expression as given below:
LHI =∑n
i=1Weightw1 ×ClassRate (Kouli et al., 2010), (5)
20
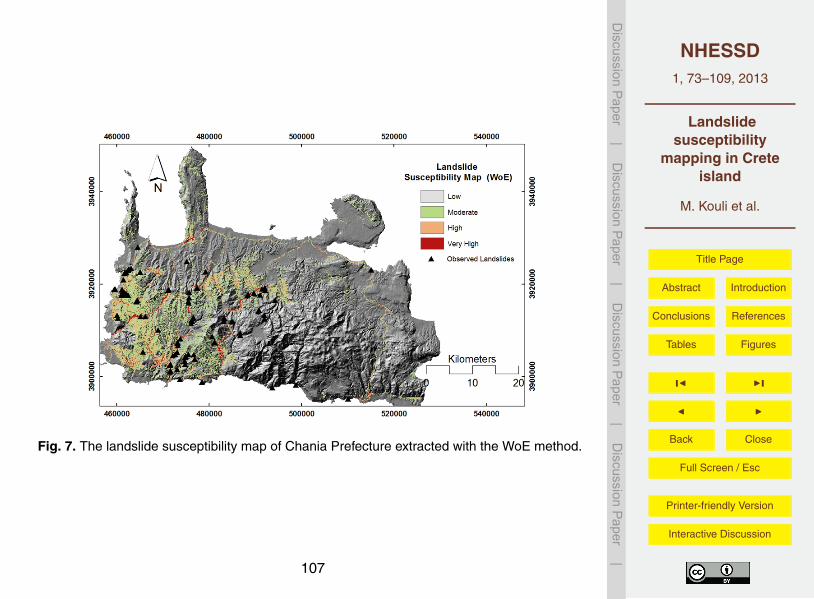
where n is the total number of causative factors.In the case of WoE application, the hazard index maps were obtained by combining
the contrasts of each causative factor according to the following equation:
LHI =∑n
i=1Cj i (Kayastha et al., 2012), (6)
25
85

NHESSD1, 73–109, 2013
Landslidesusceptibility
mapping in Creteisland
M. Kouli et al.
Title Page
Abstract Introduction
Conclusions References
Tables Figures
J I
J I
Back Close
Full Screen / Esc
Printer-friendly Version
Interactive Discussion
Discussion
Paper
|D
iscussionP
aper|
Discussion
Paper
|D
iscussionP
aper|
where Ci j is the contrast value for class j for the causative factor i and n is the totalnumber of causative factors.
The resulting landslide susceptibility maps are shown in Figs. 6 and 7, respectively.The weights, variances, contrasts and studentised contrasts for all parameter classes
after the application of the WoE method are presented in Table 2. According to this5
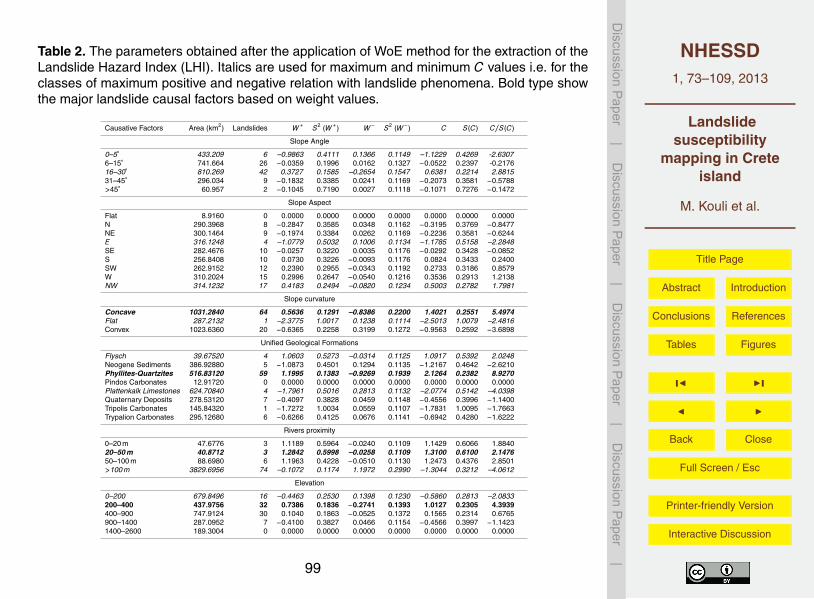
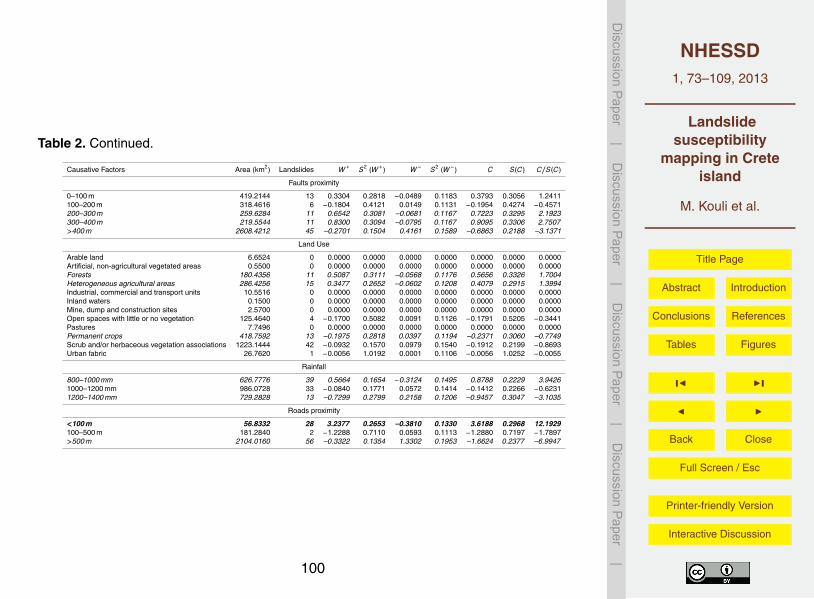
table and having in mind that high weights indicate high probability of landslide occur-rence, the distance to roads and geology casual factors mainly govern the landslidephenomena in the study area while distance to rivers, slope curvature and elevationplay an important role. As it seems the most significant causative factors classes witha positive impact on landslides are: (a) slope angle of 16◦–30◦, (b) slope aspect NW,10
(c) slopes of concave shape, (d) areas with elevation 200–400 m, (e) distance fromrivers 20–100 m, (f) land uses of forest and heterogeneous agricultural areas, (g) thegeological formations of phyllites-quartzites and flysch, (h) distance from faults 200–400 m, (i) precipitation of 800–1000 mm yr−1 and (j) areas proximal to roads (distance<100 m). Respectively, the most significant parameter classes with a negative impact15
on landslides are: (a) slope angle 0◦–5◦, (b) slope aspect E , (c) the geological forma-tion of Plattenkalk limestones, (d) elevation less than 200 m, (e) distance from drainagemore than 100 m, (f) land use of permanent crops and scrub and /or herbaceous veg-etation associations, (g) distance from faults greater than 400 m, (h) precipitation morethan 1200 mm yr−1 and (i) distance from roads > 500 m.20
The above mentioned impact of the causative factor on the landslides occurrenceappears to be reasonable. But a detailed examination of the WoE method results re-viles some irregularities. For example, the existence of forests appears to have posi-tive impact on the landslide occurrence, fact totally unacceptable. Obviously numerousroads intersect areas characterized as forests at the Corine Land Cover map con-25
fusing the WoE method results. Another obscurity of the WoE method is that the Ci jvalues are strongly related to the quality of the landslide sample. Usually the land-slides are recorded when they damage the road network, villages and, in general,when they interrupt the human activities. So usually the available sample of landslides
86
NHESSD1, 73–109, 2013
Landslidesusceptibility
mapping in Creteisland
M. Kouli et al.
Title Page
Abstract Introduction
Conclusions References
Tables Figures
J I
J I
Back Close
Full Screen / Esc
Printer-friendly Version
Interactive Discussion
Discussion
Paper
|D
iscussionP
aper|
Discussion
Paper
|D
iscussionP
aper|
is not representative. These irregularities appear to introduce a random error at theLandslide Hazard Index values.
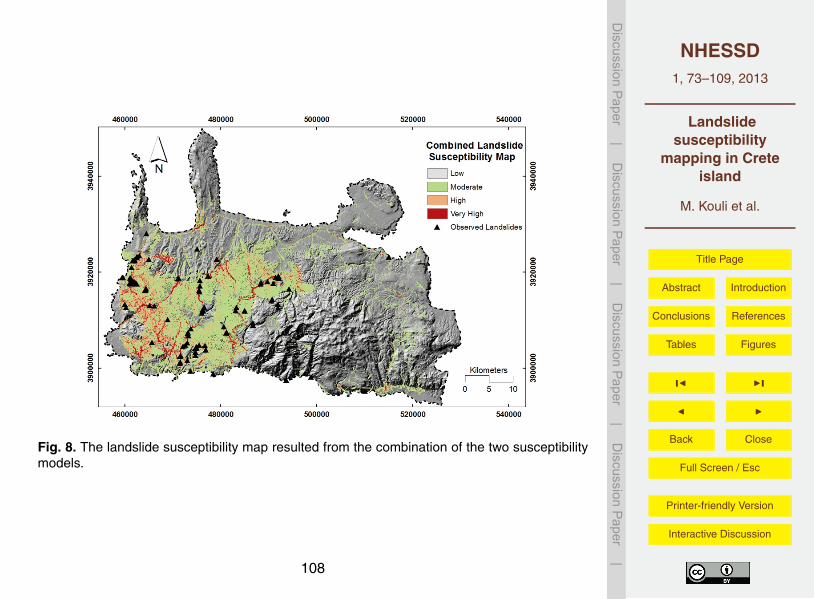
According to Rossi et al. (2010), a combination of the two landslide susceptibilitymaps was produced using the logistic regression approach. For this purpose, the pres-ence or absence of the landslides in the study area was the dependent variable, while5
the two landslide susceptibility maps were the independent explanatory variables. Theresulted combined map is shown in Fig. 8.
6 Validation of the applied methods – success rate curves
In order to proceed to the validation of the landslide susceptibility maps the suc-cess rate curves (Chung and Fabbri, 1999; van Westen et al., 2003; Kayastha et al.,10
2012) were adopted. The “areas under the curves” constitutes one of the most com-monly used accuracy statistics for the prediction models in natural hazard assessments(Begueria, 2006). The rate explains how well the model predicts the landslide (Chungand Fabbri, 1999) and the area under the curve can be used to assess the predictionaccuracy qualitatively (Fig. 9). The cumulative percentage of observed landslide occur-15
rence was plotted against the real cumulative percentage in decreasing LHI values toobtain the success rate curve for the study area. The rate curves were created and the“areas under the curves” were calculated for the three cases of hazard maps using theexisting landslide location data. For example, in the case of the WoE, the 10 % of thestudy area can explains 67 % of all the landslides in the success rate and was classi-20
fied as a zone of very highly susceptibility while at the same time the same 10 % of thestudy area can explain 53 % of all the landslides in te case of WLC method. Therefore,it is obvious that the WoE method resulted in better predictions (success rate of 87.4 %)compared to the WLC method (success rate of 84.7 %). The combined model shows85 % area under curve reducing the uncertainties introduced to the WLC method by25
subjective knowledge of experts.
87
NHESSD1, 73–109, 2013
Landslidesusceptibility
mapping in Creteisland
M. Kouli et al.
Title Page
Abstract Introduction
Conclusions References
Tables Figures
J I
J I
Back Close
Full Screen / Esc
Printer-friendly Version
Interactive Discussion
Discussion
Paper
|D
iscussionP
aper|
Discussion
Paper
|D
iscussionP
aper|
7 Conclusions
For the Chania Prefecture area two landslide susceptibility maps were produced adopt-ing the weighted linear combination (WLC) and the weights of evidence (WoE) meth-ods. A third map was produced from the combination of the two methods using thelogistic regression approach. The produced landslide susceptibility maps are substan-5
tial for the land degradation management and planning of the study area and theyclearly present the areas prone to landslides. The validation procedure confirmed theindex setup procedure of both WLC and WoE methods and as a result the accuracyof the indicated hazardous areas. So both methods provided accurate susceptibilitymaps which they can be used safely from the local authorities for slope management10
and land-use planning. It must be noted that the WoE method provided more accurateresults despite the limited inventory data. The current study also proved that, despitethe subjectiveness introduced to the WLC method by utilizing the knowledge of ex-perts, the produced susceptibility maps can be proved to be satisfactory accurate. Thecombined model resulted to the smoothing and balancing of the output susceptibility15
maps but it did not overcome the prediction accuracy of WoE. Nevertheless, in caseswhere the quality of the available inventory data is considered satisfactory and the land-slide sample is statistically adequate, the combination of both methods can be provedsignificant for the crosschecking of the results and the tracing of any possible mistakes.
Acknowledgements. The project is co-funded by the European Social Fund and National Re-20
sources in the framework of the project THALIS MIS 80198, entitled “Geocharacterization-Geotechnical characterization of selected areas in Crete using geophysical and geotechnicalmethods”, WP-2. 2.
References
Agterberg, F. P. and Cheng, Q.: Conditional independence test for weights of evidence mod-25
elling, Natural Resour. Res., 11, 249–255, 2002
88
NHESSD1, 73–109, 2013
Landslidesusceptibility
mapping in Creteisland
M. Kouli et al.
Title Page
Abstract Introduction
Conclusions References
Tables Figures
J I
J I
Back Close
Full Screen / Esc
Printer-friendly Version
Interactive Discussion
Discussion
Paper
|D
iscussionP
aper|
Discussion
Paper
|D
iscussionP
aper|
Akgun, A. and Bulut, F.: GIS-based landslide susceptibility for Arsin-Yomra (Trabzon, NorthTurkey) region, Environ. Geol., 51, 1377–1387, doi:10.1007/s00254-006-0435-6, 2007.
Akgun, A. and Turk, N.: Landslide susceptibility mapping for Ayvalik (Western Turkey)and its vicinity by multicriteria decision analysis, Environ. Earth Sci., 61, 595–611,doi:10.1007/s12665-009-0373-1, 2010.5
Aleotti, P. and Chowdhury, R.: Landslide hazard assessment: summary review and new per-spectives, Bull. Eng. Geol. Environ., 58, 21–44, 1999.
Anbalagan, D.: Landslide hazard evaluation and zonation mapping in mountainous terrain, Eng.Geol., 32, 269–277, 1992.
Angelier, J.: Determination of the mean principal directions of stresses for a given fault popula-10
tion, Tectonophysics, 56, T17–T26, 1979.Armas, I.: Weights of evidence method for landslide susceptibility mapping, Prahova Sub-
carpathians, Romania, Nat. Hazards, 60, 937–950, doi:10.1007/s11069-011-9879-4, 2012.Arnous, M.: Integrated remote sensing and GIS techniques for landslide hazard zonation: a
case study Wadi Watier area South Sinai, Egypt, J. Coast Conserv., 15, 477–497, 2011.15
Atkinson, P. M. and Massari, R.: Generalized linear modeling of landslide susceptibility in thecentral Apennines, Italy, Comput. Geosci., 24, 373–385, 1998.
Ayalew, L. and Yamagishi, H.: The application of GIS-based logistic regression for landslidesusceptibility mapping in the Kakuda–Yahiko Mountains, Central Japan, Geomorphology, 65,15–31, 2005.20
Ayalew, L., Yamagishi, H., and Ugawa, N.: Landslide susceptibility mapping using GIS-basedweighted linear combination, the case in Tsugawa area of Agano River, Niigata Prefecture,Japan, Landslides, 1, 73–81, 2004a.
Ayalew, L., Yamagishi, H., Watanabe, N., and Marui, H.: Landslide susceptibility mapping usinga semi-quantitative approach, a case study from Kakuda-Yahiko Mountains, Niigata, Japan,25
in: Proceedings of the 4th Asian Symposium on Engineering Geology and the Environment,edited by: Free, M. and Aydin, A., Geological Society of Hong Kong, 7, 99–105, 2004b.
Barbieri, G. and Cambuli, P.: The weight of evidence statistical method in landslide susceptibilitymapping of the Rio Pardu Valley (Sardinia, Italy), 18th World IMACS/MODSIM Congress,Cairns, Australia, 2658–2664, 2009.30
Barredo, J. I., Benavides, A., Hervas, J., and Van Westen, C. J.: Comparing heuristic landslidehazard assessment techniques using GIS in the Tirajana basin, Gran Canaria Island, Spain,Int. J. Appl. Earth Observation Geoinf., 2, 9–23, 2000.
89
NHESSD1, 73–109, 2013
Landslidesusceptibility
mapping in Creteisland
M. Kouli et al.
Title Page
Abstract Introduction
Conclusions References
Tables Figures
J I
J I
Back Close
Full Screen / Esc
Printer-friendly Version
Interactive Discussion
Discussion
Paper
|D
iscussionP
aper|
Discussion
Paper
|D
iscussionP
aper|
Begueria, S.: Validation and evaluation of predictive models in hazard assessment and riskmanagement, Nat. Hazards, 37, 315–329, 2006.
Bonham-Carter, G. F.: Geographic Information Systems for Geoscientists, Modeling with GIS,Pergamon Press, Oxford, 1994.
Bonham-Carter, G. F., Agterberg, F. P., and Wright, D. F.: Integration of geological datasets for5
gold exploration in Nova Scotia, Photogramm. Eng. Remote Sens., 54, 1585–1592, 1988.Bonham-Carter, G. F., Agterberg, F. P., and Wright, D. F.: Weights of evidence modelling: a
new approach to mapping mineral potential, Statistical applications in the earth science,geological survey of Canada, Paper 89–9, 171–183, 1989.
Bonneau, M.: Les differentes “series ophiolitiferes” de la Crete: une mise au point, C.R. Acad10
Sc., 276, 1249–1252, 1973.Brabb, E. E.: Innovative approaches to landslide hazard and risk mapping. Proc., Fourth In-
ternational Symposium on Landslides, Canadian Geotechnical Society, Toronto, Canada, 1,307–324, 1984.
Carrara, F. and Guzzetti, F. (Eds.): Geographical Information Systems in Assessing Natural15
Hazards, Kluwer Academic Publisher, Dordrecht, The Netherlands (1995), 353 pp., 1995.Carrara, A., Cardinalli, M., Guzzetti, F., and Reichenbach, P.: GIS technology in mapping land-
slide hazard, in: Geographical Information Systems in Assessing Natural Hazard, edited by:Carrara, A. and Guzzetti, F., Kluwer Academic Publisher, 173–175, 1995.
Carrara, A., Guzzetti, F., Cardinali, M., and Reichenbach, P.: Use of GIS technology in the20
prediction and monitoring of landslide hazard, Nat. Hazards, 20, 117–135, 1999.Castellanos Abella, E. A. and van Westen, C. J.: Qualitative landslide susceptibility assess-
ment by multicriteria analysis: A case study from San Antonio del Sur, Guantanamo, CubaGeomorph., 94, 453–466, 2008.
Cevik, E., and Topal, T.: GIS-based landslide susceptibility mapping for a problematic segment25
of the natural gas pipeline, Hendek (Turkey), Environ. Geol., 44, 949–962, 2003.Chung, C. J. F. and Fabbri, A. G.: Probabilistic prediction models for landslide hazard mapping,
Photogram. Eng. Remote Sens., 65, 1389–1399, 1999.Clerici, A., Perego, S., Tellini, C., and Vescovi, P.: A procedure for landslide susceptibility zona-
tion by the conditional analysis method, Geomorphology, 48, 349–364, 2002.30
Creutzburg, N.: General geological map of Greece (Crete Island), 1:200.000, I.G.R.M., Athens,1977.
90
NHESSD1, 73–109, 2013
Landslidesusceptibility
mapping in Creteisland
M. Kouli et al.
Title Page
Abstract Introduction
Conclusions References
Tables Figures
J I
J I
Back Close
Full Screen / Esc
Printer-friendly Version
Interactive Discussion
Discussion
Paper
|D
iscussionP
aper|
Discussion
Paper
|D
iscussionP
aper|
Dahal, R. K., Hasegawa, S., Nonomura, A., Yamanaka, M., Masuda, T., and Nishino, K.: GIS-based weights-of-evidence modelling of rainfall-induced landslides in small catchments forlandslide susceptibility mapping, Environ. Geol., 54, 311–324, 2008a.
Dahal, R. K., Hasegawa, S., Nonoumra, A., Yamanaka, M., Dhakal, S., and Paudyal, P.: Pre-dictive modelling of rainfall-induced landslide hazard in the Lesser Himalaya of Nepal based5
on weights-of-evidence, Geomorphology, 102, 496–510, 2008b.Dai, F. C. and Lee, C. F.: Landslide characteristics and slope instability modeling using GIS,
Lantau Island, Hong Kong, Geomorphology. 42, 213–228, 2002.Dai, F. C., Lee, C. F., and Zhang, X. H.: GIS-based geo-environmental evaluation for urban
land-use planning: a case study, Eng. Geology, 61, 257–271, 2001.10
Dai, F. C., Lee, C. F., and Ngai, Y. Y.: Landslide risk assessment and management: an overview,Eng. Geol., 64, 65–87, 2002.
Dikau, R., Cavallin, A., and Jager, S.: Databases and GIS for landslide research in Europe,Geomorphology, 15, 227–239, 1996.
Ercanoglu, M. and Gokceoglu, C.: Use of fuzzy relations to produce landslide susceptibility map15
of a landslide prone area (West Black Sea Region, Turkey), Eng. Geol., 75, 229–250, 2004.Evans, N. C., Huang, S. W., and King, J. P.: The Natural Terrain Landslide Study – Phases I and
II, Special Project Report SPR5/97, Geotechnical Engineering Office, Hong Kong, 1997.Fall, M.: Standsicherheitsanalyse der Kustenhange in Cap Manuel (Dakar, Senegal) mit Hilfe
ingenieurgeologisch-geotechnischer Untersuchungen und GIS-technologischer Methoden,20
Veroffentlichung Institut Geotechnik, Heft 2000-2, 187 pp., 2000.Fall, M. and Azzam, R.: Ingenieurgeologische und numerische Standsicherheitsanalysen der
Basaltkliffe in Dakar, Int. J. Felsbau, 19, 51–57, 2001a.Fall, M. and Azzam, R.: An example of multi-disciplinary approach to landslide assessment
in coastal area. International conference on landslide, Proceedings International Conference25
on Landslides: Causes Impacts and Countermeasures, Davos, Switzerland, Gluckauf Verlag,45–54, 2001b.
Fall, M., Dia, A., Fall, M., Gbaguidi, I., Lo, P. G., and Diop, I. N.: Un cas d’instabilite de pentenaturelle: le versant des Madeleines-Presqu’ıle de Dakar (Senegal): Analyse, Cartographiedes risques et prevention, B. Eng. Geol. Environ., 53, 29–38, 1996.30
Fall, M., Azam, R., and Noubactep, C.: A multi-method approach to study the stability of naturalslopes and landslide susceptibility mapping, Eng. Geol., 82, 241–263, 2006.
91
NHESSD1, 73–109, 2013
Landslidesusceptibility
mapping in Creteisland
M. Kouli et al.
Title Page
Abstract Introduction
Conclusions References
Tables Figures
J I
J I
Back Close
Full Screen / Esc
Printer-friendly Version
Interactive Discussion
Discussion
Paper
|D
iscussionP
aper|
Discussion
Paper
|D
iscussionP
aper|
Fell, R., Walker, B., and Finlay, P.: Estimating the probability of landsliding. Proc. 7th Austr.New Zeal. Conf. on Geomechanics, Adelaide, Institute of Engineers, Australia, Canberra,304–311, 1996.
Fitrolakis, S.: The geologic structure of Crete, lectureship thesis, National Technical Universityof Athens, Department of Engineering and Metallurgy, Greece, 1980 (in Greek).5
Ghosh, S., van Westen, C. J., Carranza, E. J. M., Ghosal, T. B., Sarkar, N. K., and Surendranath,M.: A quantitative approach for improving the BIS (Indian) method of medium-scale landslidesusceptibility, J. Geol. Soc. India, 74, 625–638, 2009.
Gorsevski, P. V., Gessler, P., and Foltz, R. B.: Spatial prediction of landslide hazard using lo-gistic regression and GIS, 4th Int. Conf. on Integrating GIS and Environmental Modeling,10
Proceedings, Banff, Alberta, Canada, 9 pp., 2000.Guzetti, F., Carrarra, A., Cardinali, M., and Reichenbach, P.: Landslide hazard evaluation: a
review of current techniques and their application in a multiscale study, Central Italy, Geo-morphology, 31, 181–216, 1999.
Huang, R. and Li, Y.: Logical model of slope stability prediction in the Three Gorges Reservoir15
area, China, Proceedings of the Sixth International Symposium on Landslides–Glissementsde terrain, Balkema Publishers, A.A., Christchurch, 977–981, 1992.
Hutchinson, J. and Chandler, M.: A preliminary landslide hazard zonation of the undercliff ofthe Isle of Wight, in: Slope Stability Engineering. Developments and Applications, edited by:Chandler, R., T. Telford, 197–206, 1991.20
Institute of Geology and Mineral Exploration – I.G.M.E.: Geological map of Greece – PlataniasSheet (Scale 1:50.000), IGME, Athens, 1956.
Institute of Geology and Mineral Exploration – I.G.M.E.: Geological map of Greece – AlikianouSheet (Scale 1:50.000), IGME, Athens, 1969.
Institute of Geology and Mineral Exploration – I.G.M.E.: Geological map of Greece – Kastelli25
Sheet (Scale 1:50.000), IGME, Athens, 1970.Institute of Geology and Mineral Exploration – I.G.M.E.: Geological map of Greece – Khania
Sheet (Scale 1:50.000), IGME, Athens, 1971.Institute of Geology and Mineral Exploration – I.G.M.E.: Geological map of Greece – Sellia
Sheet (Scale 1:50.000), IGME, Athens, 1982.30
Institute of Geology and Mineral Exploration – I.G.M.E.: Geological map of Greece – RethymnoSheet (Scale 1:50.000), IGME, Athens, 1988.
92
NHESSD1, 73–109, 2013
Landslidesusceptibility
mapping in Creteisland
M. Kouli et al.
Title Page
Abstract Introduction
Conclusions References
Tables Figures
J I
J I
Back Close
Full Screen / Esc
Printer-friendly Version
Interactive Discussion
Discussion
Paper
|D
iscussionP
aper|
Discussion
Paper
|D
iscussionP
aper|
Institute of Geology and Mineral Exploration – I.G.M.E.: Geological map of Greece – VrissesSheet (Scale 1:50.000), IGME, Athens, 1993a.
Institute of Geology and Mineral Exploration – I.G.M.E.: Geological map of Greece (Scale1:500.000), IGME, Athens, 1993b.
Institute of Geology and Mineral Exploration – I.G.M.E.: Geological map of Greece – Palaeo-5
hora Sheet (Scale 1:50.000), IGME, Athens, 2002.Kayastha, P., Dhital, M. R., and De Smedt, F.: Landslide susceptibility mapping using the
weight of evidence method in the Tinau watershed, Nepal, Nat. Hazards, 63, 479–498,doi:10.1007/s11069-012-0163-z, 2012.
Komac, M.: A landslide susceptibility model using the analytical hierarchy process method and10
multivariate statistics in perialpine Slovenia, Geomorphology, 74, 17–28, 2006.Koukis, G. and Ziourkas, C.: Slope instability phenomena in Greece: A statistical analysis, B.
IAEG, 43, 47–60, 1991.Koukis, G., Tsiambaos, G., and Sabatakakis, N.: Landslide movements in Greece: Engineering
geological characteristics and environmental consequences, in: Proceedings of International15
Symposium of Eng. Geol. and the Envar, IAEG, Balkema, Rotterdam, 789–792, 1997.Kouli, M., Soupios, P., and Vallianatos, F.: Soil loss prediction using the revised universal soil
loss equation (RUSLE) in a GIS framework, Chania, Northwestern Crete, Greece, Environ.Geol., 57, 483–497, 2009.
Kouli, M., Loupasakis, C., Soupios, P., and Vallianatos, F.: Landslide hazard zonation in high20
risk areas of Rethymno Prefecture, Crete Island, Greece, Nat. Hazards, 52, 599–621, 2010.Krahl, J., Kaufmann, G., Kozur, H., Richter, D., Forster, O., and Heinritzi, F.: Neue Daten zur
Biostratigraphie und zur tektonischen Lagerung der Phyllit-Gruppe und der Trypali Gruppeauf der Insel Kreta (Griechenland), Geol. Rundsch., 72, 1147–1166, 1983.
Kramer, S. L.: Geotechnical Earthquake Engineering, Prentice-Hall, Upper Saddle River, NJ25
(1996), 653 pp., 1996/Lee, E. M. and Jones, D. K. C.: Landslide Risk Assessment, Thomas Telford, London, 454 pp.,
2004.Lee, S. and Choi, J.: Landslide susceptibility mapping using GIS and the weight-of-evidence
model, Int. J. Geogr. Inf. Sci., 18, 789–814, 2004.30
Lee, S. and Min, K.: Statistical analysis of landslide susceptibility at Yongin, Korea, Environ.Geol., 40, 1095–1113, doi:10.1007/s002540100310, 2001.
93
NHESSD1, 73–109, 2013
Landslidesusceptibility
mapping in Creteisland
M. Kouli et al.
Title Page
Abstract Introduction
Conclusions References
Tables Figures
J I
J I
Back Close
Full Screen / Esc
Printer-friendly Version
Interactive Discussion
Discussion
Paper
|D
iscussionP
aper|
Discussion
Paper
|D
iscussionP
aper|
Lee, S., Choi, J., and Min, K.: Landslide susceptibility analysis and verification using theBayesian probability model, Environ. Geol., 43, 120–131, 2002.
Lee, S., Choi, J., and Min, K.: Probabilistic landslide hazard mapping using GIS and remotesensing data at Boun, Korea, Int. J. Remote Sens., 25, 2037–2052, 2004a.
Lee, S., Ryu, J., Won, J., and Park, H.: Determination and application of the weight for landslide5
susceptibility mapping using an artificial neural network, Eng. Geol., 71, 289–302, 2004b.Lee, S., Kim, Y. S., and Oh, H. J.: Application of a weights-of-evidence method and GIS to
regional groundwater productivity potential mapping, J. Environ. Manage., 96, 91–105, 2012.Leroi, E.: Landslide risk mapping: problems, limitation and developments. in: Landslide Risk
Assessment, edited by: Cruden, D. M. and Fell, R., Balkema, Rotterdam, 239–250, 1997.10
Luzi, L., Pergalani, F., and Terlien, M. T. J.: Slope vulnerability to earthquakes at subregionalscale, using probabilistic techniques and geographic information systems, Eng. Geol., 58,313–336, 2000.
Makropoulos, K. C. and Burton, P. W.: Greek tectonics and seismicity, Tectonophysics, 106,275–304, 1984.15
Mathew, J., Jha, V. K., and Rawat, G. S.: Weights of evidence modeling for landslide hazardzonation mapping in part of Bhagirathi valley, Uttarakhand, Curr. Sci., 92, 628–638, 2007.
McKenzie, D. P.: Active tectonics of the Mediterranean region, Geophys. J. R. Astr. Soc., 5,217–254, 1972.
Miles, S. B. and Ho, C. L.: Rigorous landslide hazard zonation using Newmark’s method and20
stochastic ground motion simulation, Soil Dynam. Earthq. Eng., 18, 305–323, 1999.Miles, S. B. and Keefer, D. K.: Evaluation of seismic slope-performance models using a regional
case study, Environ. Eng. Geosci., 6, 25–39, 1999.Mondal, S. and Maiti, R.: Landslide Susceptibility Analysis of Shiv-Khola Watershed, Darjiling:
A Remote Sensing & GIS Based Analytical Hierarchy Process (AHP) J. Indian Soc. Remote25
Sens., 40, 483–496, 2012.Moon, A., Olds, R., Wilson, R., and Burman, B.: Debris flow zoning at Montrose, Victoria, Proc.
6th Intern. Symp. on Landslides, 2, Balkema, Rotterdam, 2, 1015–1022, 1992.Nash, D.: A comparative review of limit equilibrium methods of slope stability analysis, in: Slope
Stability, edited by: Anderson, M. G. and Richards, K. J., Wiley, New York, 11–75, 1987.30
Neuhauser, B. and Terhorst, B.: Landslide susceptibility assessment using “weights-of-evidence” applied to a study area at the Jurassic escarpment (SW-Germany), Geomorphol-ogy, 86, 12–24, 2007.
94
NHESSD1, 73–109, 2013
Landslidesusceptibility
mapping in Creteisland
M. Kouli et al.
Title Page
Abstract Introduction
Conclusions References
Tables Figures
J I
J I
Back Close
Full Screen / Esc
Printer-friendly Version
Interactive Discussion
Discussion
Paper
|D
iscussionP
aper|
Discussion
Paper
|D
iscussionP
aper|
Ohlmacher, G. C. and Davis, J. C.: Using multiple logistic regression and GIS technology topredict landslide hazard in northeast Kansas, USA, Eng. Geol., 69, 331–343, 2003.
Papazachos, B. C. and Comninakis, P. E.: Geophysical and tectonic features of the Aegeanarc, J. Geophys. Res., 76, 8517–8533, 1971.
Polemio, M. and Sdao, F.: The role of rainfall in the landslide hazard: the case of the Avigliano5
urban area (Southern Apennines, Italy), Eng. Geol., 53, 297–309, 1999.Poli, S. and Sterlacchini, S.: Landslide representation strategies in susceptibility studies using
Weights of Evidence modeling technique, Nat. Resour. Res., 16, 121–134, 2007.Popescu, M.: A suggested method for reporting landslide causes, B. Eng. Geol. Environ., 50,
71–74, doi:10.1007/BF02594958, 1994.10
Refice, A. and Capolongo, D.: Probabilistic modeling of uncertainties in earthquake-inducedlandslide hazard assessment, Comput. Geosci., 28, 735–749, 2002.
Regmi, N. R., Giardino, J. R., and Vitek, J. D.: Modeling susceptibility to landslides usingthe weight of evidence approach: Western Colorado, USA, Geomorphology, 115, 172–187,2010.15
Rezaei Moghaddam, M. H., Khayyam, M., Ahmadi, M., and Farajzadeh, M.: Mapping suscepti-bility landslide by using the weight-of-evidence model: a case study in Merek Valley, Iran, J.Appl. Sci., 7, 3342–3355, 2007.
Rossi, M., Guzzetti, F., Reichenbach, P., Mondini, P. R., and Peruccacci, S.: Optimal landslidesusceptibility zonation based on multiple forecasts, Geomorphology, 114, 129–142, 2010.20
Saaty, T. L.: The Analytical Hierarchy Process, McGraw Hill, New York, 1980.Saha, A. K., Gupta, R. P., and Arora, M. K.: GIS-based landslide hazard zonation in the Bhagi-
rathi (Ganga) valley, Himalayas, Int. J. Remote Sens., 23, 357–369, 2002.Sdao, F. and Simeone, V.: Mass movements affecting Goddess Mefitis sanctuary in Rossano
di Vaglio (Basilicata, southern Italy), J. Cult. Herit., 8, 77–80, 2007.25
Sharma, M. and Kumar, R.: GIS-based landslide hazard zonation: a case study from the Par-wanoo area, Lesser and Outer Himalaya, H. P. India, Bull. Eng. Geol. Environ., 67, 129–137,2008.
Siddle, H. J., Jones, D. B., and Payne, H. R.: Development of a methodology for landslip poten-tial mapping in the Rhondda Valley, in: Slope stability engineering, edited by: Chandler, R.30
J., Thomas Telford, London, 137–142, 1991.
95
NHESSD1, 73–109, 2013
Landslidesusceptibility
mapping in Creteisland
M. Kouli et al.
Title Page
Abstract Introduction
Conclusions References
Tables Figures
J I
J I
Back Close
Full Screen / Esc
Printer-friendly Version
Interactive Discussion
Discussion
Paper
|D
iscussionP
aper|
Discussion
Paper
|D
iscussionP
aper|
Spiegelhater, D. and Knill-Jones, R. P.: Statistical and knowledge approaches to clinicaldecision-support systems, with an application in gastroenterology, J. R. Stat. Soc., 147, 35–77, 1984.
Strahler, A. N.: Quantitative analysis of watershed geomorphology, Trans. Am. Geophys. Union,38, 913–920, 1957.5
Strahler, A. N.: Quantitative geomorphology of basins and channel networks, in: Handbook ofApplied Hydrology, edited by: Chow, V. T., Mcgraw Hill Book Company, New York, 1964.
Suzen, M. L. and Doyuran, V.: Data driven bivariate landslide susceptibility assessment usinggeographical information systems: a method and application to Asarsuyu catchment, Turkey,Eng. Geol., 71, 303–321, 2004.10
Tataris, A. and Christodoulou, C.: The Geological structure of Leuca Mountains, Bull. Geol.Soc. Greece, 6, 319–347, 1965.
Terlien, M. T. J., Van Asch, Th. W. J., and van Westen, C. J.: Deterministic modeling in GIS-based landslide hazard assessment, in: Geographical Information Systems in AssessingNatural Hazards, edited by: Carrar, A. and Guzzetti, F., Kluwer, London, 57–77, 1995.15
Terzaghi, K.: Mechanisms of landslides, Geological Society of America, Berkey Volume, 83–123, 1950.
Thiery, Y., Sterlacchini, S., Malet, J. P., Puissant, A., Remaıtre, A., and Maquaire, O.: Strategyto reduce subjectivity in landslide susceptibility zonation by GIS in complex mountainousenvironments, in: Proceedings of AGILE 2004: 7th AGILE conference on geographic infor-20
mation science, edited by: Toppen, F. and Prastacos, P., 29th April–1st May 2004, Heraklion,Greece, 623–634, 2004.
Thiery, Y., Malet, J.-P., Sterlacchini, S., Puissant, A., and Maquaire, O.: Landslide susceptibilityassessment by bivariate methods at large scales: application to a complex mountainousenvironment, Geomorphology, 92, 38–59, 2007.25
Tsiampaos, G.: Engineering geological characteristics of the Iraklion marls, Crete, PhD Thesis,Technical Chamber of Greece, Iraklion, 358 pp., 1989.
van Westen, C. J.: GIS in landslide hazard zonation: a review, with examples from the Andes ofColombia, in: Mountain environments and geographic information system, edited by: Price,M. and Heywood, I., Taylor and Francis, London, 135–165, 1994.30
van Westen, C. J. and Lulie Getahun, F.: Analyzing the evolution of the Tessina landslide usingaerial photographs and digital elevation models, Geomorphology, 54, 77–89, 2003.
96
NHESSD1, 73–109, 2013
Landslidesusceptibility
mapping in Creteisland
M. Kouli et al.
Title Page
Abstract Introduction
Conclusions References
Tables Figures
J I
J I
Back Close
Full Screen / Esc
Printer-friendly Version
Interactive Discussion
Discussion
Paper
|D
iscussionP
aper|
Discussion
Paper
|D
iscussionP
aper|
van Westen, C. J., Rengers, N., and Soeters, R.: Use of geomorphological information in indi-rect landslide susceptibility assessment, Nat. Hazards, 30, 399–419, 2003.
Ward, T. J., Li, R. M., and Simons, D. B.: Use of a mathematical model for estimating potentiallandslide sites in steep forested drainage basins, IAHS Publication, 132, 21–41, 1981.
Wieczorek, G. F.: Landslide triggering mechanisms, Landslide: Investigation and Mitigation,5
Spec. Rep.-Transp. Res. Board, Nat. Acad. of Sciences, 247, 76–90, 1996.Wieczorek, G. F., Mandrone, G., and DeCola, L.: The influence of hillslope shape on debris-
flowinitiation, in: Debrisflow Hazards Mitigation: Mechanics, Prediction, and Assessment,edited by: Chen, C. L., American Society of Civil Engineers, New York, 21–31, 1997.
WP/WLI (International Geotechnical Societies’ UNESCO Working Party on World Landslide10
Inventory): A suggested method for reporting landslides causes. Bulletin of the InternationalAssociation of Engineering Geology, 50, 71–74, 1994.
Wu, S., Shi, L., Wang, R., Tan, C., Hu, D., Mei, Y., and Xu, R.: Zonation of the landslide hazardin the forereservoir region of the Three Gorges Project on the Yangtze River, Eng. Geol., 59,51–58, 2001.15
Xu, C., Xu, X., Lee, Y. H. , Tan, X., Yu, G., and Dai, F.: The 2010 Yushu earthquake triggeredlandslide hazard mapping using GIS and weight of evidence modeling, Environ. Earth Sci.,66, 1603–1616, doi:10.1007/s12665-012-1624-0, 2012.
Yalcin, A.: GIS–based landslidesusceptibility mapping using analytical hierarchy process andbivariate statistics in Ardesen (Turkey), Comparisons of results and confirmations, Catena,20
72, 1–12, 2008.
97
NHESSD1, 73–109, 2013
Landslidesusceptibility
mapping in Creteisland
M. Kouli et al.
Title Page
Abstract Introduction
Conclusions References
Tables Figures
J I
J I
Back Close
Full Screen / Esc
Printer-friendly Version
Interactive Discussion
Discussion
Paper
|D
iscussionP
aper|
Discussion
Paper
|D
iscussionP
aper|
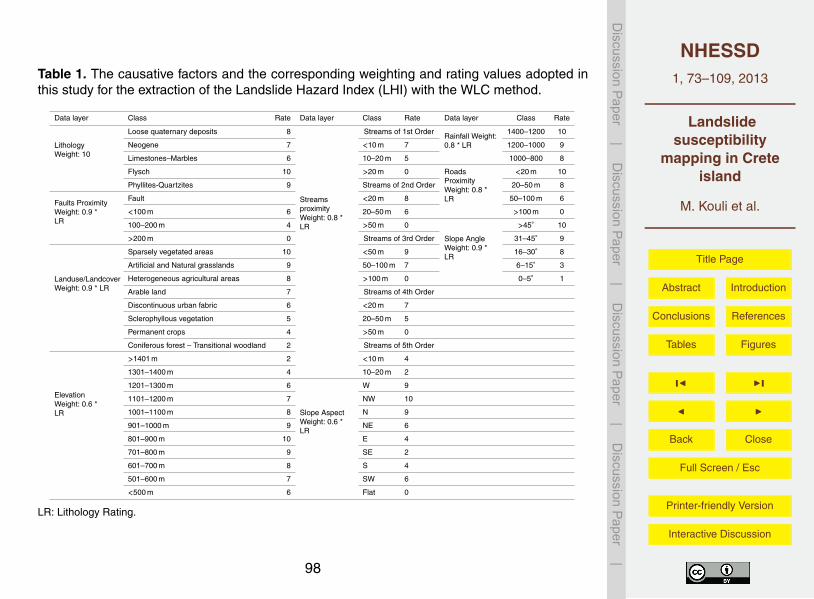
Table 1. The causative factors and the corresponding weighting and rating values adopted inthis study for the extraction of the Landslide Hazard Index (LHI) with the WLC method.
Data layer Class Rate Data layer Class Rate Data layer Class Rate
LithologyWeight: 10
Loose quaternary deposits 8
StreamsproximityWeight: 0.8 *LR
Streams of 1st OrderRainfall Weight:0.8 * LR
1400–1200 10
Neogene 7 <10 m 7 1200–1000 9
Limestones–Marbles 6 10–20 m 5 1000–800 8
Flysch 10 >20 m 0 RoadsProximityWeight: 0.8 *LR
<20 m 10
Phyllites-Quartzites 9 Streams of 2nd Order 20–50 m 8
Faults ProximityWeight: 0.9 *LR
Fault <20 m 8 50–100 m 6
<100 m 6 20–50 m 6 >100 m 0
100–200 m 4 >50 m 0
Slope AngleWeight: 0.9 *LR
>45◦ 10
>200 m 0 Streams of 3rd Order 31–45◦ 9
Landuse/LandcoverWeight: 0.9 * LR
Sparsely vegetated areas 10 <50 m 9 16–30◦ 8
Artificial and Natural grasslands 9 50–100 m 7 6–15◦ 3
Heterogeneous agricultural areas 8 >100 m 0 0–5◦ 1
Arable land 7 Streams of 4th Order
Discontinuous urban fabric 6 <20 m 7
Sclerophyllous vegetation 5 20–50 m 5
Permanent crops 4 >50 m 0
Coniferous forest – Transitional woodland 2 Streams of 5th Order
ElevationWeight: 0.6 *LR
>1401 m 2 <10 m 4
1301–1400 m 4 10–20 m 2
1201–1300 m 6
Slope AspectWeight: 0.6 *LR
W 9
1101–1200 m 7 NW 10
1001–1100 m 8 N 9
901–1000 m 9 NE 6
801–900 m 10 E 4
701–800 m 9 SE 2
601–700 m 8 S 4
501–600 m 7 SW 6
<500 m 6 Flat 0
LR: Lithology Rating.
98
NHESSD1, 73–109, 2013
Landslidesusceptibility
mapping in Creteisland
M. Kouli et al.
Title Page
Abstract Introduction
Conclusions References
Tables Figures
J I
J I
Back Close
Full Screen / Esc
Printer-friendly Version
Interactive Discussion
Discussion
Paper
|D
iscussionP
aper|
Discussion
Paper
|D
iscussionP
aper|
Table 2. The parameters obtained after the application of WoE method for the extraction of theLandslide Hazard Index (LHI). Italics are used for maximum and minimum C values i.e. for theclasses of maximum positive and negative relation with landslide phenomena. Bold type showthe major landslide causal factors based on weight values.
Causative Factors Area (km2) Landslides W + S2 (W +) W − S2 (W −) C S(C) C/S(C)
Slope Angle
0–5◦ 433.209 6 –0.9863 0.4111 0.1366 0.1149 –1.1229 0.4269 -2.63076–15◦ 741.664 26 −0.0359 0.1996 0.0162 0.1327 −0.0522 0.2397 -0.217616–30◦ 810.269 42 0.3727 0.1585 –0.2654 0.1547 0.6381 0.2214 2.881531–45◦ 296.034 9 −0.1832 0.3385 0.0241 0.1169 −0.2073 0.3581 −0.5788>45◦ 60.957 2 −0.1045 0.7190 0.0027 0.1118 −0.1071 0.7276 −0.1472
Slope Aspect
Flat 8.9160 0 0.0000 0.0000 0.0000 0.0000 0.0000 0.0000 0.0000N 290.3968 8 −0.2847 0.3585 0.0348 0.1162 −0.3195 0.3769 −0.8477NE 300.1464 9 −0.1974 0.3384 0.0262 0.1169 −0.2236 0.3581 −0.6244E 316.1248 4 –1.0779 0.5032 0.1006 0.1134 –1.1785 0.5158 –2.2848SE 282.4676 10 −0.0257 0.3220 0.0035 0.1176 −0.0292 0.3428 −0.0852S 256.8408 10 0.0730 0.3226 −0.0093 0.1176 0.0824 0.3433 0.2400SW 262.9152 12 0.2390 0.2955 −0.0343 0.1192 0.2733 0.3186 0.8579W 310.2024 15 0.2996 0.2647 −0.0540 0.1216 0.3536 0.2913 1.2138NW 314.1232 17 0.4183 0.2494 –0.0820 0.1234 0.5003 0.2782 1.7981
Slope curvature
Concave 1031.2840 64 0.5636 0.1291 –0.8386 0.2200 1.4021 0.2551 5.4974Flat 287.2132 1 –2.3775 1.0017 0.1238 0.1114 –2.5013 1.0079 –2.4816Convex 1023.6360 20 −0.6365 0.2258 0.3199 0.1272 −0.9563 0.2592 −3.6898
Unified Geological Formations
Flysch 39.67520 4 1.0603 0.5273 –0.0314 0.1125 1.0917 0.5392 2.0248Neogene Sediments 386.92880 5 −1.0873 0.4501 0.1294 0.1135 −1.2167 0.4642 −2.6210Phyllites-Quartzites 516.83120 59 1.1995 0.1383 –0.9269 0.1939 2.1264 0.2382 8.9270Pindos Carbonates 12.91720 0 0.0000 0.0000 0.0000 0.0000 0.0000 0.0000 0.0000Plattenkalk Limestones 624.70840 4 –1.7961 0.5016 0.2813 0.1132 –2.0774 0.5142 –4.0398Quaternary Deposits 278.53120 7 −0.4097 0.3828 0.0459 0.1148 −0.4556 0.3996 −1.1400Tripolis Carbonates 145.84320 1 −1.7272 1.0034 0.0559 0.1107 −1.7831 1.0095 −1.7663Trypalion Carbonates 295.12680 6 −0.6266 0.4125 0.0676 0.1141 −0.6942 0.4280 −1.6222
Rivers proximity
0–20 m 47.6776 3 1.1189 0.5964 −0.0240 0.1109 1.1429 0.6066 1.884020–50 m 40.8712 3 1.2842 0.5998 –0.0258 0.1109 1.3100 0.6100 2.147650–100 m 88.6980 6 1.1963 0.4228 −0.0510 0.1130 1.2473 0.4376 2.8501>100 m 3829.6956 74 –0.1072 0.1174 1.1972 0.2990 –1.3044 0.3212 –4.0612
Elevation
0–200 679.8496 16 –0.4463 0.2530 0.1398 0.1230 –0.5860 0.2813 –2.0833200–400 437.9756 32 0.7386 0.1836 −0.2741 0.1393 1.0127 0.2305 4.3939400–900 747.9124 30 0.1040 0.1863 −0.0525 0.1372 0.1565 0.2314 0.6765900–1400 287.0952 7 −0.4100 0.3827 0.0466 0.1154 −0.4566 0.3997 −1.14231400–2600 189.3004 0 0.0000 0.0000 0.0000 0.0000 0.0000 0.0000 0.0000
99
NHESSD1, 73–109, 2013
Landslidesusceptibility
mapping in Creteisland
M. Kouli et al.
Title Page
Abstract Introduction
Conclusions References
Tables Figures
J I
J I
Back Close
Full Screen / Esc
Printer-friendly Version
Interactive Discussion
Discussion
Paper
|D
iscussionP
aper|
Discussion
Paper
|D
iscussionP
aper|
Table 2. Continued.
Causative Factors Area (km2) Landslides W + S2 (W +) W − S2 (W −) C S(C) C/S(C)
Faults proximity
0–100 m 419.2144 13 0.3304 0.2818 −0.0489 0.1183 0.3793 0.3056 1.2411100–200 m 318.4616 6 −0.1804 0.4121 0.0149 0.1131 −0.1954 0.4274 −0.4571200–300 m 259.6284 11 0.6542 0.3081 –0.0681 0.1167 0.7223 0.3295 2.1923300–400 m 219.5544 11 0.8300 0.3094 –0.0795 0.1167 0.9095 0.3306 2.7507>400 m 2608.4212 45 –0.2701 0.1504 0.4161 0.1589 –0.6863 0.2188 –3.1371
Land Use
Arable land 6.6524 0 0.0000 0.0000 0.0000 0.0000 0.0000 0.0000 0.0000Artificial, non-agricultural vegetated areas 0.5500 0 0.0000 0.0000 0.0000 0.0000 0.0000 0.0000 0.0000Forests 180.4356 11 0.5087 0.3111 –0.0568 0.1176 0.5656 0.3326 1.7004Heterogeneous agricultural areas 286.4256 15 0.3477 0.2652 –0.0602 0.1208 0.4079 0.2915 1.3994Industrial, commercial and transport units 10.5516 0 0.0000 0.0000 0.0000 0.0000 0.0000 0.0000 0.0000Inland waters 0.1500 0 0.0000 0.0000 0.0000 0.0000 0.0000 0.0000 0.0000Mine, dump and construction sites 2.5700 0 0.0000 0.0000 0.0000 0.0000 0.0000 0.0000 0.0000Open spaces with little or no vegetation 125.4640 4 −0.1700 0.5082 0.0091 0.1126 −0.1791 0.5205 −0.3441Pastures 7.7496 0 0.0000 0.0000 0.0000 0.0000 0.0000 0.0000 0.0000Permanent crops 418.7592 13 –0.1975 0.2818 0.0397 0.1194 –0.2371 0.3060 –0.7749Scrub and/or herbaceous vegetation associations 1223.1444 42 −0.0932 0.1570 0.0979 0.1540 −0.1912 0.2199 −0.8693Urban fabric 26.7620 1 −0.0056 1.0192 0.0001 0.1106 −0.0056 1.0252 −0.0055
Rainfall
800–1000 mm 626.7776 39 0.5664 0.1654 −0.3124 0.1495 0.8788 0.2229 3.94261000–1200 mm 986.0728 33 −0.0840 0.1771 0.0572 0.1414 −0.1412 0.2266 −0.62311200–1400 mm 729.2828 13 –0.7299 0.2799 0.2158 0.1206 –0.9457 0.3047 –3.1035
Roads proximity
<100 m 56.8332 28 3.2377 0.2653 –0.3810 0.1330 3.6188 0.2968 12.1929100–500 m 181.2840 2 −1.2288 0.7110 0.0593 0.1113 −1.2880 0.7197 −1.7897>500 m 2104.0160 56 –0.3322 0.1354 1.3302 0.1953 –1.6624 0.2377 –6.9947
100
NHESSD1, 73–109, 2013
Landslidesusceptibility
mapping in Creteisland
M. Kouli et al.
Title Page
Abstract Introduction
Conclusions References
Tables Figures
J I
J I
Back Close
Full Screen / Esc
Printer-friendly Version
Interactive Discussion
Discussion
Paper
|D
iscussionP
aper|
Discussion
Paper
|D
iscussionP
aper|
Fig. 1. Location maps of the area under investigation.
101
NHESSD1, 73–109, 2013
Landslidesusceptibility
mapping in Creteisland
M. Kouli et al.
Title Page
Abstract Introduction
Conclusions References
Tables Figures
J I
J I
Back Close
Full Screen / Esc
Printer-friendly Version
Interactive Discussion
Discussion
Paper
|D
iscussionP
aper|
Discussion
Paper
|D
iscussionP
aper|
Fig. 2. Geological map of the study area.
102
NHESSD1, 73–109, 2013
Landslidesusceptibility
mapping in Creteisland
M. Kouli et al.
Title Page
Abstract Introduction
Conclusions References
Tables Figures
J I
J I
Back Close
Full Screen / Esc
Printer-friendly Version
Interactive Discussion
Discussion
Paper
|D
iscussionP
aper|
Discussion
Paper
|D
iscussionP
aper|
Fig. 3. Satellite pictures (taken from Google Earth) depicting the location of extensive land-slides at the Chania Prefecture. (A), (B) and (C) indicate transitional landslides occurring atthe Phyllites–Quartzites series. In (D) a domino of successive plane and wedge failures, inPlattenkalk Limestones, caused a 400 m wide cone of debris along the coastline is presented.(E) presents extensive rockfalls along the overthrust of Tripolis carbonates over the Phyllites–Quartzites series.
103
NHESSD1, 73–109, 2013
Landslidesusceptibility
mapping in Creteisland
M. Kouli et al.
Title Page
Abstract Introduction
Conclusions References
Tables Figures
J I
J I
Back Close
Full Screen / Esc
Printer-friendly Version
Interactive Discussion
Discussion
Paper
|D
iscussionP
aper|
Discussion
Paper
|D
iscussionP
aper|
Fig. 4. Details of the faults and rivers proximity maps.
104
NHESSD1, 73–109, 2013
Landslidesusceptibility
mapping in Creteisland
M. Kouli et al.
Title Page
Abstract Introduction
Conclusions References
Tables Figures
J I
J I
Back Close
Full Screen / Esc
Printer-friendly Version
Interactive Discussion
Discussion
Paper
|D
iscussionP
aper|
Discussion
Paper
|D
iscussionP
aper|
Fig. 5. Detail of the slope map of the Chania Prefecture.
105
NHESSD1, 73–109, 2013
Landslidesusceptibility
mapping in Creteisland
M. Kouli et al.
Title Page
Abstract Introduction
Conclusions References
Tables Figures
J I
J I
Back Close
Full Screen / Esc
Printer-friendly Version
Interactive Discussion
Discussion
Paper
|D
iscussionP
aper|
Discussion
Paper
|D
iscussionP
aper|
Fig. 6. The landslide susceptibility map of Chania Prefecture extracted with the WLC method.
106
NHESSD1, 73–109, 2013
Landslidesusceptibility
mapping in Creteisland
M. Kouli et al.
Title Page
Abstract Introduction
Conclusions References
Tables Figures
J I
J I
Back Close
Full Screen / Esc
Printer-friendly Version
Interactive Discussion
Discussion
Paper
|D
iscussionP
aper|
Discussion
Paper
|D
iscussionP
aper|
Fig. 7. The landslide susceptibility map of Chania Prefecture extracted with the WoE method.
107
NHESSD1, 73–109, 2013
Landslidesusceptibility
mapping in Creteisland
M. Kouli et al.
Title Page
Abstract Introduction
Conclusions References
Tables Figures
J I
J I
Back Close
Full Screen / Esc
Printer-friendly Version
Interactive Discussion
Discussion
Paper
|D
iscussionP
aper|
Discussion
Paper
|D
iscussionP
aper|
Fig. 8. The landslide susceptibility map resulted from the combination of the two susceptibilitymodels.
108
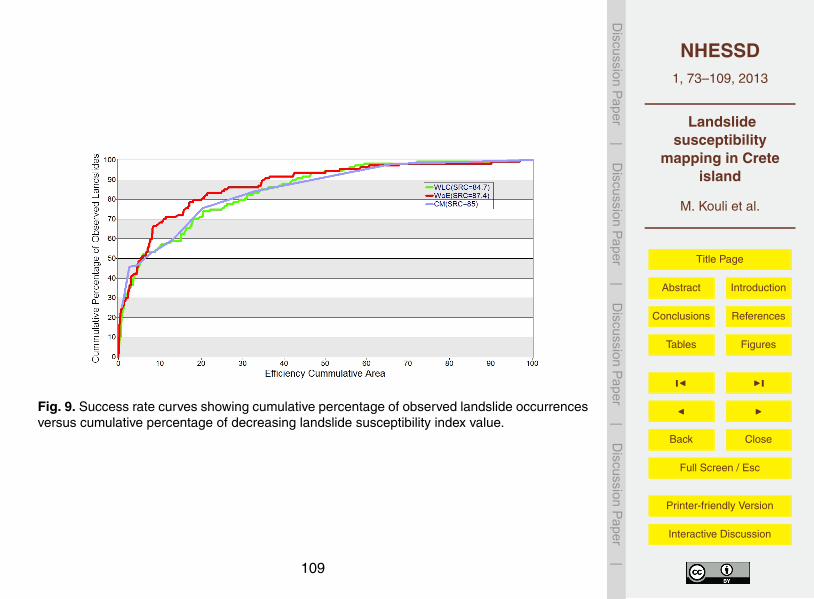
NHESSD1, 73–109, 2013
Landslidesusceptibility
mapping in Creteisland
M. Kouli et al.
Title Page
Abstract Introduction
Conclusions References
Tables Figures
J I
J I
Back Close
Full Screen / Esc
Printer-friendly Version
Interactive Discussion
Discussion
Paper
|D
iscussionP
aper|
Discussion
Paper
|D
iscussionP
aper|
Fig. 9. Success rate curves showing cumulative percentage of observed landslide occurrencesversus cumulative percentage of decreasing landslide susceptibility index value.
109