Embed Size (px)
Citation preview
This is a repository copy of Large-scale genomic analyses link reproductive aging to hypothalamic signaling, breast cancer susceptibility and BRCA1-mediated DNA repair.
White Rose Research Online URL for this paper:http://eprints.whiterose.ac.uk/107830/
Version: Accepted Version
Article:
Day, FR, Ruth, KS, Thompson, DJ et al. (240 more authors) (2015) Large-scale genomic analyses link reproductive aging to hypothalamic signaling, breast cancer susceptibility and BRCA1-mediated DNA repair. Nature Genetics, 47 (11). ISSN 1061-4036
https://doi.org/10.1038/ng.3412
[email protected]://eprints.whiterose.ac.uk/
Reuse
Unless indicated otherwise, fulltext items are protected by copyright with all rights reserved. The copyright exception in section 29 of the Copyright, Designs and Patents Act 1988 allows the making of a single copy solely for the purpose of non-commercial research or private study within the limits of fair dealing. The publisher or other rights-holder may allow further reproduction and re-use of this version - refer to the White Rose Research Online record for this item. Where records identify the publisher as the copyright holder, users can verify any specific terms of use on the publisher’s website.
Takedown
If you consider content in White Rose Research Online to be in breach of UK law, please notify us by emailing [email protected] including the URL of the record and the reason for the withdrawal request.
Large-scale genomic analyses link reproductive ageing to hypothalamic signaling, breast cancer susceptibility and BRCA1-mediated DNA repair
A full list of authors and affiliations appears at the end of the article.# These authors contributed equally to this work.
Abstract
Menopause timing has a substantial impact on infertility and risk of disease, including breast
cancer, but the underlying mechanisms are poorly understood. We report a dual strategy in ~70,000
women to identify common and low-frequency protein-coding variation associated with age at
natural menopause (ANM). We identified 44 regions with common variants, including two
harbouring additional rare missense alleles of large effect. We found enrichment of signals in/near
genes involved in delayed puberty, highlighting the first molecular links between the onset and end
of reproductive lifespan. Pathway analyses revealed a major association with DNA damage-
response (DDR) genes, including the first common coding variant in BRCA1 associated with any
complex trait. Mendelian randomisation analyses supported a causal effect of later ANM on breast
cancer risk (~6% risk increase per-year, P=3×10⁻¹⁴), likely mediated by prolonged sex hormone
exposure, rather than DDR mechanisms.
Introduction
Younger age at natural (non-surgical) menopause (ANM) is associated with lower risk of
breast cancer, but higher risks of osteoporosis, cardiovascular disease and type 2 diabetes 1.
Early menopause also has a substantial impact on fertility. It is estimated that natural fertility
ceases on average 10 years before menopause 2, which is becoming increasingly relevant as
women in many populations are delaying childbearing. For example, the birth rate in British
women aged 30-34 years is now higher than in any other half decade (http://
www.ons.gov.uk/ons/publications/). ANM is on average 51 years in Caucasian populations,
while natural menopause before the age of 40, or primary ovarian insufficiency (POI),
occurs in 1% of the population 3.
Previous genome wide association studies (GWAS) identified 18 common genetic loci
associated with ANM, implicating several plausible gene candidates across a number of
molecular pathways 4,5. Together those reported variants explained <5% of the variation in
Users may view, print, copy, and download text and data-mine the content in such documents, for the purposes of academic research, subject always to the full Conditions of use:http://www.nature.com/authors/editorial_policies/license.html#terms#correspondence to John R.B. Perry ([email protected]).§These authors jointly supervised this work
There are no competing financial interests.
Europe PMC Funders GroupAuthor ManuscriptNat Genet. Author manuscript; available in PMC 2016 May 01.
Published in final edited form as:Nat Genet. 2015 November ; 47(11): 1294–1303. doi:10.1038/ng.3412.
Europe P
MC
Funders A
uthor Manuscripts
Europe P
MC
Funders A
uthor Manuscripts
ANM, compared to 21% explained by all common variants on GWAS arrays 4. We therefore
undertook a more comprehensive genetic analysis in a substantially larger sample of nearly
70,000 women, incorporating both common and, for the first time, low-frequency coding
variants. We were able to triple the number of independent signals associated with ANM,
including two low frequency coding variants in previously unreported loci. Our findings
provide new insights into the causal relationship between ANM with breast cancer and
identify molecular overlaps between ANM and puberty timing.
Results
GWAS HapMap 2 meta-analysis
In a combined analysis of up to 69,360 women of European ancestry (Supplementary Table
1), 1,208 SNPs, among a total of ~2.6 million, reached the genome-wide significance
threshold (P<5×10⁻⁸) for association with ANM. Of these, we identified 54 independent
signals located in 44 genomic regions using approximate conditional analysis implemented
in GCTA (Figure 1, Table 1, Supplementary Tables 2 and 3). Eight loci contained secondary
signals: six loci each contained two signals, and two loci each contained three signals.
Across the 54 identified signals, MAFs ranged from 7% to 49%, and effect sizes from 0.07
to 0.88 years per allele with no significant heterogeneity between studies. All of the 18
previously reported independent signals for ANM 4,5 retained directionally concordant
genome-wide significance (maximum P=3.7×10⁻¹¹). These 18 signals were also
directionally concordant in a sub-meta-analysis of studies that were not included in the
previous publication (P-value range 1×10⁻³⁰ to 1×10⁻³). The top 29,958 independent SNPs
with association P<0.05 explained 21% (SE 9.7%, P=0.01) of the variance in ANM reducing
to 6% (SE 1.6%, P=6.3×10⁻¹²) for the top 54 SNPs with P<5×10⁻⁸ (Supplementary Table
4). This contrasts with an estimate of 2.6% for the previously identified 18 index SNPs.
We assessed functional enrichment of all ANM-SNP associations in regions containing
active histone marks across 10 physiological cell-type groups using stratified LD score
regression 6 (see Methods and Supplementary Table 5). Only the ‘ kidney related cell types’
group showed significant enrichment (P=0.003), which could reflect the mesonephric
embryonic origin of ovarian parenchymal cells 7. Analysis by functional annotation revealed
the strongest enrichment for variants located in UCSC defined coding regions
(Supplementary Table 5), with ~1.5% of SNPs explaining 24.8% of the trait heritability
(P=4.6×10⁻³). The heritable component increased to 55% (SE 11%, P=2.9×10⁻⁷) when a
500bp window was added to the coding regions, capturing ~6.5% of SNPs.
Exome array meta-analysis
To estimate the contribution of low-frequency coding variation to ANM, we performed a
meta-analysis of up to 39,026 women genotyped on exome arrays (Supplementary Table 6).
Only one signal, from two highly correlated (r2=0.73, D’ =1) low-frequency missense
variants in HELB, reached genome-wide significance in this discovery phase (Table 2,
Figure 1, Supplementary Table 7). Ten low-frequency (MAF<5%), non-synonymous SNPs
with association P<5×10⁻⁴ were selected for follow-up in an independent sample of 10,157
women from the deCODE study that imputed rare variant genotypes. Directionally
Day et al. Page 2
Nat Genet. Author manuscript; available in PMC 2016 May 01.
Europe P
MC
Funders A
uthor Manuscripts
Europe P
MC
Funders A
uthor Manuscripts
concordant effect estimates were observed for 6/8 variants (2 of the 10 failed QC). The
combined analysis identified missense alleles in HELB (rs75770066, MAF= 3.6%, beta =
0.85 year/allele, P=1.2×10⁻³¹) and SLCO4A1 (rs140267842, MAF= 0.8%, beta=0.79,
P=1.6×10⁻⁸) as associated with ANM (Table 2, Supplementary Table 7 and Supplementary
Figure 1).
HELB is a DNA helicase that unwinds DNA during replication, transcription, repair and
recombination. SLCO4A1 (solute carrier organic anion transporter family, member 4A1)
transports organic anions such as thyroid hormones and estrone-3-sulfate. Both exome array
signals in HELB and SLCO4A1 were located in ANM loci newly identified by our parallel
HapMap2 GWAS meta-analysis. At HELB the association of the common index SNP,
rs12371165, was fully explained by associations at the two rare exome chip SNPs, which are
in high LD with each other (r2=0.73, D’ =1) (Figure 2). In contrast, the three independent
signal SNPs identified through GCTA were not explained by the rare variant(s)
(Supplementary Table 8). It thus appears there are at least two non-redundant signals at this
locus and future fine-mapping experiments will be required to fully elucidate the number of
independent causal variants. Functional studies have shown that substitution of aspartate by
a non-polar residue at amino acid 506 of HELB affects binding of HELB to Replication
Protein A (RPA) 8. At SLC04A1, all three variants (the common index SNP, second signal
from GCTA and the exomechip variant) appeared to reflect non-redundant signals, such that
the association of each with ANM was unaffected by the presence of either of the others
(Supplementary Table 8).
ANM SNPs strongly enriched in DNA damage-response pathways
Pathway analyses using MAGENTA and GRAIL indicated substantial enrichment of GWAS
SNP associations in DNA damage response (DDR) pathways (Supplementary Tables 9 and
10). Seven of the 10 ANM pathways identified by MAGENTA at study-wise significance
were involved in DDR, with the highest enrichment in the PANTHER defined ‘ DNA Repair
Pathway’ (P=1×10⁻⁶). After annotating likely causal genes at each locus, we found that 29
of the 44 GWAS highlighted regions contained one or more DDR genes within 500kb (Table
1). At 18 of these 29 regions, the DDR candidate was either the nearest gene or the signal
was associated with expression of a DDR gene at the locus.
The top SNP at GWAS Signal #37 (Table 1) was highly correlated (r2>0.95) with four
common non-synonymous variants in BRCA1 [rs1799966, rs16942, rs16941, rs799917],
none of which is listed in HGMD (www.hgmd.cf.ac.uk/) as a known breast cancer
susceptibility variant and all of which are listed as “not clinically important” on the Breast
Information Core http://research.nhgri.nih.gov/bic/. In our exome array data, no low
frequency coding variants in BRCA1 were associated with ANM (P>0.05). Signal #37 was
an eQTL for BRCA1 in multiple tissues, including: blood, skin, adipose and brain
(Supplementary Table 11). There were 15 ANM signal genes that STRING analysis
identified as having at least one direct link to BRCA1 (Supplementary Table 12,
Supplementary Figure 2). Of these, there is experimental evidence that 7 code for direct
binding partners of BRCA1: BRE (Signal #5), MSH6 (Signal #6), POLR2H (Signal #8),
Day et al. Page 3
Nat Genet. Author manuscript; available in PMC 2016 May 01.
Europe P
MC
Funders A
uthor Manuscripts
Europe P
MC
Funders A
uthor Manuscripts
FAM175A (Signal #9), UIMC1 (Signal #13), RAD51 (Signal #30), and CHEK2 (Signal
#43).
While many of the DDR genes highlighted are involved in homologous recombination for
repair of double strand breaks, such as the BRCA1 pathway, other mechanisms of repair are
also represented, eg. mismatch repair (MSH5, MSH6) and base excision repair (APEX1,
PARP2) (Figure 3). Two genes act as DNA damage checkpoints (CHEK2 and BRSK1), others are involved in the cellular response to damage, such as cell cycle arrest, DNA
replication, transcription control and apoptosis (Figure 3). CHEK2 is a well-known breast
cancer associated gene 9, but the ANM-associated signal was not in LD with the 1100delC
variant associated with breast cancer (r2<0.01).
ANM SNPs enriched in known POI genes
In addition to the DDR pathways, MAGENTA analyses also identified a four-fold
enrichment of ANM GWAS SNP associations located in/near a set of 31 genes reportedly
associated with monogenic primary ovarian insufficiency (Supplementary Tables 13 &14).
Four of our genome-wide significant hits were located in or near reported POI genes.
Autosomal recessive mutations in MCM8 cause primary amenorrhea, hypothyroidism, and
hypergonadotropic hypogonadism 10. Recessive mutations in EIF2B4 (signal #5) cause
ovarioleukodystrophy with vanishing white matter syndrome 11. POLG (signal #31)
mutations have been linked to POI in isolation or associated with other neurologic
conditions 12. Mutations in MSH5 (Signals #15a and #15b) have been associated with
various human diseases including POI 13. In addition, TDRD3 (Signal #28) is a primary
binding partner of FMR1 in which triplet repeat premutations are a risk factor for POI 14.
We saw no significant enrichment of ANM signals in our wider panel of ovarian function
genes (Supplementary Tables 13 and 15).
Genetic correlation of ANM with other traits/diseases
We searched the GRASP database 15 and NHGRI catalogue (http://www.genome.gov/
gwastudies/) for pleiotropy between ANM signals and proxies (r2>0.5) with other GWAS
traits (Supplementary Table 16). The top overlapping signals were for liver enzymes, lipids,
urate, height and fasting glucose (p=<10−10 for association of ANM SNP/proxy and second
trait). We found no overlap with any autoimmune traits and only a very weak link with any
cancer (upper airway tract cancer, p=1×10⁻⁸). To test the relationship between ANM and
other health outcomes more broadly, we performed cross-trait LD score regression to
estimate genetic correlation with 53 published GWAS meta-analyses (Supplementary Table
17). Adult obesity ranked highest in this analysis with a negative trait correlation (rg=−0.15,
P=0.0004) with supporting evidence from other growth/anthropometric traits including age
at menarche (rg=0.14, P=0.003), BMI (rg=−0.13, P=0.003), BMI in women but not men
(P=0.002 vs 0.17), waist circumference in women but not men (P=0.009 vs 0.29) and WHR
in men but not women (P=0.03 vs 0.27). Other nominally significant associations include
HDL (rg=0.14, P=0.02) and current/former smoking status (rg=0.20, P=0.04) both of which
are supported by epidemiological observations 16.
Day et al. Page 4
Nat Genet. Author manuscript; available in PMC 2016 May 01.
Europe P
MC
Funders A
uthor Manuscripts
Europe P
MC
Funders A
uthor Manuscripts
To elucidate the causal directions between these traits, we performed bi-directional
Mendelian randomisation (MR) analyses on ANM with both age at menarche and BMI. We
were unable to resolve the causal direction with BMI (BMI to ANM: Pscore= 0.668
(Supplementary Table 18); ANM to BMI: PBinomial=0.683, (Supplementary Table 19).
However the 123 reported menarche SNPs collectively predicted ANM in the expected
direction (Pscore=0.0005, Supplementary Table 20), but the ANM SNP score was not
associated with age at menarche (Pscore = 0.571, Supplementary Table 21). We further
explored the nature of this shared genetic architecture by testing for enrichment of all ANM-
associated SNPs in/near genes implicated in monogenic or polygenic puberty timing 17.
Significant enrichment was found with the monogenic set (P=0.01), underscored by ANM-
associated SNPs in/near five genes reportedly causal for hypogonadotrophic hypogonadism
(KISS1R, TAC3, CHD7, SOX10 and FGFR1) (Supplementary Table 22).
ANM variants demonstrate causal link with breast cancer
Given the overwhelming enrichment of DDR genes and known epidemiological associations
between ANM and breast cancer risk 18, we tested the causal relationships between these
traits using a Mendelian Randomization approach 19.
Across the 56 ANM SNPs (54 HapMap 2 + 2 exome) there was a positive correlation
between the effect sizes on ANM and the effect sizes for risk (logORs) of breast cancer (in
46,347 breast cancer cases and 41,736 controls from Breast Cancer Association Consortium
(BCAC); r=0.67, P=2.25×10⁻⁸). A polygenic risk score comprising numbers of ANM-
increasing alleles at the 56 SNPs, weighted by the effect size on ANM, was positively
associated with breast cancer risk; each one-year older genetically predicted ANM was
associated with a OR=1.064 higher breast cancer risk (1.050-1.081), P=2.78×10⁻¹⁴
(Supplementary Figure 3). This effect size is larger than that reported by the largest pooled
analysis of observational epidemiological studies (OR=1.030 (1.026-1.034)) 18. All of the
women in the GWAS from the BCAC study were also included in the Mendelian
randomization (MR) study (N=14884, ~14% of total MR study). To confirm that this overlap
did not bias our results we conducted two analyses. Firstly, a sensitivity analysis tested the
effect on breast cancer of 18 previously identified ANM SNPs, which were identified from a
meta-analysis that did not include BCAC cases, and a similar effect estimate was observed
(OR 1.062 [1.033-1.101, P=1.58×10⁻⁷]) Secondly, the reverse analysis tested 63 SNPs with
independent robust associations with breast cancer 20, and found no association between
these breast cancer signals and ANM (Pscore >0.05), which reduces the likelihood of case-
ascertainment bias in our discovery meta-analysis (Supplementary Table 23).
Stratified analyses revealed significantly larger effect estimates for the ANM risk score in
ER positive vs ER negative breast cancer cases (OR=1.07 (1.05-1.10) P=1.73×10⁻¹² vs
OR=1.03 (1.00-1.07) P=0.043; P=0.0086 for the case-only analysis) and women aged >=55
vs <=45 years (OR=1.06 (1.04-1.10) P=2.23×10⁻⁷ vs OR=1.00 (0.97-1.05) P=0.95, case-
only P=2.30×10⁻⁵). Consideration of DDR vs non-DDR linked SNPs in the polygenic risk
score also produced discordant effect estimates (OR 1.05 [1.03-1.08], p=1.06×10⁻⁷ vs OR
1.12 [1.06-1.21], P=7.84×10⁻¹⁰ respectively, Phet=0.01), a difference which was further
reinforced in the age stratified analyses (Supplementary Figure 3 and Table 24).
Day et al. Page 5
Nat Genet. Author manuscript; available in PMC 2016 May 01.
Europe P
MC
Funders A
uthor Manuscripts
Europe P
MC
Funders A
uthor Manuscripts
Furthermore, lack of association between ANM risk scores with risk of prostate cancer in
men (in 25,074 cases and 24,272 controls) (P=0.36, Supplementary Table 25) provides no
evidence to support an effect of ANM-related DDR mechanisms on other cancer risks. We
therefore surmise that ANM genetic variants influence breast cancer risk primarily through
variation in menopause timing.
Discussion
Our study represents a largely expanded genetic discovery effort for ANM, both in terms of
increased sample size and breadth of variation tested. By more than doubling the GWAS
sample size we have increased the number of loci robustly associated with the trait three-
fold. In addition, we assessed the role of low-frequency protein coding variation using
exome genotyping arrays. This approach identified the first such variants of large effect for
ANM, implicating both HELB and SLC04A1 in the aetiology of reproductive ageing. Both
of these regions contain common variants we identified in parallel, producing “synthetic
associations” at the HELB locus 21.
Our analyses suggest a far more substantial role for DNA damage response processes in
ovarian ageing than originally estimated. Both manual assessment and formal computational
approaches identified an overwhelming excess of DDR genes mapping to the 44 GWAS loci,
possibly explaining up to ~2/3rds of the associations. Despite the limitations of our GWAS
approach to map definitively SNPs to genes, 19/44 loci contained signal SNPs where
plausible DDR candidates were either the closest gene or linked via altered expression levels
to the associated variant. This level of enrichment is comparable to that observed in GWAS
meta-analyses of several cancers 22,23.
A notable inclusion in our list of DDR annotated genes was BRCA1, which was the nearest
gene, linked as an eQTL and contained multiple non-synonymous SNPs in high LD with the
lead index SNP. Although rare loss of function alleles are well studied in the context of
cancer pre-disposition, coding variants in BRCA1 are generally regarded as neutral and have
not been previously mapped to any complex trait or disease, including breast cancer. Titus et al have shown that BRCA1 expression decreases in human ovaries with age and that reduced
brca1 expression in mouse models leads to reduced ovarian reserve 24. This is consistent
with our data, where the ANM-lowering allele reduces expression in blood. BRCA1 directly
inhibits a functional interaction with oestrogen receptor ウ and thus BRCA1 variants could
also affect ANM through altered oestrogen signalling 25. Of the 34 DDR genes highlighted
in Table 1, 15 have experimental links to BRCA1, three of which form part of the BRCA1-A
complex; BRE (BRCC45), FAM175A (Abraxas) and UIMC1 (RAP80). While dispensable
for BRCA1’ s major tumour suppressive role in promoting DNA double-strand break repair
by homologous recombination (HR), the BRCA1-A complex components RAP80 and
Abraxas are actually involved in counteracting this activity, restricting BRCA1-dependent
HR to appropriate levels 26. Similarly, the DNA helicase Fbh1 (FBXO18; Signal #20)
negatively regulates HR 27,28. While HR is essential for cell viability, such anti-recombinase
activities are also important for maintaining genome stability, and failure of this regulation is
associated with inappropriate recombination events, and the accumulation of toxic
Day et al. Page 6
Nat Genet. Author manuscript; available in PMC 2016 May 01.
Europe P
MC
Funders A
uthor Manuscripts
Europe P
MC
Funders A
uthor Manuscripts
recombination intermediates, DNA repair activities associated with driving translocations,
loss-of-heterozygosity, and chromosomal abnormalities 29.
Double strand break repair is an important response to metabolic and environmental damage
to DNA, but is also a key process in meiosis for resolving recombination events. Aberrant
meiotic recombination is known to cause meiotic arrest and affect the viability of oocytes.
Menopause occurs when the number of oocytes in the ovary falls below a threshold number
(approx. 1000) and thus processes that affect the size of the oocyte pool will affect timing of
menopause. Recent studies have shown that recessive mutations in both MCM8 and MCM9 results in genomic instability, caused by a deficiency in double strand break repair, which
has a devastating effect on the oocyte pool, causing POI 10,30. MCM8 is one of the genes
highlighted in our study (signal #41) and a further 12 are also involved in homologous
recombination repair, including two which are specific for meiotic repair (MSH5 and DMC1 (DNA meiotic recombinase 1)). Thus double strand break repair, during recombination, at
meiosis, appears to be a major mechanism by which oocyte numbers are regulated, thus
determining depletion of the oocyte pool and ANM.
In this study, however, the repair mechanisms highlighted are not confined to homologous
recombination repair; mismatch repair and base excision repair are also implicated, as well
as mitotic repair and repair checkpoints. Thus it appears that the mechanisms are not
confined to repair of meiotic cross-overs, but more general mechanisms are also involved.
Seven million oogonia are produced during fetal development by mitosis. Inefficient repair
of DNA damage during these mitotic events could result in apoptosis and thus a reduction in
the initial oocyte pool. Loss of oocytes throughout female life is predominantly by atresia
rather than ovulation. It is likely that oocytes are particularly sensitive to DNA damage due
to the prolonged state of cell cycle arrest, lasting up to 50-60 years. Thus aberrant repair
throughout life could affect the rate of atresia and thus ANM.
Several of the genes highlighted in our study are robust cancer predisposition genes, eg.
BRCA1, CHEK2 and MSH6. Additionally BCAR4 and STARD3 have also been linked with
breast cancer predisposition. However common susceptibility variants have not been mapped
to any of these genes through GWAS approaches for any cancer [www.genome.gov/
gwastudies/]. Patients with known pathogenic BRCA1 breast cancer predisposition
mutations, have been reported to have lower ANM 31, although other studies have failed to
replicate these findings 32.
We found that carrying higher numbers of ANM-increasing variants was associated with
increased breast cancer risk. This was consistent with (indeed slightly larger than) the
observed epidemiological association. Our Mendelian randomization approach indicates a
causal relationship between ANM and breast cancer risk, with prolonged oestrogen and/or
progesterone exposure likely to be the mechanism 33. Consistent with this, the effect size
was greater for ER-positive than ER-negative breast cancer.
At first sight, this observation might appear paradoxical given the enrichment of DDR genes
associated with menopause. However, we noted that the association between ANM variants
and breast cancer risk was weaker for those in/near DDR genes than those in the non-DDR
Day et al. Page 7
Nat Genet. Author manuscript; available in PMC 2016 May 01.
Europe P
MC
Funders A
uthor Manuscripts
Europe P
MC
Funders A
uthor Manuscripts
set. This raises the possibility that the DDR variants that reduce menopausal age do
modestly increase breast cancer risk, but this is counterbalanced by the larger effect due to
altered hormonal exposure. Alternatively, it is possible that variants in the non-DDR set may
have a residual effect on breast cancer risk through hormonal or other mechanisms, or that
both mechanisms could play a role (supplementary Figure 4). BRCA1 mutations are known
to be risk factors for prostate cancer 34 and yet we found no association with prostate cancer
predisposition for the ANM variants, supporting the hypothesis that the breast cancer
association is mediated via menopause and not a direct effect of the DDR variants. That the
effect of the ANM polygenic risk score on breast cancer risk was larger than that predicted
from observation studies might indicate measurement error in the reporting of age at
menopause or residual negative confounding in epidemiological studies; in either case, the
Mendelian Randomisation analysis performed here using the polygenic risk score as an
instrumental variable can give a more accurate estimate of the effect of age at menopause on
breast cancer risk. Such measurement error would also be present in studies in the ANM
GWAS from which the polygenic risk score weights were derived, hence the ‘ true’ effect of
later menopause on breast cancer risk may actually be larger even than the ~6% increase in
risk/year predicted here.
Our findings provide novel evidence for a neural influence on the timing of ovarian follicular
ageing. Until now, it has been considered that hypothalamic/pituitary activity in relation to
the menopause is simply secondary to the loss of feedback inhibition by ovarian
hormones 35. We identified five ANM loci containing genes reported causal for
hypogonadotrophic hypogonadism. Of these, monogenic disruption of three (CHD7, FGFR1 and SOX10) are causes of Kallman syndrome, characterized by anosmic hypogonadotrophic
hypogonadism due to failure of embryonic migration of GNRH secreting neurons from the
olfactory bulb to the hypothalamus 36. In addition, KISS1R (GPR54) encodes the receptor
for kisspeptin, a key hypothalamic activator of the reproductive hormone axis, and TAC3 encodes neurokinin B, which is highly expressed in hypothalamic neurons that also express
kisspeptin and promotes the pulse frequency of luteinising hormone (LH) secretion from the
pituitary. A possible central influence on ovarian ageing is also supported by the ANM locus
in/near FSHB (which is reportedly also associated with circulating FSH levels).
Alternatively, recent studies have identified expression of TAC3, KISS1R and kisspeptin in
ovarian granulosa cells 37, suggesting peripheral actions of these neuropeptides and their
receptors 38. Indeed, GPR54-haploinsufficiency in mice leads to progressive oocyte and
follicle loss without affecting gonadotropin secretion 38. Regardless of their site of action,
our findings indicate several mechanisms that could link the regulation of puberty to ANM,
and therefore impact both the start and end of the female reproductive lifespan.
In summary, our findings suggest a surprisingly narrow range of biological pathways
governing ANM, highlighting a substantial role for DNA damage response in the aetiology
of ovarian ageing. We demonstrate the utility of genetics to inform epidemiological
observations, revealing shared biological pathways linking puberty timing, breast cancer and
reproductive ageing.
Day et al. Page 8
Nat Genet. Author manuscript; available in PMC 2016 May 01.
Europe P
MC
Funders A
uthor Manuscripts
Europe P
MC
Funders A
uthor Manuscripts
Online Methods
Menopause data collection
ANM was self-reported and defined as the age at last naturally occurring menstrual period
followed by at least 12 consecutive months of amenorrhea. Recall bias/error for ANM may
have reduced our power to detect associations, but would be unlikely to introduce systematic
error. We assessed this issue in our previous meta-analysis and found no significant
differences in effect estimates when considering retrospective versus prospective studies 4.
We included women with ANM 40–60 years in our analyses, excluding those with
menopause induced by hysterectomy, bilateral ovariectomy, radiation or chemotherapy, and
those using hormone replacement therapy (HRT) before menopause (Supplementary Table
1). Within each of the included studies, each participant provided written informed consent
and the study protocol was approved by the Institutional Review Board at the parent
institution.
GWAS
A total of 33 studies contributed genome-wide association data using self-reported ANM
(Supplementary Table 1). One of the 33 studies was from the Breast Cancer Association
Consortium (BCAC), comprising 17 separate studies with menopause data, genotyped using
an Illumina iSelect array (iCOGs) 20. This resulted in a maximum total sample of 69,360
individuals of European descent. Studies were asked to use the full imputed set of HapMap
Phase 2 autosomal SNPs, and to run an additive model including top principal components
and study specific covariates.
In some cases, studies submitted data using 1000 Genomes based imputation; in these cases
SNPs not included in the HapMap 2 set were removed. Once data were submitted, each
study was quality controlled centrally according to standard QC protocols independently by
two analysts. SNPs were filtered out if the minor allele frequency (MAF) was less than 1%,
or if the imputation quality metrics were low (imputation quality<0.4). Studies and SNPs
passing QC were combined using an inverse-variance weighted meta-analysis, implemented
using METAL 39. Again, this meta-analysis was run by two analysts independently, who
then separately used PLINK clumping commands 40 to identify the most significant SNPs in
associated regions (termed “Index SNPs”), using only those SNPs which had data from more
than 50% of the studies. SNPs were considered genome-wide significant if p<5×10⁻⁸ (p of
0.05 Bonferroni corrected for a million tests). Comparisons were made to ensure
concordance of the identified signals between the two independent analysts.
Exome chip
Exome genotyping data were analysed for 22 studies of European ancestry, with
questionnaire data on ANM (Supplementary Table 6). Genotype calling was performed
using the CHARGE (Cohorts for Heart and Aging Research in Genomic Epidemiology)
joint calling protocol, including X chromosome variants. Each contributing study carried out
study-level analysis in the R-packages skatMeta or seqMeta using the skatCohort command
with the top genetic principal components included in the model and alleles coded according
to a common reference file (SNPInfo_HumanExome-12v1_rev5.tsv.txt from http://
Day et al. Page 9
Nat Genet. Author manuscript; available in PMC 2016 May 01.
Europe P
MC
Funders A
uthor Manuscripts
Europe P
MC
Funders A
uthor Manuscripts
www.chargeconsortium.com/main/exomechip) 41. Following data submission, two data
analysts carried out checks to ensure consistency of allele coding. We carried out a single
variant meta-analysis in METAL 39, giving a total sample size of 39,026, with associations
considered significant if p<5×10⁻⁸. Variants were put forward for replication in the deCODE
study (n=10,157) if they were present in more than half of studies in the discovery stage and
had p<5×10⁻⁵ if MAF was less than 1% or p<5×10⁻⁴ if MAF was 1–5%.
Selection of independent signals / conditional analysis
Independent signals (termed “Signal SNPs”) for ANM were identified using approximate
conditional analysis implemented in the GCTA software package 42. Linkage disequilibrium
(LD) between variants was estimated using three independently genotyped studies as
reference panels - the Rotterdam Study I (N=5,974) and two EPIC-InterAct datasets
(N=7,397 and N=9,294); these comprised males and females of European ancestry with
GWAS data imputed using CEU haplotypes from HapMap 2. We assumed zero correlation
between SNPs more than 10 Mb apart or on different chromosomes. We considered
independent signals to be those observed by at least two of the three LD reference panels
and located in a 10 Mb region that contained a genome-wide significant SNP based on
univariate test statistics.
We assessed the independence between exome array and HapMap 2 signals by performing
formal conditional analyses in the Women’ s Genome Health Study (WGHS, N=11,664).
Regression was performed including all significant index SNPs in additive models, including
the same study covariates as used in the primary analysis. LD computation in
Haploview 43used experimental genotypes where possible (the rare exome chip variants and
the common variants rs3741604 and rs2236553), but HapMap 2 imputed genotypes for the
other common variants (MaCH v. 1.0.16, all Rsq >0.99).
Gene identification
At each locus identified by the GWAS meta-analysis, we annotated the likely causative
gene(s) (Supplementary Table 3) using the following criteria: identified in at least one of the
gene prioritisation/pathway programs (GRAIL or STRING), the top SNP or a proxy (r2>0.8)
was an eQTL in one of 108 tissues, the top SNP or a proxy (r2>0.8) was a coding variant
(Supplementary tables 9-12, 26, 27, Supplementary Figure 5). In case of overlap between
the results of the GWAS and exome analyses, the gene indicated by the exome array analysis
was chosen. Further manual annotation was used to select additional likely candidates based
on known biology (e.g monogenic primary ovarian insufficiency) or biology highlighted by
hypothesis-free pathway testing (Supplementary Table 15). If no candidate was identified by
these methods the nearest gene was chosen.
GRAIL is a literature based text mining program used to suggest the mostly likely casual
gene at each locus 44, controlling for gene size and without any seed regions. A GRAIL p-
value < 0.05 was taken to indicate a suggested causal gene (Supplementary Table 9). All
genes located within 500kb of the top SNP at each locus were assessed using the STRING
program (http://string-db.org/), which was used to highlight any connectivity between genes
in different regions (Supplementary Table 12).
Day et al. Page 10
Nat Genet. Author manuscript; available in PMC 2016 May 01.
Europe P
MC
Funders A
uthor Manuscripts
Europe P
MC
Funders A
uthor Manuscripts
Expression quantitative trait loci (eQTL)
Each independent SNP signal was assessed in over 100 separate eQTL datasets
(Supplementary methods and Table 11 for details 45). If an independent signal SNP was in
high LD (r2>0.8; using SNAP http://www.broadinstitute.org/mpg/snap/) with the most
significant signal for an eQTL, then the eQTL gene was highlighted as a potential causal
candidate. The collected eQTL results met criteria for statistical thresholds for association
with gene transcript levels as described in the original papers.
Pathway identification
We tested for signal enrichment across 2,580 pre-defined biological pathways in GO,
KEGG, Ingenuity, Panther, Reactome and Biocarta using MAGENTA 46 using the full
HapMap Phase 2 imputed meta-analysis (Supplementary Table 10). Analysis was performed
using the same default settings as described in our previous paper 4, with study-wise
significance declared at an FDR<0.05. In addition to these pre-defined pathways, we also
tested four custom pathways comprised of genes involved in POI (N=31), ovarian function
(N=130), monogenic disorders of puberty (N=21) and age at menarche (N=154)
(Supplementary Tables 13-15, 22).
Estimating variance explained by SNP sets
An estimate of the total variance explained by highlighted ANM SNPs was calculated using
REML (restricted maximum likelihood) implemented in GCTA 42. Using individual level
data from the EPIC-InterAct cohort (N=1,761), we calculated the attributable variance for
the genome-wide significant SNPs and at varying significance thresholds (5 × 10⁻⁷, 5 ×
10−6, 5 × 10⁻⁵, 5 × 10⁻⁴, 0.005, 0.05, and all SNPs passing QC) obtained from a repeated
meta-analysis excluding EPIC-InterAct.
We used stratified LD score regression to quantify evidence of functional enrichment
specific to groups of cell types 6. We used the same baseline model as in Finucane et al. 6
which comprises 53 overlapping categories including basic annotations such as coding,
UTR, promoter, and intron, as well as several histone marks, DNase I Hypersensitivity Site
(DHS) regions, chromHMM predictions 47, regions that are conserved in mammals 48, super
enhancers 49, and FANTOM5 enhancers 50. We evaluated enrichments for each of these non-
cell-type specific categories. We then took 230 cell-type-specific annotations in four histone
marks-H3K4me1, H3K4me3, H3K9ac 51 and H3K27ac 52 (Supplementary Table 5), and
grouped them into 10 cell-type groups, (adrenal/pancreas; central nervous system;
cardiovascular; connective/bone; gastrointestinal; immune/hematopoietic; kidney; liver;
skeletal muscle; other) 6. We added each cell-type group to the baseline model one at a time
and measured the p-value of the resulting LD Score regression coefficient of the cell-type
group using the −h2 flag in ldsc (https://github.com/bulik/ldsc) with LD Scores from 1000G
Genomes Europeans [http://www.1000genomes.org/]. We ranked the cell-type groups by
whether the per-SNP heritability in the ‘ functional’ annotation was larger than the per-SNP
heritability outside this annotation, controlling for the other annotations in the baseline
model.
Day et al. Page 11
Nat Genet. Author manuscript; available in PMC 2016 May 01.
Europe P
MC
Funders A
uthor Manuscripts
Europe P
MC
Funders A
uthor Manuscripts
Breast and prostate cancer Mendelian Randomisation (MR)
To assess the association of the ANM SNPs with breast cancer risk, we used breast cancer
cases (n=46,347) and controls (n=41,736) of European ancestry from 41 studies in the
BCAC, who had been genotyped using a custom Illumina Infinium array (iCOGS).
Following standard quality control exclusions (as described in 20) genotypes were available
for 199,961 SNPs. Further genotypes were imputed in a two-stage procedure using
SHAPEIT and IMPUTEv2 53 with the 1000 Genomes Project March 2012 release as the
reference dataset 54, giving ~11.6 million SNPs with imputation r2>0.3 and MAF>0.005.
The 4,747 breast cancer cases and 7,285 controls in the BCAC dataset for whom ANM
information was available had also been included in the ANM GWAS analysis.
The genotypes or imputed genotype dosages for the 56 significant SNPs in Tables 1 and 2
were used to construct a polygenic risk score for each breast cancer case and control, such
that for the ith woman
where エj is the ANM regression coefficient for the effect allele of the jth SNP (conditional エs
were used for the correlated SNPs) and Gij is the number of copies of the effect allele at the
jth SNP carried by the ith woman (Gij is between 0 and 2).
The association between the polygenic risk score and breast cancer was tested using
unconditional logistic regression, adjusting for study and for seven principal components (as
estimated based on a subset of 37,000 uncorrelated markers including ~1000 selected as
ancestry informative markers). The log(OR) was scaled according to the effect size of a one-
unit increase in polygenic risk score on ANM in control subjects, so as to obtain an
estimated logOR for a one-year increase in genetically predicted ANM. Hence the polygenic
risk score can be thought of as an instrumental variable in a Mendelian Randomisation of
ANM against breast cancer.
Additional analyses were conducted specifically for estrogen receptor (ER) positive
(N=27,026) or ER negative (N=7,401) cases, and for participants with age at diagnosis (for
cases) or interview (for controls) ≤45 years (8,547 cases and 8,029 controls) or ≥55 years
(24,841 cases and 20,410 controls)(as a surrogate for pre- or post-menopausal age at
diagnosis, because ANM was not known for all participants), with heterogeneity evaluated
in case-only analyses.
We also tested the association of ANM SNPs on prostate cancer risk, to determine whether
any effect of genetic variants was specific to breast cancer. Prostate cancer data were
available from a similar sample size to breast cancer and there is known overlap in genetic
risk for breast and prostate cancer. Individual level data was not available for prostate cancer,
we therefore assessed the impact of ANM using an approximated allele score comprised of
the 54 HapMap2 GWAS SNPs on summary level results 55. The score was assessed using
summary statistics from a recent prostate cancer meta-analysis, comprising 25,074 cases and
Day et al. Page 12
Nat Genet. Author manuscript; available in PMC 2016 May 01.
Europe P
MC
Funders A
uthor Manuscripts
Europe P
MC
Funders A
uthor Manuscripts
24,272 controls from 32 studies in the PRACTICAL Consortium 56, genotyped using the
iCOGs array, with quality control and imputation carried out in the same way as for the
BCAC iCOGs study.
Genetic correlation with additional traits
Cross-trait LD score regression was used to estimate the genetic correlation between
menopause timing and 54 individual traits from published studies including anthropometric
and metabolic traits 57. We estimated genetic correlations with the method described in 58
and the --rg flag in the ldsc software package (https://github.com/bulik/ldsc) with LD Scores
from 1000 Genomes Europeans and default settings. Briefly, this method regresses the
product of effect size estimates for trait 1 and trait 2 for each SNP against LD Score. The
product of the slope and a constant estimates the genetic correlation, and the intercept
estimates the product of the number of overlapping samples and the correlation between
phenotypes among the overlapping samples.
Bi-directional Mendelian randomisation analyses on ANM with age at menarche and BMI
were carried out using similar methods as for prostate cancer, with a weighted allele score 55
generated from summary statistics. Information on the associations with age at menarche
came from the most recent genome-wide association study for the trait (N=182,416 women
from 57 studies) 17. The BMI data were taken from the most recent analysis (N=249,796
from 64 studies) 59. While it was possible to calculate a full allele score for the genome-wide
significant BMI SNPs to ANM analysis, this was not possible for the ANM SNPs to BMI
analysis; instead a binomial test of consistency of effect direction was used.
Supplementary Material
Refer to Web version on PubMed Central for supplementary material.
Authors
Felix R. Day#1, Katherine S. Ruth#2, Deborah J. Thompson#3, Kathryn L. Lunetta4,5, Natalia Pervjakova6,7, Daniel I. Chasman8,9, Lisette Stolk10,11, Hilary K. Finucane12,13, Patrick Sulem14, Brendan Bulik-Sullivan15,16,17, Tõnu Esko6,18,19,20, Andrew D. Johnson5, Cathy E. Elks1, Nora Franceschini21, Chunyan He22,23, Elisabeth Altmaier24,25,26, Jennifer A. Brody27, Lude L. Franke28, Jennifer E. Huffman5,29, Margaux F. Keller30, Patrick F. McArdle31, Teresa Nutile32, Eleonora Porcu33,34,35, Antonietta Robino36, Lynda M. Rose8, Ursula M. Schick37, Jennifer A. Smith38, Alexander Teumer39, Michela Traglia40, Dragana Vuckovic36,41, Jie Yao42, Wei Zhao38, Eva Albrecht25, Najaf Amin43, Tanguy Corre44,45, Jouke-Jan Hottenga46, Massimo Mangino47,48, Albert V. Smith49,50, Toshiko Tanaka51, Goncalo Abecasis35, Irene L. Andrulis52,53, Hoda Anton-Culver54, Antonis C. Antoniou3, Volker Arndt55, Alice M. Arnold56, Caterina Barbieri36,40, Matthias W. Beckmann57, Alicia Beeghly-Fadiel58, Javier Benitez59,60, Leslie Bernstein61, Suzette J. Bielinski62, Carl Blomqvist63, Eric Boerwinkle64,65, Natalia V. Bogdanova66, Stig E. Bojesen67,68, Manjeet K. Bolla3, Anne-Lise Borresen-Dale69,70, Thibaud S Boutin29, Hiltrud Brauch71,72,73, Hermann Brenner55,73,74,
Day et al. Page 13
Nat Genet. Author manuscript; available in PMC 2016 May 01.
Europe P
MC
Funders A
uthor Manuscripts
Europe P
MC
Funders A
uthor Manuscripts
Thomas Brüning75, Barbara Burwinkel76,77, Archie Campbell78, Harry Campbell79, Stephen J. Chanock80, J. Ross Chapman81, Yii-Der Ida Chen42, Georgia Chenevix-Trench82, Fergus J. Couch83, Andrea D. Coviello84, Angela Cox85, Kamila Czene86, Hatef Darabi86, Immaculata De Vivo12,87, Ellen W. Demerath88, Joe Dennis3, Peter Devilee89,90, Thilo Dörk91, Isabel dos-Santos-Silva92, Alison M. Dunning93, John D. Eicher5, Peter A. Fasching57,94, Jessica D. Faul95, Jonine Figueroa96, Dieter Flesch-Janys97,98, Ilaria Gandin36,41, Melissa E. Garcia99, Montserrat García-Closas100,101, Graham G. Giles102,103, Giorgia G. Girotto41, Mark S. Goldberg104,105, Anna González-Neira59, Mark O. Goodarzi106, Megan L. Grove64, Daniel F. Gudbjartsson14,107, Pascal Guénel108,109, Xiuqing Guo42, Christopher A. Haiman110, Per Hall86, Ute Hamann111, Brian E. Henderson110, Lynne J. Hocking112, Albert Hofman43, Georg Homuth113, Maartje J. Hooning114, John L. Hopper102, Frank B. Hu12,87,115, Jinyan Huang116, Keith Humphreys86, David J. Hunter12,20,87,115, Anna Jakubowska117, Samuel E. Jones2, Maria Kabisch111, David Karasik9,118, Julia A. Knight119,120, Ivana Kolcic121, Charles Kooperberg37, Veli-Matti Kosma122,123,124, Jennifer Kriebel24,26,125, Vessela Kristensen69,70,126, Diether Lambrechts127,128, Claudia Langenberg1, Jingmei Li86, Xin Li12, Sara Lindström12, Yongmei Liu129, Jian’ an Luan1, Jan Lubinski117, Reedik Mägi6, Arto Mannermaa122,123,124, Judith Manz24,26, Sara Margolin130, Jonathan Marten29, Nicholas G. Martin131, Corrado Masciullo40, Alfons Meindl132, Kyriaki Michailidou3, Evelin Mihailov6, Lili Milani6, Roger L. Milne102,103, Martina Müller-Nurasyid25,133,134, Michael Nalls135, Ben M. Neale15,16,17, Heli Nevanlinna136, Patrick Neven137, Anne B. Newman138,139,140, Børge G. Nordestgaard67,68, Janet E. Olson62, Sandosh Padmanabhan141, Paolo Peterlongo142, Ulrike Peters37, Astrid Petersmann143, Julian Peto92, Paul D.P. Pharoah3,93, Nicola N. Pirastu36,41, Ailith Pirie3, Giorgio Pistis33,34,35, Ozren Polasek121, David Porteous78, Bruce M. Psaty27,144,145,146, Katri Pylkäs147,148, Paolo Radice149, Leslie J. Raffel150,151, Fernando Rivadeneira10,11,43, Igor Rudan79, Anja Rudolph152, Daniela Ruggiero32, Cinzia F. Sala40, Serena Sanna33, Elinor J. Sawyer153, David Schlessinger154, Marjanka K. Schmidt155, Frank Schmidt113, Rita K. Schmutzler156,157,158, Minouk J. Schoemaker100, Robert A. Scott1, Caroline M. Seynaeve114, Jacques Simard159, Rossella Sorice32, Melissa C. Southey160, Doris Stöckl26, Konstantin Strauch25,161, Anthony Swerdlow100,162, Kent D. Taylor42, Unnur Thorsteinsdottir14,50, Amanda E. Toland163, Ian Tomlinson81,164, Thérèse Truong108,109, Laufey Tryggvadottir165, Stephen T. Turner166, Diego Vozzi36, Qin Wang3, Melissa Wellons167, Gonneke Willemsen46, James F. Wilson29,79, Robert Winqvist147,148, Bruce B.H.R. Wolffenbuttel168,169, Alan F. Wright29, Drakoulis Yannoukakos170, Tatijana Zemunik121, Wei Zheng58, Marek Zygmunt171, Sven Bergmann44,45, Dorret I. Boomsma46, Julie E. Buring8,9, Luigi Ferrucci51, Grant W. Montgomery131, Vilmundur Gudnason49,50, Tim D. Spector47, Cornelia M van Duijn43, Behrooz Z. Alizadeh172, Marina Ciullo32, Laura Crisponi33, Douglas F. Easton3,93, Paolo P. Gasparini36,41, Christian Gieger24,25,26, Tamara B. Harris99, Caroline Hayward29, Sharon L.R. Kardia38, Peter Kraft12,173, Barbara McKnight56, Andres Metspalu6, Alanna C. Morrison64, Alex P. Reiner37,144, Paul M. Ridker8,9, Jerome I. Rotter42, Daniela Toniolo40, André G. Uitterlinden10,11,43, Sheila Ulivi36, Henry Völzke39,
Day et al. Page 14
Nat Genet. Author manuscript; available in PMC 2016 May 01.
Europe P
MC
Funders A
uthor Manuscripts
Europe P
MC
Funders A
uthor Manuscripts
Nicholas J. Wareham1, David R. Weir95, Laura M. Yerges-Armstrong31, PRACTICAL consortium, kConFab Investigators174, AOCS Investigators174, Generation Scotland175, EPIC-InterAct Consortium, LifeLines Cohort Study, Alkes L. Price12, Kari Stefansson14,50, Jenny A. Visser10, Ken K. Ong1,176, Jenny Chang-Claude152, Joanne M. Murabito5,177,§, John R.B. Perry1,§,#, and Anna Murray2,§
Affiliations1 MRC Epidemiology Unit, University of Cambridge School of Clinical Medicine, Box 285 Institute of Metabolic Science, Cambridge Biomedical Campus, Cambridge, CB2 0QQ, UK 2Genetics of Complex Traits, University of Exeter Medical School, University of Exeter, Exeter, EX2 5DW, UK 3Centre for Cancer Genetic Epidemiology, Department of Public Health and Primary Care, University of Cambridge, CB1 8RN, UK 4Boston University School of Public Health, Department of Biostatistics. Boston, Massachusetts 02118, USA 5NHLBI’ s and Boston University’ s Framingham Heart Study, Framingham, Massachusetts 01702-5827, USA 6Estonian Genome Center, University of Tartu, Tartu, 51010, Estonia 7Institute of Molecular and Cell Biology, University of Tartu, Tartu 51010, Estonia 8Division of Preventive Medicine, Brigham and Women’ s Hospital, Boston, MA 02215 9Harvard Medical School, Boston, MA 02115, USA 10Department of Internal Medicine, Erasmus MC, 3015GE Rotterdam, the Netherlands 11Netherlands Consortium on Health Aging and National Genomics Initiative, 2300 RC Leiden, the Netherlands 12Department of Epidemiology, Harvard School of Public Health, Boston, MA 02115, USA 13Department of Mathematics, Massachusetts Institute of Technology, Cambridge, Massachusetts 02139-4307, USA 14deCODE genetics/Amgen, Inc., IS-101 Reykjavik, Iceland 15Stanley Center for Psychiatric Research, Broad Institute of MIT and Harvard, Cambridge, Massachusetts 02142, USA 16Analytic and Translational Genetics Unit, Department of Medicine, Massachusetts General Hospital, Boston, MA, USA 17Medical and Population Genetics, Broad Institute, Cambridge, MA 02142, US 18Division of Endocrinology, Boston Children’ s Hospital, Boston, MA 02115, USA 19Department of Genetics, Harvard Medical School, Boston, MA 02115, USA 20Broad Institute of the Massachusetts Institute of Technology and Harvard University, 140 Cambridge 02142, MA, USA 21Department of Epidemiology, University of North Carolina, Chapel Hill, NC 27599, USA 22Department of Epidemiology, Indiana University Richard M. Fairbanks School of Public Health, Indianapolis, IN 46202, USA 23Indiana University Melvin and Bren Simon Cancer Center, Indianapolis, IN 46202, USA 24Research Unit of Molecular Epidemiology, Helmholtz Zentrum München - German Research Center for Environmental Health, 85764 Neuherberg, Germany 25Institute of Genetic Epidemiology, Helmholtz Zentrum München - German Research Center for Environmental Health, 85764 Neuherberg, Germany 26Institute of Epidemiology II, Helmholtz Zentrum München - German Research Center for Environmental Health, 85764 Neuherberg, Germany 27Cardiovascular Health Research Unit, Department of Medicine, University of Washington, Seattle Washington 98101 USA 28Department of Genetics, University of Groningen, University Medical Centre Groningen, Groningen, The Netherlands 29Medical Research Council Human
Day et al. Page 15
Nat Genet. Author manuscript; available in PMC 2016 May 01.
Europe P
MC
Funders A
uthor Manuscripts
Europe P
MC
Funders A
uthor Manuscripts
Genetics Unit, Institute of Genetics and Molecular Medicine, University of Edinburgh, Edinburgh EH4 2XU, UK 30Merck Pharmaceuticals, 33 Avenue Louis Pasteur, Boston, MA 02115, United States 31Program in Personalized Medicine, Division of Endocrinology, Diabetes and Nutrition - University of Maryland School of Medicine, USA. Baltimore, MD 21201 32Institute of Genetics and Biophysics - CNR, via Pietro Castellino 111, 80131, Naples, Italy 33Institute of Genetics and Biomedical Research, National Research Council, Cagliari, 09042 Sardinia, Italy 34University of Sassari, Department of Biomedical Sciences, Sassari, 07100 Sassari, Italy 35Center for Statistical Genetics, Ann Arbor, University of Michigan, Michigan 48109-2029, USA 36Institute for Maternal and Child Health - IRCCS “Burlo Garofolo”, 34137 Trieste, Italy 37Fred Hutchinson Cancer Research Center, Public Health Sciences Division, Seattle, WA 98109-1024, USA 38Department of Epidemiology, School of Public Health, University of Michigan, Ann Arbor, MI, USA 39Institute for Community Medicine, University Medicine Greifswald, 17475 Greifswald, Germany 40Division of Genetics and Cell Biology, San Raffaele Scientific Institute, 20132 Milano, Italy 41Department of Clinical Medical Sciences, Surgical and Health, University of Trieste, 34149 Trieste, Italy 42The Institute for Translational Genomics and Population Sciences, Department of Pediatrics, LABioMed at Harbor-UCLA Medical Center, Torrance, California, USA 43Genetic Epidemiology Unit Department of Epidemiology, Erasmus MC, 3015 GE, Rotterdam, the Netherlands 44Department of Medical Genetics, University of Lausanne, CH-1005 Lausanne, Switzerland 45Swiss Institute of Bioinformatics, CH-1015, Lausanne, Switzerland 46Department of Biological Psychology, VU University Amsterdam, van der Boechorststraat 1, 1081 BT, Amsterdam, The Netherlands 47Department of Twin Research and Genetic Epidemiology, King’ s College London, London SE1 7EH, UK 48National Institute for Health Research (NIHR) Biomedical Research Centre at Guy’ s and St. Thomas’ Foundation Trust, London, UK 49Icelandic Heart Association, Kopavogur, Iceland 50Faculty of Medicine, University of Iceland, IS-101 Reykjavik, Iceland 51Longitudinal Studies Section, Translational Gerontology Branch, National Institute on Aging, Baltimore, Maryland 21224, United States of America 52Lunenfeld-Tanenbaum Research Institute of Mount Sinai Hospital, Toronto, Ontario M5G 1X5, Canada 53Department of Molecular Genetics, University of Toronto, Toronto, Ontario, Canada 54Department of Epidemiology, University of California Irvine, Irvine, California, USA 55Division of Clinical Epidemiology and Aging Research, German Cancer Research Center (DKFZ), Heidelberg, Germany 56Department of Biostatistics, University of Washington, Seattle, WA, USA 57Department of Gynaecology and Obstetrics, University Hospital Erlangen, Friedrich-Alexander University Erlangen-Nuremberg, Erlangen, Germany 58Division of Epidemiology, Department of Medicine, Vanderbilt-Ingram Cancer Center, Vanderbilt University School of Medicine, Nashville, TN, USA 59Human Genetics Group, Human Cancer Genetics Program, Spanish National Cancer Research Centre (CNIO), Madrid, Spain 60Centro de Investigación en Red de Enfermedades Raras (CIBERER), Valencia, Spain 61Beckman Research Institute of City of Hope, Duarte, CA, USA 62Division of Epidemiology, Department of Health Sciences Research, Mayo Clinic,
Day et al. Page 16
Nat Genet. Author manuscript; available in PMC 2016 May 01.
Europe P
MC
Funders A
uthor Manuscripts
Europe P
MC
Funders A
uthor Manuscripts
Rochester, Minnesota, USA 63Department of Oncology, University of Helsinki and Helsinki University Central Hospital, Helsinki, Finland 64Human Genetics Center, School of Public Health, The University of Texas Health Science Center at Houston, Houston, TX 77030, USA 65Human Genome Sequencing Center, Baylor College of Medicine, Houston, TX 77030, USA 66Department of Radiation Oncology, Hannover Medical School, Hannover, Germany 67Faculty of Health and Medical Sciences, University of Copenhagen, Copenhagen, Denmark 68Department of Clinical Biochemistry, Herlev Hospital, Copenhagen University Hospital, University of Copenhagen, Copenhagen, Denmark 69Department of Genetics, Institute for Cancer Research, Radiumhospitalet, Oslo University Hospital, Oslo University Hospital, Oslo, Norway 70Institute of Clinical Medicine, Faculty of Medicine, University of Oslo, Oslo, Norway 71Dr. Margarete Fischer-Bosch-Institute of Clinical Pharmacology, Stuttgart, Germany 72University of Tübingen, Tübingen, Germany 73German Cancer Consortium (DKTK), German Cancer Research Center (DKFZ), Heidelberg, Germany 74Division of Preventive Oncology, German Cancer Research Center (DKFZ), Heidelberg, Germany 75Institute for Prevention and Occupational Medicine of the German Social Accident Insurance, Institute of the Ruhr University Bochum (IPA), Bochum, Germany 76Division of Molecular Genetic Epidemiology, German Cancer Research Center, Heidelberg, Germany 77Molecular Biology of Breast Cancer, Department of Obstetrics and Gynecology, University of Heidelberg, Heidelberg, Germany 78Medical Genetics Section, Centre for Genomic and Experimental Medicine, Institute of Genetics and Molecular Medicine, University of Edinburgh, Edinburgh EH4 2XU, UK 79Institute for Population Health Sciences and Informatics, University of Edinburgh, Teviot Place, Edinburgh, EH8 9AG, Scotland 80Division of Cancer Epidemiology and Genetics, National Cancer Institute, Bethesda, MD, USA 81Wellcome Trust Centre for Human Genetics, University of Oxford, Oxford, UK 82Department of Genetics, QIMR Berghofer Medical Research Institute, Brisbane, Australia 83Department of Laboratory Medicine and Pathology, Mayo Clinic, Rochester, MN, USA 84Boston University School of Medicine, Department of Medicine, Sections of Preventive Medicine and Endocrinology, Boston, MA 85Sheffield Cancer Research, Department of Oncology, University of Sheffield, Sheffield, UK 86Department of Medical Epidemiology and Biostatistics, Karolinska Institutet, 17177 Stockholm, Sweden 87Channing Division of Network Medicine, Department of Medicine, Brigham and Women’ s Hospital and Harvard Medical School, Boston, MA 02115, USA 88Division of Epidemiology & Community Health, University of Minnesotta, Minneapolis MN 55455 89Department of Human Genetics, Leiden University Medical Center, 2300 RC Leiden, The Netherlands 90Department of Pathology, Leiden University Medical Center, 2300 RC Leiden, The Netherlands 91Gynaecology Research Unit, Hannover Medical School, Hannover, Germany 92Non-communicable Disease Epidemiology Department, London School of Hygiene and Tropical Medicine, London, UK 93Centre for Cancer Genetic Epidemiology, Department of Oncology, University of Cambridge, Cambridge, CB1 8RN, UK 94David Geffen School of Medicine, Department of Medicine Division of Hematology and Oncology, University of California at Los Angeles, CA, USA
Day et al. Page 17
Nat Genet. Author manuscript; available in PMC 2016 May 01.
Europe P
MC
Funders A
uthor Manuscripts
Europe P
MC
Funders A
uthor Manuscripts
95Survey Research Center, Institute for Social Research, University of Michigan, Ann Arbor, MI, USA 96Division of Cancer Epidemiology and Genetics, National Cancer Institute, Rockville, MD, USA 97Department of Cancer Epidemiology/Clinical Cancer Registry, University Clinic Hamburg-Eppendorf, Hamburg, Germany 98Institute for Medical Biometrics and Epidemiology, University Clinic Hamburg-Eppendorf, Hamburg, Germany 99Laboratory of Epidemiology and Population Sciences, National Institute on Aging, Bethesda, MD, USA 100Division of Genetics and Epidemiology, The Institute of Cancer Research, London, UK 101Division of Cancer Studies, Breakthrough Breast Cancer Research Centre, The Institute of Cancer Research, London, UK 102Centre for Epidemiology and Biostatistics, Melbourne School of Population and Global Health, The University of Melbourne, Melbourne, Australia 103Cancer Epidemiology Centre, Cancer Council Victoria, Melbourne, Australia 104Department of Medicine, McGill University, Montreal, Canada 105Division of Clinical Epidemiology, Royal Victoria Hospital, McGill University, Montreal, Canada 106Division of Endocrinology, Diabetes and Metabolism, Cedars-Sinai Medical Center, Los Angeles, California, USA 107School of Engineering and Natural Sciences, University of Iceland, IS-101 Reykjavik, Iceland, 108Environmental Epidemiology of Cancer, Center for Research in Epidemiology and Population Health, INSERM, Villejuif, France 109University Paris-Sud, UMRS 1018, Villejuif, France 110Department of Preventive Medicine, Keck School of Medicine, University of Southern California, Los Angeles, CA, USA 111Molecular Genetics of Breast Cancer, Deutsches Krebsforschungszentrum (DKFZ), Heidelberg, Germany 112Musculoskeletal Research Programme, Division of Applied Medicine, University of Aberdeen, Aberdeen AB25 2ZD, UK 113Interfaculty Institute for Genetics and Functional Genomics, University Medicine Greifswald, 17475 Greifswald, Germany 114Department of Medical Oncology, Erasmus University Medical Center, Rotterdam, The Netherlands 115Department of Nutrition, Harvard School of Public Health, Boston, MA 02115, USA 116State Key Laboratory of Medical Genomics,Shanghai Institute of Hematology, Rui Jin Hospital, Shanghai Jiao Tong University School of Medicine, Shanghai 200025, China 117Department of Genetics and Pathology, Pomeranian Medical University, Szczecin, Poland 118Hebrew SeniorLife Institute for Aging Research, Boston, MA, 02131, USA 119Prosserman Centre for Health Research, Lunenfeld-Tanenbaum Research Institute of Mount Sinai Hospital, Toronto, Canada 120Division of Epidemiology, Dalla Lana School of Public Health, University of Toronto, Toronto, Ontario, Canada 121Faculty of Medicine, University of Split, Split, Croatia 122Cancer Center, Kuopio University Hospital, Kuopio, Finland 123School of Medicine, Institute of Clinical Medicine, Pathology and Forensic Medicine, University of Eastern Finland, Kuopio, Finland 124Imaging Center, Department of Clinical Pathology, Kuopio University Hospital, Kuopio, Finland 125German Center for Diabetes Research, 85764 Neuherberg, Germany 126Department of Clinical Molecular Biology, Oslo University Hospital, University of Oslo, Oslo, Norway 127Vesalius Research Center (VRC), VIB, Leuven, Belgium 128Laboratory for Translational Genetics, Department of Oncology, University of Leuven, Leuven, Belgium 129Center for Human Genetics, Division of
Day et al. Page 18
Nat Genet. Author manuscript; available in PMC 2016 May 01.
Europe P
MC
Funders A
uthor Manuscripts
Europe P
MC
Funders A
uthor Manuscripts
Public Health Sciences, Wake Forest School of Medicine 130Department of Oncology - Pathology, Karolinska Institutet, Stockholm 17177, Sweden 131QIMR Berghofer Medical Research Institute, Brisbane, Queensland, Australia 132Division of Gynaecology and Obstetrics, Technische Universität München, Munich, Germany 133Department of Medicine I, Ludwig-Maximilians-University Munich, 81377 Munich, Germany 134DZHK (German Centre for Cardiovascular Research), partner site Munich Heart Alliance, Munich, Germany 135Laboratory of Neurogenetics, National Institute on Aging, Bethesda, MD, USA 136Department of Obstetrics and Gynecology, University of Helsinki and Helsinki University Central Hospital, Helsinki, Finland 137KULeuven (University of Leuven), Department of Oncology, Multidisciplinary Breast Center, University Hospitals Leuven, Belgium 138Department of Epidemiology, University of Pittsburgh, Pittsburgh, Pennsylvania, USA 139Department of Medicine, University of Pittsburgh, Pittsburgh, Pennsylvania, USA 140Department of Clinical and Translational Science, University of Pittsburgh, Pittsburgh, Pennsylvania, USA 141British Heart Foundation Glasgow Cardiovascular Research Centre, Institute of Cardiovascular and Medical Sciences, College of Medical, Veterinary and Life Sciences, University of Glasgow, Glasgow G12 8TA, UK 142IFOM, Fondazione Istituto FIRC di Oncologia Molecolare, Milan, Italy 143Institute of Clinical Chemistry and Laboratory Medicine, University Medicine Greifswald, 17475 Greifswald, Germany 144Department of Epidemiology, School of Public Health, University of Washington, Seattle, WA 98195, USA 145Group Health Research Institute, Group Health Cooperative, Seattle, Washington 98101, USA 146Department of Health Services, University of Washington, Seattle, Washington 98101, USA 147Laboratory of Cancer Genetics and Tumor Biology, Department of Clinical Chemistry, University of Oulu, Oulu, Finland 148Laboratory of Cancer Genetics and Tumor Biology, Northern Finland Laboratory Centre NordLab, Oulu, Finland 149Unit of Molecular Bases of Genetic Risk and Genetic Testing, Department of Preventive and Predictive Medicine, Fondazione IRCCS Istituto Nazionale dei Tumori (INT), Milan, Italy 150Medical Genetics Research Institute, Cedars-Sinai Medical Center, Los Angeles, California, USA 151UCLA Clinical & Translational Science Institute, Cedars-Sinai Medical Center, Los Angeles, California, USA 152Division of Cancer Epidemiology, German Cancer Research Center (DKFZ), Heidelberg, Germany 153Research Oncology, Guy’ s Hospital, King’ s College London, London, UK 154National Institute on Aging, Intramural Research Program, Baltimore, MD 20892, USA 155Netherlands Cancer Institute, Antoni van Leeuwenhoek hospital, Amsterdam, The Netherlands 156Division of Molecular Gyneco-Oncology, Department of Gynaecology and Obstetrics, University Hospital of Cologne, Cologne, Germany 157Center of Familial Breast and Ovarian Cancer, University Hospital of Cologne, Cologne, Germany 158Center for Integrated Oncology, University Hospital of Cologne, Cologne, Germany 159Centre Hospitalier Universitaire de Québec Research Center, Laval University, Québec City, Canada 160Department of Pathology, The University of Melbourne, Melbourne, Australia 161Institute of Medical Informatics, Biometry and Epidemiology, Chair of Genetic Epidemiology, Ludwig-Maximilians-Universität, 81377 Munich, Germany 162Division
Day et al. Page 19
Nat Genet. Author manuscript; available in PMC 2016 May 01.
Europe P
MC
Funders A
uthor Manuscripts
Europe P
MC
Funders A
uthor Manuscripts
of Breast Cancer Research, The Institute of Cancer Research, London, UK 163Department of Molecular Virology, Immunology and Medical Genetics, Comprehensive Cancer Center, The Ohio State University, Columbus, OH, USA 164NIHR Oxford Biomedical Research Centre, Churchill Hospital, OX3 7LE Oxford, UK 165Icelandic Cancer Registry, Reykjavik, Iceland 166Division of Nephrology and Hypertension, Department of Internal Medicine, Mayo Clinic, Rochester, MN, USA 167Department of Medicine, Vanderbilt University Medical Center, Nashville, Tennessee, 37203, USA 168Department of Endocrinology, University of Groningen, University Medical Centre Groningen, Groningen, The Netherlands 169LifeLines Cohort Study and Biobank, University Medical Center Groningen, University of Groningen, Groningen, The Netherlands 170Molecular Diagnostics Laboratory, IRRP, National Centre for Scientific Research “Demokritos“, Athens, Greece 171Department of Obstetrics and Gynecology, University Medicine Greifswald, 17475 Greifswald, Germany 172Department of Epidemiology, University of Groningen, University Medical Center Groningen, Groningen, The Netherlands 173Department of Biostatistics, Harvard School of Public Health, Boston, MA 02115, USA 174Peter MacCallum Cancer Centre, The University of Melbourne, Melbourne, Australia 175A Collaboration between the University Medical Schools and NHS in Aberdeen, Dundee, Edinburgh and Glasgow, UK 176Department of Paediatrics,University of Cambridge,Cambridge, CB2 0QQ, UK 177Boston University School of Medicine, Department of Medicine, Section of General Internal Medicine, Boston, MA 02118, USA
Acknowledgements
See supplementary information
URLS
http://www.ons.gov.uk/ons/publications/
www.hgmd.cf.ac.uk/
http://research.nhgri.nih.gov/bic/
http://www.genome.gov/gwastudies/)
http://www.chargeconsortium.com/main/exomechip
http://string-db.org/
http://www.broadinstitute.org/mpg/snap/
https://github.com/bulik/ldsc
http://www.1000genomes.org/
Day et al. Page 20
Nat Genet. Author manuscript; available in PMC 2016 May 01.
Europe P
MC
Funders A
uthor Manuscripts
Europe P
MC
Funders A
uthor Manuscripts
https://github.com/bulik/ldsc
Author contributions
All authors reviewed the original and revised manuscripts.
Statistical Analysis
F.R.D, K.S.R, D.J.T, K.L.L, N.P, D.I.C, L.S, H.K.F, P.S, B.B-S, T.E, A.D.J, C.E.E, N.F,
C.He, E.Alt, J.A.B, L.L.F, J.E.H, S.E.J, M.F.K, P.F.M, T.N, E.P, A.Ro, L.M.R, U.M.S, J.A.S,
A.T, M.T, D.Vu, J.Y, W.Zhao, E.Alb, N.A, T.C, J-J.H, M.Ma, A.V.S, T.Ta, J.R.B.P
Sample collection, genotyping and phenotyping
G.A, I.L.A, H.A, A.C.A, V.A, A.M.A, C.Ba, M.W.B, A.B-F, J.B, L.B, S.J.B, C.Bl, E.B,
N.V.B, S.E.B, M.K.B, A.B-D, T.S.B, H.Bra, H.Bre, T.B, B.B, A.Ca, H.C, S.J.C, J.R.C, Y.C,
G.C, F.J.C, A.D.C, A.Co, K.C, H.D, I.DV, E.W.D, J.D, P.D, T.D, I.dSS, A.M.D, J.D.E,
P.A.F, J.D.F, J.F, D.F, I.G, M.E.G, M.G, G.G.Giles, G.G.G, M.S.G, A.G, M.O.G, M.L.G,
D.F.G, P.G, X.G, C.A.H, P.H, U.H, B.E.H, L.J.H, A.H, G.H, M.J.H, J.L.H, F.B.H, J.H, K.H,
D.J.H, A.J, M.K, D.K, J.A.K, I.K, C.K, V.Ko, J.K, V.Kr, D.L, C.L, J.Li, X.L, S.L, Y.L,
J.Lua, J.Lub, R.M, A.Ma, J.Manz, S.M, J.M, N.G. M, C.M, A.Mei, K.M, E.M, L.M, R.L.M,
M.Mü, M.N, B.M.N, H.N, P.N, A.B.N, B.G.N, J.E.O, S.P, P.P, U.P, A.Pe, J.P, P.D.P.P, N.N.P,
A.Pi, G.P, O.P, D.P, B.M.P, K.P, P.R, L.J. R, F.R, I.R, A.Ru, D.R, C.F.S, S.S, E.J.S, D.Sc,
M.K.S, F.S, R.K.S, M.J.S, R.A.S, C.MS, J.S, R.S, M.C.S, D.St, K.Str, A.S, K.D.T, U.T,
A.E.T, I.T, T.Tr, L.T, S.T.T, D.Vo, Q.W, M.W, G.W, J.F.W, R.W, B.B.H.R.W, A.F.W, D.Y,
T.Z, W.Z, M.Z
Individual study PI
S.B, D.I.B, J.E.B, L.F, G.W.M, V.G, T.D.S, C.Mv, B.Z.A, M.C, L.C, D.F.E, P.P.G, C.G,
T.B.H, C.Ha, S.L.R.K, P.K, B.M, A.Met, A.C.M, A.P.R, P.M.R, J.I.R, D.T, A.G.U, S.U, H.V,
N.J.W, D.R.W, L.M.Y, A.L.P, K.Ste, J.A.V, K.K.O, J.C-C, J.M.M, A.Mu
Working group
F.R.D, K.S.R, D.J.T, K.L.L, N.P, D.I.C, L.S, H.K.F, P.S, B.B-S, T.E, A.D.J, C.E.E, N.F,
C.He, A.L.P, K.Ste, J.A.V, K.K.O, J.C-C, J.M.M, J.R.B.P, A.Mu
References
1. Hartge P. Genetics of reproductive lifespan. Nat Genet. 2009; 41:637–638. [PubMed: 19471299]
2. Lambalk CB, van Disseldorp J, de Koning CH, Broekmans FJ. Testing ovarian reserve to predict age at menopause. Maturitas. 2009; 63:280–91. [PubMed: 19631481]
3. te Velde ER, Pearson PL. The variability of female reproductive ageing. Hum Reprod Update. 2002; 8:141–54. [PubMed: 12099629]
4. Stolk L, et al. Meta-analyses identify 13 loci associated with age at menopause and highlight DNA repair and immune pathways. Nature genetics. 2012; 44:260–8. [PubMed: 22267201]
5. Perry JR, et al. DNA mismatch repair gene MSH6 implicated in determining age at natural menopause. Hum Mol Genet. 2014 [PubMed: 24357391]
Day et al. Page 21
Nat Genet. Author manuscript; available in PMC 2016 May 01.
Europe P
MC
Funders A
uthor Manuscripts
Europe P
MC
Funders A
uthor Manuscripts
6. Finucane HK, et al. Partitioning heritability by functional category using GWAS summary statistics. 2015
7. Oktem O, Oktay K. The ovary: anatomy and function throughout human life. Ann N Y Acad Sci. 2008; 1127:1–9. [PubMed: 18443323]
8. Guler GD, et al. Human DNA helicase B (HDHB) binds to replication protein A and facilitates cellular recovery from replication stress. J Biol Chem. 2012; 287:6469–81. [PubMed: 22194613]
9. Weischer M, Bojesen SE, Ellervik C, Tybjaerg-Hansen A, Nordestgaard BG. CHEK2*1100delC genotyping for clinical assessment of breast cancer risk: meta-analyses of 26,000 patient cases and 27,000 controls. J Clin Oncol. 2008; 26:542–8. [PubMed: 18172190]
10. AlAsiri S, et al. Exome sequencing reveals MCM8 mutation underlies ovarian failure and chromosomal instability. J Clin Invest. 2014
11. Fogli A, et al. Ovarian failure related to eukaryotic initiation factor 2B mutations. Am J Hum Genet. 2003; 72:1544–50. [PubMed: 12707859]
12. Trifunovic A, et al. Premature ageing in mice expressing defective mitochondrial DNA polymerase. Nature. 2004; 429:417–23. [PubMed: 15164064]
13. Mandon-Pepin B, et al. Genetic investigation of four meiotic genes in women with premature ovarian failure. Eur J Endocrinol. 2008; 158:107–15. [PubMed: 18166824]
14. Linder B, et al. Tdrd3 is a novel stress granule-associated protein interacting with the Fragile-X syndrome protein FMRP. Hum Mol Genet. 2008; 17:3236–46. [PubMed: 18664458]
15. Eicher JD, et al. GRASP v2.0: an update on the Genome-Wide Repository of Associations between SNPs and phenotypes. Nucleic Acids Res. 2014
16. Morris DH, et al. Body mass index, exercise, and other lifestyle factors in relation to age at natural menopause: analyses from the breakthrough generations study. Am J Epidemiol. 175:998–1005. [PubMed: 22494951]
17. Perry JR, et al. Parent-of-origin-specific allelic associations among 106 genomic loci for age at menarche. Nature. 2014; 514:92–7. [PubMed: 25231870]
18. Collaborative Group on Hormonal Factors in Breast, C. Menarche, menopause, and breast cancer risk: individual participant meta-analysis, including 118 964 women with breast cancer from 117 epidemiological studies. Lancet Oncol. 2012; 13:1141–51. [PubMed: 23084519]
19. Vimaleswaran KS, et al. Association of vitamin D status with arterial blood pressure and hypertension risk: a mendelian randomisation study. Lancet Diabetes Endocrinol. 2014; 2:719–29. [PubMed: 24974252]
20. Michailidou K, et al. Large-scale genotyping identifies 41 new loci associated with breast cancer risk. Nat Genet. 2013; 45:353–61. 361e1–2. [PubMed: 23535729]
21. Dickson SP, Wang K, Krantz I, Hakonarson H, Goldstein DB. Rare variants create synthetic genome-wide associations. PLoS Biol. 2010; 8:e1000294. [PubMed: 20126254]
22. Monteiro AN, Freedman ML. Lessons from postgenome-wide association studies: functional analysis of cancer predisposition loci. J Intern Med. 2013; 274:414–24. [PubMed: 24127939]
23. Ghoussaini M, Pharoah PD, Easton DF. Inherited genetic susceptibility to breast cancer: the beginning of the end or the end of the beginning? Am J Pathol. 2013; 183:1038–51. [PubMed: 23973388]
24. Titus S, et al. Impairment of BRCA1-related DNA double-strand break repair leads to ovarian aging in mice and humans. Sci Transl Med. 2013; 5:172ra21.
25. Fan S, et al. BRCA1 inhibition of estrogen receptor signaling in transfected cells. Science. 1999; 284:1354–6. [PubMed: 10334989]
26. Hu Y, et al. RAP80-directed tuning of BRCA1 homologous recombination function at ionizing radiation-induced nuclear foci. Genes Dev. 2011; 25:685–700. [PubMed: 21406551]
27. Tsutsui Y, et al. Multiple regulation of Rad51-mediated homologous recombination by fission yeast Fbh1. PLoS Genet. 2014; 10:e1004542. [PubMed: 25165823]
28. Simandlova J, et al. FBH1 helicase disrupts RAD51 filaments in vitro and modulates homologous recombination in mammalian cells. J Biol Chem. 2013; 288:34168–80. [PubMed: 24108124]
29. Chapman JR, Taylor MR, Boulton SJ. Playing the end game: DNA double-strand break repair pathway choice. Mol Cell. 2012; 47:497–510. [PubMed: 22920291]
Day et al. Page 22
Nat Genet. Author manuscript; available in PMC 2016 May 01.
Europe P
MC
Funders A
uthor Manuscripts
Europe P
MC
Funders A
uthor Manuscripts
30. Wood-Trageser MA, et al. MCM9 Mutations Are Associated with Ovarian Failure, Short Stature, and Chromosomal Instability. Am J Hum Genet. 2014; 95:754–62. [PubMed: 25480036]
31. Oktay K, Kim JY, Barad D, Babayev SN. Association of BRCA1 mutations with occult primary ovarian insufficiency: a possible explanation for the link between infertility and breast/ovarian cancer risks. J Clin Oncol. 2010; 28:240–4. [PubMed: 19996028]
32. Collins IM, et al. Do BRCA1 and BRCA2 mutation carriers have earlier natural menopause than their noncarrier relatives? Results from the Kathleen Cuningham Foundation Consortium for Research into Familial Breast Cancer. J Clin Oncol. 2013; 31:3920–5. [PubMed: 24081944]
33. Manson JE, et al. Menopausal hormone therapy and health outcomes during the intervention and extended poststopping phases of the Women’ s Health Initiative randomized trials. JAMA. 2013; 310:1353–68. [PubMed: 24084921]
34. Levy-Lahad E, Friedman E. Cancer risks among BRCA1 and BRCA2 mutation carriers. Br J Cancer. 2007; 96:11–5. [PubMed: 17213823]
35. Rance NE. Menopause and the human hypothalamus: evidence for the role of kisspeptin/neurokinin B neurons in the regulation of estrogen negative feedback. Peptides. 2009; 30:111–22. [PubMed: 18614256]
36. Silveira LF, Latronico AC. Approach to the patient with hypogonadotropic hypogonadism. J Clin Endocrinol Metab. 2013; 98:1781–8. [PubMed: 23650335]
37. Garcia-Ortega J, et al. Expression of neurokinin B/NK3 receptor and kisspeptin/KISS1 receptor in human granulosa cells. Hum Reprod. 2014; 29:2736–46. [PubMed: 25316443]
38. Gaytan F, et al. Kisspeptin receptor haplo-insufficiency causes premature ovarian failure despite preserved gonadotropin secretion. Endocrinology. 2014; 155:3088–97. [PubMed: 24885574]
Methods-only references
39. Willer CJ, Li Y, Abecasis GR. METAL: fast and efficient meta-analysis of genomewide association scans. Bioinformatics. 2010; 26:2190–1. [PubMed: 20616382]
40. Purcell S, et al. PLINK: a tool set for whole-genome association and population-based linkage analyses. Am J Hum Genet. 2007; 81:559–75. [PubMed: 17701901]
41. Zhou JJ, et al. A comparative analysis of family-based and population-based association tests using whole genome sequence data. BMC Proc. 2014; 8:S33. [PubMed: 25519381]
42. Yang J, Lee SH, Goddard ME, Visscher PM. GCTA: a tool for genome-wide complex trait analysis. Am J Hum Genet. 2011; 88:76–82. [PubMed: 21167468]
43. Barrett JC, Fry B, Maller J, Daly MJ. Haploview: analysis and visualization of LD and haplotype maps. Bioinformatics. 2005; 21:263–5. [PubMed: 15297300]
44. Raychaudhuri S, et al. Identifying relationships among genomic disease regions: predicting genes at pathogenic SNP associations and rare deletions. PLoS Genet. 2009; 5:e1000534. [PubMed: 19557189]
45. Zhang X, et al. Synthesis of 53 tissue and cell line expression QTL datasets reveals master eQTLs. BMC Genomics. 2014; 15:532. [PubMed: 24973796]
46. Segre AV, et al. Common inherited variation in mitochondrial genes is not enriched for associations with type 2 diabetes or related glycemic traits. PLoS Genet. 2010; 6 [PubMed: 20714348]
47. Hoffman MM, et al. Integrative annotation of chromatin elements from ENCODE data. Nucleic Acids Res. 2013; 41:827–41. [PubMed: 23221638]
48. Lindblad-Toh K, et al. A high-resolution map of human evolutionary constraint using 29 mammals. Nature. 2011; 478:476–82. [PubMed: 21993624]
49. Hnisz D, et al. Super-enhancers in the control of cell identity and disease. Cell. 2013; 155:934–47. [PubMed: 24119843]
50. Andersson R, et al. An atlas of active enhancers across human cell types and tissues. Nature. 2014; 507:455–61. [PubMed: 24670763]
51. Trynka G, et al. Chromatin marks identify critical cell types for fine mapping complex trait variants. Nat Genet. 2013; 45:124–30. [PubMed: 23263488]
Day et al. Page 23
Nat Genet. Author manuscript; available in PMC 2016 May 01.
Europe P
MC
Funders A
uthor Manuscripts
Europe P
MC
Funders A
uthor Manuscripts
52. Schizophrenia Working Group of the Psychiatric Genomics, C. Biological insights from 108 schizophrenia-associated genetic loci. Nature. 2014; 511:421–7. [PubMed: 25056061]
53. Howie B, Fuchsberger C, Stephens M, Marchini J, Abecasis GR. Fast and accurate genotype imputation in genome-wide association studies through pre-phasing. Nat Genet. 2012; 44:955–9. [PubMed: 22820512]
54. Genomes Project, C. et al. An integrated map of genetic variation from 1,092 human genomes. Nature. 2012; 491:56–65. [PubMed: 23128226]
55. International Consortium for Blood Pressure Genome-Wide Association, S. et al. Genetic variants in novel pathways influence blood pressure and cardiovascular disease risk. Nature. 2011; 478:103–9. [PubMed: 21909115]
56. Eeles RA, et al. Identification of 23 new prostate cancer susceptibility loci using the iCOGS custom genotyping array. Nat Genet. 2013; 45:385–91. 391e1–2. [PubMed: 23535732]
57. Cross-Disorder Group of the Psychiatric Genomics, C. Identification of risk loci with shared effects on five major psychiatric disorders: a genome-wide analysis. Lancet. 2013; 381:1371–9. [PubMed: 23453885]
58. Bulik-Sullivan B, et al. An Atlas of Genetic Correlations across Human Diseases and Traits. 2015 [PubMed: 26414676]
59. Speliotes EK, et al. Association analyses of 249,796 individuals reveal 18 new loci associated with body mass index. Nat Genet. 2010; 42:937–48. [PubMed: 20935630]
Day et al. Page 24
Nat Genet. Author manuscript; available in PMC 2016 May 01.
Europe P
MC
Funders A
uthor Manuscripts
Europe P
MC
Funders A
uthor Manuscripts
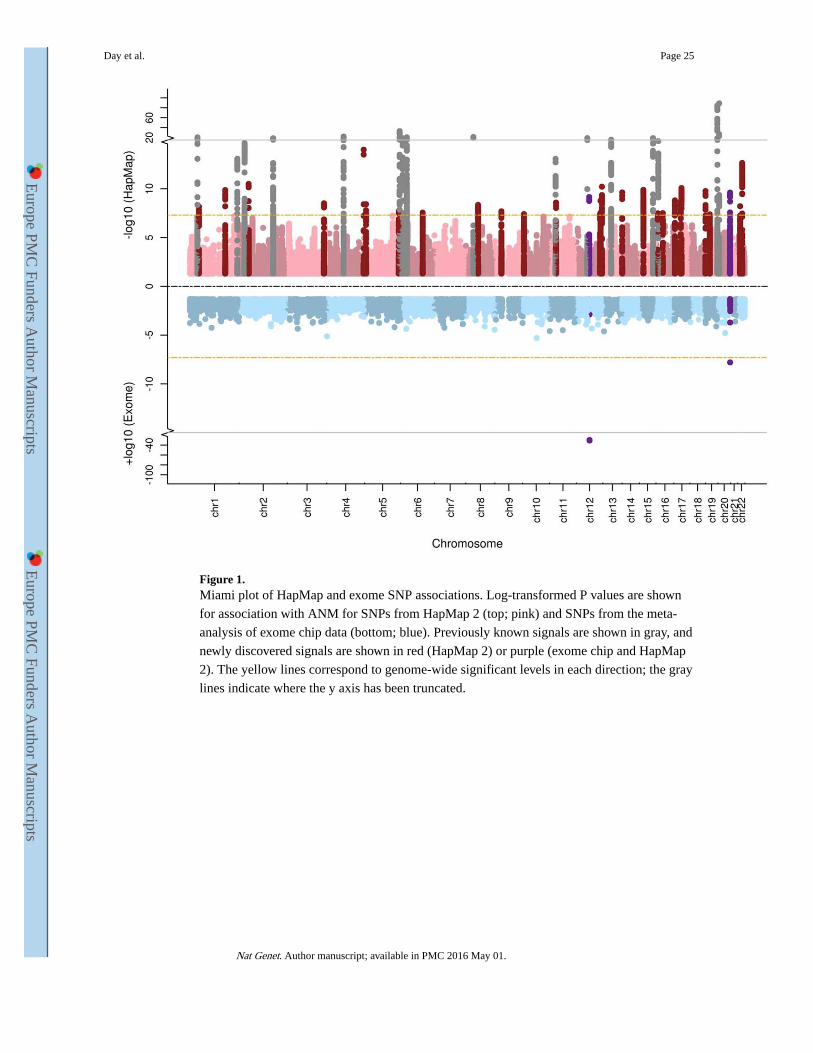
Figure 1. Miami plot of HapMap and exome SNP associations. Log-transformed P values are shown
for association with ANM for SNPs from HapMap 2 (top; pink) and SNPs from the meta-
analysis of exome chip data (bottom; blue). Previously known signals are shown in gray, and
newly discovered signals are shown in red (HapMap 2) or purple (exome chip and HapMap
2). The yellow lines correspond to genome-wide significant levels in each direction; the gray
lines indicate where the y axis has been truncated.
Day et al. Page 25
Nat Genet. Author manuscript; available in PMC 2016 May 01.
Europe P
MC
Funders A
uthor Manuscripts
Europe P
MC
Funders A
uthor Manuscripts
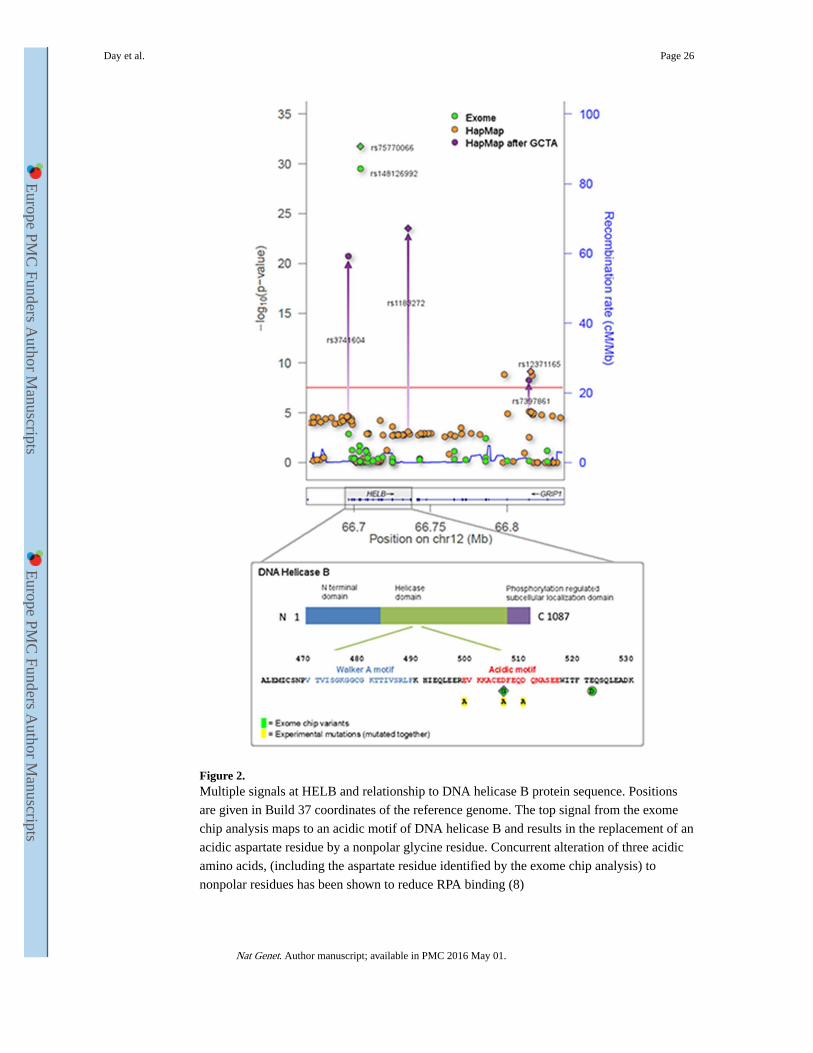
Figure 2. Multiple signals at HELB and relationship to DNA helicase B protein sequence. Positions
are given in Build 37 coordinates of the reference genome. The top signal from the exome
chip analysis maps to an acidic motif of DNA helicase B and results in the replacement of an
acidic aspartate residue by a nonpolar glycine residue. Concurrent alteration of three acidic
amino acids, (including the aspartate residue identified by the exome chip analysis) to
nonpolar residues has been shown to reduce RPA binding (8)
Day et al. Page 26
Nat Genet. Author manuscript; available in PMC 2016 May 01.
Europe P
MC
Funders A
uthor Manuscripts
Europe P
MC
Funders A
uthor Manuscripts
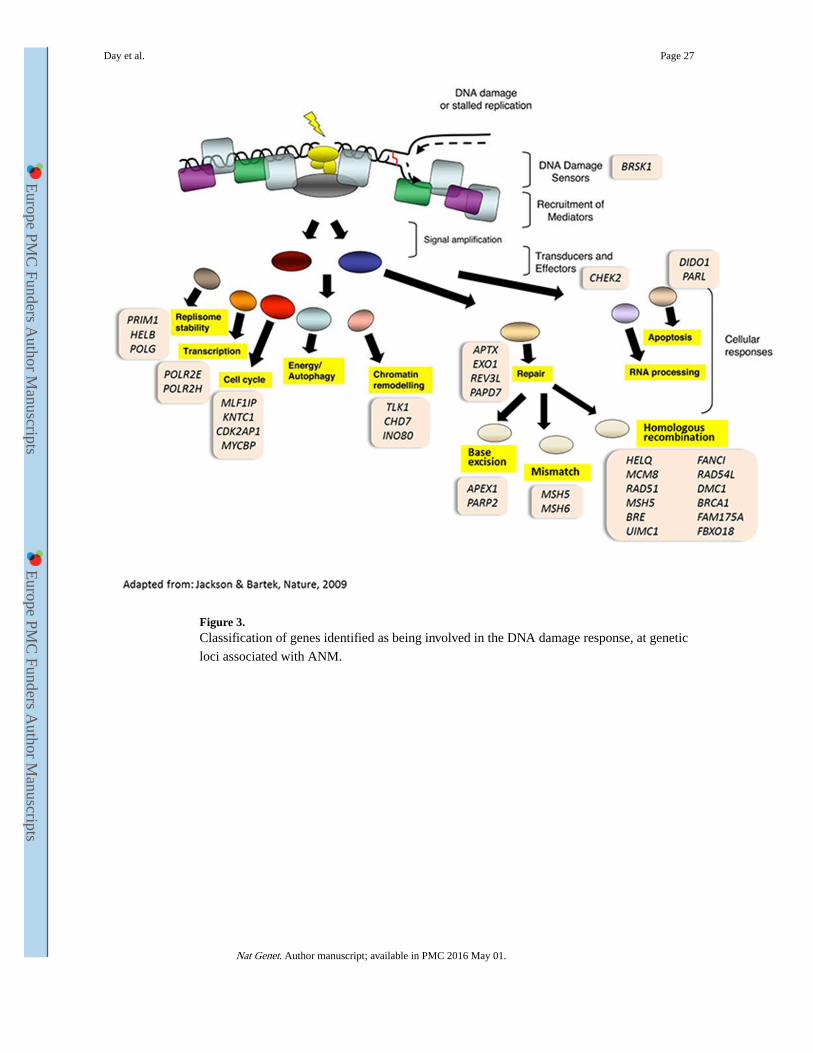
Figure 3. Classification of genes identified as being involved in the DNA damage response, at genetic
loci associated with ANM.
Day et al. Page 27
Nat Genet. Author manuscript; available in PMC 2016 May 01.
Europe P
MC
Funders A
uthor Manuscripts
Europe P
MC
Funders A
uthor Manuscripts
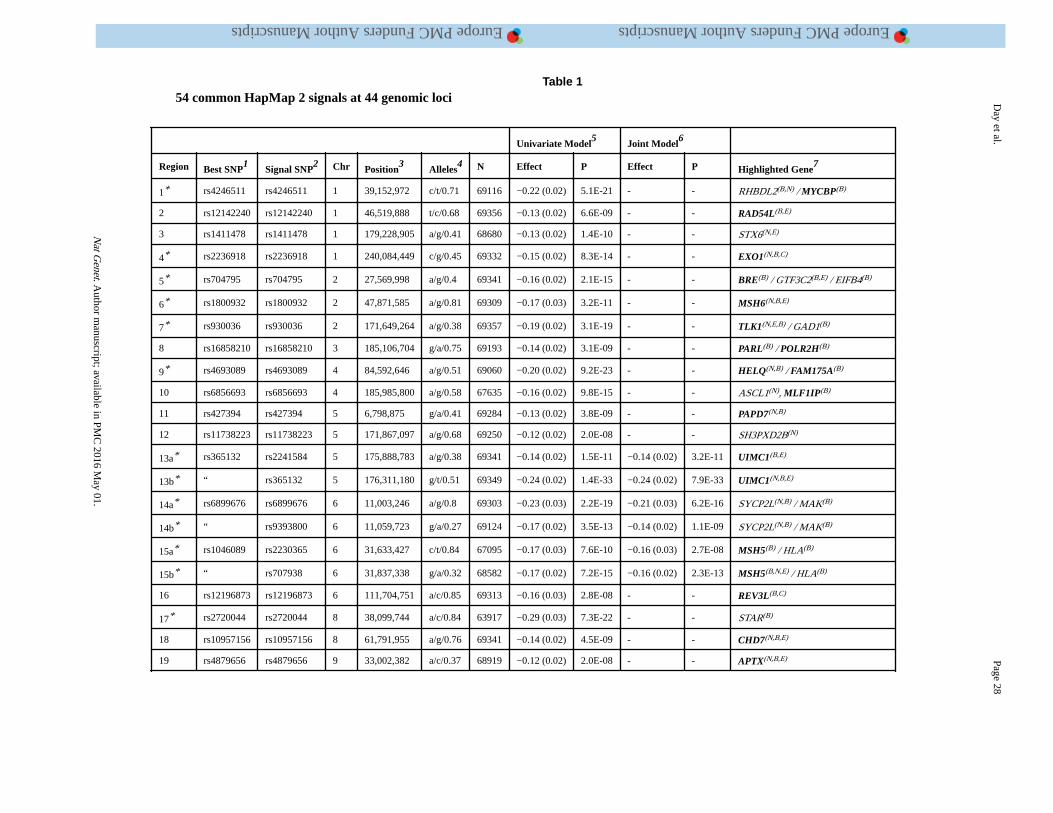
Europe PMC Funders Author Manuscripts Europe PMC Funders Author Manuscripts
Day et al.
Page 28
Table 154 common HapMap 2 signals at 44 genomic loci
Univariate Model5
Joint Model6
Region Best SNP1
Signal SNP2 Chr Position
3Alleles
4 N Effect P Effect P Highlighted Gene7
1* rs4246511 rs4246511 1 39,152,972 c/t/0.71 69116 −0.22 (0.02) 5.1E-21 - - RHBDL2(B,N) / MYCBP(B)
2 rs12142240 rs12142240 1 46,519,888 t/c/0.68 69356 −0.13 (0.02) 6.6E-09 - - RAD54L(B,E)
3 rs1411478 rs1411478 1 179,228,905 a/g/0.41 68680 −0.13 (0.02) 1.4E-10 - - STX6(N,E)
4* rs2236918 rs2236918 1 240,084,449 c/g/0.45 69332 −0.15 (0.02) 8.3E-14 - - EXO1(N,B,C)
5* rs704795 rs704795 2 27,569,998 a/g/0.4 69341 −0.16 (0.02) 2.1E-15 - - BRE(B) / GTF3C2(B,E) / EIFB4(B)
6* rs1800932 rs1800932 2 47,871,585 a/g/0.81 69309 −0.17 (0.03) 3.2E-11 - - MSH6(N,B,E)
7* rs930036 rs930036 2 171,649,264 a/g/0.38 69357 −0.19 (0.02) 3.1E-19 - - TLK1(N,E,B) / GAD1(B)
8 rs16858210 rs16858210 3 185,106,704 g/a/0.75 69193 −0.14 (0.02) 3.1E-09 - - PARL(B) / POLR2H(B)
9* rs4693089 rs4693089 4 84,592,646 a/g/0.51 69060 −0.20 (0.02) 9.2E-23 - - HELQ(N,B) / FAM175A(B)
10 rs6856693 rs6856693 4 185,985,800 a/g/0.58 67635 −0.16 (0.02) 9.8E-15 - - ASCL1(N), MLF1IP(B)
11 rs427394 rs427394 5 6,798,875 g/a/0.41 69284 −0.13 (0.02) 3.8E-09 - - PAPD7(N,B)
12 rs11738223 rs11738223 5 171,867,097 a/g/0.68 69250 −0.12 (0.02) 2.0E-08 - - SH3PXD2B(N)
13a* rs365132 rs2241584 5 175,888,783 a/g/0.38 69341 −0.14 (0.02) 1.5E-11 −0.14 (0.02) 3.2E-11UIMC1(B,E)
13b* “ rs365132 5 176,311,180 g/t/0.51 69349 −0.24 (0.02) 1.4E-33 −0.24 (0.02) 7.9E-33UIMC1(N,B,E)
14a* rs6899676 rs6899676 6 11,003,246 a/g/0.8 69303 −0.23 (0.03) 2.2E-19 −0.21 (0.03) 6.2E-16SYCP2L(N,B) / MAK (B)
14b* “ rs9393800 6 11,059,723 g/a/0.27 69124 −0.17 (0.02) 3.5E-13 −0.14 (0.02) 1.1E-09SYCP2L(N,B) / MAK (B)
15a* rs1046089 rs2230365 6 31,633,427 c/t/0.84 67095 −0.17 (0.03) 7.6E-10 −0.16 (0.03) 2.7E-08MSH5(B) / HLA(B)
15b* “ rs707938 6 31,837,338 g/a/0.32 68582 −0.17 (0.02) 7.2E-15 −0.16 (0.02) 2.3E-13MSH5(B,N,E) / HLA(B)
16 rs12196873 rs12196873 6 111,704,751 a/c/0.85 69313 −0.16 (0.03) 2.8E-08 - - REV3L(B,C)
17* rs2720044 rs2720044 8 38,099,744 a/c/0.84 63917 −0.29 (0.03) 7.3E-22 - - STAR(B)
18 rs10957156 rs10957156 8 61,791,955 a/g/0.76 69341 −0.14 (0.02) 4.5E-09 - - CHD7(N,B,E)
19 rs4879656 rs4879656 9 33,002,382 a/c/0.37 68919 −0.12 (0.02) 2.0E-08 - - APTX(N,B,E)
Nat G
enet. Author m
anuscript; available in PM
C 2016 M
ay 01.
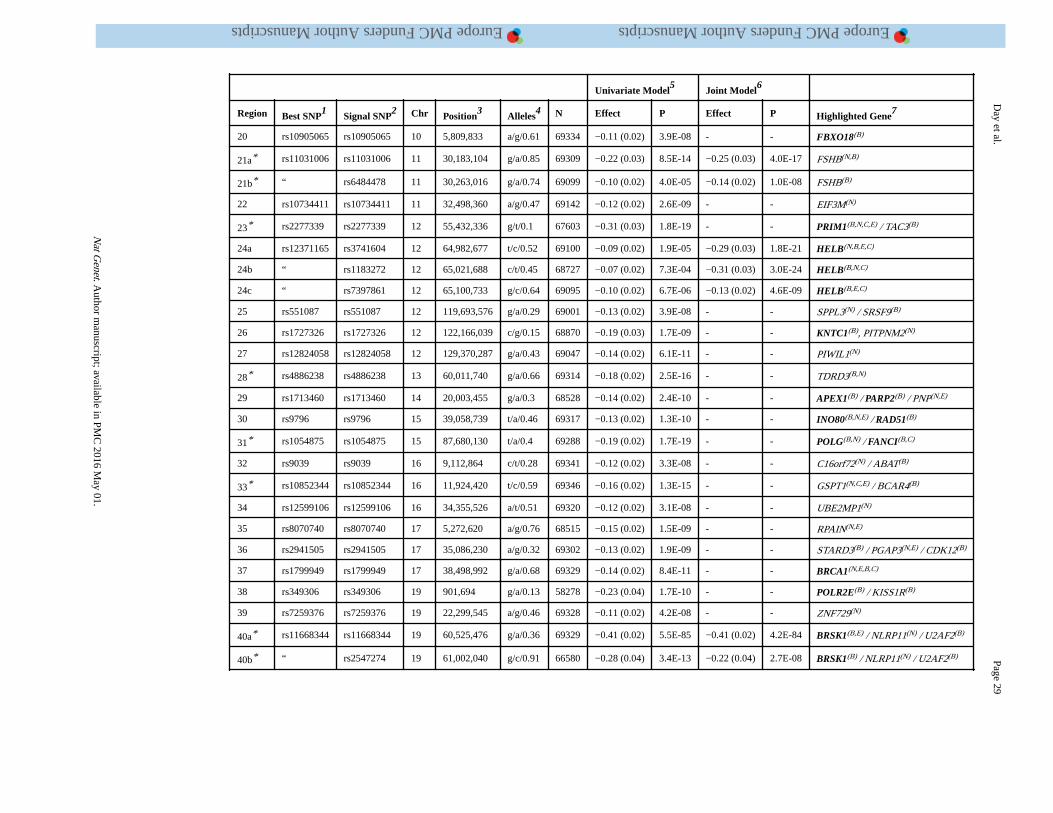
Europe PMC Funders Author Manuscripts Europe PMC Funders Author Manuscripts
Day et al.
Page 29
Univariate Model5
Joint Model6
Region Best SNP1
Signal SNP2 Chr Position
3Alleles
4 N Effect P Effect P Highlighted Gene7
20 rs10905065 rs10905065 10 5,809,833 a/g/0.61 69334 −0.11 (0.02) 3.9E-08 - - FBXO18(B)
21a* rs11031006 rs11031006 11 30,183,104 g/a/0.85 69309 −0.22 (0.03) 8.5E-14 −0.25 (0.03) 4.0E-17FSHB(N,B)
21b* “ rs6484478 11 30,263,016 g/a/0.74 69099 −0.10 (0.02) 4.0E-05 −0.14 (0.02) 1.0E-08FSHB(B)
22 rs10734411 rs10734411 11 32,498,360 a/g/0.47 69142 −0.12 (0.02) 2.6E-09 - - EIF3M(N)
23* rs2277339 rs2277339 12 55,432,336 g/t/0.1 67603 −0.31 (0.03) 1.8E-19 - - PRIM1(B,N,C,E) / TAC3(B)
24a rs12371165 rs3741604 12 64,982,677 t/c/0.52 69100 −0.09 (0.02) 1.9E-05 −0.29 (0.03) 1.8E-21HELB(N,B,E,C)
24b “ rs1183272 12 65,021,688 c/t/0.45 68727 −0.07 (0.02) 7.3E-04 −0.31 (0.03) 3.0E-24HELB(B,N,C)
24c “ rs7397861 12 65,100,733 g/c/0.64 69095 −0.10 (0.02) 6.7E-06 −0.13 (0.02) 4.6E-09HELB(B,E,C)
25 rs551087 rs551087 12 119,693,576 g/a/0.29 69001 −0.13 (0.02) 3.9E-08 - - SPPL3(N) / SRSF9(B)
26 rs1727326 rs1727326 12 122,166,039 c/g/0.15 68870 −0.19 (0.03) 1.7E-09 - - KNTC1(B), PITPNM2(N)
27 rs12824058 rs12824058 12 129,370,287 g/a/0.43 69047 −0.14 (0.02) 6.1E-11 - - PIWIL1(N)
28* rs4886238 rs4886238 13 60,011,740 g/a/0.66 69314 −0.18 (0.02) 2.5E-16 - - TDRD3(B,N)
29 rs1713460 rs1713460 14 20,003,455 g/a/0.3 68528 −0.14 (0.02) 2.4E-10 - - APEX1(B) / PARP2(B) / PNP(N,E)
30 rs9796 rs9796 15 39,058,739 t/a/0.46 69317 −0.13 (0.02) 1.3E-10 - - INO80(B,N,E) / RAD51(B)
31* rs1054875 rs1054875 15 87,680,130 t/a/0.4 69288 −0.19 (0.02) 1.7E-19 - - POLG(B,N) / FANCI(B,C)
32 rs9039 rs9039 16 9,112,864 c/t/0.28 69341 −0.12 (0.02) 3.3E-08 - - C16orf72(N) / ABAT(B)
33* rs10852344 rs10852344 16 11,924,420 t/c/0.59 69346 −0.16 (0.02) 1.3E-15 - - GSPT1(N,C,E) / BCAR4(B)
34 rs12599106 rs12599106 16 34,355,526 a/t/0.51 69320 −0.12 (0.02) 3.1E-08 - - UBE2MP1(N)
35 rs8070740 rs8070740 17 5,272,620 a/g/0.76 68515 −0.15 (0.02) 1.5E-09 - - RPAIN(N,E)
36 rs2941505 rs2941505 17 35,086,230 a/g/0.32 69302 −0.13 (0.02) 1.9E-09 - - STARD3(B) / PGAP3(N,E) / CDK12(B)
37 rs1799949 rs1799949 17 38,498,992 g/a/0.68 69329 −0.14 (0.02) 8.4E-11 - - BRCA1(N,E,B,C)
38 rs349306 rs349306 19 901,694 g/a/0.13 58278 −0.23 (0.04) 1.7E-10 - - POLR2E(B) / KISS1R(B)
39 rs7259376 rs7259376 19 22,299,545 a/g/0.46 69328 −0.11 (0.02) 4.2E-08 - - ZNF729(N)
40a* rs11668344 rs11668344 19 60,525,476 g/a/0.36 69329 −0.41 (0.02) 5.5E-85 −0.41 (0.02) 4.2E-84BRSK1(B,E) / NLRP11(N) / U2AF2(B)
40b* “ rs2547274 19 61,002,040 g/c/0.91 66580 −0.28 (0.04) 3.4E-13 −0.22 (0.04) 2.7E-08BRSK1(B) / NLRP11(N) / U2AF2(B)
Nat G
enet. Author m
anuscript; available in PM
C 2016 M
ay 01.
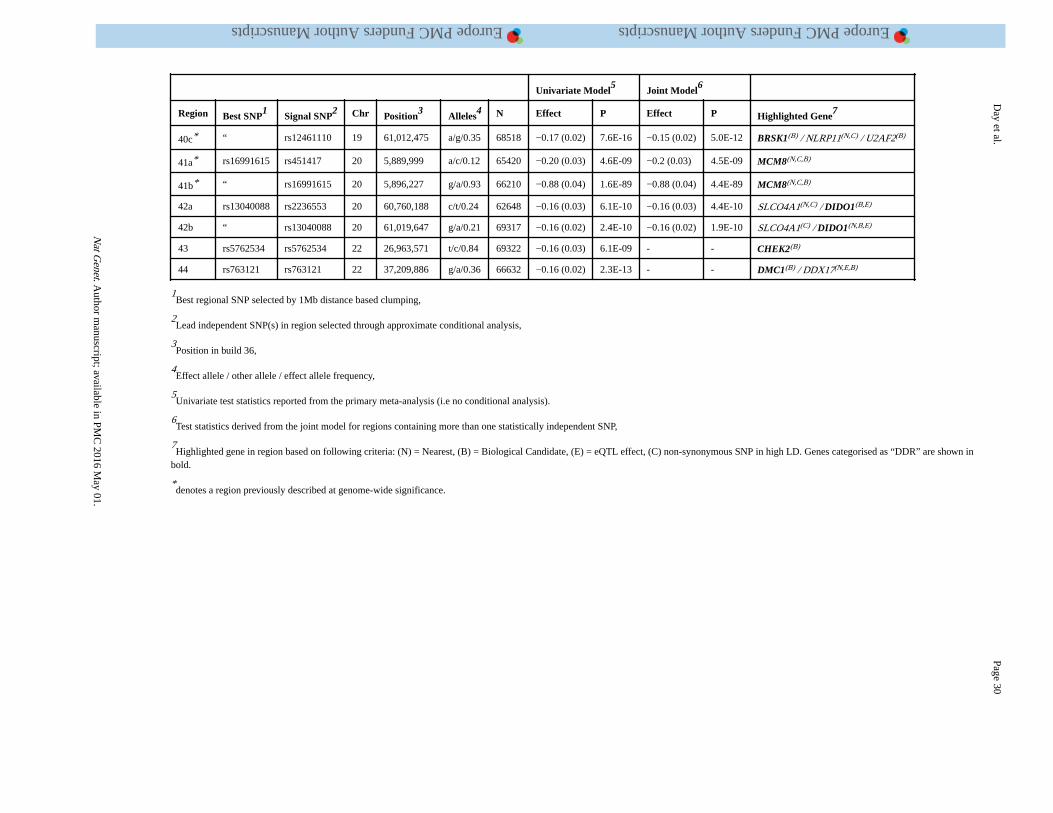
Europe PMC Funders Author Manuscripts Europe PMC Funders Author Manuscripts
Day et al.
Page 30
Univariate Model5
Joint Model6
Region Best SNP1
Signal SNP2 Chr Position
3Alleles
4 N Effect P Effect P Highlighted Gene7
40c* “ rs12461110 19 61,012,475 a/g/0.35 68518 −0.17 (0.02) 7.6E-16 −0.15 (0.02) 5.0E-12BRSK1(B) / NLRP11(N,C) / U2AF2(B)
41a* rs16991615 rs451417 20 5,889,999 a/c/0.12 65420 −0.20 (0.03) 4.6E-09 −0.2 (0.03) 4.5E-09MCM8(N,C,B)
41b* “ rs16991615 20 5,896,227 g/a/0.93 66210 −0.88 (0.04) 1.6E-89 −0.88 (0.04) 4.4E-89MCM8(N,C,B)
42a rs13040088 rs2236553 20 60,760,188 c/t/0.24 62648 −0.16 (0.03) 6.1E-10 −0.16 (0.03) 4.4E-10SLCO4A1(N,C) / DIDO1(B,E)
42b “ rs13040088 20 61,019,647 g/a/0.21 69317 −0.16 (0.02) 2.4E-10 −0.16 (0.02) 1.9E-10SLCO4A1(C) / DIDO1(N,B,E)
43 rs5762534 rs5762534 22 26,963,571 t/c/0.84 69322 −0.16 (0.03) 6.1E-09 - - CHEK2(B)
44 rs763121 rs763121 22 37,209,886 g/a/0.36 66632 −0.16 (0.02) 2.3E-13 - - DMC1(B) / DDX17(N,E,B)
1Best regional SNP selected by 1Mb distance based clumping,
2Lead independent SNP(s) in region selected through approximate conditional analysis,
3Position in build 36,
4Effect allele / other allele / effect allele frequency,
5Univariate test statistics reported from the primary meta-analysis (i.e no conditional analysis).
6Test statistics derived from the joint model for regions containing more than one statistically independent SNP,
7Highlighted gene in region based on following criteria: (N) = Nearest, (B) = Biological Candidate, (E) = eQTL effect, (C) non-synonymous SNP in high LD. Genes categorised as “DDR” are shown in
bold.
*denotes a region previously described at genome-wide significance.
Nat G
enet. Author m
anuscript; available in PM
C 2016 M
ay 01.
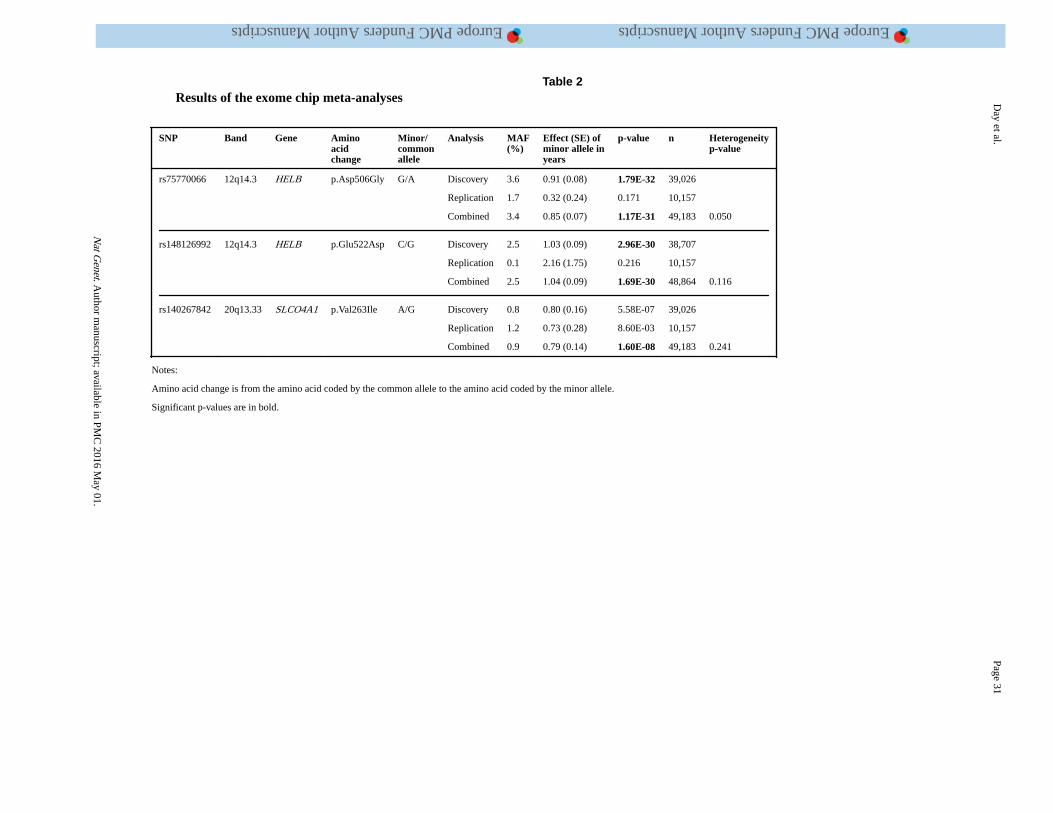
Europe PMC Funders Author Manuscripts Europe PMC Funders Author Manuscripts
Day et al.
Page 31
Table 2Results of the exome chip meta-analyses
SNP Band Gene Aminoacidchange
Minor/commonallele
Analysis MAF(%)
Effect (SE) ofminor allele inyears
p-value n Heterogeneityp-value
rs75770066 12q14.3 HELB p.Asp506Gly G/A Discovery 3.6 0.91 (0.08) 1.79E-32 39,026
Replication 1.7 0.32 (0.24) 0.171 10,157
Combined 3.4 0.85 (0.07) 1.17E-31 49,183 0.050
rs148126992 12q14.3 HELB p.Glu522Asp C/G Discovery 2.5 1.03 (0.09) 2.96E-30 38,707
Replication 0.1 2.16 (1.75) 0.216 10,157
Combined 2.5 1.04 (0.09) 1.69E-30 48,864 0.116
rs140267842 20q13.33 SLCO4A1 p.Val263Ile A/G Discovery 0.8 0.80 (0.16) 5.58E-07 39,026
Replication 1.2 0.73 (0.28) 8.60E-03 10,157
Combined 0.9 0.79 (0.14) 1.60E-08 49,183 0.241
Notes:
Amino acid change is from the amino acid coded by the common allele to the amino acid coded by the minor allele.
Significant p-values are in bold.
Nat G
enet. Author m
anuscript; available in PM
C 2016 M
ay 01.