Embed Size (px)
Citation preview

This article was downloaded by: [University Library Utrecht]On: 17 March 2013, At: 11:12Publisher: Taylor & FrancisInforma Ltd Registered in England and Wales Registered Number: 1072954 Registered office: MortimerHouse, 37-41 Mortimer Street, London W1T 3JH, UK
Scandinavian Journal of Forest ResearchPublication details, including instructions for authors and subscription information:http://www.tandfonline.com/loi/sfor20
Laser scanning of forest resources: the nordicexperienceErik Næsset a , Terje Gobakken a , Johan Holmgren b , Hannu Hyyppä c , Juha Hyyppä d ,Matti Maltamo e , Mats Nilsson b , Håkan Olsson b , Åsa Persson f & Ulf Söderman fa Department of Ecology and Natural Resource Management, NLH, P.O. Box 5003,NO-1432, Ås, Norwayb Department of Forest Resources Management and Geomatics, SLU, SE-90183, Umeå,Swedenc Institute of Photogrammetry and Remote Sensing, Helsinki University of Technology,FI-02015, HUT, Finlandd Department of Remote Sensing and Photogrammetry, Finnish Geodetic Institute,FI-02431, Masala, Finlande Faculty of Forestry, University of Joensuu, Finlandf Department of Laser Systems, Swedish Defence Research Agency, P.O. Box 1165,SE-58111, Linköping, SwedenE-mail:Version of record first published: 02 Sep 2006.
To cite this article: Erik Næsset , Terje Gobakken , Johan Holmgren , Hannu Hyyppä , Juha Hyyppä , Matti Maltamo , MatsNilsson , Håkan Olsson , Åsa Persson & Ulf Söderman (2004): Laser scanning of forest resources: the nordic experience,Scandinavian Journal of Forest Research, 19:6, 482-499
To link to this article: http://dx.doi.org/10.1080/02827580410019553
PLEASE SCROLL DOWN FOR ARTICLE
Full terms and conditions of use: http://www.tandfonline.com/page/terms-and-conditions
This article may be used for research, teaching, and private study purposes. Any substantial or systematicreproduction, redistribution, reselling, loan, sub-licensing, systematic supply, or distribution in any form toanyone is expressly forbidden.
The publisher does not give any warranty express or implied or make any representation that the contentswill be complete or accurate or up to date. The accuracy of any instructions, formulae, and drug dosesshould be independently verified with primary sources. The publisher shall not be liable for any loss, actions,claims, proceedings, demand, or costs or damages whatsoever or howsoever caused arising directly orindirectly in connection with or arising out of the use of this material.
REVIEW ARTICLE
Laser Scanning of Forest Resources: The Nordic Experience
ERIK NÆSSET1, TERJE GOBAKKEN1, JOHAN HOLMGREN2, HANNU HYYPPA3,JUHA HYYPPA4, MATTI MALTAMO5, MATS NILSSON2, HAKAN OLSSON2,ASA PERSSON6 and ULF SODERMAN6
1Department of Ecology and Natural Resource Management, NLH, P.O. Box 5003, NO-1432 As, Norway, 2Department of Forest
Resources Management and Geomatics, SLU, SE-90183 Umea, Sweden, 3Institute of Photogrammetry and Remote Sensing,
Helsinki University of Technology, FI-02015 HUT, Finland, 4Department of Remote Sensing and Photogrammetry, Finnish
Geodetic Institute, FI-02431 Masala, Finland, 5Faculty of Forestry, University of Joensuu, Finland, and 6Department of Laser
Systems, Swedish Defence Research Agency, P.O. Box 1165, SE-58111 Linkoping, Sweden
Næsset, E.1, Gobakken, T.1, Holmgren, J.2, Hyyppa, H.3, Hyyppa, J.4, Maltamo, M.5, Nilsson,
M.2, Olsson, H.2, Persson, A.6 and Soderman, U.6 (1Department of Ecology and Natural
Resource Management, NLH, P.O. Box 5003, NO-1432 As, Norway, 2Department of Forest
Resources Management and Geomatics, SLU, SE-90183 Umea, Sweden, 3Institute of
Photogrammetry and Remote Sensing, Helsinki University of Technology, FI-02015 HUT,
Finland, 4Department of Remote Sensing and Photogrammetry, Finnish Geodetic Institute, FI-
02431 Masala, Finland, 5Faculty of Forestry, University of Joensuu, Finland, and 6Department
of Laser Systems, Swedish Defence Research Agency, P.O. Box 1165, SE-58111 Linkoping,
Sweden). Laser scanning of forest resources: the Nordic experience. Received Mar. 18, 2004.
Accepted Aug. 30, 2004. Scand. J. For. Res. 19: 482�/499, 2004.
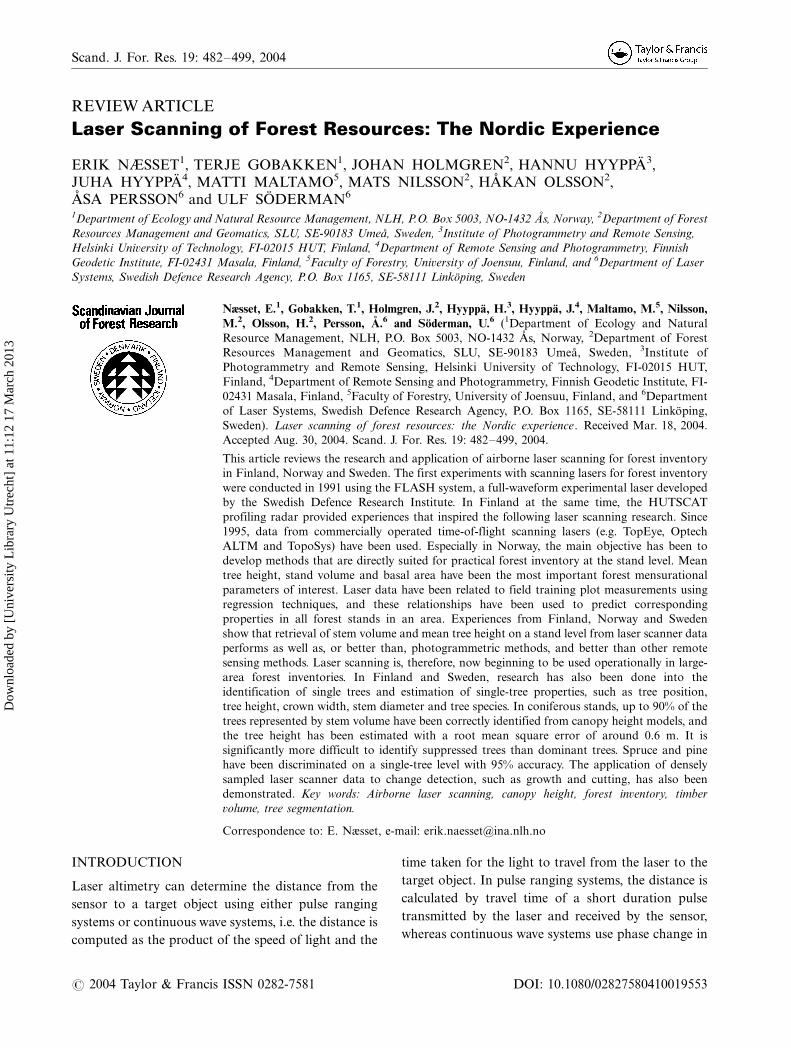
This article reviews the research and application of airborne laser scanning for forest inventory
in Finland, Norway and Sweden. The first experiments with scanning lasers for forest inventory
were conducted in 1991 using the FLASH system, a full-waveform experimental laser developed
by the Swedish Defence Research Institute. In Finland at the same time, the HUTSCAT
profiling radar provided experiences that inspired the following laser scanning research. Since
1995, data from commercially operated time-of-flight scanning lasers (e.g. TopEye, Optech
ALTM and TopoSys) have been used. Especially in Norway, the main objective has been to
develop methods that are directly suited for practical forest inventory at the stand level. Mean
tree height, stand volume and basal area have been the most important forest mensurational
parameters of interest. Laser data have been related to field training plot measurements using
regression techniques, and these relationships have been used to predict corresponding
properties in all forest stands in an area. Experiences from Finland, Norway and Sweden
show that retrieval of stem volume and mean tree height on a stand level from laser scanner data
performs as well as, or better than, photogrammetric methods, and better than other remote
sensing methods. Laser scanning is, therefore, now beginning to be used operationally in large-
area forest inventories. In Finland and Sweden, research has also been done into the
identification of single trees and estimation of single-tree properties, such as tree position,
tree height, crown width, stem diameter and tree species. In coniferous stands, up to 90% of the
trees represented by stem volume have been correctly identified from canopy height models, and
the tree height has been estimated with a root mean square error of around 0.6 m. It is
significantly more difficult to identify suppressed trees than dominant trees. Spruce and pine
have been discriminated on a single-tree level with 95% accuracy. The application of densely
sampled laser scanner data to change detection, such as growth and cutting, has also been
demonstrated. Key words: Airborne laser scanning, canopy height, forest inventory, timber
volume, tree segmentation.
Correspondence to: E. Næsset, e-mail: [email protected]
INTRODUCTION
Laser altimetry can determine the distance from the
sensor to a target object using either pulse ranging
systems or continuous wave systems, i.e. the distance is
computed as the product of the speed of light and the
time taken for the light to travel from the laser to the
target object. In pulse ranging systems, the distance is
calculated by travel time of a short duration pulse
transmitted by the laser and received by the sensor,
whereas continuous wave systems use phase change in
Scand. J. For. Res. 19: 482�/499, 2004
# 2004 Taylor & Francis ISSN 0282-7581 DOI: 10.1080/02827580410019553
Dow
nloa
ded
by [
Uni
vers
ity L
ibra
ry U
trec
ht]
at 1
1:12
17
Mar
ch 2
013
a transmitted signal produced by a continuously
emitting laser to calculate the distance (Wehr &
Lohr 1999). In airborne laser scanning systems
(ALS), a scanner which distributes the transmitted
pulses across the flight direction of the platform is
attached to the laser, and such systems can measure
the three-dimensional (3D) position of points on the
ground and in vegetation canopies with an accuracy of
a few decimetres, and with up to 100 000 measure-
ments per second. Today, such systems are commer-
cially operated for terrain mapping, flood risk
mapping, creating three-dimensional (3D) city models
and planning large construction projects, such as
roads and railways. Laser scanning is also one of the
most promising technologies for retrieval of detailed
3D information about tree canopies and other char-
acteristics, such as stem volume, that are essential for
forest resource inventories. An overview of the state of
the art of airborne laser systems in general is presented
by Baltsavias (1999) and Wehr & Lohr (1999), while
Lim et al. (2003) more specifically reviewed forestry
applications.
Research related to airborne laser scanning for
forest inventory has been active in the Nordic coun-
tries for about 15 yrs. The research in Finland,
Norway and Sweden has until now developed quite
independently, with the development and application
of different sensor systems and with somewhat varied
approaches for extracting forestry relevant informa-
tion from laser point data. The development in
Norway has focused on practical procedures for
retrieval of forest data at the stand level, and since
2002 such methods have been commercially marketed
in Norway as an economically defendable method for
large-area forest surveys. The research in Finland and
Sweden has shown a large potential for extracting
accurate single-tree information from laser scanner
measurements. This review article summarizes the
research in the field of laser scanning of forest
resources in Finland, Norway and Sweden. It also
looks briefly at the status of applications of laser
scanning in forestry in the Nordic countries and some
of the challenges to future development are addressed.
EARLY STUDIES AND DEVELOPMENT OF
SYSTEMS
Beginning around 1980, a number of studies concen-
trated on the feasibility of airborne profiling laser
systems for forest inventory. To the authors’ knowl-
edge, the first published study was conducted in the
Soviet Union (Solodukhin et al. 1977). The results
demonstrated that the root mean square error
(RMSE) for laser-estimated tree heights compared
with photogrammetric estimates was 14 cm. The
Soviet study was soon followed by similar studies in
Canada and the USA (Nelson et al. 1984, Aldred &
Bonnor 1985, Maclean & Krabill 1986).
The idea of using laser-measured canopy profiles
for estimation of tree stem volume was repeated in
Sweden in 1989 using a laser mounted on a boom
truck (Nilsson 1994). In 1991, this experiment was
followed by early attempts to use a scanning distance-
measuring laser system for retrieval of forest
parameters (Nilsson 1994, 1996). Three tests were
conducted using the helicopter-borne FLASH system
(Table 1), which was developed by the Swedish
Defence Research Agency (FOA) primarily for real-
time naval applications (Steinvall et al. 1993, 1999,
Steinvall & Koppari 1996). The FLASH system
captured the full waveform of a return from a laser
pulse. The potential to estimate tree height and stem
volumes using the FLASH system was evaluated on
plots with a 10 m radius. The results showed that tree
heights were underestimated by 2.1�/3.7 m. It was also
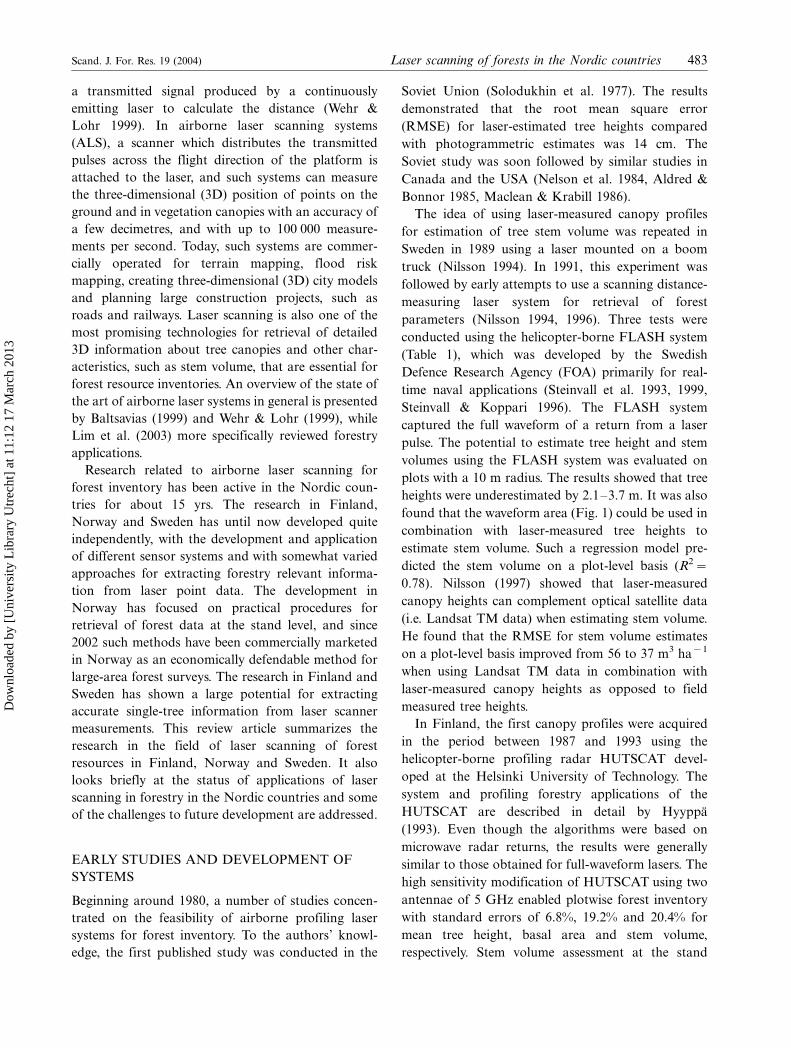
found that the waveform area (Fig. 1) could be used in
combination with laser-measured tree heights to
estimate stem volume. Such a regression model pre-
dicted the stem volume on a plot-level basis (R2�/
0.78). Nilsson (1997) showed that laser-measured
canopy heights can complement optical satellite data
(i.e. Landsat TM data) when estimating stem volume.
He found that the RMSE for stem volume estimates
on a plot-level basis improved from 56 to 37 m3 ha�1
when using Landsat TM data in combination with
laser-measured canopy heights as opposed to field
measured tree heights.
In Finland, the first canopy profiles were acquired
in the period between 1987 and 1993 using the
helicopter-borne profiling radar HUTSCAT devel-
oped at the Helsinki University of Technology. The
system and profiling forestry applications of the
HUTSCAT are described in detail by Hyyppa
(1993). Even though the algorithms were based on
microwave radar returns, the results were generally
similar to those obtained for full-waveform lasers. The
high sensitivity modification of HUTSCAT using two
antennae of 5 GHz enabled plotwise forest inventory
with standard errors of 6.8%, 19.2% and 20.4% for
mean tree height, basal area and stem volume,
respectively. Stem volume assessment at the stand
Scand. J. For. Res. 19 (2004) Laser scanning of forests in the Nordic countries 483
Dow
nloa
ded
by [
Uni
vers
ity L
ibra
ry U
trec
ht]
at 1
1:12
17
Mar
ch 2
013
level revealed a standard error of 26.5% (Hyyppa
1993). The most significant problem encountered was
the inaccurate georeferencing due to inaccuracies in
the Global Positioning System (GPS) at that time. The
method was not used operationally at the time since
the flight costs of the radar system (1 euro ha�1) were
considered too high for practical forest inventory in
Finland.
Internationally, experimental research systems have
been developed that capture the full return waveform,
e.g. Scanning Lidar Imager of Canopies by Echo
Recovery (SLICER) (Lefsky et al. 1999) and Laser
Vegetation Imaging Sensor (LVIS) (Blair et al. 1999).
However, these full-waveform systems are often re-
ferred to as large-footprint systems, i.e. the spot size
on the ground of the transmitted light is typically 10 m
in diameter or greater. In contrast, all studies carried
out in the Nordic countries have been done with laser
systems having a beam diameter on the ground
ranging from 0.1 to 3.8 m (time-of-flight or small-
footprint systems). Although the full-waveform
FLASH system was used in the early Swedish studies,
all later studies in Finland, Norway and Sweden have
been restricted to time-of-flight systems where data
consist of one or two significant peaks in the returning
pulse, i.e. the ‘‘first return’’ and/or ‘‘last return’’ from
each laser pulse.
A problem with the early studies was the lack of
accuracy in the positioning of the laser measurements.
An important step was made when the movements of
the aircraft and the scanner instrument could be
accurately estimated through the integration of GPS
and Inertial Navigation Systems (INS). With the
integrated GPS and INS systems, the ground position
of a laser beam emitted from an airborne sensor can
most often be determined with an accuracy of 0.5 m or
better. This technical breakthrough has led to the
development of operational measurement systems. In
Sweden, the TopEye system was developed between
1993 and 1995, partly based on experiences with the
FLASH system. Since its development, eight of these
systems have been constructed, and most are still
operated by TopEye AB (http://www.topeye.com). The
system is mounted in a pod under a helicopter. The
first and last return pulses are captured, as well as the
amplitude data for these returns. The beam divergence
is adjustable between 1 and 8 mrad. Since 1999 the
system has also included an integrated digital camera.
TopEye has been used for all forestry tests in Sweden
between 1996 and 2002 and has also been tested in
Finland (Table 1).
In Norway, all forest inventory experiments based
on laser scanner data have used various systems
developed by Optech, Canada (Table 1). The first
studies were conducted in 1995 and, to the authors’
knowledge, are the first attempts to use a scanning
airborne laser to collect data for a large continuous
forest for extraction of forestry-related biophysical
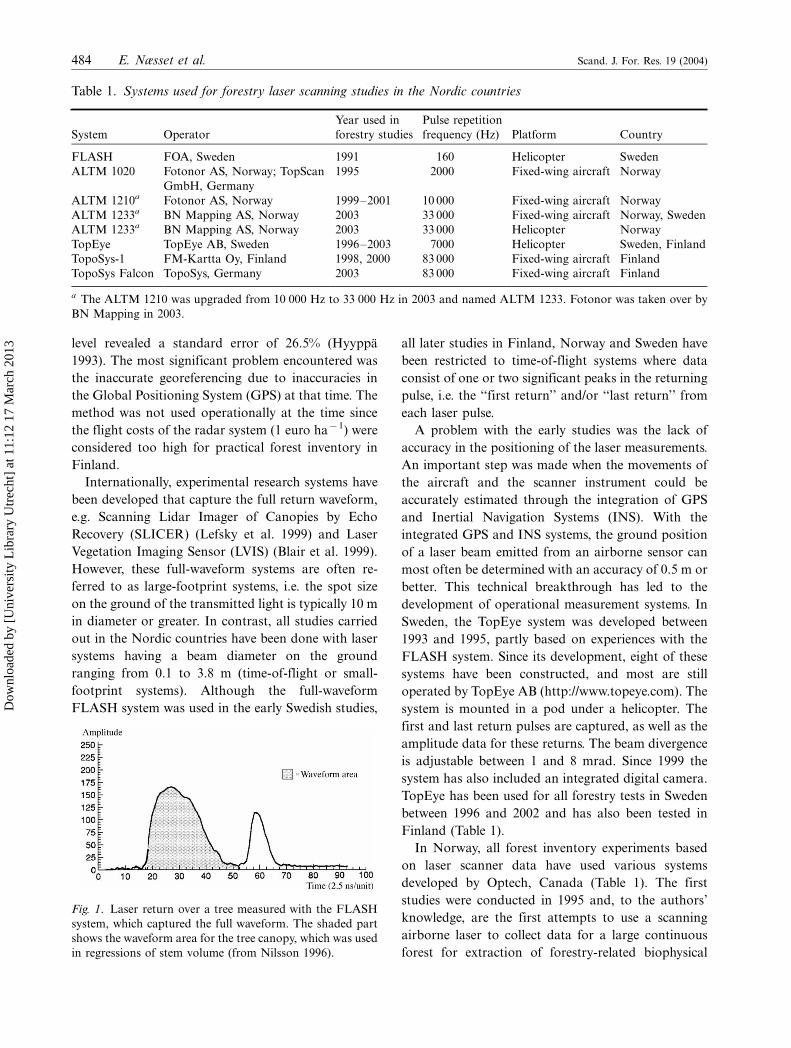
Table 1. Systems used for forestry laser scanning studies in the Nordic countries
System Operator
Year used in
forestry studies
Pulse repetition
frequency (Hz) Platform Country
FLASH FOA, Sweden 1991 160 Helicopter Sweden
ALTM 1020 Fotonor AS, Norway; TopScan
GmbH, Germany
1995 2000 Fixed-wing aircraft Norway
ALTM 1210a Fotonor AS, Norway 1999�/2001 10 000 Fixed-wing aircraft Norway
ALTM 1233a BN Mapping AS, Norway 2003 33 000 Fixed-wing aircraft Norway, Sweden
ALTM 1233a BN Mapping AS, Norway 2003 33 000 Helicopter Norway
TopEye TopEye AB, Sweden 1996�/2003 7000 Helicopter Sweden, Finland
TopoSys-1 FM-Kartta Oy, Finland 1998, 2000 83 000 Fixed-wing aircraft Finland
TopoSys Falcon TopoSys, Germany 2003 83 000 Fixed-wing aircraft Finland
a The ALTM 1210 was upgraded from 10 000 Hz to 33 000 Hz in 2003 and named ALTM 1233. Fotonor was taken over by
BN Mapping in 2003.
Fig. 1. Laser return over a tree measured with the FLASH
system, which captured the full waveform. The shaded part
shows the waveform area for the tree canopy, which was used
in regressions of stem volume (from Nilsson 1996).
484 E. Næsset et al. Scand. J. For. Res. 19 (2004)
Dow
nloa
ded
by [
Uni
vers
ity L
ibra
ry U
trec
ht]
at 1
1:12
17
Mar
ch 2
013
characteristics. The studies in 1995 (Næsset 1997a ,
1997b ) were part of a promotion campaign in Norway
led by the German firm TopScan and the Norwegian
operator Fotonor. An ALTM 1020 system with a pulse
frequency of 2 kHz was used (Table 1). The system was
mounted on a fixed-wing aircraft. In 1999, Fotonor
acquired an ALTM 1210 system with a pulse fre-
quency of 10 kHz. This system was mounted in a
fixed-wing aircraft and used in six different tests
during the period between 1999 and 2001. The system
was upgraded in 2003 to a repetition frequency of
33 kHz (i.e. ALTM 1233), and conducted forestry-
related missions in Norway and Sweden during the
spring and summer of 2003. Typical flying altitudes in
all of these projects have ranged between 500 and
1000 m above ground level, and the pulse density has
been roughly 1 pulse m�2.
The research in Finland has been carried out mostly
with data from the German TopoSys-1 and TopoSys
Falcon systems. The use of TopoSys data started in
1998 within the EC-funded HIGH-SCAN project
entitled ‘‘Assessing forest stand attributes by inte-
grated use of the high-resolution satellite imagery
and laser scanner data’’. The TopoSys system was
selected to guarantee a high sampling density (83 kHz)
enabling single-tree-based solutions, an idea that was
expressed in the mid-1990s. The narrow scan angle
(7.18 at the maximum) is another characteristic of
TopoSys. In TopoSys-1, the first and last pulses had to
be recorded separately, whereas in the TopoSys
Falcon system both modes were integrated, along
with intensity. The campaigns with TopoSys-1 were
carried out in 1998 and 2000 and with the TopoSys
Falcon system in 2003. In all these campaigns,
two different flight altitudes were used, i.e. an
altitude of 400 m above ground giving pulse densities
of 8�/10 pulses m�2 and an altitude of 800 m giving
pulse densities of 4�/5 pulses m�2 for each strip.
However, owing to the overlapping of the laser strips,
the final pulse density is approximately 30�/50% higher
than these densities for each altitude. It should also
be noted that in the TopoSys system, the spacing
of the pulses on the ground is significantly higher in
the alongtrack direction than in the across-track
direction.
INVENTORY OF FOREST STANDS AND
SAMPLE PLOTS
In the Nordic countries, forest stands, typically of 1�/
10 ha in size, are the basic unit in forest management
and planning. Thus, characteristics at the stand level
are requested for strategic planning at the property
level and for tactical and operational planning of
silvicultural treatments and forest operations. Many
forest management planning systems are based on the
use of stand mean values of biophysical variables, such
as site quality, stand age, tree species, tree height,
diameter at breast height, basal area, stem number
and volume, while other systems also need informa-
tion about, for example, the diameter distribution.
In 1995, the first experiments to estimate stand
mean values of biophysical variables using laser data
were carried out in 36 coniferous stands from two
test sites in the eastern part of Norway. The main
objectives were to derive mean tree height weighted
by basal area (Næsset 1997a) and stand volume
(Næsset 1997b ) of individual stands based on laser
scanner data with a pulse density of approximately
0.1 pulses m�2. The footprint diameter was approxi-
mately 13�/16 cm and the maximum scan angle (off
nadir) was 208. Dominant tree species in the two test
sites were Scots pine (Pinus sylvestris ) and Norway
spruce (Picea abies ).
First, the mean tree heights of the test stands
were compared with the average value of all laser
pulses that were classified as canopy returns. It was
revealed that the mean value computed from the laser
data underestimated the ground measurements by
4.1�/5.5 m. A similar tendency of underestimation
has been reported in many other studies. The two
major reasons for this underestimation are (1) that the
light transmitted by the laser will usually penetrate the
outer surface of the tree crowns before a significant
return signal is recorded (Gaveau & Hill 2003), and (2)
that a large portion of the pulses will be reflected from
the lower part of the visible tree crowns.
To eliminate the impact of laser pulses that are
reflected from the lower parts of the canopy, a grid-
based approach was considered. The stands were
divided into regular grids with cells of equal size and
only the maximum laser height value within each cell
was retained. The laser mean height of a stand was
computed as the arithmetic mean of these cell max-
ima. Such computations were carried out for different
cell sizes. For cells 15�/15 m in size, the laser-based
mean height estimates were unbiased and the precision
was fairly high (7.4�/8.1%, Table 2). The grid-based
approach was also tested for estimation of stand
volume. A regression model that predicts stand
volume as a function of the grid-based mean laser
Scand. J. For. Res. 19 (2004) Laser scanning of forests in the Nordic countries 485
Dow
nloa
ded
by [
Uni
vers
ity L
ibra
ry U
trec
ht]
at 1
1:12
17
Mar
ch 2
013
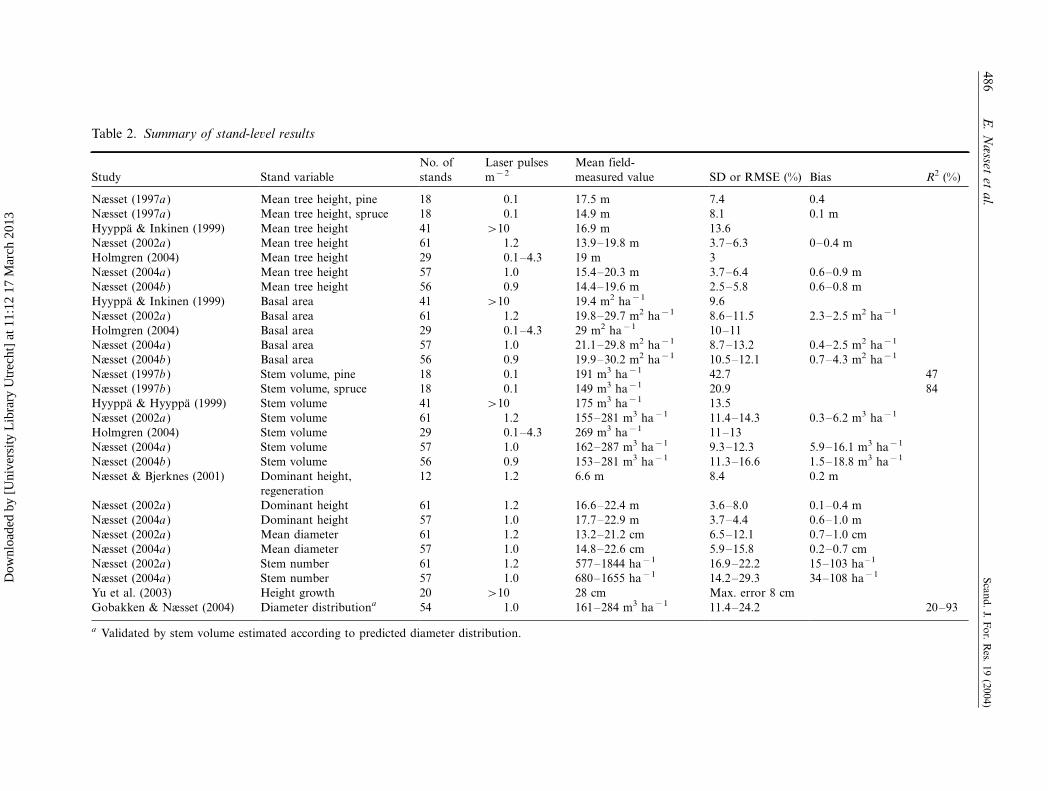
Table 2. Summary of stand-level results
Study Stand variable
No. of
stands
Laser pulses
m�2Mean field-
measured value SD or RMSE (%) Bias R2 (%)
Næsset (1997a ) Mean tree height, pine 18 0.1 17.5 m 7.4 0.4
Næsset (1997a ) Mean tree height, spruce 18 0.1 14.9 m 8.1 0.1 m
Hyyppa & Inkinen (1999) Mean tree height 41 �/10 16.9 m 13.6
Næsset (2002a ) Mean tree height 61 1.2 13.9�/19.8 m 3.7�/6.3 0�/0.4 m
Holmgren (2004) Mean tree height 29 0.1�/4.3 19 m 3
Næsset (2004a ) Mean tree height 57 1.0 15.4�/20.3 m 3.7�/6.4 0.6�/0.9 m
Næsset (2004b ) Mean tree height 56 0.9 14.4�/19.6 m 2.5�/5.8 0.6�/0.8 m
Hyyppa & Inkinen (1999) Basal area 41 �/10 19.4 m2 ha�1 9.6
Næsset (2002a ) Basal area 61 1.2 19.8�/29.7 m2 ha�1 8.6�/11.5 2.3�/2.5 m2 ha�1
Holmgren (2004) Basal area 29 0.1�/4.3 29 m2 ha�1 10�/11
Næsset (2004a ) Basal area 57 1.0 21.1�/29.8 m2 ha�1 8.7�/13.2 0.4�/2.5 m2 ha�1
Næsset (2004b ) Basal area 56 0.9 19.9�/30.2 m2 ha�1 10.5�/12.1 0.7�/4.3 m2 ha�1
Næsset (1997b ) Stem volume, pine 18 0.1 191 m3 ha�1 42.7 47
Næsset (1997b ) Stem volume, spruce 18 0.1 149 m3 ha�1 20.9 84
Hyyppa & Hyyppa (1999) Stem volume 41 �/10 175 m3 ha�1 13.5
Næsset (2002a ) Stem volume 61 1.2 155�/281 m3 ha�1 11.4�/14.3 0.3�/6.2 m3 ha�1
Holmgren (2004) Stem volume 29 0.1�/4.3 269 m3 ha�1 11�/13
Næsset (2004a ) Stem volume 57 1.0 162�/287 m3 ha�1 9.3�/12.3 5.9�/16.1 m3 ha�1
Næsset (2004b ) Stem volume 56 0.9 153�/281 m3 ha�1 11.3�/16.6 1.5�/18.8 m3 ha�1
Næsset & Bjerknes (2001) Dominant height,
regeneration
12 1.2 6.6 m 8.4 0.2 m
Næsset (2002a ) Dominant height 61 1.2 16.6�/22.4 m 3.6�/8.0 0.1�/0.4 m
Næsset (2004a ) Dominant height 57 1.0 17.7�/22.9 m 3.7�/4.4 0.6�/1.0 m
Næsset (2002a ) Mean diameter 61 1.2 13.2�/21.2 cm 6.5�/12.1 0.7�/1.0 cm
Næsset (2004a ) Mean diameter 57 1.0 14.8�/22.6 cm 5.9�/15.8 0.2�/0.7 cm
Næsset (2002a ) Stem number 61 1.2 577�/1844 ha�1 16.9�/22.2 15�/103 ha�1
Næsset (2004a ) Stem number 57 1.0 680�/1655 ha�1 14.2�/29.3 34�/108 ha�1
Yu et al. (2003) Height growth 20 �/10 28 cm Max. error 8 cm
Gobakken & Næsset (2004) Diameter distributiona 54 1.0 161�/284 m3 ha�1 11.4�/24.2 20�/93
a Validated by stem volume estimated according to predicted diameter distribution.
48
6E
.N
æsset
eta
l.S
can
d.
J.F
or.
Res.
19
(20
04
)
Dow
nloa
ded
by [
Uni
vers
ity L
ibra
ry U
trec
ht]
at 1
1:12
17
Mar
ch 2
013
height and the average proportion of canopy hits
for all grid cells in a stand was developed. The results
of the regression analysis indicated that a large portion
of the variability in stand volume could be explained
for spruce forest (R2�/0.84), but not for pine forest
(R2�/0.47) (Table 2). The major conclusions of these
two initial studies were that it was possible to obtain
very precise estimates of stand height, and that it may
be possible to estimate stand volume by regression
analysis, at least for certain forest types.
Large-area forest inventory
These two initial trials motivated further studies based
on the idea that airborne laser data could be used to
inventory large forest areas provided that precisely
georeferenced field sample plots are used in a first step
as training data to develop empirical relationships
between laser data and biophysical variables (e.g.
mean tree height and stand volume). These relation-
ships are then used in a second step to predict the
characteristics for all forest stands in the area in
question.
However, of critical importance is the georeferencing
of field plots below tree canopies. Research around
1996�/1997 indicated a potential accuracy of 3�/4 m
using differential GPS measurements under tree cano-
pies (Deckert & Bolstad 1996). Positioning errors of
this magnitude will introduce a large variability in
relationships between laser data and ground data on
small sample plots owing to spatial heterogeneity
(Bolduc et al. 1999). Efforts were therefore made to
find appropriate GPS solutions that could meet the
requirements for high-precision field inventories. Sev-
eral types of GPS and Global Navigation Satellite
System (GLONASS) receivers and different measure-
ment and processing procedures were tested (Næsset
1999, 2001, Næsset et al. 2000, Næsset & Jonmeister
2002). These tests indicated that an average positional
accuracy of 0.2�/0.7 m may be obtained under tree
canopies with basal area up to about 40 m2 ha�1 using
combined GPS�/GLONASS dual-frequency measure-
ments collected for 15�/20 min (Næsset 2001). Most of
the practical laser research in Norway since then has
been based on these procedures.
The two-stage procedure for stand inventory of
large forest areas based on laser data, in which stand
estimates of biophysical variables were computed by
regression equations developed from field plots, was
first described by Næsset & Bjerknes (2001). The first
validation of the proposed inventory procedure was
accomplished in 1999. A 10 km2 study area was
measured with a density of 1 pulse m�2 using an
Optech ALTM 1210 system (Næsset 2002). In this
study, 144 sample plots of size 200 m2 were distributed
systematically throughout the entire study area. The
plots comprised both young and mature forest,
and dominant species were Norway spruce, Scots
pine and birch. For each sample plot, canopy height
distributions were derived from first and last return
laser data. Canopy densities were also computed for
different fractions of the height distributions. Regres-
sion analysis with stepwise variable selection was used
to derive regression models for mean tree height,
dominant height, mean diameter, basal area, stand
volume and stem number. It was found that the
regression models were improved by dividing the
dataset into three strata according to age and site
quality (young forest, mature forest on poor sites and
mature forest on good sites). For mean tree height,
basal area and stand volume the models explained 82�/
95%, 69�/89% and 80�/93% of the plot-level variability,
respectively (Table 3).
In the proposed inventory procedure, all forest
stands within the area in question were divided into
grid cells with size equal to the field sample plots. The
estimated regression equations were then used to
predict corresponding properties for the grid cells in
all forest stands. Finally, stand mean values were
calculated as the arithmetic mean of the individual
grid cell values within each stand. A total of 61 stands
with a size of 0.7�/11.7 ha was selected to validate the
accuracy of the estimates. The results indicated high
precision and small bias for most of the validated
characteristics (Table 2).
In 2001, a second test of the proposed procedure
was carried out in a 65 km2 study area with hilly
terrain (Næsset 2004a). The dominant tree species
were Norway spruce and Scots pine. The Optech
ALTM 1210 system was deployed in a flight plan
in such a manner as to provide laser data with an
average sampling density of 1 pulse m�2. A total of
100 sample plots (i.e. 233 m2 each) was used to
develop regression equations predicting mean tree
height, dominant height, mean diameter, basal area,
stand volume and stem number. Before the regression
equations were developed, the area was divided into
the three strata defined in the first study (Næsset 2002,
see above). The predictions were validated for 57 large
control plots with a size of about 0.4 ha. Validation
results demonstrated that the estimation accuracy was
Scand. J. For. Res. 19 (2004) Laser scanning of forests in the Nordic countries 487
Dow
nloa
ded
by [
Uni
vers
ity L
ibra
ry U
trec
ht]
at 1
1:12
17
Mar
ch 2
013
similar to that obtained in the first study. For
biophysical properties such as mean tree height, basal
area and volume, the precision was 3.7�/6.4%, 8.7�/
13.2% and 9.3�/12.3%, respectively (Table 2).
It was revealed that large variability in flying
altitudes and laser sampling density had little effect
on the precision of the procedure (Næsset 2004a ). The
stability of the estimates of biophysical properties
under variable flying altitudes was confirmed in a
second study where laser data from two different
flying altitudes (530�/540 m and 840�/850 m above
ground level) were analysed (Næsset 2004b ). However,
a mixture of coniferous and deciduous species may
degrade the precision seriously. Regression equations
for stand volume and basal area developed from a
material of coniferous sample plots tended to produce
biased estimates of stands with a large portion of
deciduous trees (Næsset 2004a), probably because the
relationships between stand volume (and basal area)
and canopy density as measured by the laser differ
between different tree species, and in particular
between conifers with narrow and conical crowns
and deciduous species, which tend to develop wide
and rounded crowns.
The grid-based approach for predicting forest vari-
ables on a stand level using laser data has also been
tested in Sweden (Holmgren 2004). This study was
carried out at the Remningstorp test site, in south�/
western Sweden, which is dominated by Norway
spruce and Scots pine. Field sample plots with a
10 m radius were used to develop regression models
that related variables derived from laser data to mean
tree height, basal area and stand volume. Regression
models for prediction of tree height, basal area and
stem volume were validated using 29 square sample
plots (80�/80 m2). The RMSE values for all variables
were quite low, both on a plot level and for the
validation data (Table 2). In addition, they were of a
magnitude similar to those reported for the Norwe-
gian studies (Næsset 2002, 2004a). The effects of
reducing the sampling density on the accuracy of the
predictions were also assessed. The initial pulse
density of 4.29 pulses m�2 was reduced to 0.55, 0.17
and 0.10 pulses m�2. The RMSE values for mean tree
height, basal area and stem volume estimations were
similar for all four measurement densities. The find-
ings in the scientific studies in Norway and Sweden, in
terms of bias and precision, were later confirmed in
the first operational forest inventory in the Nordic
countries using laser data collected over an area of
250 km2 (Næsset 2004c ).
In a Finnish study, laser-based estimates of mean
tree height and stand volume were compared with
estimates produced by other airborne (i.e. AISA
imaging spectrometer) and satellite remote sensing
data (i.e. Landsat TM, SPOT Pan and XS) (Hyyppa &
Hyyppa 1999). The first-pulse laser scanner data
collected with the TopoSys-1 system for the Kalkkinen
test site were used. The best possible predictors of the
data sources were compared using regression analysis.
The adjusted coefficient of determination, the cor-
rected standard error of the model and the standard
errors in percentage were calculated for each data
source. The data for the estimation of tree height in
decreasing order of explanatory power were (1) first-
pulse laser scanner, (2) imaging AISA, (3) Landsat
TM, (4) Spot XS and (5) Spot Pan. In the estimation
of stem volume the corresponding order was similar,
i.e. laser scanner, AISA, SPOT XS, Landsat TM and
Spot Pan. The standard errors obtained in the stem
volume estimation were 13.5% and 49.6% for the laser
scanner and Spot Pan data, respectively (Table 2). Of
the data types tested, laser scanner data were alone in
providing accuracies similar or superior to conven-
tional forest inventory methods.
The main conclusions from these trials are that the
tested procedures, although slightly different between
countries and validated with data from different laser
instruments, seem to be robust for use in practical
inventories over large areas, at least if the forest is
dominated by coniferous species. Topographic varia-
bility and variability in laser sampling density seem to
have limited impact on the applicability of the stand-
based procedures. The bias seems to be at an
acceptable level, and the precision for most of the
evaluated stand characteristics is higher than those
obtained using traditional inventory methods. The
methods are also superior to conventional inventory
methods as far as inventory costs and data utility in
economical terms are concerned. This was confirmed
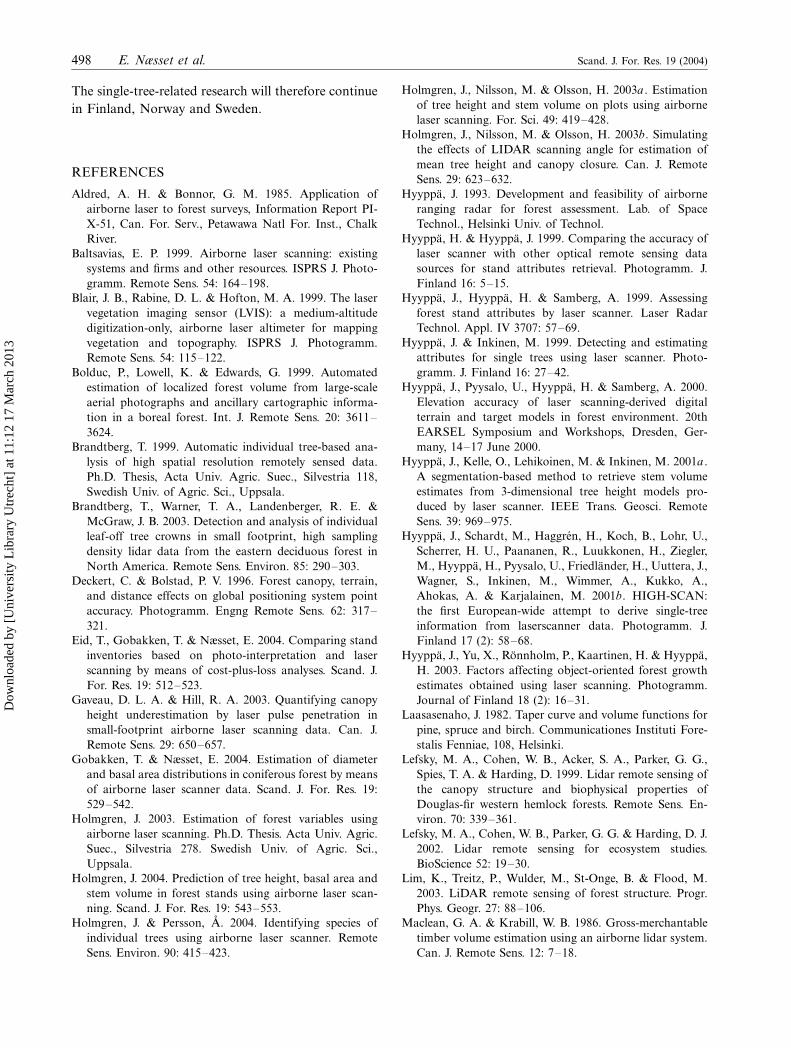
in a study in which the total inventory costs and utility
losses due to erroneous data were compared for 77
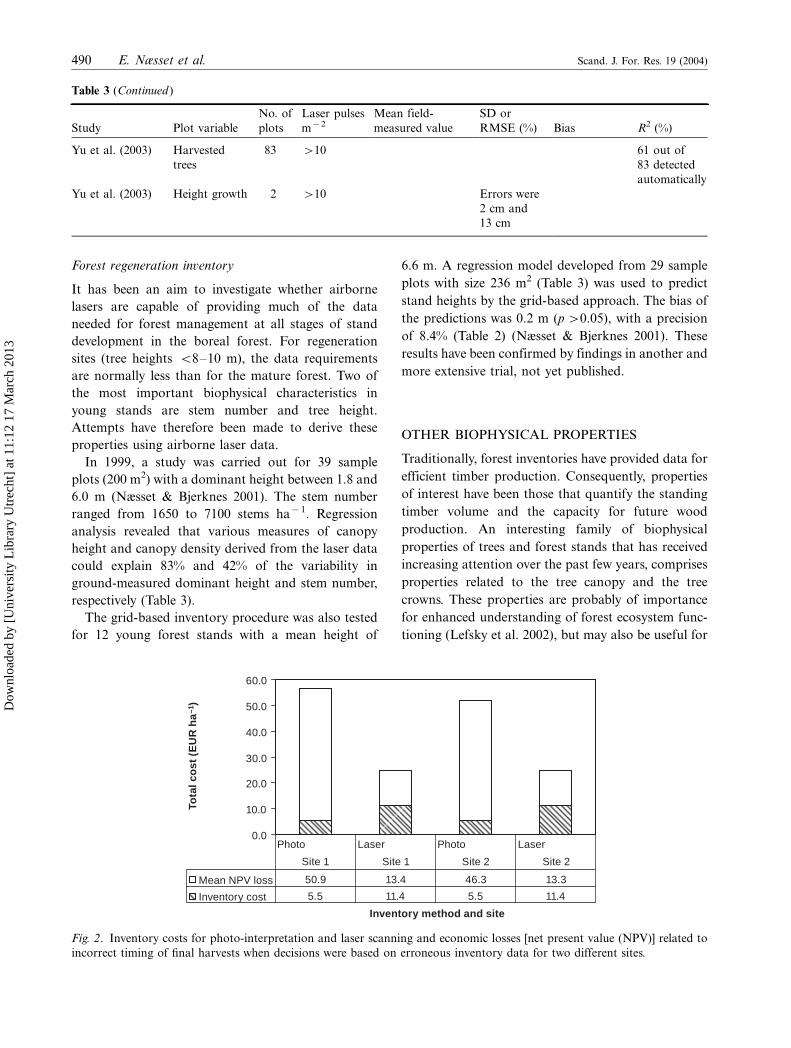
sample stands (Eid et al. 2004). The authors’ revealed
that the sum of inventory costs and economic losses
was approximately 52�/56 euros ha�1 for photo-
interpretation and around 25 euros ha�1 for the
laser-based inventory (Fig. 2). The economic losses
were due to wrong timing of final harvest because of
erroneous inventory data.
488 E. Næsset et al. Scand. J. For. Res. 19 (2004)
Dow
nloa
ded
by [
Uni
vers
ity L
ibra
ry U
trec
ht]
at 1
1:12
17
Mar
ch 2
013
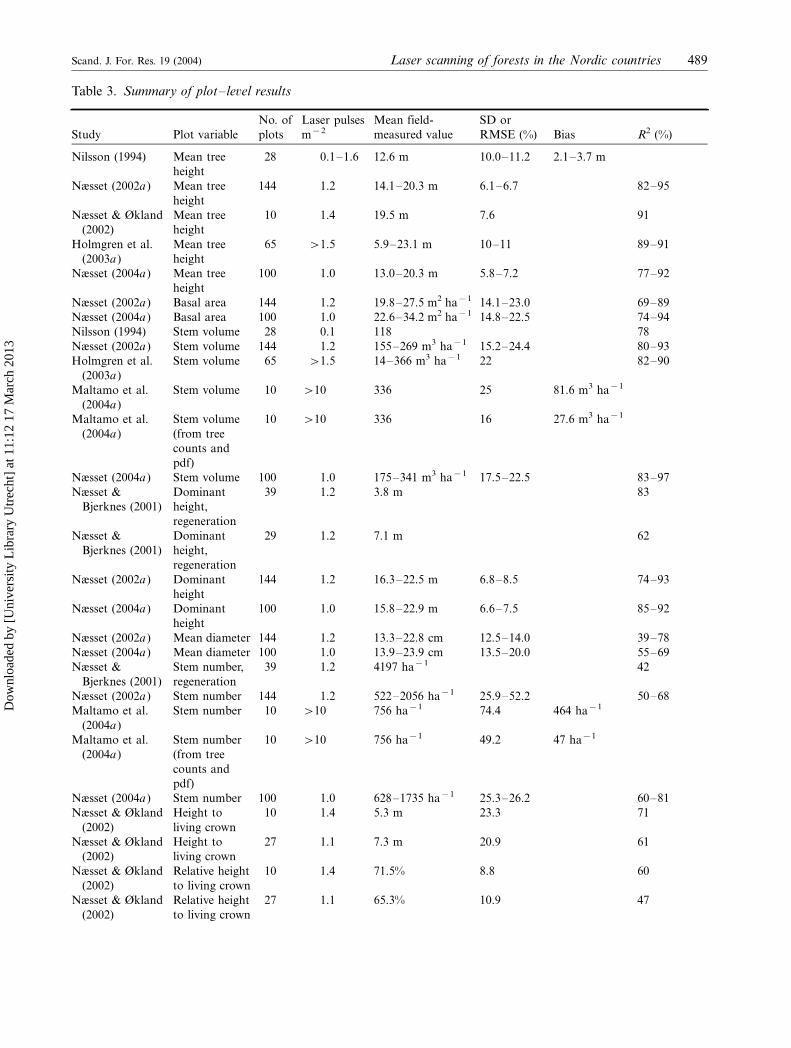
Table 3. Summary of plot�/level results
Study Plot variable
No. of
plots
Laser pulses
m�2Mean field-
measured value
SD or
RMSE (%) Bias R2 (%)
Nilsson (1994) Mean tree
height
28 0.1�/1.6 12.6 m 10.0�/11.2 2.1�/3.7 m
Næsset (2002a ) Mean tree
height
144 1.2 14.1�/20.3 m 6.1�/6.7 82�/95
Næsset & Økland
(2002)
Mean tree
height
10 1.4 19.5 m 7.6 91
Holmgren et al.
(2003a )
Mean tree
height
65 �/1.5 5.9�/23.1 m 10�/11 89�/91
Næsset (2004a ) Mean tree
height
100 1.0 13.0�/20.3 m 5.8�/7.2 77�/92
Næsset (2002a ) Basal area 144 1.2 19.8�/27.5 m2 ha�1 14.1�/23.0 69�/89
Næsset (2004a ) Basal area 100 1.0 22.6�/34.2 m2 ha�1 14.8�/22.5 74�/94
Nilsson (1994) Stem volume 28 0.1 118 78
Næsset (2002a ) Stem volume 144 1.2 155�/269 m3 ha�1 15.2�/24.4 80�/93
Holmgren et al.
(2003a )
Stem volume 65 �/1.5 14�/366 m3 ha�1 22 82�/90
Maltamo et al.
(2004a )
Stem volume 10 �/10 336 25 81.6 m3 ha�1
Maltamo et al.
(2004a )
Stem volume
(from tree
counts and
pdf)
10 �/10 336 16 27.6 m3 ha�1
Næsset (2004a ) Stem volume 100 1.0 175�/341 m3 ha�1 17.5�/22.5 83�/97
Næsset &
Bjerknes (2001)
Dominant
height,
regeneration
39 1.2 3.8 m 83
Næsset &
Bjerknes (2001)
Dominant
height,
regeneration
29 1.2 7.1 m 62
Næsset (2002a ) Dominant
height
144 1.2 16.3�/22.5 m 6.8�/8.5 74�/93
Næsset (2004a ) Dominant
height
100 1.0 15.8�/22.9 m 6.6�/7.5 85�/92
Næsset (2002a ) Mean diameter 144 1.2 13.3�/22.8 cm 12.5�/14.0 39�/78
Næsset (2004a ) Mean diameter 100 1.0 13.9�/23.9 cm 13.5�/20.0 55�/69
Næsset &
Bjerknes (2001)
Stem number,
regeneration
39 1.2 4197 ha�1 42
Næsset (2002a ) Stem number 144 1.2 522�/2056 ha�1 25.9�/52.2 50�/68
Maltamo et al.
(2004a )
Stem number 10 �/10 756 ha�1 74.4 464 ha�1
Maltamo et al.
(2004a )
Stem number
(from tree
counts and
pdf)
10 �/10 756 ha�1 49.2 47 ha�1
Næsset (2004a ) Stem number 100 1.0 628�/1735 ha�1 25.3�/26.2 60�/81
Næsset & Økland
(2002)
Height to
living crown
10 1.4 5.3 m 23.3 71
Næsset & Økland
(2002)
Height to
living crown
27 1.1 7.3 m 20.9 61
Næsset & Økland
(2002)
Relative height
to living crown
10 1.4 71.5% 8.8 60
Næsset & Økland
(2002)
Relative height
to living crown
27 1.1 65.3% 10.9 47
Scand. J. For. Res. 19 (2004) Laser scanning of forests in the Nordic countries 489
Dow
nloa
ded
by [
Uni
vers
ity L
ibra
ry U
trec
ht]
at 1
1:12
17
Mar
ch 2
013
Forest regeneration inventory
It has been an aim to investigate whether airborne
lasers are capable of providing much of the data
needed for forest management at all stages of stand
development in the boreal forest. For regeneration
sites (tree heights B/8�/10 m), the data requirements
are normally less than for the mature forest. Two of
the most important biophysical characteristics in
young stands are stem number and tree height.
Attempts have therefore been made to derive these
properties using airborne laser data.
In 1999, a study was carried out for 39 sample
plots (200 m2) with a dominant height between 1.8 and
6.0 m (Næsset & Bjerknes 2001). The stem number
ranged from 1650 to 7100 stems ha�1. Regression
analysis revealed that various measures of canopy
height and canopy density derived from the laser data
could explain 83% and 42% of the variability in
ground-measured dominant height and stem number,
respectively (Table 3).
The grid-based inventory procedure was also tested
for 12 young forest stands with a mean height of
6.6 m. A regression model developed from 29 sample
plots with size 236 m2 (Table 3) was used to predict
stand heights by the grid-based approach. The bias of
the predictions was 0.2 m (p �/0.05), with a precision
of 8.4% (Table 2) (Næsset & Bjerknes 2001). These
results have been confirmed by findings in another and
more extensive trial, not yet published.
OTHER BIOPHYSICAL PROPERTIES
Traditionally, forest inventories have provided data for
efficient timber production. Consequently, properties
of interest have been those that quantify the standing
timber volume and the capacity for future wood
production. An interesting family of biophysical
properties of trees and forest stands that has received
increasing attention over the past few years, comprises
properties related to the tree canopy and the tree
crowns. These properties are probably of importance
for enhanced understanding of forest ecosystem func-
tioning (Lefsky et al. 2002), but may also be useful for
Table 3 (Continued )
Study Plot variable
No. of
plots
Laser pulses
m�2Mean field-
measured value
SD or
RMSE (%) Bias R2 (%)
Yu et al. (2003) Harvested
trees
83 �/10 61 out of
83 detected
automatically
Yu et al. (2003) Height growth 2 �/10 Errors were
2 cm and
13 cm
0.0
10.0
20.0
30.0
40.0
50.0
60.0
Inventory method and site
Tota
l co
st (
EU
R h
a–1
)
Mean NPV loss 50.9 13.4 46.3 13.3
Inventory cost 5.5 11.4 5.5 11.4
Photo Laser Photo Laser
Site 1 Site 1 Site 2 Site 2
Fig. 2. Inventory costs for photo-interpretation and laser scanning and economic losses [net present value (NPV)] related to
incorrect timing of final harvests when decisions were based on erroneous inventory data for two different sites.
490 E. Næsset et al. Scand. J. For. Res. 19 (2004)
Dow
nloa
ded
by [
Uni
vers
ity L
ibra
ry U
trec
ht]
at 1
1:12
17
Mar
ch 2
013
the description of solid wood quality (Næsset &
Økland 2002).
Næsset & Økland (2002) analysed the capability for
determining wood quality-related characteristics of
individual trees and for the average of several trees
within plots from small-footprint laser data. In 1999,
laser data with a sampling density of 0.6�/
2.3 pulses m�2 were acquired over two different sites
in eastern Norway. Both sites were dominated by
Norway spruce and only mature forests were included
in the test. Canopy height distributions and corre-
sponding canopy densities were derived from the first
and last return laser data and regression analyses were
used to relate the field-measured crown properties to
the laser data. For the first test site, height distribu-
tions were derived for individual crowns as well as for
entire plots (50 m2). For the second test site, height
distributions were derived at the plot level (200 m2).
Two contrasting crown properties were assessed, i.e.
the height from the forest floor to the living crown (hc)
and the relative crown height. Relative crown height
was defined as the crown length as a percentage of
total tree height. The validation revealed large stan-
dard deviations for the differences between predicted
and observed hc of individual trees (Table 4) as well as
for the average of all trees within plots (Table 3). The
relative crown height was predicted with higher
precision. This trial, though limited in the total
number of observations, indicates that certain crown
variables can be derived from laser data with moderate
sampling density.
The stem diameter distribution is another essential
property of forest stands of significant importance in
growth and yield projections, and for estimation of
extraction costs and timber value. Gobakken &
Næsset (2004) showed that there is a strong relation-
ship between stem diameter and laser data, at least in
single-layered stands. They derived empirical diameter
and basal area distributions for 54 plots of 3740 m2
each. Regression analyses were used to relate the
Weibull distribution parameters and percentiles to
various canopy heights and canopy density metrics
derived from laser data over young and mature
coniferous forest. The plots were divided into three
strata according to age class and site quality. The
various regression models explained 20�/93% of the
variability (Table 2). Total plot volume predicted from
the estimated distributions was used to assess the
accuracy of the regressions. The standard deviations of
the differences between predicted and field measured
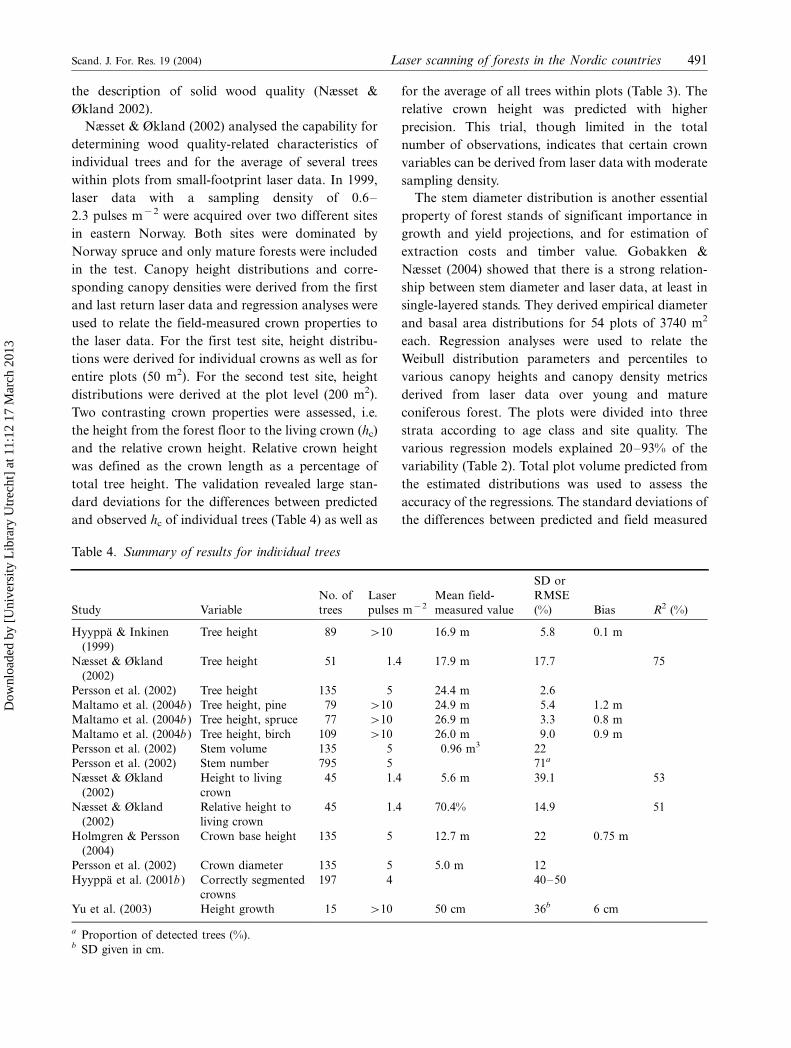
Table 4. Summary of results for individual trees
Study Variable
No. of
trees
Laser
pulses m�2Mean field-
measured value
SD or
RMSE
(%) Bias R2 (%)
Hyyppa & Inkinen
(1999)
Tree height 89 �/10 16.9 m 5.8 0.1 m
Næsset & Økland
(2002)
Tree height 51 1.4 17.9 m 17.7 75
Persson et al. (2002) Tree height 135 5 24.4 m 2.6
Maltamo et al. (2004b ) Tree height, pine 79 �/10 24.9 m 5.4 1.2 m
Maltamo et al. (2004b ) Tree height, spruce 77 �/10 26.9 m 3.3 0.8 m
Maltamo et al. (2004b ) Tree height, birch 109 �/10 26.0 m 9.0 0.9 m
Persson et al. (2002) Stem volume 135 5 0.96 m3 22
Persson et al. (2002) Stem number 795 5 71a
Næsset & Økland
(2002)
Height to living
crown
45 1.4 5.6 m 39.1 53
Næsset & Økland
(2002)
Relative height to
living crown
45 1.4 70.4% 14.9 51
Holmgren & Persson
(2004)
Crown base height 135 5 12.7 m 22 0.75 m
Persson et al. (2002) Crown diameter 135 5 5.0 m 12
Hyyppa et al. (2001b ) Correctly segmented
crowns
197 4 40�/50
Yu et al. (2003) Height growth 15 �/10 50 cm 36b 6 cm
a Proportion of detected trees (%).b SD given in cm.
Scand. J. For. Res. 19 (2004) Laser scanning of forests in the Nordic countries 491
Dow
nloa
ded
by [
Uni
vers
ity L
ibra
ry U
trec
ht]
at 1
1:12
17
Mar
ch 2
013
estimates of plot volume were 11.4�/24.2%. For basal
area distributions, the precision of predicted volume
was 11.4�/15.5%, which corresponds quite well with
results outlined above.
Plot-level estimates and view-angle effects
During 1997, laser data were acquired at the Re-
mningstorp test site in Sweden. Both single-tree
methods and plot-based methods were used for
estimation of mean tree height and stem volume at
the plot level (Holmgren et al. 2003a ). Mean tree
heights for plots were estimated with an RMSE of 10�/
11% of the mean tree height (Table 3). The bias was
lower for single-tree methods than for area-based
methods. Estimation of stem volume using laser-
derived mean tree heights and crown-coverage area
gave an RMSE at the plot level of 22% (Table 3),
whereas another regression function based on tree
height and results from an early stem number counting
algorithm gave an RMSE value of 26%. It was
also found that the view angle (up to 208 off nadir)
had a significant influence on canopy closure esti-
mates, but not on tree height measurements. This
observation was confirmed in a later simulation study
by Holmgren et al. (2003b ). The simulation study also
showed that the view-angle dependence was more
significant for tree species with long crowns, such as
spruce, than for those with short crowns, such as pine.
It was also revealed that the upper height percentiles
were less affected by differences in scanning angle than
the lower percentiles.
METHODS FOR EXTRACTION OF SINGLE-
TREE FEATURES
The basic idea of single-tree-based forest inventory is
that the calculation of the stand attributes for an
individual stand is based on measurements of the
position, tree height, species and crown area for
individually detected trees. All other stand variables
are derived from these basic characteristics, possibly
also in combination with field data. The position, tree
height and tree crown areas can be obtained from laser
scanner data, whereas the tree species is obtained from
image data, from laser data, or from a combination of
laser and image data.
Delineation of individual tree crowns
It has been shown by Brandtberg (1999) and
Hyyppa & Inkinen (1999) that single trees are
detectable in high-density laser data. One promising
method for the detection and measuring of single trees
has been developed at FOA in Sweden. The method
consists of three main steps: (1) a digital canopy model
(DCM) is created using an active surface algorithm;
(2) the DCM is smoothed with different scales; and (3)
the appropriate scale in different parts of the image is
determined by fitting a parabolic surface to the
canopy model (Persson et al. 2002). When the method
was validated at the Remningstorp test site, it was
found that over 70% of the trees, representing 91% of
the stem volume, were detected (Persson et al. 2002)
(Table 4).
In Finland, the first method developed for single-
tree detection from laser measurements was based on
determination of local maxima in a low-pass filtered
canopy height model followed by a segmentation
procedure similar to watershed segmentation (Hyyppa
& Inkinen 1999, Hyyppa et al. 2001a, Maltamo et al.
2004b). This segmentation algorithm was compared
with other segmentation algorithms developed at
Joanneum Research, Austria, and the University of
Freiburg, Germany (Hyyppa et al. 2001b). Three
different segmentation algorithms were applied to a
small test site in Hohentauern, Austria. For verifica-
tion purposes, 197 single trees from eight reference
areas with 15�/30 trees from each area were surveyed
by ground measurements. In general, 40�/50% of the
tree crowns were correctly segmented using different
segmentation algorithms (Finnish algorithm 40%,
German 44%, Austrian 50%). The errors in the
Finnish algorithm were mainly caused by merged
crowns due to non-detection of shadowed trees
and missing maxima caused by oversmoothing. The
German algorithm failed to segment 53 trees, the
Austrian algorithm missed one tree, whereas the
Finnish algorithm did not miss any trees. It should
be noted that the percentage of correctly segmented
crown outlines differed from the percentage of cor-
rectly detected tree tops. When two or more
trees merged into one segment, the tree height of the
highest tree within the merged segment could still be
obtained.
Measurements of individual trees
In the methods used by Hyyppa & Inkinen (1999) and
Persson et al. (2002), laser data were first used to
delineate individual tree crowns, and then the position,
height, crown diameter, stem diameter and timber
volume were determined for each tree. Stem position
492 E. Næsset et al. Scand. J. For. Res. 19 (2004)
Dow
nloa
ded
by [
Uni
vers
ity L
ibra
ry U
trec
ht]
at 1
1:12
17
Mar
ch 2
013
was set to the location of the local maximum of the
DCM, and tree height was set to the maximum height
value of the DCM. Crown diameter was calculated
using the area of a segment, assuming that the
segments have the shape of a circle. Stem diameter
was predicted using linear regression with height
and crown diameter as independent variables. Stem
volume was calculated using volume equations for
individual trees (Naslund 1947, Laasasenaho 1982),
with tree height and stem diameter as explanatory
variables.
Persson et al. (2002) validated laser data-derived
estimates of tree position, tree height and crown
diameter using field measurements of these variables
obtained at the Remningstorp test site in Sweden. The
two latter variables were estimated with an RMSE of
0.63 m (2.6%) and 0.61 m (12%), respectively (Table 4).
It was also shown by Hyyppa & Inkinen (1999) that
tree heights of 89 selected single trees in the upper
canopy could be obtained with a standard error of less
than 1 m (5.8%) (Table 4). The underestimation of tree
heights was 0.14 m. Correspondingly, in the study by
Maltamo et al. (2004b) the standard error of height
varied between 3 and 9% for different tree species,
and the underestimation of height was about 1 m
(Table 4).
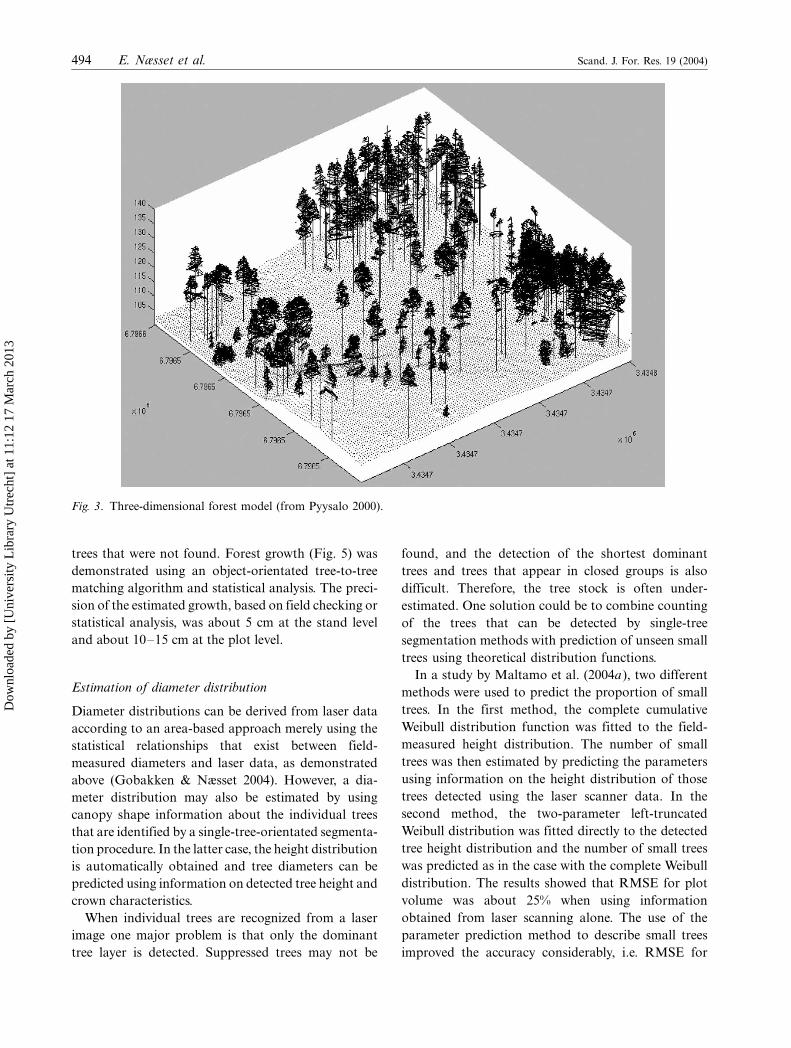
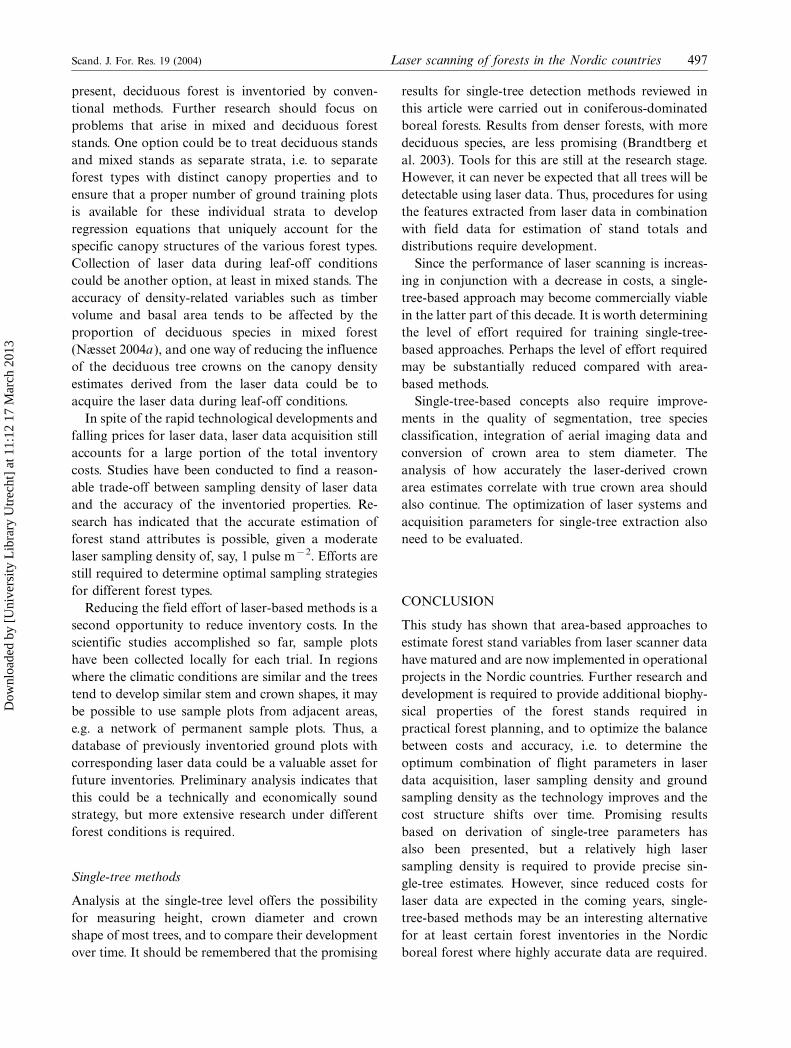
In two studies by Pyysalo & Hyyppa (2002) and
Pyysalo (2000), the reconstruction of single-tree
crowns from laser scanner data was considered
(Fig. 3). Based on 50 ground-measured trees it was
found that dense laser scanner data describe in more
detail the upper canopy of the forest and therefore are
suitable for extraction of information on tree height.
The lower crown was characterized in less detail and
variables extracted for the lower canopy were less
accurate. It can be noted, however, that the obtained
canopy profile, analogous to full-waveform laser out-
puts, seemed to be indicative of the tree species (Scots
pine versus Norway spruce).
The effect of pulse density on individual tree-based
forest inventory was addressed by Hyyppa et al.
(2001b). The pulse sampling density was reduced by
randomly removing laser data from the original
Toposys dataset. Datasets with pulse densities of 1, 4
and �/10 pulses m�2 were analysed. A canopy height
model was calculated for each dataset separately, and
segmentations were carried out for each dataset. The
estimated number of stems was significantly reduced
for the datasets with successively lower pulse densities.
Thus, the number of stems estimated decreased, but
the standard deviation of the results did not change
significantly with lower pulse rates. The most likely
explanation for the results is that with a pulse density
of 1 pulse m�2, the distribution of the pulses is more
evenly spread than with higher pulse rates. For
example, with a pulse density of �/10 pulses m�2,
most of the performance is deteriorated owing to the
oversampling by the TopoSys-1 system in the along-
track direction. It seems that even with lower pulse
densities, relatively accurate volume estimates can be
collected if the systematic errors are calibrated with a
sufficient number of reference plots, as is done in area-
based methods.
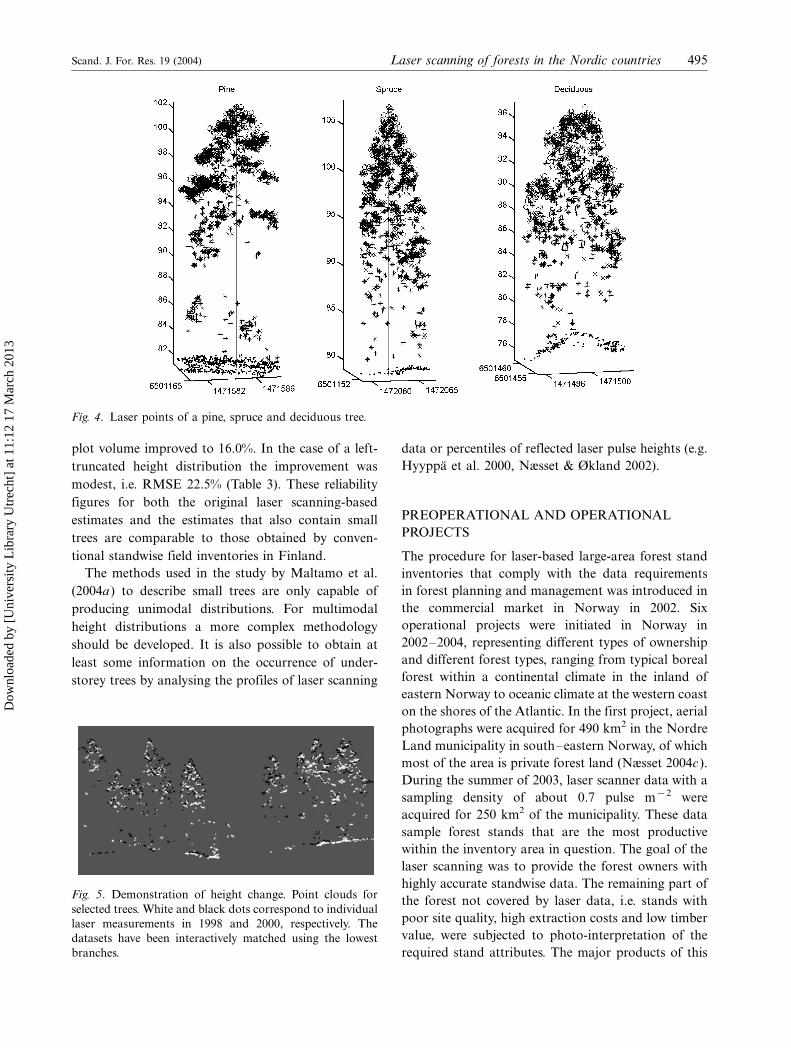
Tree species classification
In Hyyppa et al. (1999), forest canopy profiles were
created using laser scanner data. It was visually
concluded the profile information includes valuable
information about tree species, e.g. discrimination
between pine/birch versus spruce. Tests have also
been performed in Sweden using laser data for species
classification of the delineated tree crowns (Holmgren
2003, Holmgren & Persson 2004). All laser points
within each segmented tree crown were grouped
together to form the point cloud belonging to each
tree (Fig. 4). The laser points were divided into ground
hits, within crown hits or DCM surface hits according
to their distances to the DCM or ground. To separate
between Norway spruce and Scots pine, features were
derived from the laser data on a single-tree level that
captured the differences in crown shape and structure.
The two species could then be discriminated from each
other with an accuracy of 95% using laser data alone
(Holmgren & Persson 2004).
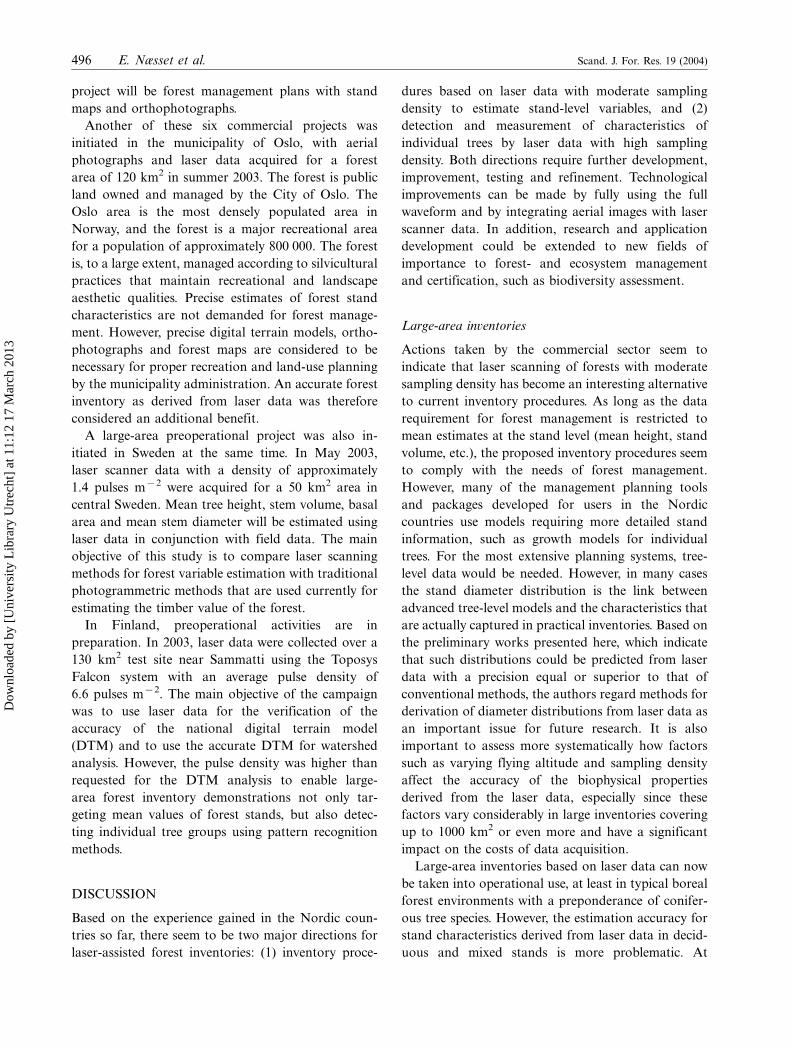
Change detection
Yu et al. (2003) were the first to demonstrate the
applicability of small-footprint, high sampling density
airborne laser scanner data for boreal forest change
detection, i.e. the estimation of forest growth and
monitoring of harvested trees (see also Hyyppa et al.
2003, Yu et al. 2004). Two laser acquisitions (on 2 and 3
September 1998 and 15 June 2000) were carried out on
a test site in Kalkkinen, Finland, using a Toposys-1
laser scanner. Object-orientated algorithms were devel-
oped for detecting the removal of individual trees and
for measuring forest growth at the plot and stand levels.
Out of 83 field-checked harvested trees, 61 could be
automatically and correctly detected. All mature har-
vested trees were detected and it was mainly the smaller
Scand. J. For. Res. 19 (2004) Laser scanning of forests in the Nordic countries 493
Dow
nloa
ded
by [
Uni
vers
ity L
ibra
ry U
trec
ht]
at 1
1:12
17
Mar
ch 2
013
trees that were not found. Forest growth (Fig. 5) was
demonstrated using an object-orientated tree-to-tree
matching algorithm and statistical analysis. The preci-
sion of the estimated growth, based on field checking or
statistical analysis, was about 5 cm at the stand level
and about 10�/15 cm at the plot level.
Estimation of diameter distribution
Diameter distributions can be derived from laser data
according to an area-based approach merely using the
statistical relationships that exist between field-
measured diameters and laser data, as demonstrated
above (Gobakken & Næsset 2004). However, a dia-
meter distribution may also be estimated by using
canopy shape information about the individual trees
that are identified by a single-tree-orientated segmenta-
tion procedure. In the latter case, the height distribution
is automatically obtained and tree diameters can be
predicted using information on detected tree height and
crown characteristics.
When individual trees are recognized from a laser
image one major problem is that only the dominant
tree layer is detected. Suppressed trees may not be
found, and the detection of the shortest dominant
trees and trees that appear in closed groups is also
difficult. Therefore, the tree stock is often under-
estimated. One solution could be to combine counting
of the trees that can be detected by single-tree
segmentation methods with prediction of unseen small
trees using theoretical distribution functions.
In a study by Maltamo et al. (2004a), two different
methods were used to predict the proportion of small
trees. In the first method, the complete cumulative
Weibull distribution function was fitted to the field-
measured height distribution. The number of small
trees was then estimated by predicting the parameters
using information on the height distribution of those
trees detected using the laser scanner data. In the
second method, the two-parameter left-truncated
Weibull distribution was fitted directly to the detected
tree height distribution and the number of small trees
was predicted as in the case with the complete Weibull
distribution. The results showed that RMSE for plot
volume was about 25% when using information
obtained from laser scanning alone. The use of the
parameter prediction method to describe small trees
improved the accuracy considerably, i.e. RMSE for
Fig. 3. Three-dimensional forest model (from Pyysalo 2000).
494 E. Næsset et al. Scand. J. For. Res. 19 (2004)
Dow
nloa
ded
by [
Uni
vers
ity L
ibra
ry U
trec
ht]
at 1
1:12
17
Mar
ch 2
013
plot volume improved to 16.0%. In the case of a left-
truncated height distribution the improvement was
modest, i.e. RMSE 22.5% (Table 3). These reliability
figures for both the original laser scanning-based
estimates and the estimates that also contain small
trees are comparable to those obtained by conven-
tional standwise field inventories in Finland.
The methods used in the study by Maltamo et al.
(2004a) to describe small trees are only capable of
producing unimodal distributions. For multimodal
height distributions a more complex methodology
should be developed. It is also possible to obtain at
least some information on the occurrence of under-
storey trees by analysing the profiles of laser scanning
data or percentiles of reflected laser pulse heights (e.g.
Hyyppa et al. 2000, Næsset & Økland 2002).
PREOPERATIONAL AND OPERATIONAL
PROJECTS
The procedure for laser-based large-area forest stand
inventories that comply with the data requirements
in forest planning and management was introduced in
the commercial market in Norway in 2002. Six
operational projects were initiated in Norway in
2002�/2004, representing different types of ownership
and different forest types, ranging from typical boreal
forest within a continental climate in the inland of
eastern Norway to oceanic climate at the western coast
on the shores of the Atlantic. In the first project, aerial
photographs were acquired for 490 km2 in the Nordre
Land municipality in south�/eastern Norway, of which
most of the area is private forest land (Næsset 2004c ).
During the summer of 2003, laser scanner data with a
sampling density of about 0.7 pulse m�2 were
acquired for 250 km2 of the municipality. These data
sample forest stands that are the most productive
within the inventory area in question. The goal of the
laser scanning was to provide the forest owners with
highly accurate standwise data. The remaining part of
the forest not covered by laser data, i.e. stands with
poor site quality, high extraction costs and low timber
value, were subjected to photo-interpretation of the
required stand attributes. The major products of this
Fig. 4. Laser points of a pine, spruce and deciduous tree.
Fig. 5. Demonstration of height change. Point clouds for
selected trees. White and black dots correspond to individual
laser measurements in 1998 and 2000, respectively. The
datasets have been interactively matched using the lowest
branches.
Scand. J. For. Res. 19 (2004) Laser scanning of forests in the Nordic countries 495
Dow
nloa
ded
by [
Uni
vers
ity L
ibra
ry U
trec
ht]
at 1
1:12
17
Mar
ch 2
013
project will be forest management plans with stand
maps and orthophotographs.
Another of these six commercial projects was
initiated in the municipality of Oslo, with aerial
photographs and laser data acquired for a forest
area of 120 km2 in summer 2003. The forest is public
land owned and managed by the City of Oslo. The
Oslo area is the most densely populated area in
Norway, and the forest is a major recreational area
for a population of approximately 800 000. The forest
is, to a large extent, managed according to silvicultural
practices that maintain recreational and landscape
aesthetic qualities. Precise estimates of forest stand
characteristics are not demanded for forest manage-
ment. However, precise digital terrain models, ortho-
photographs and forest maps are considered to be
necessary for proper recreation and land-use planning
by the municipality administration. An accurate forest
inventory as derived from laser data was therefore
considered an additional benefit.
A large-area preoperational project was also in-
itiated in Sweden at the same time. In May 2003,
laser scanner data with a density of approximately
1.4 pulses m�2 were acquired for a 50 km2 area in
central Sweden. Mean tree height, stem volume, basal
area and mean stem diameter will be estimated using
laser data in conjunction with field data. The main
objective of this study is to compare laser scanning
methods for forest variable estimation with traditional
photogrammetric methods that are used currently for
estimating the timber value of the forest.
In Finland, preoperational activities are in
preparation. In 2003, laser data were collected over a
130 km2 test site near Sammatti using the Toposys
Falcon system with an average pulse density of
6.6 pulses m�2. The main objective of the campaign
was to use laser data for the verification of the
accuracy of the national digital terrain model
(DTM) and to use the accurate DTM for watershed
analysis. However, the pulse density was higher than
requested for the DTM analysis to enable large-
area forest inventory demonstrations not only tar-
geting mean values of forest stands, but also detec-
ting individual tree groups using pattern recognition
methods.
DISCUSSION
Based on the experience gained in the Nordic coun-
tries so far, there seem to be two major directions for
laser-assisted forest inventories: (1) inventory proce-
dures based on laser data with moderate sampling
density to estimate stand-level variables, and (2)
detection and measurement of characteristics of
individual trees by laser data with high sampling
density. Both directions require further development,
improvement, testing and refinement. Technological
improvements can be made by fully using the full
waveform and by integrating aerial images with laser
scanner data. In addition, research and application
development could be extended to new fields of
importance to forest- and ecosystem management
and certification, such as biodiversity assessment.
Large-area inventories
Actions taken by the commercial sector seem to
indicate that laser scanning of forests with moderate
sampling density has become an interesting alternative
to current inventory procedures. As long as the data
requirement for forest management is restricted to
mean estimates at the stand level (mean height, stand
volume, etc.), the proposed inventory procedures seem
to comply with the needs of forest management.
However, many of the management planning tools
and packages developed for users in the Nordic
countries use models requiring more detailed stand
information, such as growth models for individual
trees. For the most extensive planning systems, tree-
level data would be needed. However, in many cases
the stand diameter distribution is the link between
advanced tree-level models and the characteristics that
are actually captured in practical inventories. Based on
the preliminary works presented here, which indicate
that such distributions could be predicted from laser
data with a precision equal or superior to that of
conventional methods, the authors regard methods for
derivation of diameter distributions from laser data as
an important issue for future research. It is also
important to assess more systematically how factors
such as varying flying altitude and sampling density
affect the accuracy of the biophysical properties
derived from the laser data, especially since these
factors vary considerably in large inventories covering
up to 1000 km2 or even more and have a significant
impact on the costs of data acquisition.
Large-area inventories based on laser data can now
be taken into operational use, at least in typical boreal
forest environments with a preponderance of conifer-
ous tree species. However, the estimation accuracy for
stand characteristics derived from laser data in decid-
uous and mixed stands is more problematic. At
496 E. Næsset et al. Scand. J. For. Res. 19 (2004)
Dow
nloa
ded
by [
Uni
vers
ity L
ibra
ry U
trec
ht]
at 1
1:12
17
Mar
ch 2
013
present, deciduous forest is inventoried by conven-
tional methods. Further research should focus on
problems that arise in mixed and deciduous forest
stands. One option could be to treat deciduous stands
and mixed stands as separate strata, i.e. to separate
forest types with distinct canopy properties and to
ensure that a proper number of ground training plots
is available for these individual strata to develop
regression equations that uniquely account for the
specific canopy structures of the various forest types.
Collection of laser data during leaf-off conditions
could be another option, at least in mixed stands. The
accuracy of density-related variables such as timber
volume and basal area tends to be affected by the
proportion of deciduous species in mixed forest
(Næsset 2004a ), and one way of reducing the influence
of the deciduous tree crowns on the canopy density
estimates derived from the laser data could be to
acquire the laser data during leaf-off conditions.
In spite of the rapid technological developments and
falling prices for laser data, laser data acquisition still
accounts for a large portion of the total inventory
costs. Studies have been conducted to find a reason-
able trade-off between sampling density of laser data
and the accuracy of the inventoried properties. Re-
search has indicated that the accurate estimation of
forest stand attributes is possible, given a moderate
laser sampling density of, say, 1 pulse m�2. Efforts are
still required to determine optimal sampling strategies
for different forest types.
Reducing the field effort of laser-based methods is a
second opportunity to reduce inventory costs. In the
scientific studies accomplished so far, sample plots
have been collected locally for each trial. In regions
where the climatic conditions are similar and the trees
tend to develop similar stem and crown shapes, it may
be possible to use sample plots from adjacent areas,
e.g. a network of permanent sample plots. Thus, a
database of previously inventoried ground plots with
corresponding laser data could be a valuable asset for
future inventories. Preliminary analysis indicates that
this could be a technically and economically sound
strategy, but more extensive research under different
forest conditions is required.
Single-tree methods
Analysis at the single-tree level offers the possibility
for measuring height, crown diameter and crown
shape of most trees, and to compare their development
over time. It should be remembered that the promising
results for single-tree detection methods reviewed in
this article were carried out in coniferous-dominated
boreal forests. Results from denser forests, with more
deciduous species, are less promising (Brandtberg et
al. 2003). Tools for this are still at the research stage.
However, it can never be expected that all trees will be
detectable using laser data. Thus, procedures for using
the features extracted from laser data in combination
with field data for estimation of stand totals and
distributions require development.
Since the performance of laser scanning is increas-
ing in conjunction with a decrease in costs, a single-
tree-based approach may become commercially viable
in the latter part of this decade. It is worth determining
the level of effort required for training single-tree-
based approaches. Perhaps the level of effort required
may be substantially reduced compared with area-
based methods.
Single-tree-based concepts also require improve-
ments in the quality of segmentation, tree species
classification, integration of aerial imaging data and
conversion of crown area to stem diameter. The
analysis of how accurately the laser-derived crown
area estimates correlate with true crown area should
also continue. The optimization of laser systems and
acquisition parameters for single-tree extraction also
need to be evaluated.
CONCLUSION
This study has shown that area-based approaches to
estimate forest stand variables from laser scanner data
have matured and are now implemented in operational
projects in the Nordic countries. Further research and
development is required to provide additional biophy-
sical properties of the forest stands required in
practical forest planning, and to optimize the balance
between costs and accuracy, i.e. to determine the
optimum combination of flight parameters in laser
data acquisition, laser sampling density and ground
sampling density as the technology improves and the
cost structure shifts over time. Promising results
based on derivation of single-tree parameters has
also been presented, but a relatively high laser
sampling density is required to provide precise sin-
gle-tree estimates. However, since reduced costs for
laser data are expected in the coming years, single-
tree-based methods may be an interesting alternative
for at least certain forest inventories in the Nordic
boreal forest where highly accurate data are required.
Scand. J. For. Res. 19 (2004) Laser scanning of forests in the Nordic countries 497
Dow
nloa
ded
by [
Uni
vers
ity L
ibra
ry U
trec
ht]
at 1
1:12
17
Mar
ch 2
013
The single-tree-related research will therefore continue
in Finland, Norway and Sweden.
REFERENCES
Aldred, A. H. & Bonnor, G. M. 1985. Application of
airborne laser to forest surveys, Information Report PI-
X-51, Can. For. Serv., Petawawa Natl For. Inst., Chalk
River.
Baltsavias, E. P. 1999. Airborne laser scanning: existing
systems and firms and other resources. ISPRS J. Photo-
gramm. Remote Sens. 54: 164�/198.
Blair, J. B., Rabine, D. L. & Hofton, M. A. 1999. The laser
vegetation imaging sensor (LVIS): a medium-altitude
digitization-only, airborne laser altimeter for mapping
vegetation and topography. ISPRS J. Photogramm.
Remote Sens. 54: 115�/122.
Bolduc, P., Lowell, K. & Edwards, G. 1999. Automated
estimation of localized forest volume from large-scale
aerial photographs and ancillary cartographic informa-
tion in a boreal forest. Int. J. Remote Sens. 20: 3611�/
3624.
Brandtberg, T. 1999. Automatic individual tree-based ana-
lysis of high spatial resolution remotely sensed data.
Ph.D. Thesis, Acta Univ. Agric. Suec., Silvestria 118,
Swedish Univ. of Agric. Sci., Uppsala.
Brandtberg, T., Warner, T. A., Landenberger, R. E. &
McGraw, J. B. 2003. Detection and analysis of individual
leaf-off tree crowns in small footprint, high sampling
density lidar data from the eastern deciduous forest in
North America. Remote Sens. Environ. 85: 290�/303.
Deckert, C. & Bolstad, P. V. 1996. Forest canopy, terrain,
and distance effects on global positioning system point
accuracy. Photogramm. Engng Remote Sens. 62: 317�/
321.
Eid, T., Gobakken, T. & Næsset, E. 2004. Comparing stand
inventories based on photo-interpretation and laser
scanning by means of cost-plus-loss analyses. Scand. J.
For. Res. 19: 512�/523.
Gaveau, D. L. A. & Hill, R. A. 2003. Quantifying canopy
height underestimation by laser pulse penetration in
small-footprint airborne laser scanning data. Can. J.
Remote Sens. 29: 650�/657.
Gobakken, T. & Næsset, E. 2004. Estimation of diameter
and basal area distributions in coniferous forest by means
of airborne laser scanner data. Scand. J. For. Res. 19:
529�/542.
Holmgren, J. 2003. Estimation of forest variables using
airborne laser scanning. Ph.D. Thesis. Acta Univ. Agric.
Suec., Silvestria 278. Swedish Univ. of Agric. Sci.,
Uppsala.
Holmgren, J. 2004. Prediction of tree height, basal area and
stem volume in forest stands using airborne laser scan-
ning. Scand. J. For. Res. 19: 543�/553.
Holmgren, J. & Persson, A. 2004. Identifying species of
individual trees using airborne laser scanner. Remote
Sens. Environ. 90: 415�/423.
Holmgren, J., Nilsson, M. & Olsson, H. 2003a . Estimation
of tree height and stem volume on plots using airborne
laser scanning. For. Sci. 49: 419�/428.
Holmgren, J., Nilsson, M. & Olsson, H. 2003b. Simulating
the effects of LIDAR scanning angle for estimation of
mean tree height and canopy closure. Can. J. Remote
Sens. 29: 623�/632.
Hyyppa, J. 1993. Development and feasibility of airborne
ranging radar for forest assessment. Lab. of Space
Technol., Helsinki Univ. of Technol.
Hyyppa, H. & Hyyppa, J. 1999. Comparing the accuracy of
laser scanner with other optical remote sensing data
sources for stand attributes retrieval. Photogramm. J.
Finland 16: 5�/15.
Hyyppa, J., Hyyppa, H. & Samberg, A. 1999. Assessing
forest stand attributes by laser scanner. Laser Radar
Technol. Appl. IV 3707: 57�/69.
Hyyppa, J. & Inkinen, M. 1999. Detecting and estimating
attributes for single trees using laser scanner. Photo-
gramm. J. Finland 16: 27�/42.
Hyyppa, J., Pyysalo, U., Hyyppa, H. & Samberg, A. 2000.
Elevation accuracy of laser scanning-derived digital
terrain and target models in forest environment. 20th
EARSEL Symposium and Workshops, Dresden, Ger-
many, 14�/17 June 2000.
Hyyppa, J., Kelle, O., Lehikoinen, M. & Inkinen, M. 2001a .
A segmentation-based method to retrieve stem volume
estimates from 3-dimensional tree height models pro-
duced by laser scanner. IEEE Trans. Geosci. Remote
Sens. 39: 969�/975.
Hyyppa, J., Schardt, M., Haggren, H., Koch, B., Lohr, U.,
Scherrer, H. U., Paananen, R., Luukkonen, H., Ziegler,
M., Hyyppa, H., Pyysalo, U., Friedlander, H., Uuttera, J.,
Wagner, S., Inkinen, M., Wimmer, A., Kukko, A.,
Ahokas, A. & Karjalainen, M. 2001b. HIGH-SCAN:
the first European-wide attempt to derive single-tree
information from laserscanner data. Photogramm. J.
Finland 17 (2): 58�/68.
Hyyppa, J., Yu, X., Ronnholm, P., Kaartinen, H. & Hyyppa,
H. 2003. Factors affecting object-oriented forest growth
estimates obtained using laser scanning. Photogramm.
Journal of Finland 18 (2): 16�/31.
Laasasenaho, J. 1982. Taper curve and volume functions for
pine, spruce and birch. Communicationes Instituti Fore-
stalis Fenniae, 108, Helsinki.
Lefsky, M. A., Cohen, W. B., Acker, S. A., Parker, G. G.,
Spies, T. A. & Harding, D. 1999. Lidar remote sensing of
the canopy structure and biophysical properties of
Douglas-fir western hemlock forests. Remote Sens. En-
viron. 70: 339�/361.
Lefsky, M. A., Cohen, W. B., Parker, G. G. & Harding, D. J.
2002. Lidar remote sensing for ecosystem studies.
BioScience 52: 19�/30.
Lim, K., Treitz, P., Wulder, M., St-Onge, B. & Flood, M.
2003. LiDAR remote sensing of forest structure. Progr.
Phys. Geogr. 27: 88�/106.
Maclean, G. A. & Krabill, W. B. 1986. Gross-merchantable
timber volume estimation using an airborne lidar system.
Can. J. Remote Sens. 12: 7�/18.
498 E. Næsset et al. Scand. J. For. Res. 19 (2004)
Dow
nloa
ded
by [
Uni
vers
ity L
ibra
ry U
trec
ht]
at 1
1:12
17
Mar
ch 2
013
Maltamo, M., Eerikainen, K., Pitkanen, J., Hyyppa, J. &
Vehmas, M. 2004a . Estimation of timber volume and
stem density based on scanning laser altimetry and
expected tree size distribution functions. Remote Sens.
Environ. 90: 319�/330.
Maltamo, M., Mustonen, K., Hyyppa, J., Pitkanen, J. & Yu,
X. 2004b. The accuracy of estimating individual tree
variables with airborne laser scanning in a boreal nature
reserve. Can. J. For. Res. 34: 1791�/1801.
Næsset, E. 1997a . Determination of mean tree height of
forest stands using airborne laser scanner data. ISPRS J.
Photogramm. Remote Sens. 52: 49�/56.
Næsset, E. 1997b. Estimating timber volume of forest stands
using airborne laser scanner data. Remote Sens. Environ.
61: 246�/253.
Næsset, E. 1999. Point accuracy of combined pseudorange
and carrier phase differential GPS under forest canopies.
Can. J. For. Res. 29: 547�/553.
Næsset, E. 2001. Effects of differential single- and dual-
frequency GPS and GLONASS observations on point
accuracy under forest canopies. Photogramm. Engng
Remote Sens. 67: 1021�/1026.
Næsset, E. 2002. Predicting forest stand characteristics with
airborne scanning laser using a practical two-stage
procedure and field data. Remote Sens. Environ. 80:
88�/99.
Næsset, E. 2004a . Practical large-scale forest stand inven-
tory using small-footprint airborne scanning laser. Scand.
J. For. Res. 19: 164�/179.
Næsset, E. 2004b. Effects of different flying altitudes on
biophysical stand properties estimated from canopy
height and density measured with a small-footprint
airborne scanning laser. Remote Sens. Environ. 91:
243�/255.
Næsset, E. 2004c . Accuracy of forest inventory using
airborne laser scanning: evaluating the first Nordic full-
scale operational project. Scand. J. For. Res. 19: 554�/557.
Næsset, E., Bjerke, T., Øvstedal, O. & Ryan, L. H. 2000.
Contributions of differential GPS and GLONASS ob-
servations to point accuracy under forest canopies.
Photogramm. Engng Remote Sens. 66: 403�/407.
Næsset, E. & Bjerknes, K.-O. 2001. Estimating tree heights
and number of stems in young forest stands using
airborne laser scanner data. Remote Sens. Environ. 78:
328�/340.
Næsset, E. & Jonmeister, T. 2002. Assessing point accuracy
of DGPS under forest canopy before data acquisition, in
the field and after postprocessing. Scand. J. For. Res. 17:
351�/358.
Næsset, E. & Økland, T. 2002. Estimating tree height and
tree crown properties using airborne scanning laser in a
boreal nature reserve. Remote Sens. Environ. 79: 105�/
115.
Naslund, M. 1947. Functions and tables for computing the
cubic volume of standing trees: pine, spruce and birch in
southern Sweden and in the whole of Sweden. Report 36.
National Forest Research Institute, Stockholm.
Nelson, R., Krabill, W. & Maclean, G. 1984. Determining
forest canopy characteristics using airborne laser data.
Remote Sens. Environ. 15: 201�/212.
Nilsson, M. 1994. Estimation of tree heights and stand
volume using airborne lidar systems. Report 57. Dept of
Forest Survey, Swedish Univ. of Agric. Sci., Umea.
Nilsson, M. 1996. Estimation of tree heights and stand
volume using an airborne lidar system. Remote Sens.
Environ. 56: 1�/7.
Nilsson, M. 1997. Estimation of forest variables using
satellite image data and airborne lidar data. Ph.D. Thesis.
Acta Univ. Agric. Suec., Silvestria 17. Swedish Univ. of
Agric. Sci., Uppsala.
Persson, A., Holmgren, J. & Soderman, U. 2002. Detecting
and measuring individual trees using an airborne
laser scanner. Photogramm. Engng Remote Sens. 68:
925�/932.
Pyysalo, U. 2000. A method to create a three-dimensional
forest model from laser scanner data. Photogramm. J.
Finland 17: 34�/42.
Pyysalo, U. & Hyyppa, H. 2002. Geometric shape of the tree
extracted from laser scanning data. International Society
for Photogrammetry and Remote Sensing �/ ISPRS
Commission III Symposium (PCV’02), Graz, Austria,
9�/13 September 2002.
Solodukhin, V.I. Zukov, A.J. & Mazugin, I.N. 1977. Laser
aerial profiling of a forest. Lew. NIILKh. Leningrad.
Lesnoe Khozyaistvo 10: 53�/58 (in Russian).
Steinvall, O. & Koppari, K. 1996. Depth sounding lidar �/ an
overview of Swedish activities and with future prospects.
In Feigels, V. I. & Kopilevich, Y. I. (eds). CIS Selected
Papers on Laser Remote Sensing in Natural Waters:
From Theory to Practice. Proc. SPIE 2964: 2�/25.
Steinvall, O., Koppari, K. & Karlsson, U. 1993. Experi-
mental evaluation of an airborne depth sounding lidar.
Opt. Engng 32: 1307�/1321.
Steinvall, O., Soderman, U., Ahlberg, S., Sandberg, M.,
Letalick, D. & Jungert, E. 1999. Airborne laser radar:
systems and methods for reconnaissance and terrain
modeling. Proc. SPIE 3707: 12�/26.
Wehr, A. & Lohr, U. 1999. Airborne laser scanning �/ an
introduction and overview. ISPRS J. Photogramm. Re-
mote Sens. 54: 68�/82.
Yu, X., Hyyppa, J., Ronnholm, P., Kaartinen, H., Maltamo,
M. & Hyyppa, H. 2003. Detection of harvested trees and
estimation of forest growth using laser scanning. In
Hyyppa, J., Næsset, E., Olsson, H, Granqvist Pahlen, T.
& Reese, H. (eds). Proceedings of Scandlaser Scientific
Workshop on Airborne Laser Scanning of Forests, Umea,
3�/4 September 2003. Working Paper 112, pp. 115�/124.
Dept of Forest Resource Management and Geomatics,
Swedish Univ. of Agric. Sci.
Yu, X., Hyyppa, J., Kaartinen, H. & Maltamo, M. 2004.
Automatic detection of harvested trees and determination
of forest growth using airborne laser scanning. Remote
Sens. Environ. 90: 451�/462.
Scand. J. For. Res. 19 (2004) Laser scanning of forests in the Nordic countries 499
Dow
nloa
ded
by [
Uni
vers
ity L
ibra
ry U
trec
ht]
at 1
1:12
17
Mar
ch 2
013