Embed Size (px)
DESCRIPTION
This report shows the region’s performance based on a variety of indicators in categories such as outreach, growth, credit types, financial structure, and profitability and risk. The data was compiled from a sample of the 47 largest Latin America and the Caribbean MFIs, which cover more than 57% of the clients in the region.
Citation preview
Microfinance Market Trends in
Latin America and the Caribbean 2005 – 2010
This report was written by Renso Martínez, MIX Operations Manager and Regional Manager for Latin
America and the Caribbean.
The contents and the opinions expressed are the author’s and do not necessarily represent the
official position of the Inter-American Development Bank, nor that of any of its members. The
reproduction of this report, partially or totally, is permitted with proper citations of its author and
its sponsors.
Microfinance Information Exchange, Inc.
Contact: Renso Martinez [email protected]
MIX Lima, Perú
Jirón León Velarde 333, Lima 14, Peru
Tel: (51) 1 471-9526 / Fax: (51) 1 471-6816
Headquarter in Washington, D.C., USA:
1901 Pennsylvania Ave., NW, Suite 307
Washington, D.C. 20006 USA
Other locations:
Rabat, Morocco ● Hyderabad, India ● Baku, Azerbaijan
Websites: www.themix.org www.mixmarket.org
Email: [email protected]
Multilateral Investment Fund
Contacts :
Sergio Navajas, Senior Specialist; [email protected]
Omar Villacorta, Consultant; [email protected]
1300 New York Avenue, N.W.
Washington, D.C. 20577
Website: www.fomin.org
Email: [email protected]
Introduction:
MIX and the Multilateral Investment Fund, a member of the Inter-American
Development Bank Group, are please to present the following report,
“Microfinance Market Tendencies for Latin America and the Caribbean 2005 –
2010.”
The objective of this report is to present an early update for the
performance of the Microfinance Institutions (MFIs) in regional, sub-regional and
certain national markets at the close of the 2010 financial year in terms of
coverage credit types, finance structure, and risk and profitability.
As with the previous edition, the report covers information from 47 MFIs
(13% of the sample is from MIX) during the period from 2005 – 2010. These
institutions represent a majority of the market in terms of portfolio and
borrowers in 11 countries, constituting a coverage of 57% of clients.
We would also like to thank the diverse sources of information and our
readers for following each of our publications.
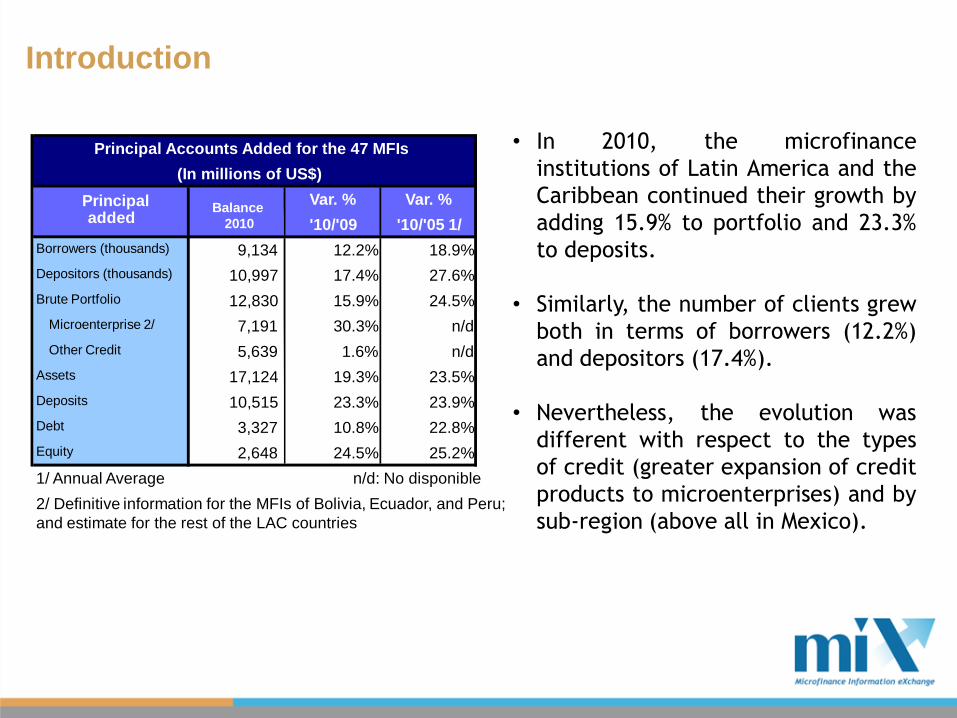
• In 2010, the microfinance
institutions of Latin America and the
Caribbean continued their growth by
adding 15.9% to portfolio and 23.3%
to deposits.
• Similarly, the number of clients grew
both in terms of borrowers (12.2%)
and depositors (17.4%).
• Nevertheless, the evolution was
different with respect to the types
of credit (greater expansion of credit
products to microenterprises) and by
sub-region (above all in Mexico).
Introduction
Principal Accounts Added for the 47 MFIs
(In millions of US$)
Var. % Var. %
'10/'09 '10/'05 1/
Borrowers (thousands) 9,134 12.2% 18.9%
Depositors (thousands) 10,997 17.4% 27.6%
Brute Portfolio 12,830 15.9% 24.5%
Microenterprise 2/ 7,191 30.3% n/d
Other Credit 5,639 1.6% n/d
Assets 17,124 19.3% 23.5%
Deposits 10,515 23.3% 23.9%
Debt 3,327 10.8% 22.8%
Equity 2,648 24.5% 25.2%
1/ Annual Average n/d: No disponible
2/ Definitive information for the MFIs of Bolivia, Ecuador, and Peru;
and estimate for the rest of the LAC countries
Principaladded
Balance
2010
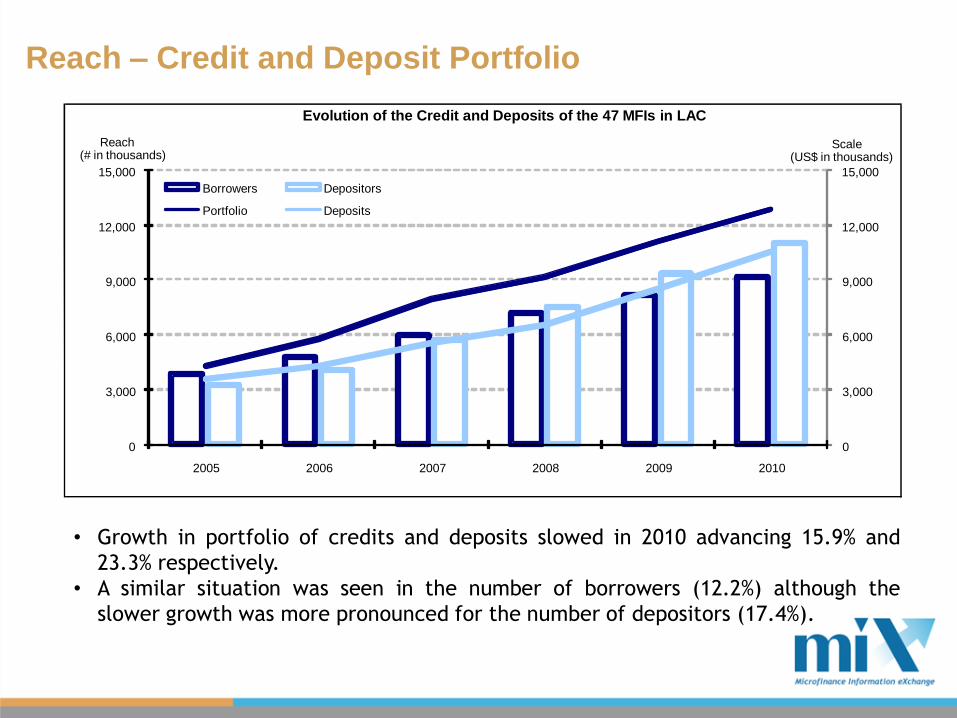
• Growth in portfolio of credits and deposits slowed in 2010 advancing 15.9% and
23.3% respectively.
• A similar situation was seen in the number of borrowers (12.2%) although the
slower growth was more pronounced for the number of depositors (17.4%).
Reach – Credit and Deposit Portfolio
Evolution of the Credit and Deposits of the 47 MFIs in LAC
0
3,000
6,000
9,000
12,000
15,000
0
3,000
6,000
9,000
12,000
15,000
2005 2006 2007 2008 2009 2010
Scale(US$ in thousands)
Reach(# in thousands)
Borrowers Depositors
Portfolio Deposits
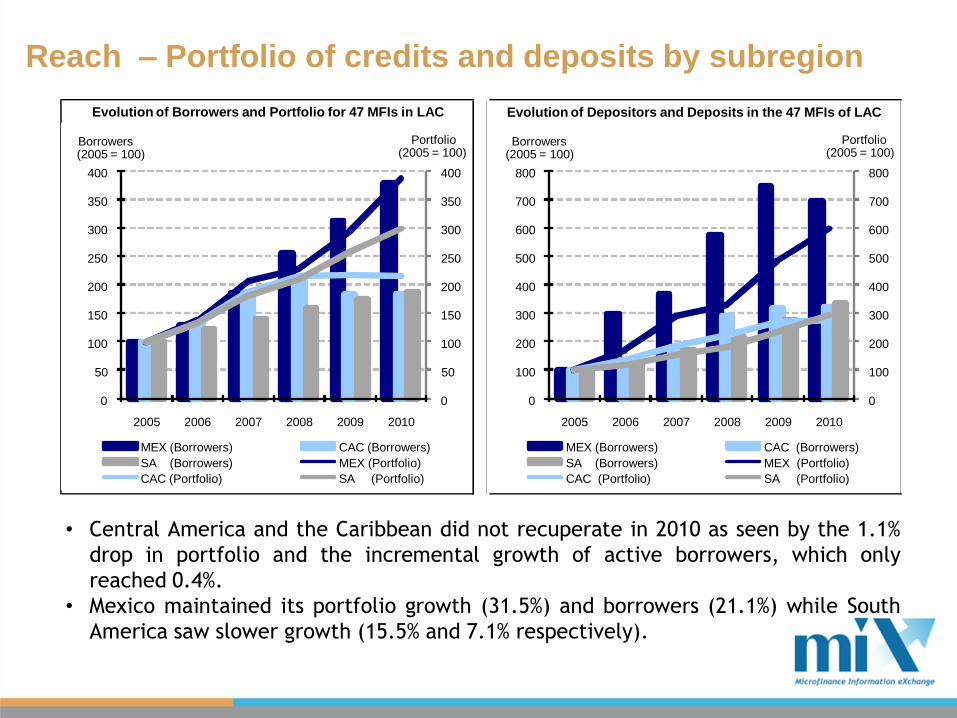
• Central America and the Caribbean did not recuperate in 2010 as seen by the 1.1%
drop in portfolio and the incremental growth of active borrowers, which only
reached 0.4%.
• Mexico maintained its portfolio growth (31.5%) and borrowers (21.1%) while South
America saw slower growth (15.5% and 7.1% respectively).
Reach – Portfolio of credits and deposits by subregion
Evolution of Borrowers and Portfolio for 47 MFIs in LAC Evolution of Depositors and Deposits in the 47 MFIs of LAC
0
50
100
150
200
250
300
350
400
0
50
100
150
200
250
300
350
400
2005 2006 2007 2008 2009 2010
Portfolio(2005 = 100)
Borrowers(2005 = 100)
MEX (Borrowers) CAC (Borrowers)
SA (Borrowers) MEX (Portfolio)
CAC (Portfolio) SA (Portfolio)
0
100
200
300
400
500
600
700
800
0
100
200
300
400
500
600
700
800
2005 2006 2007 2008 2009 2010
Portfolio(2005 = 100)
Borrowers(2005 = 100)
MEX (Borrowers) CAC (Borrowers)
SA (Borrowers) MEX (Portfolio)
CAC (Portfolio) SA (Portfolio)
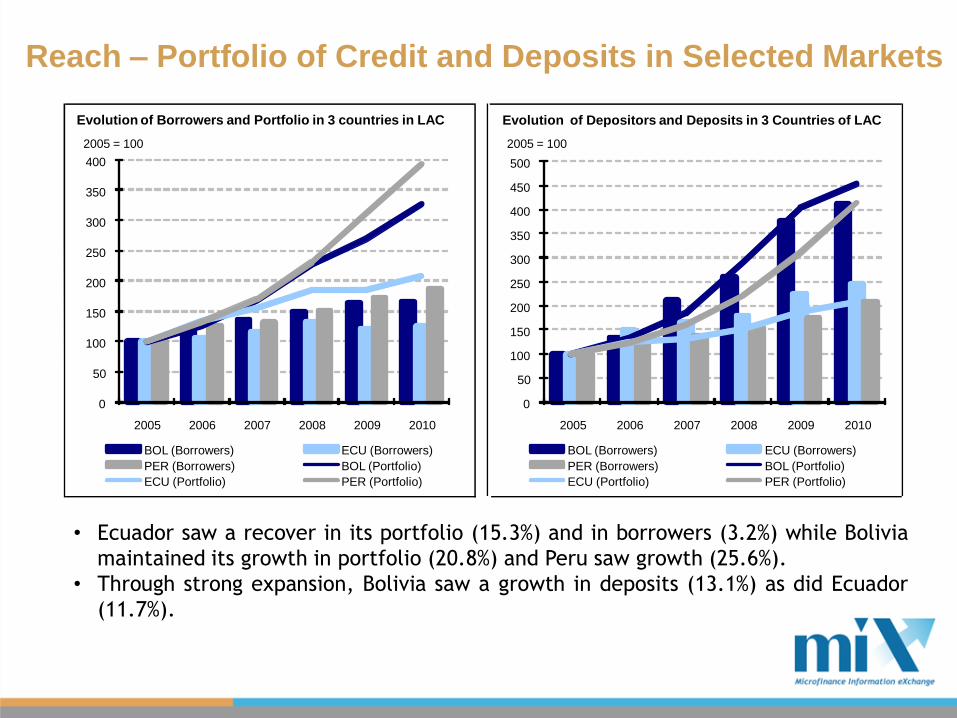
• Ecuador saw a recover in its portfolio (15.3%) and in borrowers (3.2%) while Bolivia
maintained its growth in portfolio (20.8%) and Peru saw growth (25.6%).
• Through strong expansion, Bolivia saw a growth in deposits (13.1%) as did Ecuador
(11.7%).
Reach – Portfolio of Credit and Deposits in Selected Markets
Evolution of Borrowers and Portfolio in 3 countries in LAC Evolution of Depositors and Deposits in 3 Countries of LAC
0
50
100
150
200
250
300
350
400
2005 2006 2007 2008 2009 2010
2005 = 100
BOL (Borrowers) ECU (Borrowers)
PER (Borrowers) BOL (Portfolio)
ECU (Portfolio) PER (Portfolio)
0
50
100
150
200
250
300
350
400
450
500
2005 2006 2007 2008 2009 2010
2005 = 100
BOL (Borrowers) ECU (Borrowers)
PER (Borrowers) BOL (Portfolio)
ECU (Portfolio) PER (Portfolio)
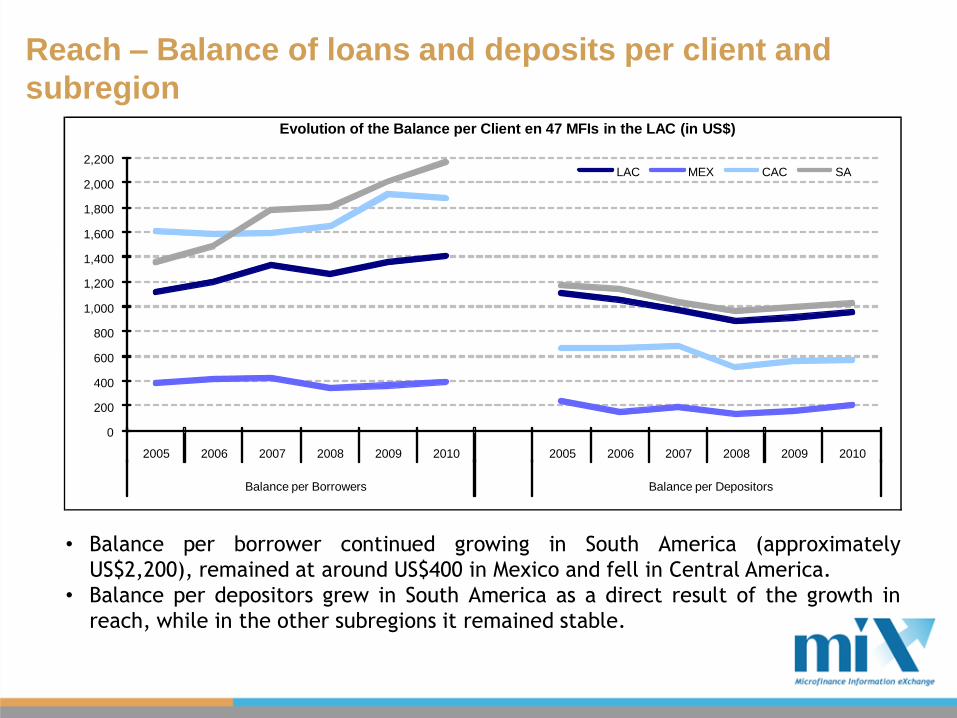
• Balance per borrower continued growing in South America (approximately
US$2,200), remained at around US$400 in Mexico and fell in Central America.
• Balance per depositors grew in South America as a direct result of the growth in
reach, while in the other subregions it remained stable.
Reach – Balance of loans and deposits per client and
subregionEvolution of the Balance per Client en 47 MFIs in the LAC (in US$)
0
200
400
600
800
1,000
1,200
1,400
1,600
1,800
2,000
2,200
2005 2006 2007 2008 2009 2010 2005 2006 2007 2008 2009 2010
Balance per Borrowers Balance per Depositors
LAC MEX CAC SA
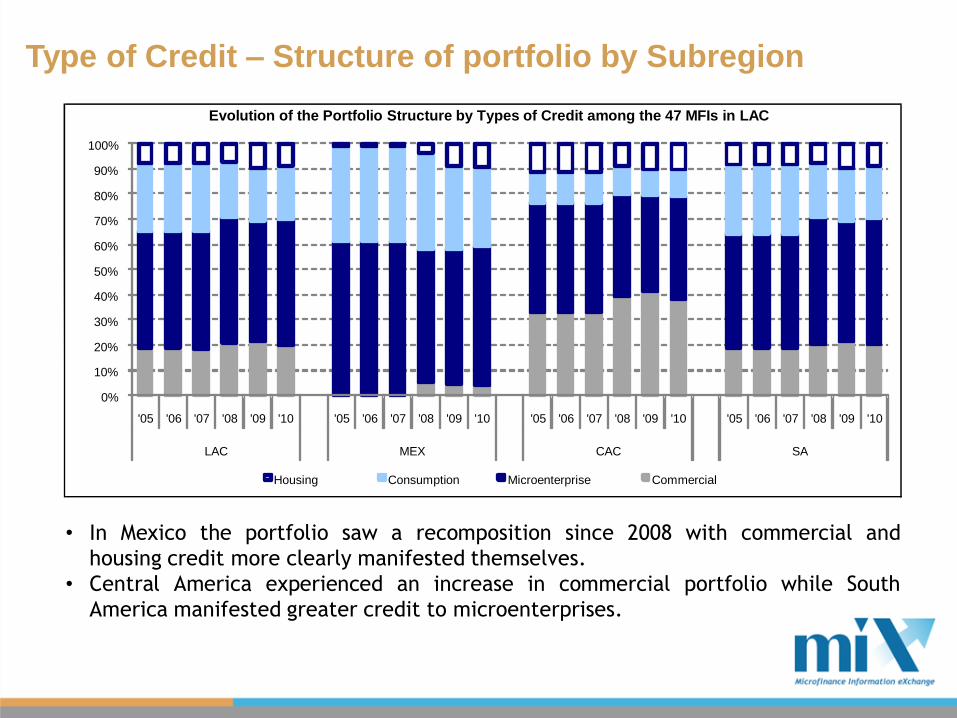
• In Mexico the portfolio saw a recomposition since 2008 with commercial and
housing credit more clearly manifested themselves.
• Central America experienced an increase in commercial portfolio while South
America manifested greater credit to microenterprises.
Type of Credit – Structure of portfolio by Subregion
Evolution of the Portfolio Structure by Types of Credit among the 47 MFIs in LAC
0%
10%
20%
30%
40%
50%
60%
70%
80%
90%
100%
'05 '06 '07 '08 '09 '10 '05 '06 '07 '08 '09 '10 '05 '06 '07 '08 '09 '10 '05 '06 '07 '08 '09 '10
LAC MEX CAC SA
Housing Consumption Microenterprise Commercial
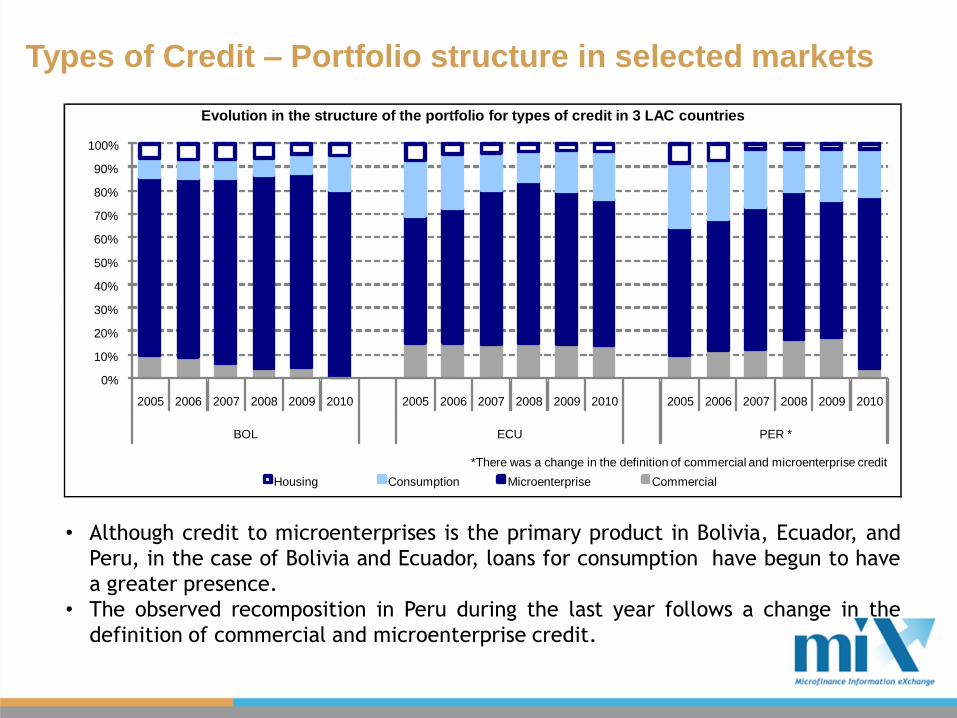
• Although credit to microenterprises is the primary product in Bolivia, Ecuador, and
Peru, in the case of Bolivia and Ecuador, loans for consumption have begun to have
a greater presence.
• The observed recomposition in Peru during the last year follows a change in the
definition of commercial and microenterprise credit.
Types of Credit – Portfolio structure in selected markets
Evolution in the structure of the portfolio for types of credit in 3 LAC countries
0%
10%
20%
30%
40%
50%
60%
70%
80%
90%
100%
2005 2006 2007 2008 2009 2010 2005 2006 2007 2008 2009 2010 2005 2006 2007 2008 2009 2010
BOL ECU PER *
Housing Consumption Microenterprise Commercial
*There was a change in the definition of commercial and microenterprise credit
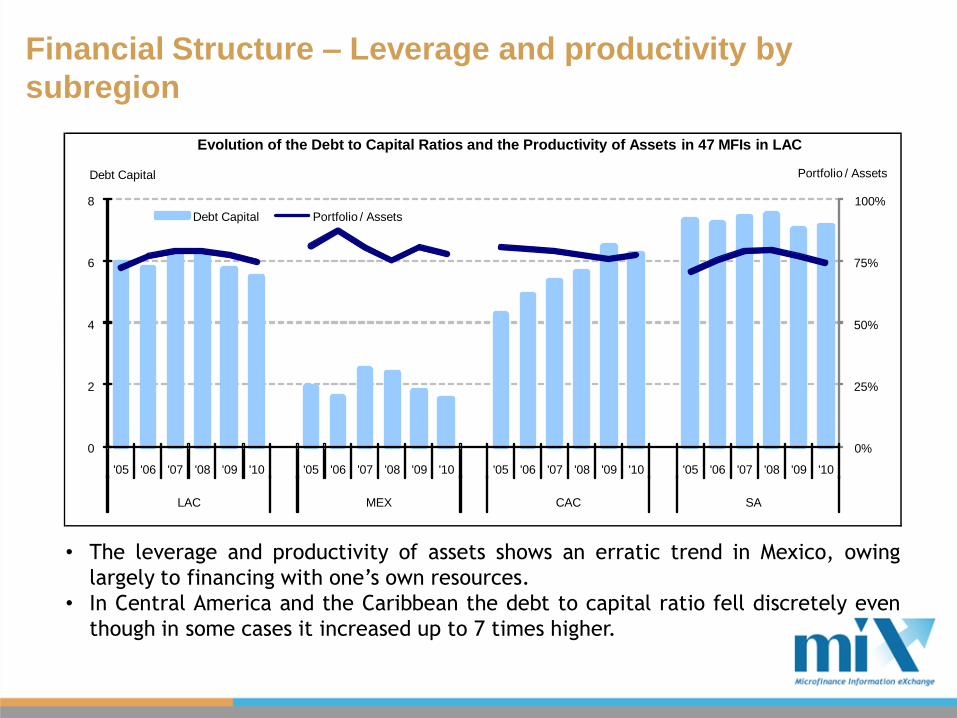
• The leverage and productivity of assets shows an erratic trend in Mexico, owing
largely to financing with one’s own resources.
• In Central America and the Caribbean the debt to capital ratio fell discretely even
though in some cases it increased up to 7 times higher.
Financial Structure – Leverage and productivity by
subregion
Evolution of the Debt to Capital Ratios and the Productivity of Assets in 47 MFIs in LAC
0%
25%
50%
75%
100%
0
2
4
6
8
'05 '06 '07 '08 '09 '10 '05 '06 '07 '08 '09 '10 '05 '06 '07 '08 '09 '10 '05 '06 '07 '08 '09 '10
LAC MEX CAC SA
Portfolio / AssetsDebt Capital
Debt Capital Portfolio / Assets
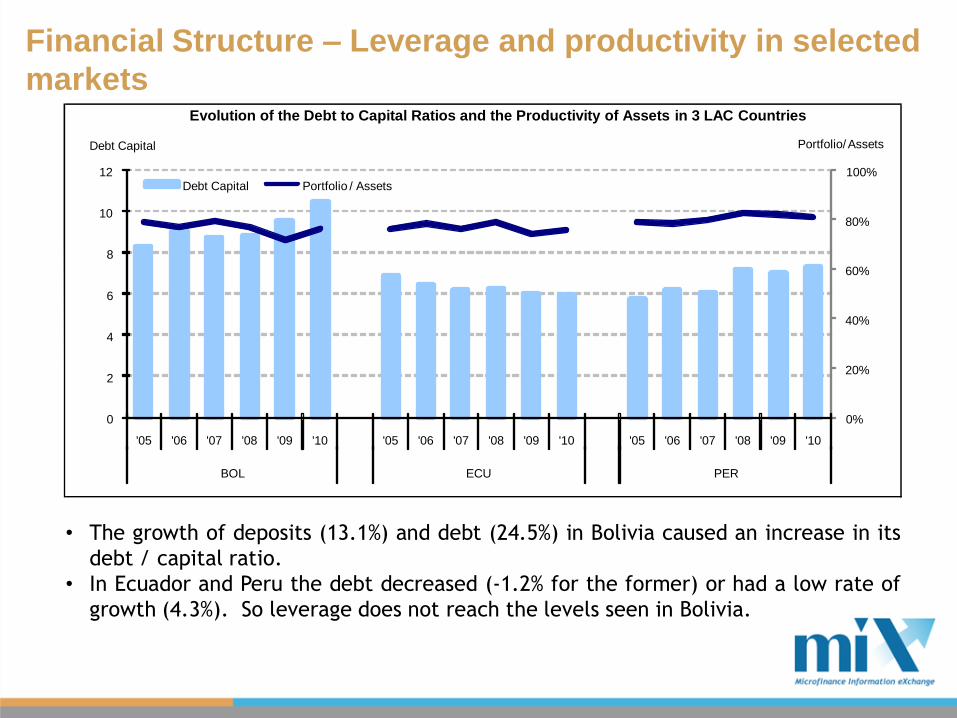
• The growth of deposits (13.1%) and debt (24.5%) in Bolivia caused an increase in its
debt / capital ratio.
• In Ecuador and Peru the debt decreased (-1.2% for the former) or had a low rate of
growth (4.3%). So leverage does not reach the levels seen in Bolivia.
Financial Structure – Leverage and productivity in selected
marketsEvolution of the Debt to Capital Ratios and the Productivity of Assets in 3 LAC Countries
0%
20%
40%
60%
80%
100%
0
2
4
6
8
10
12
'05 '06 '07 '08 '09 '10 '05 '06 '07 '08 '09 '10 '05 '06 '07 '08 '09 '10
BOL ECU PER
Portfolio/ AssetsDebt Capital
Debt Capital Portfolio / Assets
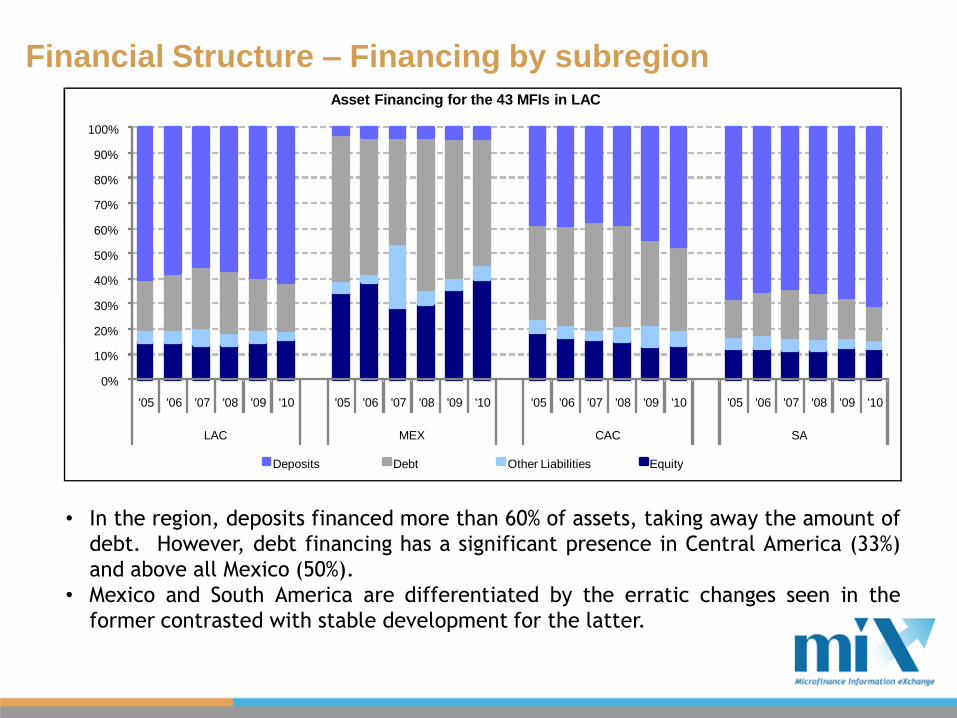
• In the region, deposits financed more than 60% of assets, taking away the amount of
debt. However, debt financing has a significant presence in Central America (33%)
and above all Mexico (50%).
• Mexico and South America are differentiated by the erratic changes seen in the
former contrasted with stable development for the latter.
Financial Structure – Financing by subregion
Asset Financing for the 43 MFIs in LAC
0%
10%
20%
30%
40%
50%
60%
70%
80%
90%
100%
'05 '06 '07 '08 '09 '10 '05 '06 '07 '08 '09 '10 '05 '06 '07 '08 '09 '10 '05 '06 '07 '08 '09 '10
LAC MEX CAC SA
Deposits Debt Other Liabilities Equity
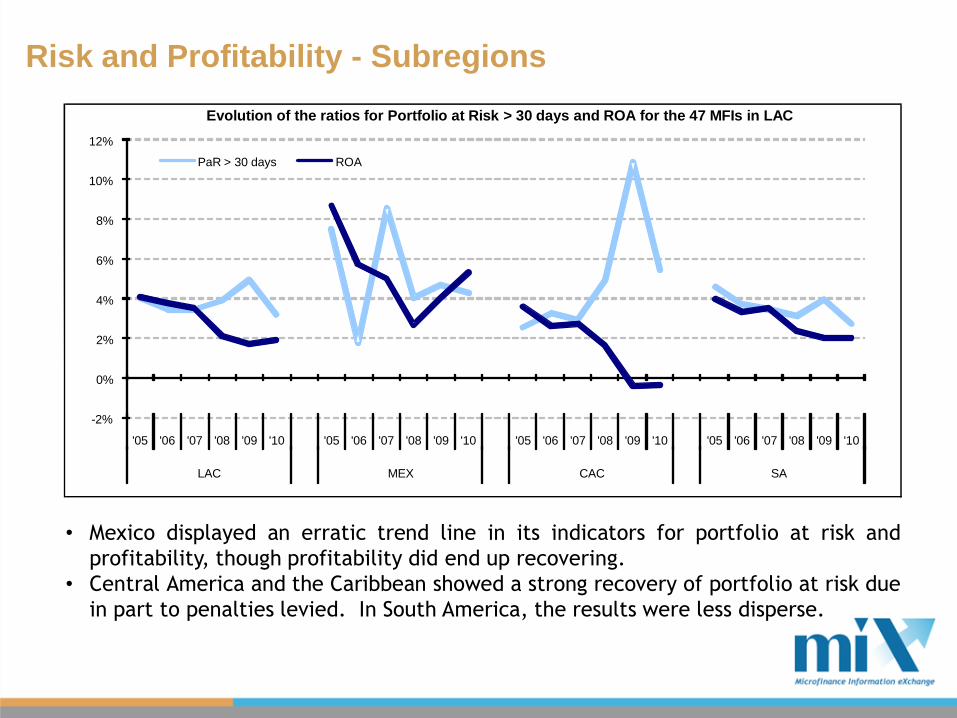
• Mexico displayed an erratic trend line in its indicators for portfolio at risk and
profitability, though profitability did end up recovering.
• Central America and the Caribbean showed a strong recovery of portfolio at risk due
in part to penalties levied. In South America, the results were less disperse.
Risk and Profitability - Subregions
Evolution of the ratios for Portfolio at Risk > 30 days and ROA for the 47 MFIs in LAC
-2%
0%
2%
4%
6%
8%
10%
12%
'05 '06 '07 '08 '09 '10 '05 '06 '07 '08 '09 '10 '05 '06 '07 '08 '09 '10 '05 '06 '07 '08 '09 '10
LAC MEX CAC SA
PaR > 30 days ROA
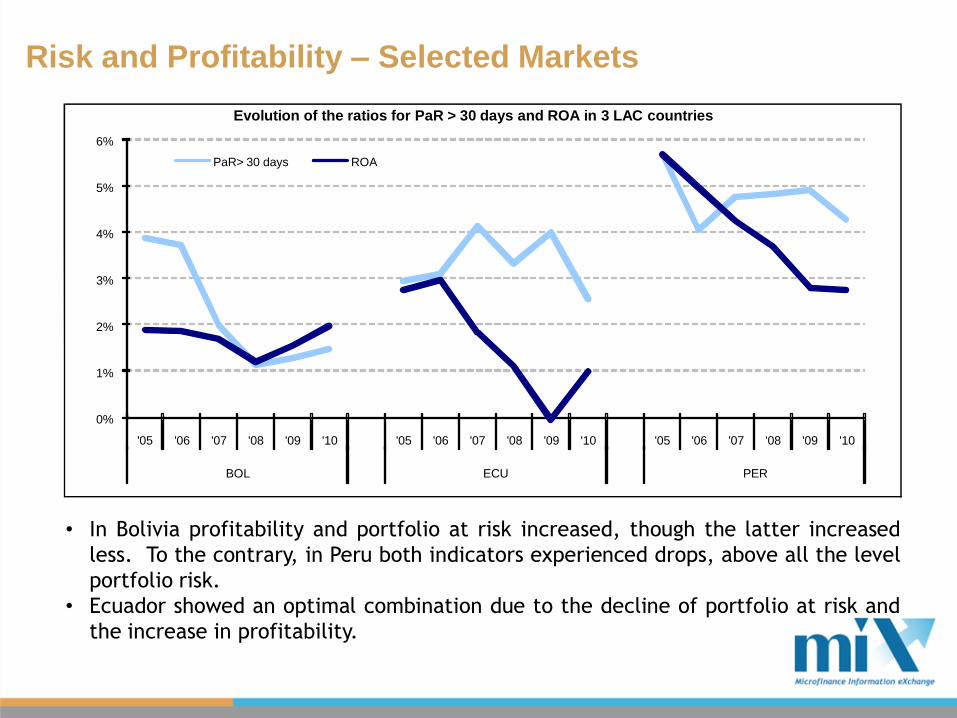
• In Bolivia profitability and portfolio at risk increased, though the latter increased
less. To the contrary, in Peru both indicators experienced drops, above all the level
portfolio risk.
• Ecuador showed an optimal combination due to the decline of portfolio at risk and
the increase in profitability.
Risk and Profitability – Selected Markets
Evolution of the ratios for PaR > 30 days and ROA in 3 LAC countries
0%
1%
2%
3%
4%
5%
6%
'05 '06 '07 '08 '09 '10 '05 '06 '07 '08 '09 '10 '05 '06 '07 '08 '09 '10
BOL ECU PER
PaR> 30 days ROA
Final Comments
• The microfinance sector in Latin America and the Caribbean grew in 2010
in part due to improvements in the level of loan recuperation, due in turn
to a gradual recovery in the economic activity throughout the region after
the effects of the international financial crisis were made evident in 2009.
• Nevertheless, the evolution was different for loan portfolio. At the
subregional level, Mexico had the most activity (including borrowers),
followed by South America and finally, Central America continued its
recovery.
• At the product level, loans to microenterprises had growth and
performance was clearly better than the others. With respect to deposits
the situation was very similar, although in Mexico the number of depositors
fell.
• The level of risk fell in part due to an improvement in the levels of loan
recovery and because of a series of portfolio penalties. As a result of this,
the level of profitability increased slightly.
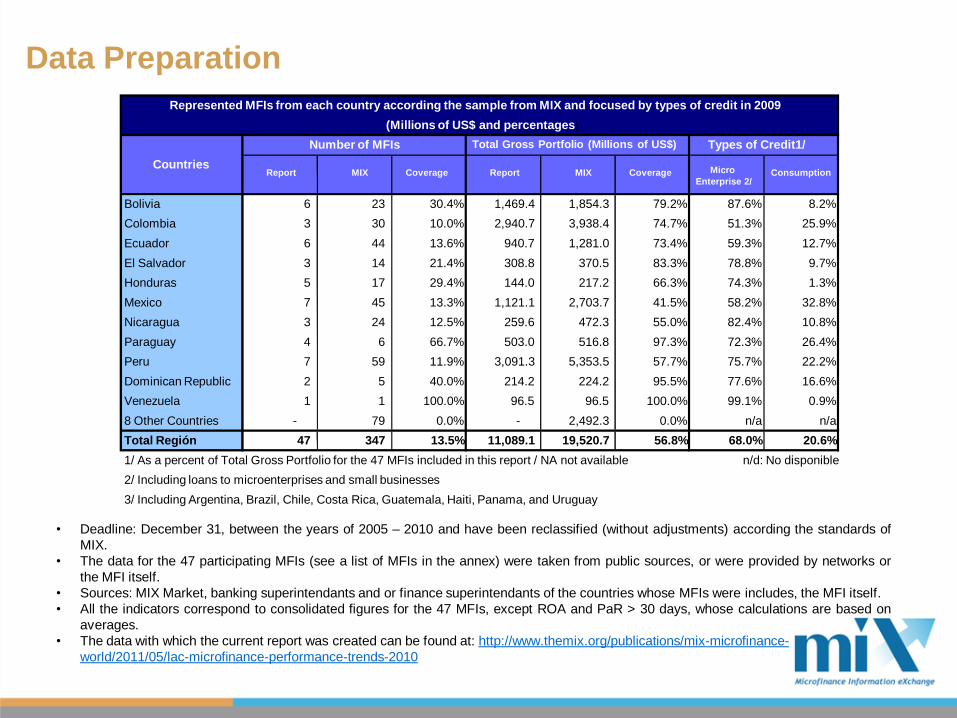
Data Preparation
• Deadline: December 31, between the years of 2005 – 2010 and have been reclassified (without adjustments) according the standards of
MIX.
• The data for the 47 participating MFIs (see a list of MFIs in the annex) were taken from public sources, or were provided by networks or
the MFI itself.
• Sources: MIX Market, banking superintendants and or finance superintendants of the countries whose MFIs were includes, the MFI itself.
• All the indicators correspond to consolidated figures for the 47 MFIs, except ROA and PaR > 30 days, whose calculations are based on
averages.
• The data with which the current report was created can be found at: http://www.themix.org/publications/mix-microfinance-
world/2011/05/lac-microfinance-performance-trends-2010
Represented MFIs from each country according the sample from MIX and focused by types of credit in 2009
(Millions of US$ and percentages)
Number of MFIs Total Gross Portfolio (Millions of US$) Types of Credit1/
Report MIX Coverage Report MIX Coverage Micro
Enterprise 2/Consumption
Bolivia 6 23 30.4% 1,469.4 1,854.3 79.2% 87.6% 8.2%
Colombia 3 30 10.0% 2,940.7 3,938.4 74.7% 51.3% 25.9%
Ecuador 6 44 13.6% 940.7 1,281.0 73.4% 59.3% 12.7%
El Salvador 3 14 21.4% 308.8 370.5 83.3% 78.8% 9.7%
Honduras 5 17 29.4% 144.0 217.2 66.3% 74.3% 1.3%
Mexico 7 45 13.3% 1,121.1 2,703.7 41.5% 58.2% 32.8%
Nicaragua 3 24 12.5% 259.6 472.3 55.0% 82.4% 10.8%
Paraguay 4 6 66.7% 503.0 516.8 97.3% 72.3% 26.4%
Peru 7 59 11.9% 3,091.3 5,353.5 57.7% 75.7% 22.2%
Dominican Republic 2 5 40.0% 214.2 224.2 95.5% 77.6% 16.6%
Venezuela 1 1 100.0% 96.5 96.5 100.0% 99.1% 0.9%
8 Other Countries - 79 0.0% - 2,492.3 0.0% n/a n/a
Total Región 47 347 13.5% 11,089.1 19,520.7 56.8% 68.0% 20.6%
1/ As a percent of Total Gross Portfolio for the 47 MFIs included in this report / NA not available n/d: No disponible
2/ Including loans to microenterprises and small businesses
3/ Including Argentina, Brazil, Chile, Costa Rica, Guatemala, Haiti, Panama, and Uruguay
Countries
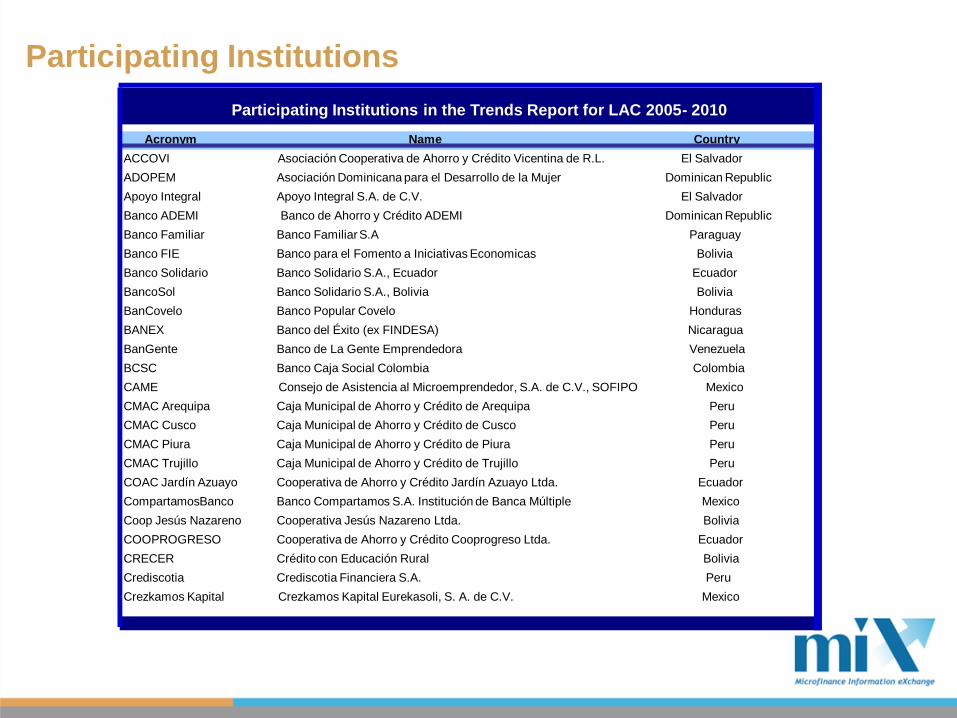
Participating Institutions
Participating Institutions in the Trends Report for LAC 2005- 2010
Acronym Name Country
ACCOVI Asociación Cooperativa de Ahorro y Crédito Vicentina de R.L. El Salvador
ADOPEM Asociación Dominicana para el Desarrollo de la Mujer Dominican Republic
Apoyo Integral Apoyo Integral S.A. de C.V. El Salvador
Banco ADEMI Banco de Ahorro y Crédito ADEMI Dominican Republic
Banco Familiar Banco Familiar S.A Paraguay
Banco FIE Banco para el Fomento a Iniciativas Economicas Bolivia
Banco Solidario Banco Solidario S.A., Ecuador Ecuador
BancoSol Banco Solidario S.A., Bolivia Bolivia
BanCovelo Banco Popular Covelo Honduras
BANEX Banco del Éxito (ex FINDESA) Nicaragua
BanGente Banco de La Gente Emprendedora Venezuela
BCSC Banco Caja Social Colombia Colombia
CAME Consejo de Asistencia al Microemprendedor, S.A. de C.V., SOFIPO Mexico
CMAC Arequipa Caja Municipal de Ahorro y Crédito de Arequipa Peru
CMAC Cusco Caja Municipal de Ahorro y Crédito de Cusco Peru
CMAC Piura Caja Municipal de Ahorro y Crédito de Piura Peru
CMAC Trujillo Caja Municipal de Ahorro y Crédito de Trujillo Peru
COAC Jardín Azuayo Cooperativa de Ahorro y Crédito Jardín Azuayo Ltda. Ecuador
CompartamosBanco Banco Compartamos S.A. Institución de Banca Múltiple Mexico
Coop Jesús Nazareno Cooperativa Jesús Nazareno Ltda. Bolivia
COOPROGRESO Cooperativa de Ahorro y Crédito Cooprogreso Ltda. Ecuador
CRECER Crédito con Educación Rural Bolivia
Crediscotia Crediscotia Financiera S.A. Peru
Crezkamos Kapital Crezkamos Kapital Eurekasoli, S. A. de C.V. Mexico
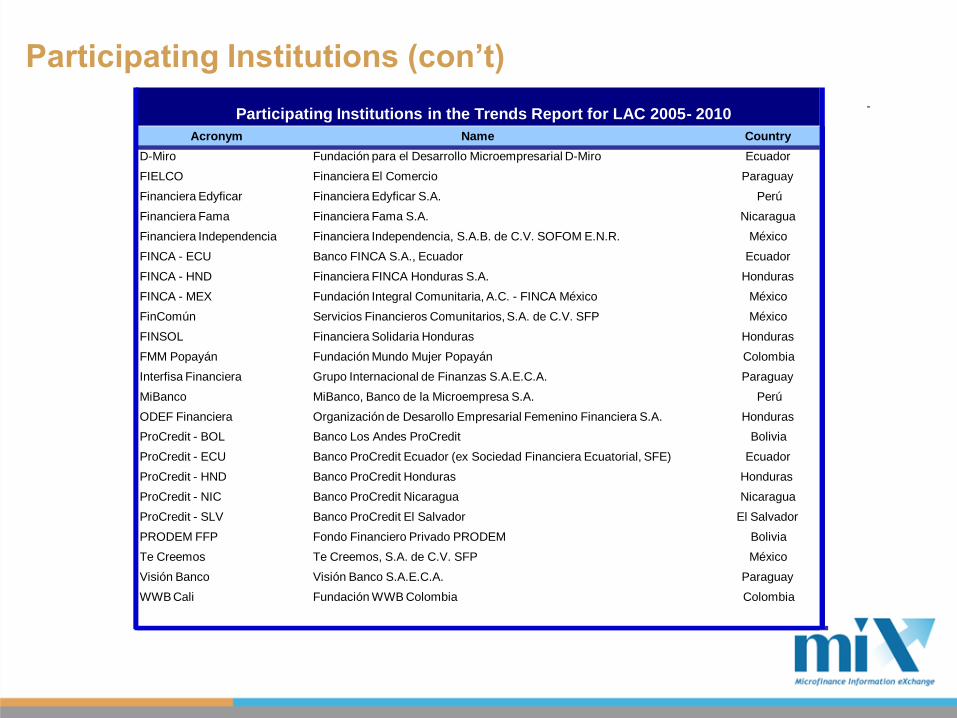
Participating Institutions (con’t)
Participating Institutions in the Trends Report for LAC 2005- 2010
Acronym Name Country
D-Miro Fundación para el Desarrollo Microempresarial D-Miro Ecuador
FIELCO Financiera El Comercio Paraguay
Financiera Edyficar Financiera Edyficar S.A. Perú
Financiera Fama Financiera Fama S.A. Nicaragua
Financiera Independencia Financiera Independencia, S.A.B. de C.V. SOFOM E.N.R. México
FINCA - ECU Banco FINCA S.A., Ecuador Ecuador
FINCA - HND Financiera FINCA Honduras S.A. Honduras
FINCA - MEX Fundación Integral Comunitaria, A.C. - FINCA México México
FinComún Servicios Financieros Comunitarios, S.A. de C.V. SFP México
FINSOL Financiera Solidaria Honduras Honduras
FMM Popayán Fundación Mundo Mujer Popayán Colombia
Interfisa Financiera Grupo Internacional de Finanzas S.A.E.C.A. Paraguay
MiBanco MiBanco, Banco de la Microempresa S.A. Perú
ODEF Financiera Organización de Desarollo Empresarial Femenino Financiera S.A. Honduras
ProCredit - BOL Banco Los Andes ProCredit Bolivia
ProCredit - ECU Banco ProCredit Ecuador (ex Sociedad Financiera Ecuatorial, SFE) Ecuador
ProCredit - HND Banco ProCredit Honduras Honduras
ProCredit - NIC Banco ProCredit Nicaragua Nicaragua
ProCredit - SLV Banco ProCredit El Salvador El Salvador
PRODEM FFP Fondo Financiero Privado PRODEM Bolivia
Te Creemos Te Creemos, S.A. de C.V. SFP México
Visión Banco Visión Banco S.A.E.C.A. Paraguay
WWB Cali Fundación WWB Colombia Colombia
About MIX
MIX is the premier source for objective, qualified and
relevant microfinance performance data and analysis.
Committed to strengthening financial inclusion and the
microfinance sector by promoting transparency, MIX
provides objective, qualified and relevant performance
information on microfinance institutions (MFIs), funders,
networks and service providers dedicated to serving the
financial sector needs for low-income clients.
MIX fulfills its mission through a variety of platforms. On
MIX Market (www.mixmarket.org), we provide instant
access to financial and social performance information
covering approximately 2,000 MFIs around the world. Our
publications, MicroBanking Bulletin and MIX Microfinance
World, feature thorough and timely analysis based on
qualified data and research.
Incorporated in 2002, MIX is a non-profit organization
headquartered in Washington, DC with regional offices in
Azerbaijan, India, Morocco, and Peru. Our efforts are
strengthened through our collaboration with the following
global partners: Bill & Melinda Gates Foundation, CGAP,
Omidyar Network, The MasterCard Foundation, IFAD,
Michael & Susan Dell Foundation, Citi Foundation, and Ford
Foundation. For more information about MIX, please visit
www.themix.org.
About MIF / IDB
Through donations, loans and capital investments,
MIF, member of the IDB group, supports innovative
private projects that expand the access to basic
services, finances, markets, skills and capabilities
for the betterment of Latin America and the
Caribbean. Founded in 1993, MIF is the largest
source of financing in Latin America and the
Caribbean, and concentrates its principal activities
in the development of small and medium
enterprises.