Embed Size (px)
Citation preview
8
Latin American Journalof Aquatic Mammalswww.lajamjournal.org
Latin American Journalof Aquatic Mammalswww.lajamjournal.org
Sperm whaleS of the SoutheaSt pacific. part Vii. reproduction and growth in the female 1
Robert Clarke+ , Obla Paliza* andKoen Van Waerebeek**
AbstractThis report on the reproduction and growth of the female sperm whale Physeter catodon2 is Part VII of our
work on this whale in the Southeast Pacific. There were 1105 female sperm whales in our sample collected from two whaling stations in Chile and two in Peru. Since Clarke and Paliza (1972) have shown that they belonged to a single stock, we have worked them together. A second Graafian follicle develops more than the others in each ovary so to improve the possibility of fertilization in case the first ovum fails to be impregnated. We consider the size of the Graafian follicle at, or near, ovulation to be around 100mm, larger than what has been found in sperm whales from other seas. The corpus luteum of pregnancy is significantly larger than the corpus luteum of ovulation. The corpus albicans reduces in size throughout the life of the whale and probably does not disappear. There is a highly significant correlation between the total number of corpora and age: therefore we use the number of corpora as an indication of age. The corpora atretica are more frequent in older female sperm whales reflecting less fertility in this group. The sexual cycle in sperm whales of the Southeast Pacific has been revised to last 4yrs. Sexual maturity in female sperm whales is attained at 8.2m long and 6.5yrs of age, being both values lower than in sperm whales from other seas. The female sperm whale is born at 3.90m. The incidence of twins, 0.91%, is higher than in other seas. Fertility is low in very young whales (1-2 ovarian corpora) and it is at its lowest in the older group (over 12 corpora). The highest fertility is when females have 3-10 ovarian corpora and they are 15 to 35yrs old. The proportion of active females in pre oestrus during the months of pairing is significantly higher than during the other months. Accessory ovulations during oestrus are represented by the small groups of lactating-and-recently ovulated and lactating-and-pregnant whales. Unsuccessful ovulations are more frequent in late lactation and late resting periods, being post-partum ovulation rare. Female sperm whales in the Southeast Pacific may ovulate up to four and possibly five times during an oestrus. Physical maturity is attained at 11.2m long and 33.5yrs old. Fusion of the vertebrae begins at both ends of the vertebral column and finishes between the posterior thoracic and the lumbar vertebrae. Female sperm whales of the Southeast Pacific may live, at least, up to 50yrs of age. The age at recruitment between 1959 and 1962 was 20-21yrs of age when they had accumulated 4–5 corpora in their ovaries.
Keywordsfemale sperm whalePhyseter catodonsexual cyclesexual maturityfertilityphysical maturitylongevityage at recruitment
ar t i c l e in f o
Article historyReceived2 February 2009Received in revised form 29 May 2012Accepted 5 June 2012Available online8 March 2013
Online ISSN: 2236-1057
1This paper is the last part of the series ‘Sperm whales of the Southeast Pacific’, which first appeared in 1968 (Clarke et al., 1968). Although the monographical style of the paper does not conform to the types of manuscript currently established in LAJAM, the editors are honoured to publish Dr. Clarke’s work posthumously.+ Deceased 8 May 2011*Apartado 40, Pisco, Peru. E-mail: [email protected]**Centro Peruano de Estudios Cetológicos (CEPEC), Pucusana, Lima-20, Peru
2Although the currently accepted scientific name of the sperm whale is Physeter macrocephalus, the authors have used P. catodon throughout the series, and the editors wished to respect their desire to continue using this name. In a footnote to p. 54 in Clarke et al. (1988) they explained why they prefer catodon to macrocephalus as the specific name of the sperm whale.
Responsible Editor: Eduardo R. SecchiCitation: Clarke, R., Paliza, O. and Van Waerebeek, K. 2011 Sperm whales of the Southeast Pacific. Part VII. Reproduc-tion and growth in the female. Latin American Journal of Aquatic Mammals 10(1): 8-39http://dx.doi.org/10.5597/lajam00172
9
ResumenEste informe sobre reproducción y crecimiento del
cachalote hembra Physeter catodon es Parte VII de nuestro estudio de esta especie en el Pacífico Sureste. El material consta de 1105 cachalotes hembras colectados desde dos estaciones balleneras en Chile y dos en Perú. Como Clarke and Paliza (1972) han mostrado que estos cachalotes pertenecen a una misma población, los hemos trabajado juntos. Un segundo folículo de Graff se desarrolla más que los otros en cada ovario, mejorando así la posibilidad de fertilización en caso de que el primer óvulo no sea impregnado. Consideramos que el tamaño del folículo a, o cerca de, la ovulación sea alrededor de 100mm, más grande que lo que se ha encontrado en cachalotes de otros mares. El cuerpo lúteo de preñez es significantemente más grande que el cuerpo lúteo de ovulación. El cuerpo albicans se reduce en tamaño a través de la vida de la ballena y posiblemente no desaparece. Hay una correlación altamente significante entre el número total de cuerpos ováricos y la edad: por lo tanto usamos el número de estos cuerpos como una indicación de edad. Cuerpos atréticos son más frecuentes en cachalotes más viejos reflejando menor fertilidad en este grupo. El ciclo sexual en cachalotes del Pacífico Sureste ha sido revisado y dura cuatro años. El cachalote hembra alcanza la madurez sexual a 8.2m de longitud y 6.5 años de edad, siendo ambos valores más bajos comparados con cachalotes de otros mares. El cachalote hembra nace a 3.90m. La incidencia de mellizos, 0.91%, es más alta que en otros mares. La fertilidad es baja en ballenas jóvenes (1-2 cuerpos ováricos) y está en su nivel más bajo en el grupo de mayores (sobre 12 cuerpos ováricos). La fertilidad es más alta cuando las ballenas tienen 3-10 cuerpos ováricos y se encuentran entre 15 y 35 años de edad. La proporción de hembras activas en pre oestrus en los meses de apareamiento es significantemente más alta que durante los otros meses. Ovulaciones accesorias durante el oestrus están representadas por los pequeños grupos de lactando-y-recientemente ovulada y lactando-y-preñadas. Ovulaciones sin éxito son más frecuentes al final de la lactación y al final del periodo de descanso, siendo rara la ovulación post-parto. Los cachalotes hembras en el Pacífico Sureste pueden ovular cuatro y posiblemente cinco veces durante el oestrus. La madurez física la alcanzan a los 11.2m de longitud y 33.5 años de edad. La fusión de las vértebras empieza en ambos extremos de la columna vertebral y termina entre las vértebras torácicas posteriores y las lumbares. El cachalote hembra en el Pacífico Sureste puede vivir por lo menos hasta los 50 años de edad. La edad de reclutamiento entre 1959 y 1962 fue 20-21 años, cuando habían acumulado 4-5 cuerpos ováricos.
IntroductionThe series Sperm whales of the Southeast PacificThe present report on reproduction and growth in the
female sperm whale, Physeter catodon is the seventh part in the series Sperm whales of the Southeast Pacific. Previous parts comprise:
Part I. Introduction andPart II. Size range, external characters and teeth
(Clarke et al., 1968)Part III. Morphometry (Clarke and Paliza, 1972)Part IV. Fatness, food and feeding (Clarke et al., 1988)Part V. The dorsal fin callus (Clarke and Paliza, 1994)Part VI. Growth and breeding in the male (Clarke et
al., 1994)The results presented here on reproduction and growth
in the female sperm whale are from part of the data collected during the whale investigations conducted between 1959 and 1962 in Chile and Peru. Part I of the series describes the origin, provenance, objectives and development of the investigations.
How disregard of the whaling regulations in 1959-62 has affected the female data
Until Chile and Peru joined the International Whaling Commission (IWC) in 1979 (International Whaling Commission, 1980, p.13), whaling from these two countries was conducted according to the regulations of the Comisión Permanente del Pacífico Sur (CPPS; or Permanent Commission of the South Pacific) established in 1952 by Chile, Ecuador and Peru (Anonymous, 1954).
The whaling regulations of the CPPS differed from those of the IWC as follows: the time limit between killing and working up a whale was put at 40 hours instead of 33 hours; no minimum distance was stipulated between shore stations; the season for sperm whaling lasted all the year and not for eight months; the minimum size for taking sperm whales was put at 30 feet (9.1m) whereas the IWC put this minimum at 35 feet (10.7m) for shore whaling and, in 1951, at 38 feet (11.6m) for pelagic whaling, a length which protected almost all female whales as these do not grow to more than about 12m (the largest female sperm whale reliably measured to the present was 12.30m long (Clarke, 1956, p. 242)); finally the CPPS made no provision for inspection at the land stations.
The CPPS regulations agreed with those of the IWC in that it was forbidden to take whales accompanied by calves, that is, lactating whales and calves. During the period 1959-62, when the data analyzed in the present report were collected, the protection of lactating whales was disregarded in Chile and Peru. Infractions were never reported in the whaling returns and, indeed, several gunners commanding the whale catchers told the first author that they were not aware of any regulations. Female sperm whales are always in schools (Clarke, 1956, p. 277) and animals in the mixed schools were killed without discrimination, except that
10
calves were disregarded as being too small, and only a small proportion of animals less than 9.0m long were taken, since the scale of remuneration for the gunners began – at least in Peru – for whales of 9.0m and longer (Saetersdal et al., 1963, p. 56). In a Progress Report, Clarke et al. (1964) reported that between 1959 and 1961 only 9.05% of 971 female sperm whales measured less than 9.0m. Using all the material from the Southeast Pacific (SEP), which includes whales landed in Pisco in 1962, there were 14.84% of female sperm whales measuring less than 9.0m. This is because in 1962 the proportion of small females in the catch from Pisco increased to about 25%. There was of course selection for the larger males and in Part VI of the present series we have discussed at length the effect of this selection on the breeding behaviour of males in the SEP over the period 1959-80 (Clarke et al., 1994).
In the SEP female sperm whales achieve sexual maturity at a mean length of 8.2m, and the protracted gestation period means that even primiparous whales should have reached 9.0m or more during their pregnancy. Then because the prohibition on taking lactating whales was ignored between 1959 and 1962, we consider that the proportions of pregnant, lactating and resting whales in our samples were representative of the proportions in the sea, for these samples were representative of the catches (Saetersdal et al., 1963, Figure 4). This consideration, together with the fact that whaling in the SEP between 1959 and 1962 was conducted in all months of the year, allows for an approach to the female sexual cycle which was not possible for previous authors. It is only for this reason that we have, whilst introducing the present report, drawn attention to the disregard of the CPPS regulation between 1959 and 1962.
Treatment of dataThe sperm whale carcases providing the present material
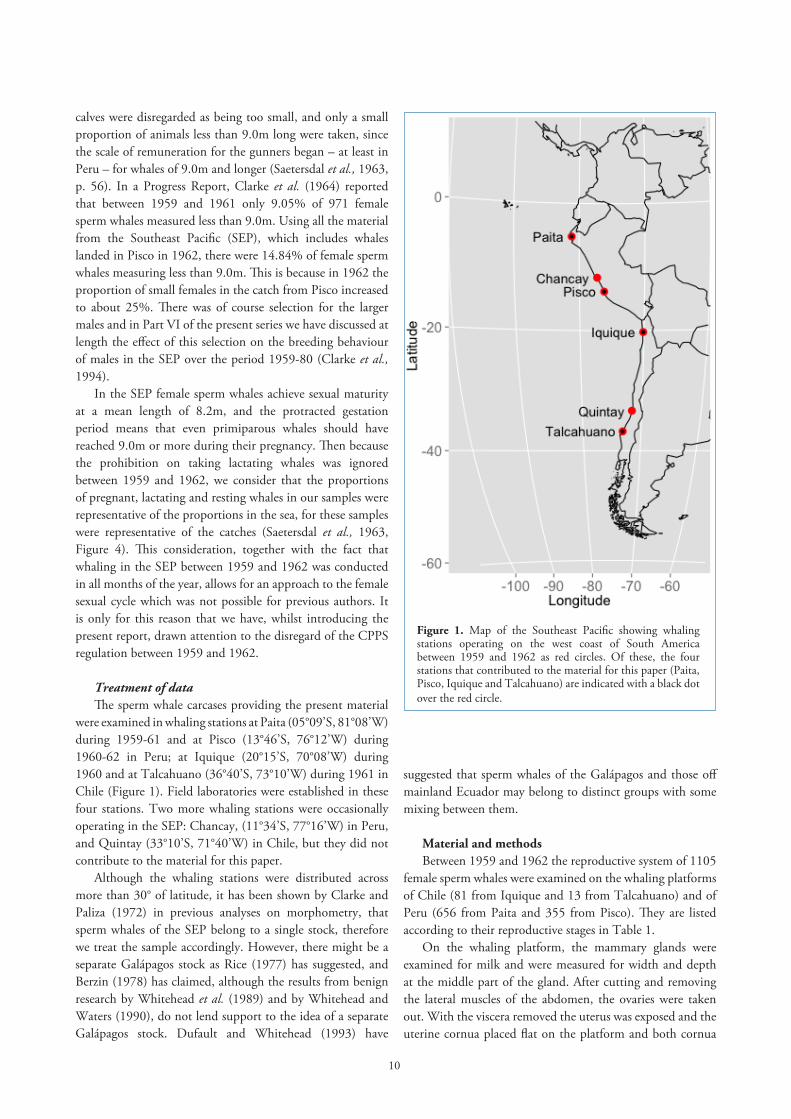
were examined in whaling stations at Paita (05°09’S, 81°08’W) during 1959-61 and at Pisco (13°46’S, 76°12’W) during 1960-62 in Peru; at Iquique (20°15’S, 70°08’W) during 1960 and at Talcahuano (36°40’S, 73°10’W) during 1961 in Chile (Figure 1). Field laboratories were established in these four stations. Two more whaling stations were occasionally operating in the SEP: Chancay, (11°34’S, 77°16’W) in Peru, and Quintay (33°10’S, 71°40’W) in Chile, but they did not contribute to the material for this paper.
Although the whaling stations were distributed across more than 30° of latitude, it has been shown by Clarke and Paliza (1972) in previous analyses on morphometry, that sperm whales of the SEP belong to a single stock, therefore we treat the sample accordingly. However, there might be a separate Galápagos stock as Rice (1977) has suggested, and Berzin (1978) has claimed, although the results from benign research by Whitehead et al. (1989) and by Whitehead and Waters (1990), do not lend support to the idea of a separate Galápagos stock. Dufault and Whitehead (1993) have
suggested that sperm whales of the Galápagos and those off mainland Ecuador may belong to distinct groups with some mixing between them.
Material and methodsBetween 1959 and 1962 the reproductive system of 1105
female sperm whales were examined on the whaling platforms of Chile (81 from Iquique and 13 from Talcahuano) and of Peru (656 from Paita and 355 from Pisco). They are listed according to their reproductive stages in Table 1.
On the whaling platform, the mammary glands were examined for milk and were measured for width and depth at the middle part of the gland. After cutting and removing the lateral muscles of the abdomen, the ovaries were taken out. With the viscera removed the uterus was exposed and the uterine cornua placed flat on the platform and both cornua
Figure 1. Map of the Southeast Pacific showing whaling stations operating on the west coast of South America between 1959 and 1962 as red circles. Of these, the four stations that contributed to the material for this paper (Paita, Pisco, Iquique and Talcahuano) are indicated with a black dot over the red circle.
11
were measured transversely. The vagina was also measured in this way. Then the uterine cornua were cut to search for a foetus.
In the field laboratory the combined weights of the ovaries were taken. Then the corpus luteum (CL), when present, was cut and measured on two planes at right angles and the mean taken to represent the size of the corpus. The ovaries were sliced at a thickness of about 8mm (5-10mm) and a subjective determination of the amount of Graafian follicles was made. Corpora albicantia (CA) and corpora atretica (CAtr) were identified. The presence of cavities (antra) were recorded in CL and in CA. A measurement of these cavities was made on two right angles and the mean taken as representative of the size. CAtr were recorded but not measured. A total of 1025 pairs of ovaries were completely examined in this way in sperm whales off Chile and Peru.
Observation for ankylosis of the vertebrae to their epiphyses was made on four regions of the vertebral column for each whale examined (anterior thoracic 4-5, posterior thoracic 10-11, lumbar, mostly 4-5 and caudal, mostly 2-3).
Statistical analysis was as follows. Where distributions allowed, 2-way Student t- tests were used to verify the equality of means between two independent samples. Levene’s tests were applied to verify homogeneity of variances. Normality was checked with Kolmogorov-Smirnov tests. Where sample distribution did not show normality or variances were not homogeneous, samples were tested for significant divergences between medians applying Mann-Whitney U and Kruskal-Wallis tests for, respectively, two and three or more groups of sample data. Pearson’s chi-square tests were used to test independence between categorical data variables. Statistical computations were done with SPSS 13.0 (The Apache Software Foundation). This applies to all statistical analysis.
ResultsChanges in the reproductive organsOvariesSperm whale ovaries are small oval bodies weighing
0.05-1.80kg (excluding ovaries of the recently ovulated and pregnant whales), with a smooth surface (tunica albuginea) and it is often difficult to distinguish an immature ovary from a mature one by their external appearance, in those which do not carry a CL.
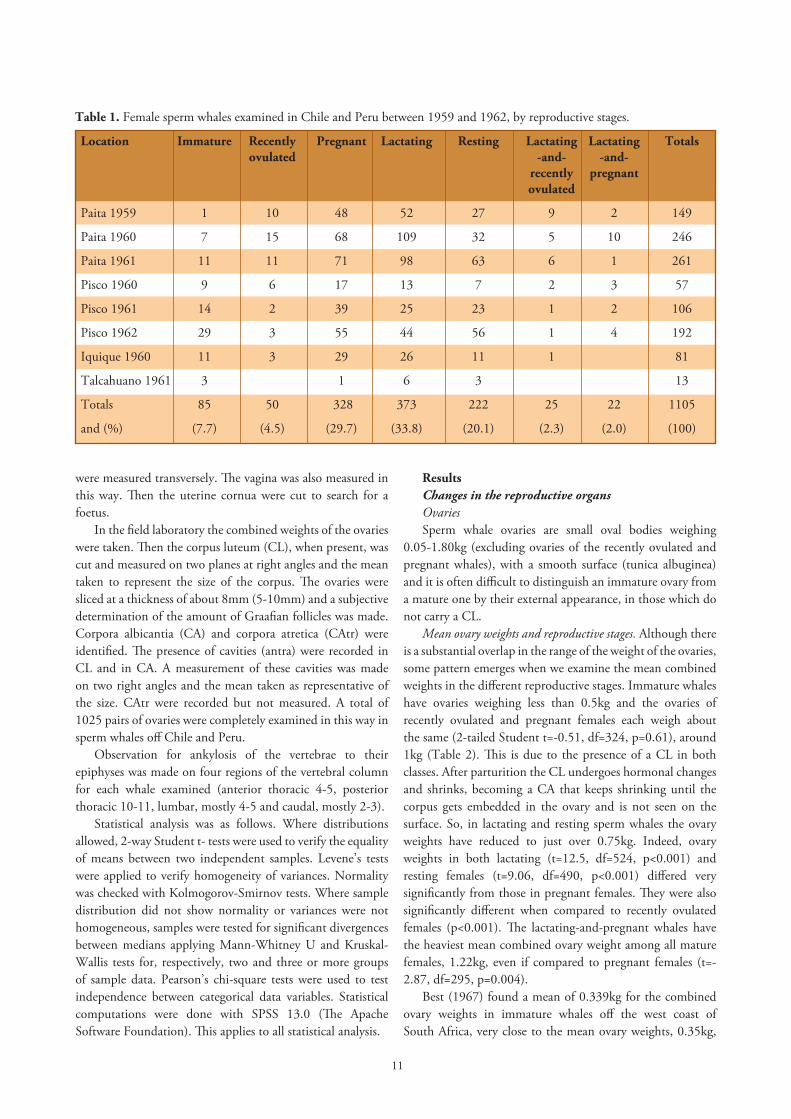
Mean ovary weights and reproductive stages. Although there is a substantial overlap in the range of the weight of the ovaries, some pattern emerges when we examine the mean combined weights in the different reproductive stages. Immature whales have ovaries weighing less than 0.5kg and the ovaries of recently ovulated and pregnant females each weigh about the same (2-tailed Student t=-0.51, df=324, p=0.61), around 1kg (Table 2). This is due to the presence of a CL in both classes. After parturition the CL undergoes hormonal changes and shrinks, becoming a CA that keeps shrinking until the corpus gets embedded in the ovary and is not seen on the surface. So, in lactating and resting sperm whales the ovary weights have reduced to just over 0.75kg. Indeed, ovary weights in both lactating (t=12.5, df=524, p<0.001) and resting females (t=9.06, df=490, p<0.001) differed very significantly from those in pregnant females. They were also significantly different when compared to recently ovulated females (p<0.001). The lactating-and-pregnant whales have the heaviest mean combined ovary weight among all mature females, 1.22kg, even if compared to pregnant females (t=-2.87, df=295, p=0.004).
Best (1967) found a mean of 0.339kg for the combined ovary weights in immature whales off the west coast of South Africa, very close to the mean ovary weights, 0.35kg,
Table 1. Female sperm whales examined in Chile and Peru between 1959 and 1962, by reproductive stages.
Location Immature Recently Pregnant Lactating Resting Lactating Lactating Totals ovulated -and- -and- recently pregnant ovulated
Paita 1959 1 10 48 52 27 9 2 149
Paita 1960 7 15 68 109 32 5 10 246
Paita 1961 11 11 71 98 63 6 1 261
Pisco 1960 9 6 17 13 7 2 3 57
Pisco 1961 14 2 39 25 23 1 2 106
Pisco 1962 29 3 55 44 56 1 4 192
Iquique 1960 11 3 29 26 11 1 81
Talcahuano 1961 3 1 6 3 13
Totals 85 50 328 373 222 25 22 1105
and (%) (7.7) (4.5) (29.7) (33.8) (20.1) (2.3) (2.0) (100)
12
in immature females of the SEP (Table 2). Clarke (1956) claimed that any female with ovaries weighing 500g or more might be expected to be mature. In the SEP material mature females have ovaries weighing on average over 500g, but the range of ovary weights in this group starts as low as 100g in resting females, so we agree with Best (1967) and Gambell (1972) that it is not possible to separate sexually mature from sexually immature females by the weights of their ovaries. During pregnancy there is no change in the weight of the ovaries. Indeed, no significant variation was found in the mean weight of ovaries among six stages of pregnancy defined
Table 2. Mean of combined ovary weights in sperm whales of the SEP by reproductive stages.
Reproductive Whales Range Mean±SD stages examined kg kg
Immature 84 0.05-0.70 0.35±0.15
Recently 50 0.35-2.04 1.01±0.36ovulated
Pregnant 276 0.45-2.37 1.03±0.29
Lactating 353 0.25-1.64 0.76±0.24
Resting 216 0.10-1.80 0.78±0.31
Lactating 25 0.50-2.05 1.07±0.36-and- recentlyovulated
Lactating 21 0.68-2.00 1.22±0.34-and-pregnant
TOTAL 1025
Table 3. Mean of combined ovary weights through pregnancy in sperm whales of the SEP.
Foetus Ovaries Ovary weightsize, m examined Range Mean±SD kg kg
0-0.49 40 0.50-1.81 1.07±0.31
0.50-0.99 30 0.45-1.80 1.09±0.33
1-1.99 61 0.55-1.35 0.93±0.21
2-2.99 64 0.50-2.35 1.04±0.32
3-3.99 77 0.58-2.37 1.06±0.29
4-4.20 4 0.90-1.50 1.09±0.28
Table 4. Mean weights (in kg) of lightest ovaries ‘A’ and heaviest ovaries ‘B’, mean pair-wise difference and t-tests for sperm whales of the SEP.
Reproductive Pairs of ovaries Mean weight Mean weight Mean difference Paired samplesstages examined of ovary ‘A’ of ovary ‘B’ kg t-tests reject Hº kg kg (95%CI) null hypothesis
Immature 14 0.1714 0.1857 0.0143 t=3.069
(0.0042-0.0243) p< 0.01
Recently ovulated 3 0.500 0.9667 0.4667 t=52.9
(0.4287-0.5046) p <0.0001
Pregnant 25 0.3212 0.6396 0.3184 t=12.1
(0.2637-0.3728) p< 0.0001
Lactating 28 0.3682 0.4382 0.0700 t=6.71
(0.0486-0.0914) p < 0.0001
Resting 14 0.3736 0.4529 0.0793 t=3.32
(0.0277-0.1308) p < 0.0001
by foetus size classes, as shown in Table 3 (one-way ANOVA, F(5,270)=1.907, p=0.93; Levene test of homogeneity of variances, p=0.28).
Weight of the two ovaries separately in the reproductive stages. A comparison of the weight of each ovary was made in 84 whales to find the difference in weights, however left and right were not identified. Paired samples t-tests indicated differences were statistically significant for all reproductive stages (Table 4). However, in immature whales the difference was very small, 14g; in lactating it was 70g, and in resting 79g, but in recently ovulated and pregnant whales the ovary bearing the CL weighed almost twice as much as the other ovary, a difference of 467g, and 318g, respectively. The difference in the mean weight of the two ovaries in pregnant whales (318g) was very close to the value (319g) found by Gambell (1972) in pregnant whales off Durban.
13
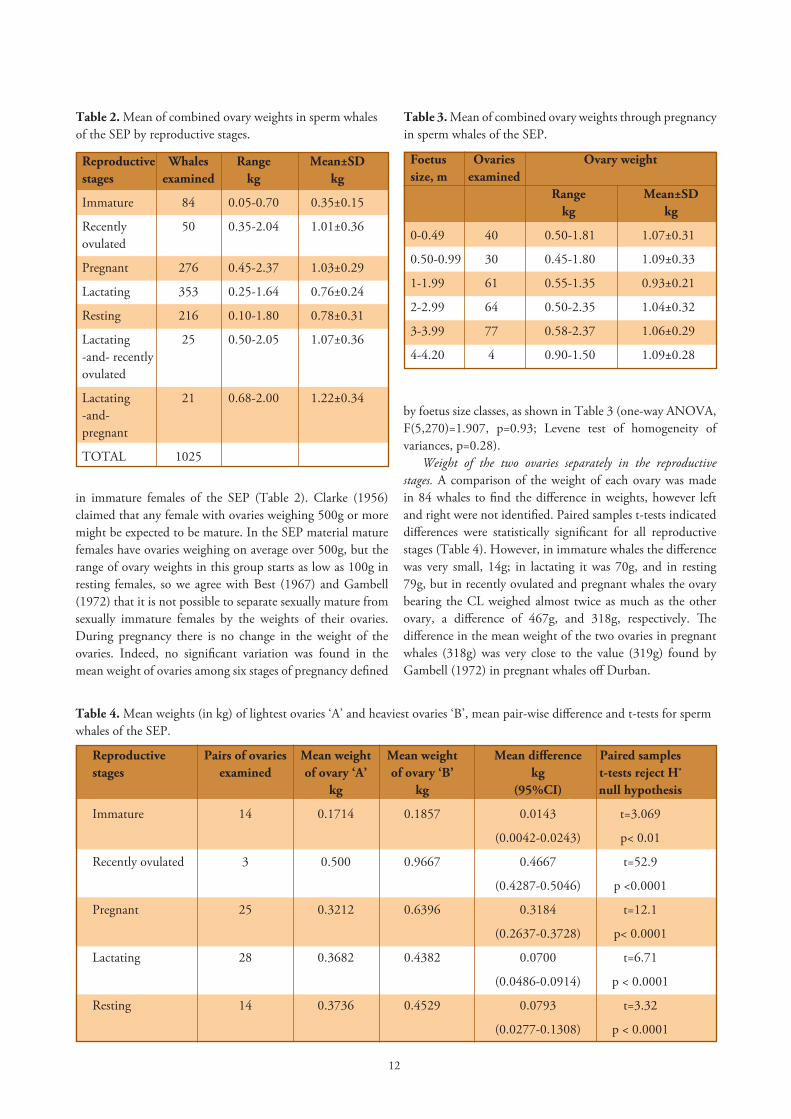
Correlation of combined ovary weights with body length and age. To find out if the ovaries get heavier as the whale grows the correlation coefficient was obtained for resting females. There is a highly significant correlation between combined ovary weight and body length (r=0.3962, df=214, p< 0.01). For determining ages 140 teeth of female sperm whales were examined counting growth layer groups (GLGs) as explained in Clarke et al. (1980). We found a significant correlation between age and the number of corpora (r=0.69, df=119, p<0.01), so we use the number of corpora as an indication of age, as other authors have done (Best, 1970; Gambell, 1972), and found that there is a significant correlation between ovary weight and age in resting females (r=0.32, df=214, p<0.01).
Other authors have found a correlation between ovary weight and body length of sperm whales in several oceans, including the Antarctic (Matthews, 1938), Azores (Clarke, 1956) and the coasts of South Africa (Best, 1967; Gambell, 1972). Correlation between ovary weight and age has only been shown by Best (1967). Gambell (1972) found little evidence of an increase of ovary weight with age in sperm whales off Durban. In resting sperm whales of the SEP there is a slight increase in the mean of the combined ovary weight in the first part of the curve (Figure 2), when the whale has 1-4 corpora, and a mean of 0.711kg; then in ovaries with 5-7 corpora there is little but no significant increase with a mean of 0.771kg (t=-1.25, df=166, p>0.10); but after eight corpora to the maximum number of 23, the ovaries weigh significantly more compared with the previous group, with a mean of 0.963kg (t=3.30, df=100, p<0.010). Gambell (1972) found a rise in the weight of ovaries with 1-8 corpora. He did not find any increase in the weight of ovaries with 16-27 corpora, but there was a decrease of weight in ovaries with more than 20 corpora.
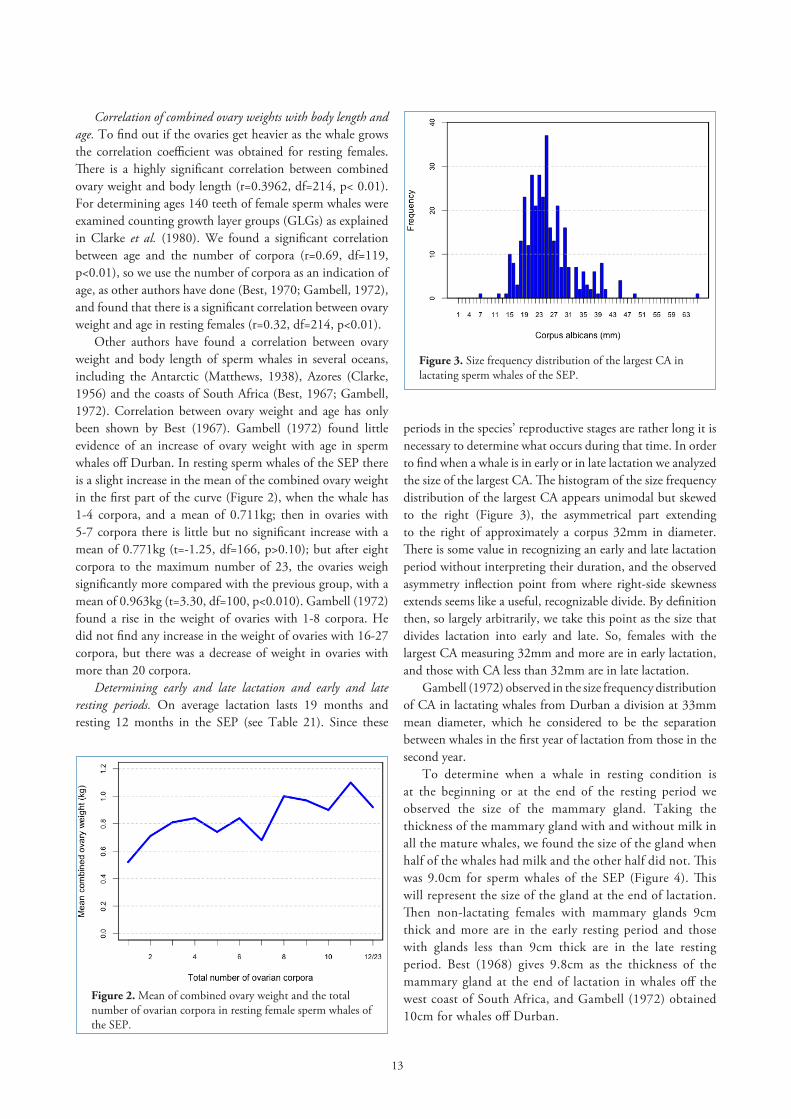
Determining early and late lactation and early and late resting periods. On average lactation lasts 19 months and resting 12 months in the SEP (see Table 21). Since these
periods in the species’ reproductive stages are rather long it is necessary to determine what occurs during that time. In order to find when a whale is in early or in late lactation we analyzed the size of the largest CA. The histogram of the size frequency distribution of the largest CA appears unimodal but skewed to the right (Figure 3), the asymmetrical part extending to the right of approximately a corpus 32mm in diameter. There is some value in recognizing an early and late lactation period without interpreting their duration, and the observed asymmetry inflection point from where right-side skewness extends seems like a useful, recognizable divide. By definition then, so largely arbitrarily, we take this point as the size that divides lactation into early and late. So, females with the largest CA measuring 32mm and more are in early lactation, and those with CA less than 32mm are in late lactation.
Gambell (1972) observed in the size frequency distribution of CA in lactating whales from Durban a division at 33mm mean diameter, which he considered to be the separation between whales in the first year of lactation from those in the second year.
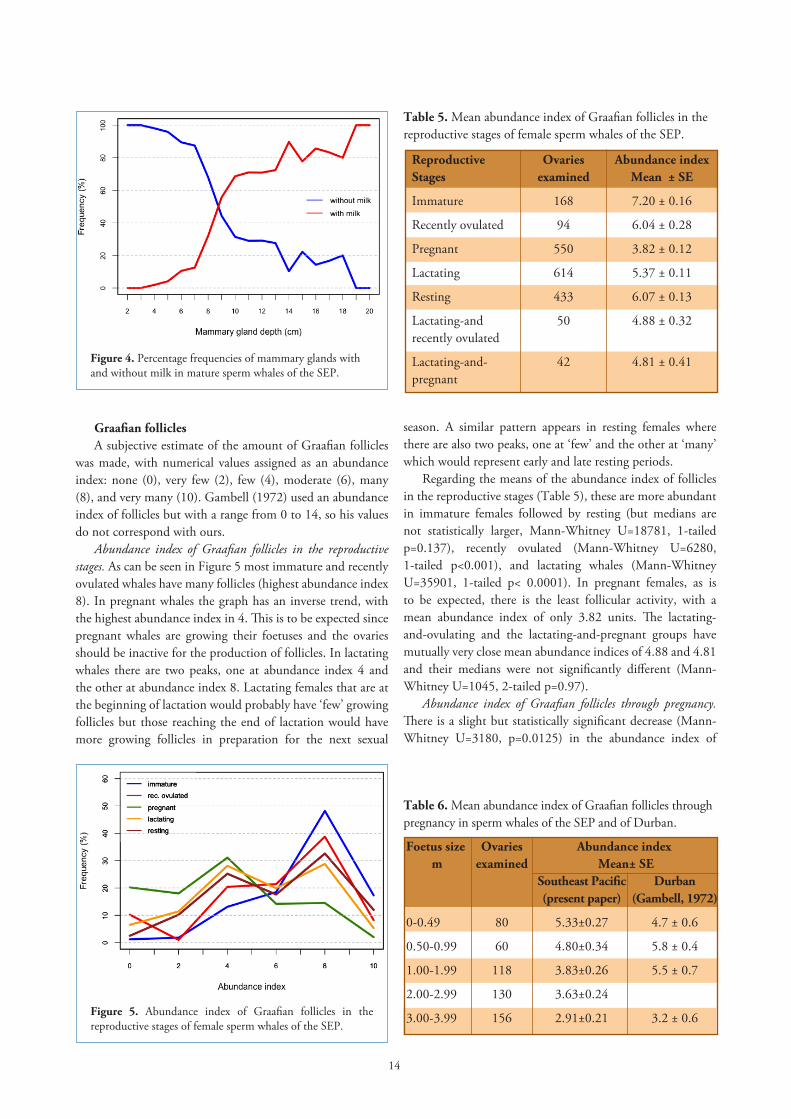
To determine when a whale in resting condition is at the beginning or at the end of the resting period we observed the size of the mammary gland. Taking the thickness of the mammary gland with and without milk in all the mature whales, we found the size of the gland when half of the whales had milk and the other half did not. This was 9.0cm for sperm whales of the SEP (Figure 4). This will represent the size of the gland at the end of lactation. Then non-lactating females with mammary glands 9cm thick and more are in the early resting period and those with glands less than 9cm thick are in the late resting period. Best (1968) gives 9.8cm as the thickness of the mammary gland at the end of lactation in whales off the west coast of South Africa, and Gambell (1972) obtained 10cm for whales off Durban.
Figure 2. Mean of combined ovary weight and the total number of ovarian corpora in resting female sperm whales of the SEP.
Figure 3. Size frequency distribution of the largest CA in lactating sperm whales of the SEP.
14
Graafian folliclesA subjective estimate of the amount of Graafian follicles
was made, with numerical values assigned as an abundance index: none (0), very few (2), few (4), moderate (6), many (8), and very many (10). Gambell (1972) used an abundance index of follicles but with a range from 0 to 14, so his values do not correspond with ours.
Abundance index of Graafian follicles in the reproductive stages. As can be seen in Figure 5 most immature and recently ovulated whales have many follicles (highest abundance index 8). In pregnant whales the graph has an inverse trend, with the highest abundance index in 4. This is to be expected since pregnant whales are growing their foetuses and the ovaries should be inactive for the production of follicles. In lactating whales there are two peaks, one at abundance index 4 and the other at abundance index 8. Lactating females that are at the beginning of lactation would probably have ‘few’ growing follicles but those reaching the end of lactation would have more growing follicles in preparation for the next sexual
season. A similar pattern appears in resting females where there are also two peaks, one at ‘few’ and the other at ‘many’ which would represent early and late resting periods.
Regarding the means of the abundance index of follicles in the reproductive stages (Table 5), these are more abundant in immature females followed by resting (but medians are not statistically larger, Mann-Whitney U=18781, 1-tailed p=0.137), recently ovulated (Mann-Whitney U=6280, 1-tailed p<0.001), and lactating whales (Mann-Whitney U=35901, 1-tailed p< 0.0001). In pregnant females, as is to be expected, there is the least follicular activity, with a mean abundance index of only 3.82 units. The lactating-and-ovulating and the lactating-and-pregnant groups have mutually very close mean abundance indices of 4.88 and 4.81 and their medians were not significantly different (Mann-Whitney U=1045, 2-tailed p=0.97).
Abundance index of Graafian follicles through pregnancy. There is a slight but statistically significant decrease (Mann-Whitney U=3180, p=0.0125) in the abundance index of
Figure 4. Percentage frequencies of mammary glands with and without milk in mature sperm whales of the SEP.
Figure 5. Abundance index of Graafian follicles in the reproductive stages of female sperm whales of the SEP.
Table 6. Mean abundance index of Graafian follicles through pregnancy in sperm whales of the SEP and of Durban.
Foetus size Ovaries Abundance index m examined Mean± SE Southeast Pacific Durban (present paper) (Gambell, 1972)
0-0.49 80 5.33±0.27 4.7 ± 0.6
0.50-0.99 60 4.80±0.34 5.8 ± 0.4
1.00-1.99 118 3.83±0.26 5.5 ± 0.7
2.00-2.99 130 3.63±0.24
3.00-3.99 156 2.91±0.21 3.2 ± 0.6
Table 5. Mean abundance index of Graafian follicles in the reproductive stages of female sperm whales of the SEP.
Reproductive Ovaries Abundance indexStages examined Mean ± SE
Immature 168 7.20 ± 0.16
Recently ovulated 94 6.04 ± 0.28
Pregnant 550 3.82 ± 0.12
Lactating 614 5.37 ± 0.11
Resting 433 6.07 ± 0.13
Lactating-and 50 4.88 ± 0.32recently ovulated
Lactating-and- 42 4.81 ± 0.41pregnant
15
follicles from the recently ovulated whales, 6.04±0.28 (SE) units to 5.33±0.27 units in early pregnancy in females with foetuses up to 49cm long (Tables 5 and 6) in whales of the SEP. The decrease continues through pregnancy until the foetus is 3m long and over, when the abundance index is at its lowest value, 2.91±0.21 units.
This reduction in the abundance index of follicles through pregnancy (r=0.98, F(1,4)=83.3, p=0.001) shows that there is very little follicular activity during pregnancy.
Gambell (1972) found the same pattern in sperm whales off Durban, although our values for abundance indices do not correspond to his. He found a slight fall of abundance index from ovulating whales, 5.4±0.6 units, and a marked fall in late pregnancy in females with foetuses 3m and over, where the abundance index was 3.2±0.6 units. He suggests that the low follicular activity leads to the lack of a post partum ovulation, and agrees with the results from Best (1968) for sperm whales off the west coast of South Africa.
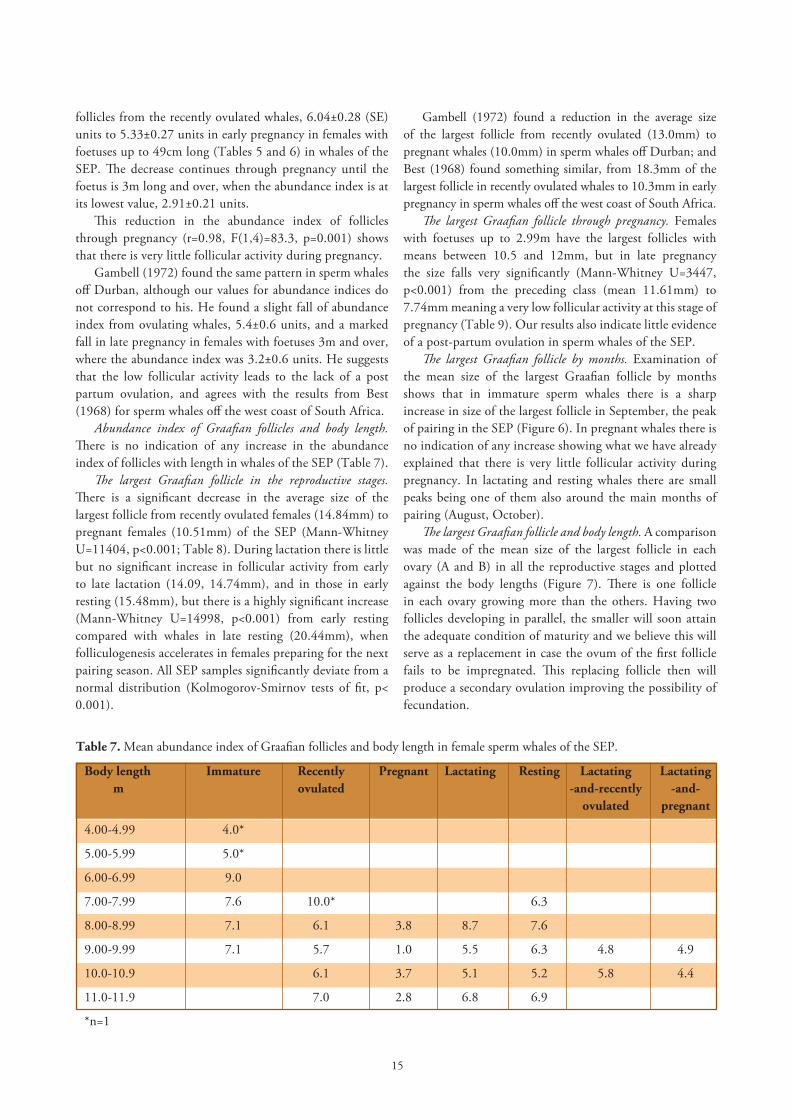
Abundance index of Graafian follicles and body length. There is no indication of any increase in the abundance index of follicles with length in whales of the SEP (Table 7).
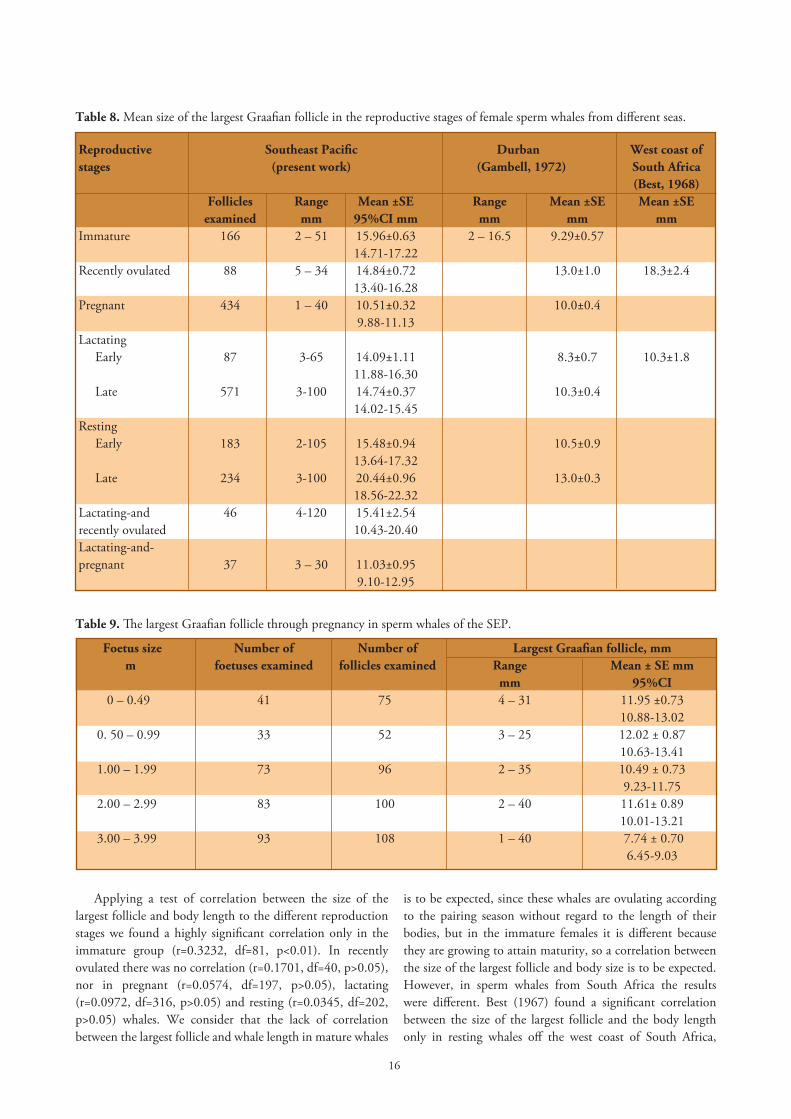
The largest Graafian follicle in the reproductive stages. There is a significant decrease in the average size of the largest follicle from recently ovulated females (14.84mm) to pregnant females (10.51mm) of the SEP (Mann-Whitney U=11404, p<0.001; Table 8). During lactation there is little but no significant increase in follicular activity from early to late lactation (14.09, 14.74mm), and in those in early resting (15.48mm), but there is a highly significant increase (Mann-Whitney U=14998, p<0.001) from early resting compared with whales in late resting (20.44mm), when folliculogenesis accelerates in females preparing for the next pairing season. All SEP samples significantly deviate from a normal distribution (Kolmogorov-Smirnov tests of fit, p< 0.001).
Gambell (1972) found a reduction in the average size of the largest follicle from recently ovulated (13.0mm) to pregnant whales (10.0mm) in sperm whales off Durban; and Best (1968) found something similar, from 18.3mm of the largest follicle in recently ovulated whales to 10.3mm in early pregnancy in sperm whales off the west coast of South Africa.
The largest Graafian follicle through pregnancy. Females with foetuses up to 2.99m have the largest follicles with means between 10.5 and 12mm, but in late pregnancy the size falls very significantly (Mann-Whitney U=3447, p<0.001) from the preceding class (mean 11.61mm) to 7.74mm meaning a very low follicular activity at this stage of pregnancy (Table 9). Our results also indicate little evidence of a post-partum ovulation in sperm whales of the SEP.
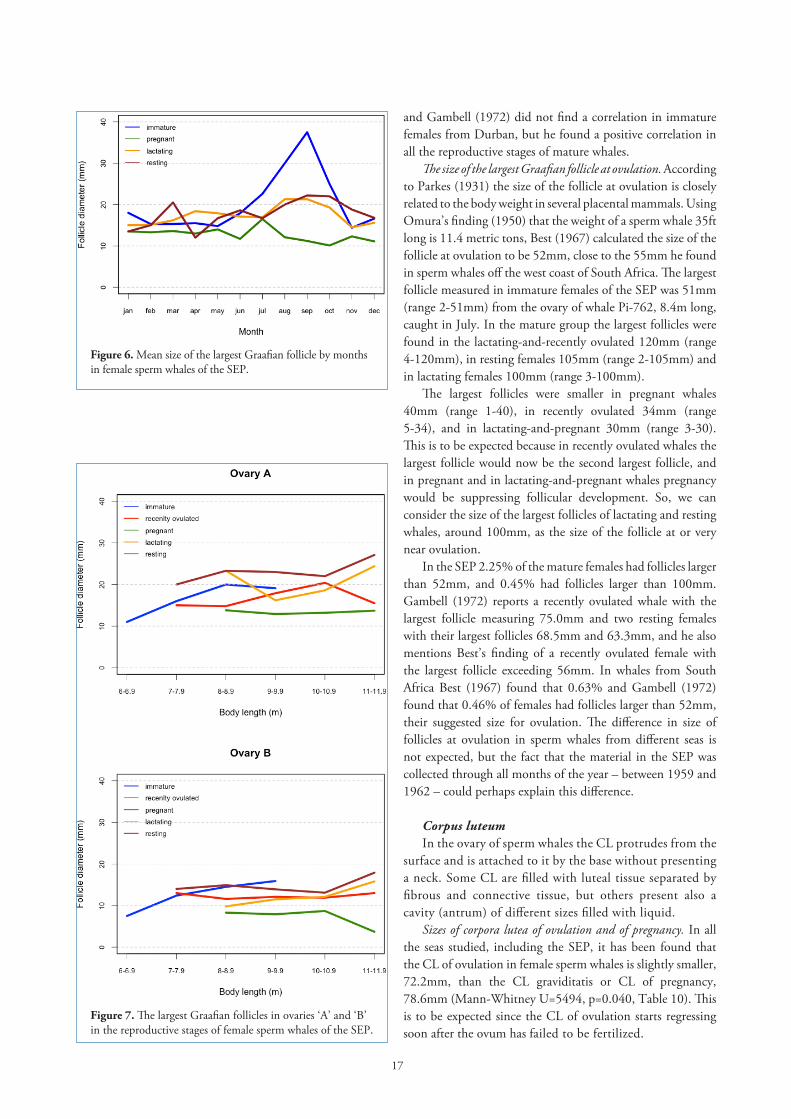
The largest Graafian follicle by months. Examination of the mean size of the largest Graafian follicle by months shows that in immature sperm whales there is a sharp increase in size of the largest follicle in September, the peak of pairing in the SEP (Figure 6). In pregnant whales there is no indication of any increase showing what we have already explained that there is very little follicular activity during pregnancy. In lactating and resting whales there are small peaks being one of them also around the main months of pairing (August, October).
The largest Graafian follicle and body length. A comparison was made of the mean size of the largest follicle in each ovary (A and B) in all the reproductive stages and plotted against the body lengths (Figure 7). There is one follicle in each ovary growing more than the others. Having two follicles developing in parallel, the smaller will soon attain the adequate condition of maturity and we believe this will serve as a replacement in case the ovum of the first follicle fails to be impregnated. This replacing follicle then will produce a secondary ovulation improving the possibility of fecundation.
Table 7. Mean abundance index of Graafian follicles and body length in female sperm whales of the SEP.
Body length Immature Recently Pregnant Lactating Resting Lactating Lactating m ovulated -and-recently -and- ovulated pregnant
4.00-4.99 4.0*
5.00-5.99 5.0*
6.00-6.99 9.0
7.00-7.99 7.6 10.0* 6.3
8.00-8.99 7.1 6.1 3.8 8.7 7.6
9.00-9.99 7.1 5.7 1.0 5.5 6.3 4.8 4.9
10.0-10.9 6.1 3.7 5.1 5.2 5.8 4.4
11.0-11.9 7.0 2.8 6.8 6.9
*n=1
16
Table 8. Mean size of the largest Graafian follicle in the reproductive stages of female sperm whales from different seas.
Reproductive Southeast Pacific Durban West coast ofstages (present work) (Gambell, 1972) South Africa (Best, 1968) Follicles Range Mean ±SE Range Mean ±SE Mean ±SE examined mm 95%CI mm mm mm mmImmature 166 2 – 51 15.96±0.63 2 – 16.5 9.29±0.57 14.71-17.22Recently ovulated 88 5 – 34 14.84±0.72 13.0±1.0 18.3±2.4 13.40-16.28 Pregnant 434 1 – 40 10.51±0.32 10.0±0.4 9.88-11.13 Lactating Early 87 3-65 14.09±1.11 8.3±0.7 10.3±1.8 11.88-16.30 Late 571 3-100 14.74±0.37 10.3±0.4 14.02-15.45 Resting Early 183 2-105 15.48±0.94 10.5±0.9 13.64-17.32 Late 234 3-100 20.44±0.96 13.0±0.3 18.56-22.32 Lactating-and 46 4-120 15.41±2.54recently ovulated 10.43-20.40 Lactating-and-pregnant 37 3 – 30 11.03±0.95 9.10-12.95
Table 9. The largest Graafian follicle through pregnancy in sperm whales of the SEP.
Foetus size Number of Number of Largest Graafian follicle, mm m foetuses examined follicles examined Range Mean ± SE mm mm 95%CI 0 – 0.49 41 75 4 – 31 11.95 ±0.73 10.88-13.02 0. 50 – 0.99 33 52 3 – 25 12.02 ± 0.87 10.63-13.41 1.00 – 1.99 73 96 2 – 35 10.49 ± 0.73 9.23-11.75 2.00 – 2.99 83 100 2 – 40 11.61± 0.89 10.01-13.21 3.00 – 3.99 93 108 1 – 40 7.74 ± 0.70 6.45-9.03
Applying a test of correlation between the size of the largest follicle and body length to the different reproduction stages we found a highly significant correlation only in the immature group (r=0.3232, df=81, p<0.01). In recently ovulated there was no correlation (r=0.1701, df=40, p>0.05), nor in pregnant (r=0.0574, df=197, p>0.05), lactating (r=0.0972, df=316, p>0.05) and resting (r=0.0345, df=202, p>0.05) whales. We consider that the lack of correlation between the largest follicle and whale length in mature whales
is to be expected, since these whales are ovulating according to the pairing season without regard to the length of their bodies, but in the immature females it is different because they are growing to attain maturity, so a correlation between the size of the largest follicle and body size is to be expected. However, in sperm whales from South Africa the results were different. Best (1967) found a significant correlation between the size of the largest follicle and the body length only in resting whales off the west coast of South Africa,
17
and Gambell (1972) did not find a correlation in immature females from Durban, but he found a positive correlation in all the reproductive stages of mature whales.
The size of the largest Graafian follicle at ovulation. According to Parkes (1931) the size of the follicle at ovulation is closely related to the body weight in several placental mammals. Using Omura’s finding (1950) that the weight of a sperm whale 35ft long is 11.4 metric tons, Best (1967) calculated the size of the follicle at ovulation to be 52mm, close to the 55mm he found in sperm whales off the west coast of South Africa. The largest follicle measured in immature females of the SEP was 51mm (range 2-51mm) from the ovary of whale Pi-762, 8.4m long, caught in July. In the mature group the largest follicles were found in the lactating-and-recently ovulated 120mm (range 4-120mm), in resting females 105mm (range 2-105mm) and in lactating females 100mm (range 3-100mm).
The largest follicles were smaller in pregnant whales 40mm (range 1-40), in recently ovulated 34mm (range 5-34), and in lactating-and-pregnant 30mm (range 3-30). This is to be expected because in recently ovulated whales the largest follicle would now be the second largest follicle, and in pregnant and in lactating-and-pregnant whales pregnancy would be suppressing follicular development. So, we can consider the size of the largest follicles of lactating and resting whales, around 100mm, as the size of the follicle at or very near ovulation.
In the SEP 2.25% of the mature females had follicles larger than 52mm, and 0.45% had follicles larger than 100mm. Gambell (1972) reports a recently ovulated whale with the largest follicle measuring 75.0mm and two resting females with their largest follicles 68.5mm and 63.3mm, and he also mentions Best’s finding of a recently ovulated female with the largest follicle exceeding 56mm. In whales from South Africa Best (1967) found that 0.63% and Gambell (1972) found that 0.46% of females had follicles larger than 52mm, their suggested size for ovulation. The difference in size of follicles at ovulation in sperm whales from different seas is not expected, but the fact that the material in the SEP was collected through all months of the year – between 1959 and 1962 – could perhaps explain this difference.
Corpus luteumIn the ovary of sperm whales the CL protrudes from the
surface and is attached to it by the base without presenting a neck. Some CL are filled with luteal tissue separated by fibrous and connective tissue, but others present also a cavity (antrum) of different sizes filled with liquid.
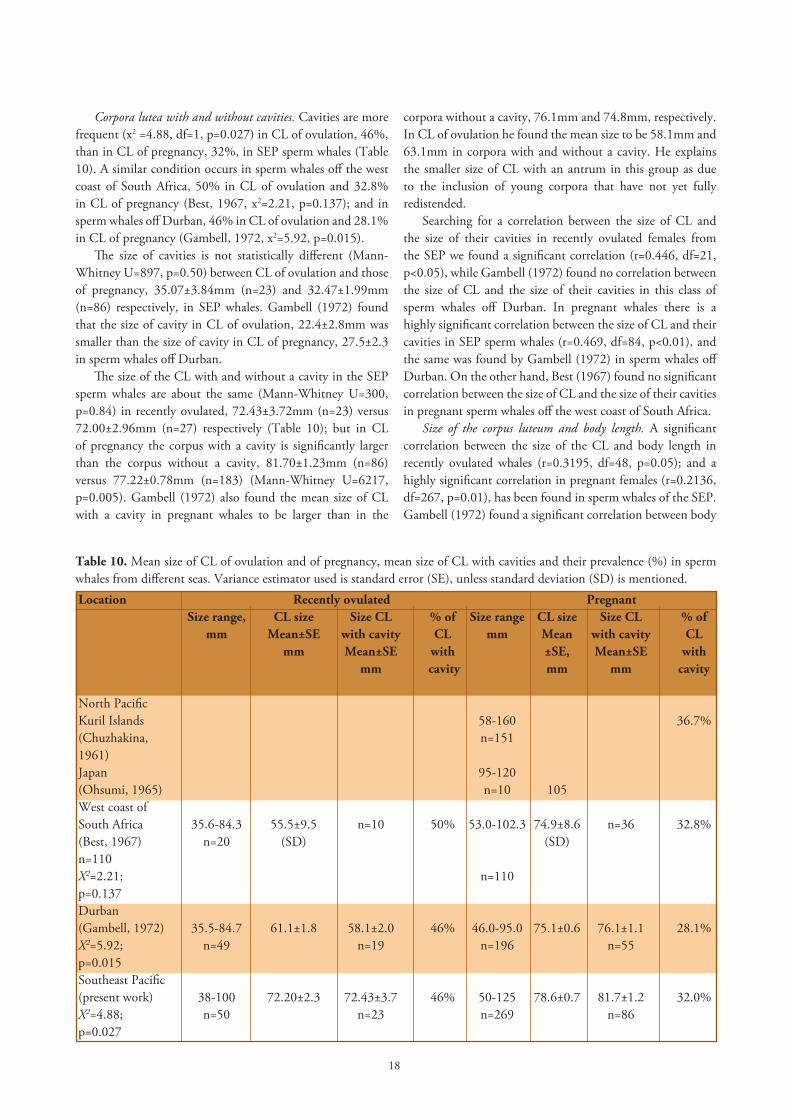
Sizes of corpora lutea of ovulation and of pregnancy. In all the seas studied, including the SEP, it has been found that the CL of ovulation in female sperm whales is slightly smaller, 72.2mm, than the CL graviditatis or CL of pregnancy, 78.6mm (Mann-Whitney U=5494, p=0.040, Table 10). This is to be expected since the CL of ovulation starts regressing soon after the ovum has failed to be fertilized.
Figure 6. Mean size of the largest Graafian follicle by months in female sperm whales of the SEP.
Figure 7. The largest Graafian follicles in ovaries ‘A’ and ‘B’ in the reproductive stages of female sperm whales of the SEP.
18
Corpora lutea with and without cavities. Cavities are more frequent (x2 =4.88, df=1, p=0.027) in CL of ovulation, 46%, than in CL of pregnancy, 32%, in SEP sperm whales (Table 10). A similar condition occurs in sperm whales off the west coast of South Africa, 50% in CL of ovulation and 32.8% in CL of pregnancy (Best, 1967, x2=2.21, p=0.137); and in sperm whales off Durban, 46% in CL of ovulation and 28.1% in CL of pregnancy (Gambell, 1972, x2=5.92, p=0.015).
The size of cavities is not statistically different (Mann-Whitney U=897, p=0.50) between CL of ovulation and those of pregnancy, 35.07±3.84mm (n=23) and 32.47±1.99mm (n=86) respectively, in SEP whales. Gambell (1972) found that the size of cavity in CL of ovulation, 22.4±2.8mm was smaller than the size of cavity in CL of pregnancy, 27.5±2.3 in sperm whales off Durban.
The size of the CL with and without a cavity in the SEP sperm whales are about the same (Mann-Whitney U=300, p=0.84) in recently ovulated, 72.43±3.72mm (n=23) versus 72.00±2.96mm (n=27) respectively (Table 10); but in CL of pregnancy the corpus with a cavity is significantly larger than the corpus without a cavity, 81.70±1.23mm (n=86) versus 77.22±0.78mm (n=183) (Mann-Whitney U=6217, p=0.005). Gambell (1972) also found the mean size of CL with a cavity in pregnant whales to be larger than in the
Table 10. Mean size of CL of ovulation and of pregnancy, mean size of CL with cavities and their prevalence (%) in sperm whales from different seas. Variance estimator used is standard error (SE), unless standard deviation (SD) is mentioned.Location Recently ovulated Pregnant Size range, CL size Size CL % of Size range CL size Size CL % of mm Mean±SE with cavity CL mm Mean with cavity CL mm Mean±SE with ±SE, Mean±SE with mm cavity mm mm cavity North Pacific Kuril Islands 58-160 36.7%(Chuzhakina, n=1511961)Japan 95-120(Ohsumi, 1965) n=10 105 West coast ofSouth Africa 35.6-84.3 55.5±9.5 n=10 50% 53.0-102.3 74.9±8.6 n=36 32.8%(Best, 1967) n=20 (SD) (SD) n=110X2=2.21; n=110p=0.137Durban(Gambell, 1972) 35.5-84.7 61.1±1.8 58.1±2.0 46% 46.0-95.0 75.1±0.6 76.1±1.1 28.1%X2=5.92; n=49 n=19 n=196 n=55 p=0.015Southeast Pacific(present work) 38-100 72.20±2.3 72.43±3.7 46% 50-125 78.6±0.7 81.7±1.2 32.0%X2=4.88; n=50 n=23 n=269 n=86p=0.027
corpora without a cavity, 76.1mm and 74.8mm, respectively. In CL of ovulation he found the mean size to be 58.1mm and 63.1mm in corpora with and without a cavity. He explains the smaller size of CL with an antrum in this group as due to the inclusion of young corpora that have not yet fully redistended.
Searching for a correlation between the size of CL and the size of their cavities in recently ovulated females from the SEP we found a significant correlation (r=0.446, df=21, p<0.05), while Gambell (1972) found no correlation between the size of CL and the size of their cavities in this class of sperm whales off Durban. In pregnant whales there is a highly significant correlation between the size of CL and their cavities in SEP sperm whales (r=0.469, df=84, p<0.01), and the same was found by Gambell (1972) in sperm whales off Durban. On the other hand, Best (1967) found no significant correlation between the size of CL and the size of their cavities in pregnant sperm whales off the west coast of South Africa.
Size of the corpus luteum and body length. A significant correlation between the size of the CL and body length in recently ovulated whales (r=0.3195, df=48, p=0.05); and a highly significant correlation in pregnant females (r=0.2136, df=267, p=0.01), has been found in sperm whales of the SEP. Gambell (1972) found a significant correlation between body
19
length and size of the CL of pregnancy (r=0.2745, p<0.01), but found no correlation between body length and size of the CL of ovulation in female sperm whales off Durban.
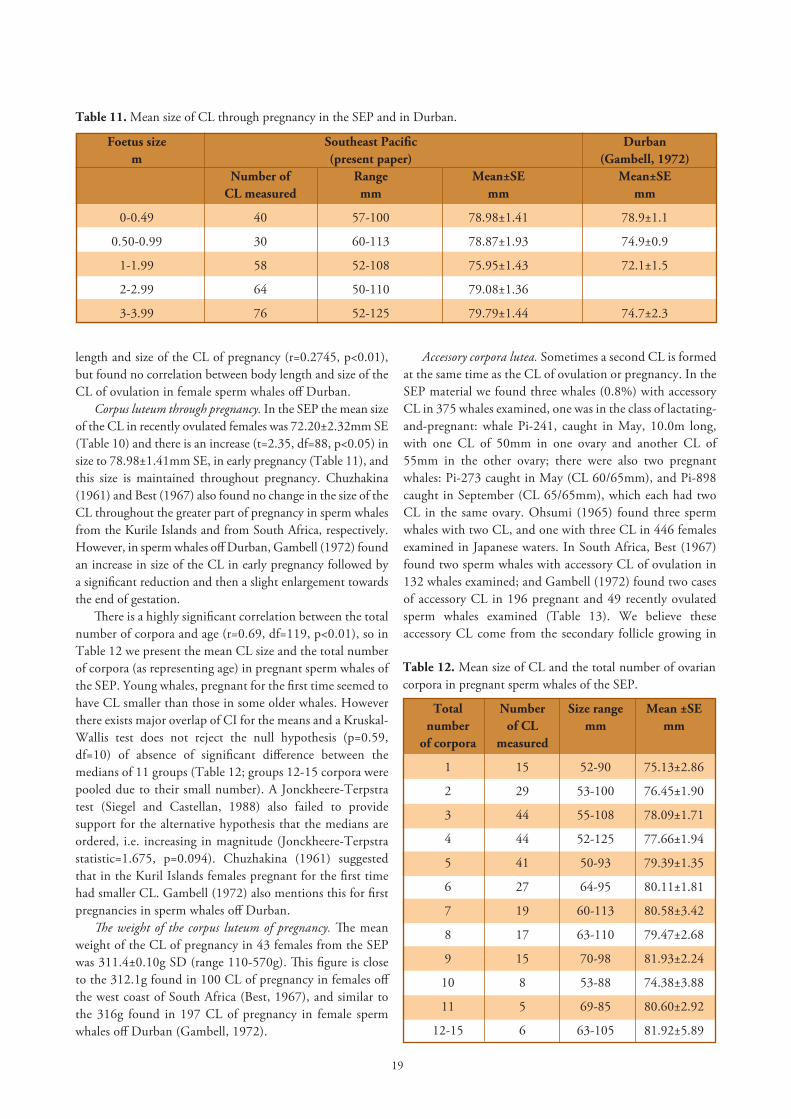
Corpus luteum through pregnancy. In the SEP the mean size of the CL in recently ovulated females was 72.20±2.32mm SE (Table 10) and there is an increase (t=2.35, df=88, p<0.05) in size to 78.98±1.41mm SE, in early pregnancy (Table 11), and this size is maintained throughout pregnancy. Chuzhakina (1961) and Best (1967) also found no change in the size of the CL throughout the greater part of pregnancy in sperm whales from the Kurile Islands and from South Africa, respectively. However, in sperm whales off Durban, Gambell (1972) found an increase in size of the CL in early pregnancy followed by a significant reduction and then a slight enlargement towards the end of gestation.
There is a highly significant correlation between the total number of corpora and age (r=0.69, df=119, p<0.01), so in Table 12 we present the mean CL size and the total number of corpora (as representing age) in pregnant sperm whales of the SEP. Young whales, pregnant for the first time seemed to have CL smaller than those in some older whales. However there exists major overlap of CI for the means and a Kruskal-Wallis test does not reject the null hypothesis (p=0.59, df=10) of absence of significant difference between the medians of 11 groups (Table 12; groups 12-15 corpora were pooled due to their small number). A Jonckheere-Terpstra test (Siegel and Castellan, 1988) also failed to provide support for the alternative hypothesis that the medians are ordered, i.e. increasing in magnitude (Jonckheere-Terpstra statistic=1.675, p=0.094). Chuzhakina (1961) suggested that in the Kuril Islands females pregnant for the first time had smaller CL. Gambell (1972) also mentions this for first pregnancies in sperm whales off Durban.
The weight of the corpus luteum of pregnancy. The mean weight of the CL of pregnancy in 43 females from the SEP was 311.4±0.10g SD (range 110-570g). This figure is close to the 312.1g found in 100 CL of pregnancy in females off the west coast of South Africa (Best, 1967), and similar to the 316g found in 197 CL of pregnancy in female sperm whales off Durban (Gambell, 1972).
Table 11. Mean size of CL through pregnancy in the SEP and in Durban.
Foetus size Southeast Pacific Durban m (present paper) (Gambell, 1972) Number of Range Mean±SE Mean±SE CL measured mm mm mm
0-0.49 40 57-100 78.98±1.41 78.9±1.1
0.50-0.99 30 60-113 78.87±1.93 74.9±0.9
1-1.99 58 52-108 75.95±1.43 72.1±1.5
2-2.99 64 50-110 79.08±1.36
3-3.99 76 52-125 79.79±1.44 74.7±2.3
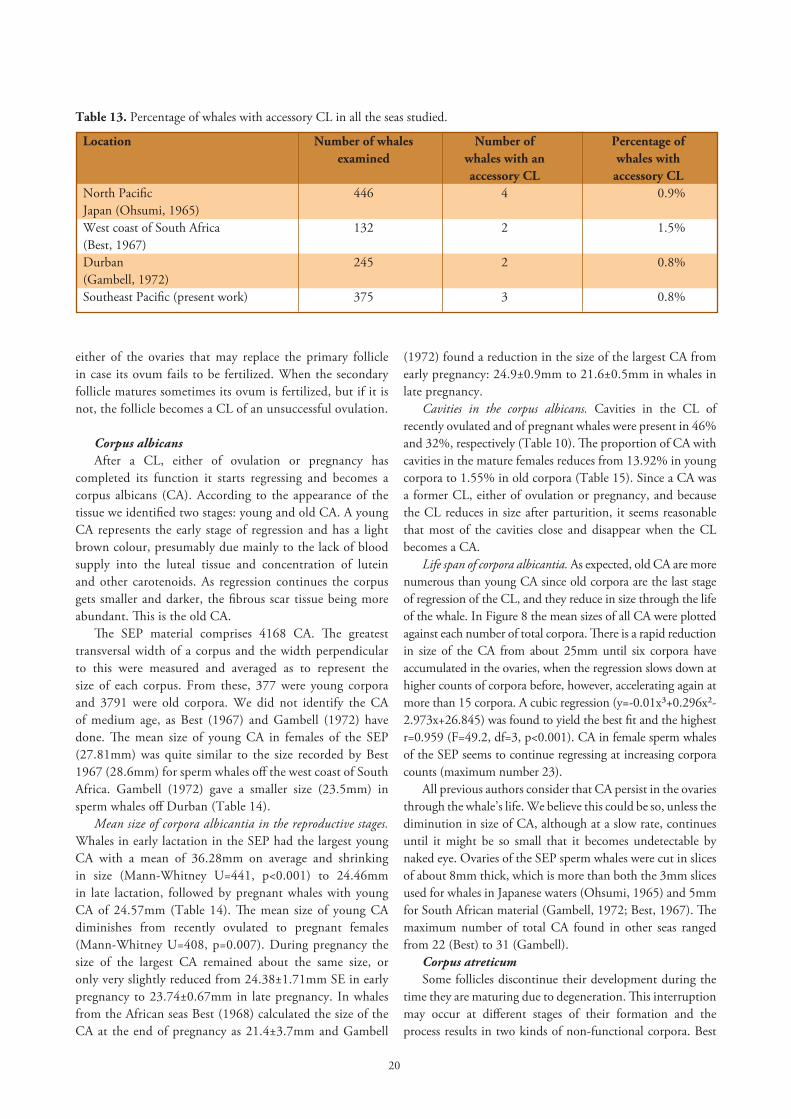
Accessory corpora lutea. Sometimes a second CL is formed at the same time as the CL of ovulation or pregnancy. In the SEP material we found three whales (0.8%) with accessory CL in 375 whales examined, one was in the class of lactating-and-pregnant: whale Pi-241, caught in May, 10.0m long, with one CL of 50mm in one ovary and another CL of 55mm in the other ovary; there were also two pregnant whales: Pi-273 caught in May (CL 60/65mm), and Pi-898 caught in September (CL 65/65mm), which each had two CL in the same ovary. Ohsumi (1965) found three sperm whales with two CL, and one with three CL in 446 females examined in Japanese waters. In South Africa, Best (1967) found two sperm whales with accessory CL of ovulation in 132 whales examined; and Gambell (1972) found two cases of accessory CL in 196 pregnant and 49 recently ovulated sperm whales examined (Table 13). We believe these accessory CL come from the secondary follicle growing in
Table 12. Mean size of CL and the total number of ovarian corpora in pregnant sperm whales of the SEP.
Total Number Size range Mean ±SE number of CL mm mm of corpora measured
1 15 52-90 75.13±2.86
2 29 53-100 76.45±1.90
3 44 55-108 78.09±1.71
4 44 52-125 77.66±1.94
5 41 50-93 79.39±1.35
6 27 64-95 80.11±1.81
7 19 60-113 80.58±3.42
8 17 63-110 79.47±2.68
9 15 70-98 81.93±2.24
10 8 53-88 74.38±3.88
11 5 69-85 80.60±2.92
12-15 6 63-105 81.92±5.89
20
either of the ovaries that may replace the primary follicle in case its ovum fails to be fertilized. When the secondary follicle matures sometimes its ovum is fertilized, but if it is not, the follicle becomes a CL of an unsuccessful ovulation.
Corpus albicansAfter a CL, either of ovulation or pregnancy has
completed its function it starts regressing and becomes a corpus albicans (CA). According to the appearance of the tissue we identified two stages: young and old CA. A young CA represents the early stage of regression and has a light brown colour, presumably due mainly to the lack of blood supply into the luteal tissue and concentration of lutein and other carotenoids. As regression continues the corpus gets smaller and darker, the fibrous scar tissue being more abundant. This is the old CA.
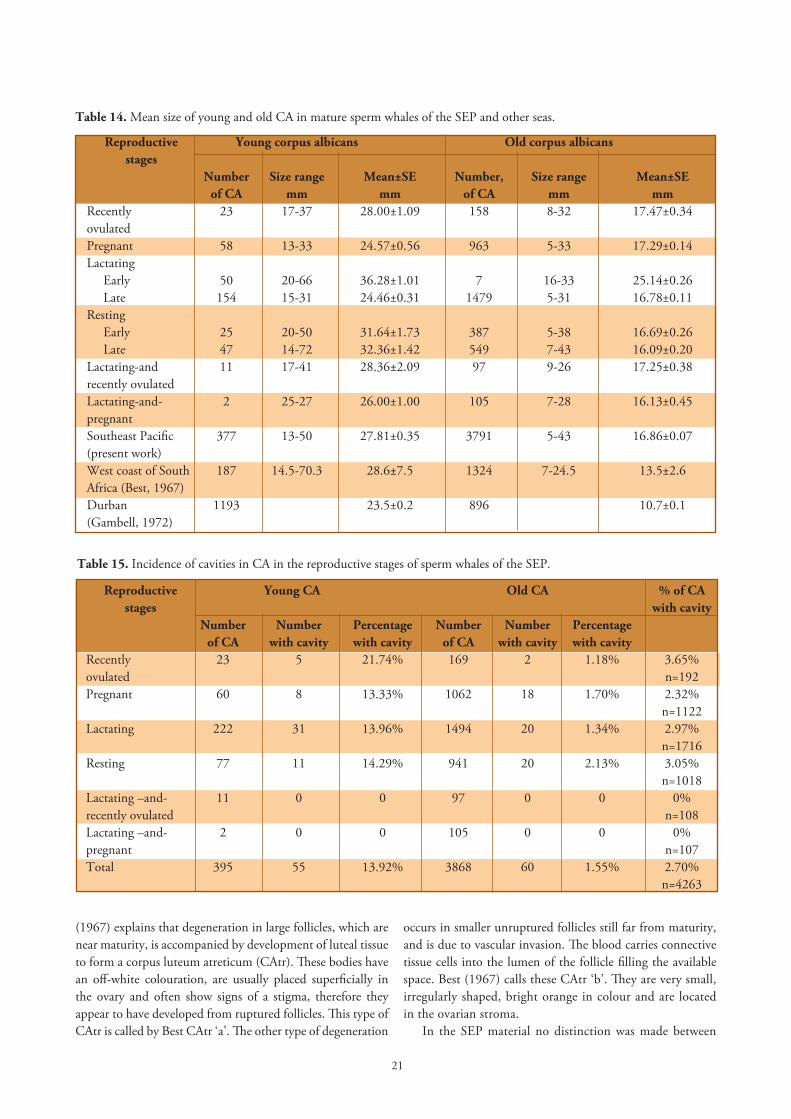
The SEP material comprises 4168 CA. The greatest transversal width of a corpus and the width perpendicular to this were measured and averaged as to represent the size of each corpus. From these, 377 were young corpora and 3791 were old corpora. We did not identify the CA of medium age, as Best (1967) and Gambell (1972) have done. The mean size of young CA in females of the SEP (27.81mm) was quite similar to the size recorded by Best 1967 (28.6mm) for sperm whales off the west coast of South Africa. Gambell (1972) gave a smaller size (23.5mm) in sperm whales off Durban (Table 14).
Mean size of corpora albicantia in the reproductive stages. Whales in early lactation in the SEP had the largest young CA with a mean of 36.28mm on average and shrinking in size (Mann-Whitney U=441, p<0.001) to 24.46mm in late lactation, followed by pregnant whales with young CA of 24.57mm (Table 14). The mean size of young CA diminishes from recently ovulated to pregnant females (Mann-Whitney U=408, p=0.007). During pregnancy the size of the largest CA remained about the same size, or only very slightly reduced from 24.38±1.71mm SE in early pregnancy to 23.74±0.67mm in late pregnancy. In whales from the African seas Best (1968) calculated the size of the CA at the end of pregnancy as 21.4±3.7mm and Gambell
Table 13. Percentage of whales with accessory CL in all the seas studied.
Location Number of whales Number of Percentage of examined whales with an whales with accessory CL accessory CL North Pacific 446 4 0.9%Japan (Ohsumi, 1965)West coast of South Africa 132 2 1.5%(Best, 1967)Durban 245 2 0.8%(Gambell, 1972)Southeast Pacific (present work) 375 3 0.8%
(1972) found a reduction in the size of the largest CA from early pregnancy: 24.9±0.9mm to 21.6±0.5mm in whales in late pregnancy.
Cavities in the corpus albicans. Cavities in the CL of recently ovulated and of pregnant whales were present in 46% and 32%, respectively (Table 10). The proportion of CA with cavities in the mature females reduces from 13.92% in young corpora to 1.55% in old corpora (Table 15). Since a CA was a former CL, either of ovulation or pregnancy, and because the CL reduces in size after parturition, it seems reasonable that most of the cavities close and disappear when the CL becomes a CA.
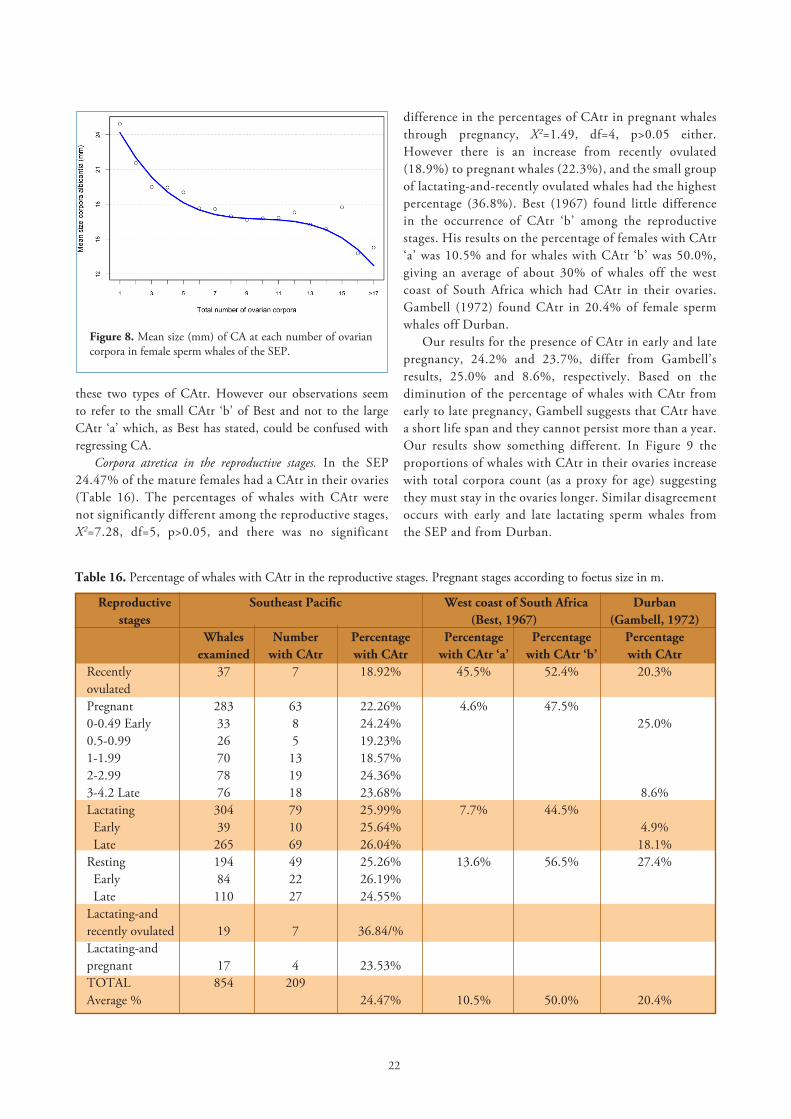
Life span of corpora albicantia. As expected, old CA are more numerous than young CA since old corpora are the last stage of regression of the CL, and they reduce in size through the life of the whale. In Figure 8 the mean sizes of all CA were plotted against each number of total corpora. There is a rapid reduction in size of the CA from about 25mm until six corpora have accumulated in the ovaries, when the regression slows down at higher counts of corpora before, however, accelerating again at more than 15 corpora. A cubic regression (y=-0.01x³+0.296x²-2.973x+26.845) was found to yield the best fit and the highest r=0.959 (F=49.2, df=3, p<0.001). CA in female sperm whales of the SEP seems to continue regressing at increasing corpora counts (maximum number 23).
All previous authors consider that CA persist in the ovaries through the whale’s life. We believe this could be so, unless the diminution in size of CA, although at a slow rate, continues until it might be so small that it becomes undetectable by naked eye. Ovaries of the SEP sperm whales were cut in slices of about 8mm thick, which is more than both the 3mm slices used for whales in Japanese waters (Ohsumi, 1965) and 5mm for South African material (Gambell, 1972; Best, 1967). The maximum number of total CA found in other seas ranged from 22 (Best) to 31 (Gambell).
Corpus atreticumSome follicles discontinue their development during the
time they are maturing due to degeneration. This interruption may occur at different stages of their formation and the process results in two kinds of non-functional corpora. Best
21
Table 14. Mean size of young and old CA in mature sperm whales of the SEP and other seas.
Reproductive Young corpus albicans Old corpus albicans stages Number Size range Mean±SE Number, Size range Mean±SE of CA mm mm of CA mm mm Recently 23 17-37 28.00±1.09 158 8-32 17.47±0.34ovulatedPregnant 58 13-33 24.57±0.56 963 5-33 17.29±0.14Lactating Early 50 20-66 36.28±1.01 7 16-33 25.14±0.26 Late 154 15-31 24.46±0.31 1479 5-31 16.78±0.11Resting Early 25 20-50 31.64±1.73 387 5-38 16.69±0.26 Late 47 14-72 32.36±1.42 549 7-43 16.09±0.20 Lactating-and 11 17-41 28.36±2.09 97 9-26 17.25±0.38recently ovulatedLactating-and- 2 25-27 26.00±1.00 105 7-28 16.13±0.45pregnantSoutheast Pacific 377 13-50 27.81±0.35 3791 5-43 16.86±0.07(present work)West coast of South 187 14.5-70.3 28.6±7.5 1324 7-24.5 13.5±2.6Africa (Best, 1967) Durban 1193 23.5±0.2 896 10.7±0.1(Gambell, 1972)
Table 15. Incidence of cavities in CA in the reproductive stages of sperm whales of the SEP.
Reproductive Young CA Old CA % of CA stages with cavity Number Number Percentage Number Number Percentage of CA with cavity with cavity of CA with cavity with cavity Recently 23 5 21.74% 169 2 1.18% 3.65%ovulated n=192Pregnant 60 8 13.33% 1062 18 1.70% 2.32% n=1122Lactating 222 31 13.96% 1494 20 1.34% 2.97% n=1716Resting 77 11 14.29% 941 20 2.13% 3.05% n=1018Lactating –and- 11 0 0 97 0 0 0%recently ovulated n=108Lactating –and- 2 0 0 105 0 0 0%pregnant n=107Total 395 55 13.92% 3868 60 1.55% 2.70% n=4263
(1967) explains that degeneration in large follicles, which are near maturity, is accompanied by development of luteal tissue to form a corpus luteum atreticum (CAtr). These bodies have an off-white colouration, are usually placed superficially in the ovary and often show signs of a stigma, therefore they appear to have developed from ruptured follicles. This type of CAtr is called by Best CAtr ‘a’. The other type of degeneration
occurs in smaller unruptured follicles still far from maturity, and is due to vascular invasion. The blood carries connective tissue cells into the lumen of the follicle filling the available space. Best (1967) calls these CAtr ‘b’. They are very small, irregularly shaped, bright orange in colour and are located in the ovarian stroma.
In the SEP material no distinction was made between
22
Figure 8. Mean size (mm) of CA at each number of ovarian corpora in female sperm whales of the SEP.
these two types of CAtr. However our observations seem to refer to the small CAtr ‘b’ of Best and not to the large CAtr ‘a’ which, as Best has stated, could be confused with regressing CA.
Corpora atretica in the reproductive stages. In the SEP 24.47% of the mature females had a CAtr in their ovaries (Table 16). The percentages of whales with CAtr were not significantly different among the reproductive stages, X2=7.28, df=5, p>0.05, and there was no significant
Table 16. Percentage of whales with CAtr in the reproductive stages. Pregnant stages according to foetus size in m.
Reproductive Southeast Pacific West coast of South Africa Durban stages (Best, 1967) (Gambell, 1972) Whales Number Percentage Percentage Percentage Percentage examined with CAtr with CAtr with CAtr ‘a’ with CAtr ‘b’ with CAtr Recently 37 7 18.92% 45.5% 52.4% 20.3%ovulated Pregnant 283 63 22.26% 4.6% 47.5% 0-0.49 Early 33 8 24.24% 25.0%0.5-0.99 26 5 19.23% 1-1.99 70 13 18.57%2-2.99 78 19 24.36%3-4.2 Late 76 18 23.68% 8.6%Lactating 304 79 25.99% 7.7% 44.5% Early 39 10 25.64% 4.9% Late 265 69 26.04% 18.1%Resting 194 49 25.26% 13.6% 56.5% 27.4% Early 84 22 26.19% Late 110 27 24.55% Lactating-andrecently ovulated 19 7 36.84/% Lactating-andpregnant 17 4 23.53% TOTAL 854 209 Average % 24.47% 10.5% 50.0% 20.4%
difference in the percentages of CAtr in pregnant whales through pregnancy, X2=1.49, df=4, p>0.05 either. However there is an increase from recently ovulated (18.9%) to pregnant whales (22.3%), and the small group of lactating-and-recently ovulated whales had the highest percentage (36.8%). Best (1967) found little difference in the occurrence of CAtr ‘b’ among the reproductive stages. His results on the percentage of females with CAtr ‘a’ was 10.5% and for whales with CAtr ‘b’ was 50.0%, giving an average of about 30% of whales off the west coast of South Africa which had CAtr in their ovaries. Gambell (1972) found CAtr in 20.4% of female sperm whales off Durban.
Our results for the presence of CAtr in early and late pregnancy, 24.2% and 23.7%, differ from Gambell’s results, 25.0% and 8.6%, respectively. Based on the diminution of the percentage of whales with CAtr from early to late pregnancy, Gambell suggests that CAtr have a short life span and they cannot persist more than a year. Our results show something different. In Figure 9 the proportions of whales with CAtr in their ovaries increase with total corpora count (as a proxy for age) suggesting they must stay in the ovaries longer. Similar disagreement occurs with early and late lactating sperm whales from the SEP and from Durban.

23
Corpora atretica and body length. Examining the incidence of CAtr by body length (Table 17), we found none in young sperm whales before the mean length at sexual maturity (8.2m), but they were present in whales 8.2m long or larger. Although the difference is not statistically significant (X2=3.46, df=3, p>0.05), the group 11-11.9m has the highest percentage of whales with CAtr. The proportion of CAtr at different body lengths (Table 18) is not significantly different (X2=2.69, df=3, p>0.05), but again there is an increase in the group of 11-11.9m.
Corpora atretica and the total number of corpora. The number of CAtr in female sperm whales of the SEP varies from 1 to 12 giving an average of 2 per pair of ovaries. Chuzhakina (1955) found between 1 and 15 CAtr, averaging 4 to 5 per pair of ovaries, and Best (1968) reported the percentage of CAtr ‘b’ as 5 times more prevalent than CAtr ‘a’ in whales off the west coast of South Africa.
In regard to the proportion of CAtr we found 367 in all mature females compared with 4940 with functioning ovarian corpora, making 7.4% of follicular degeneration in female sperm whales of the SEP. This percentage of follicular atresia is high compared with what was found in South African seas: 3.9% by Gambell (1972) and 2.5% by Best (1967). In the SEP material the proportion of CAtr is around 25-30% in whales which have accumulated up to 11 ovarian corpora; then the number of CAtr has a tendency to increase after 12 ovarian corpora have accumulated, probably meaning less fertility in older whales (Figure 9).
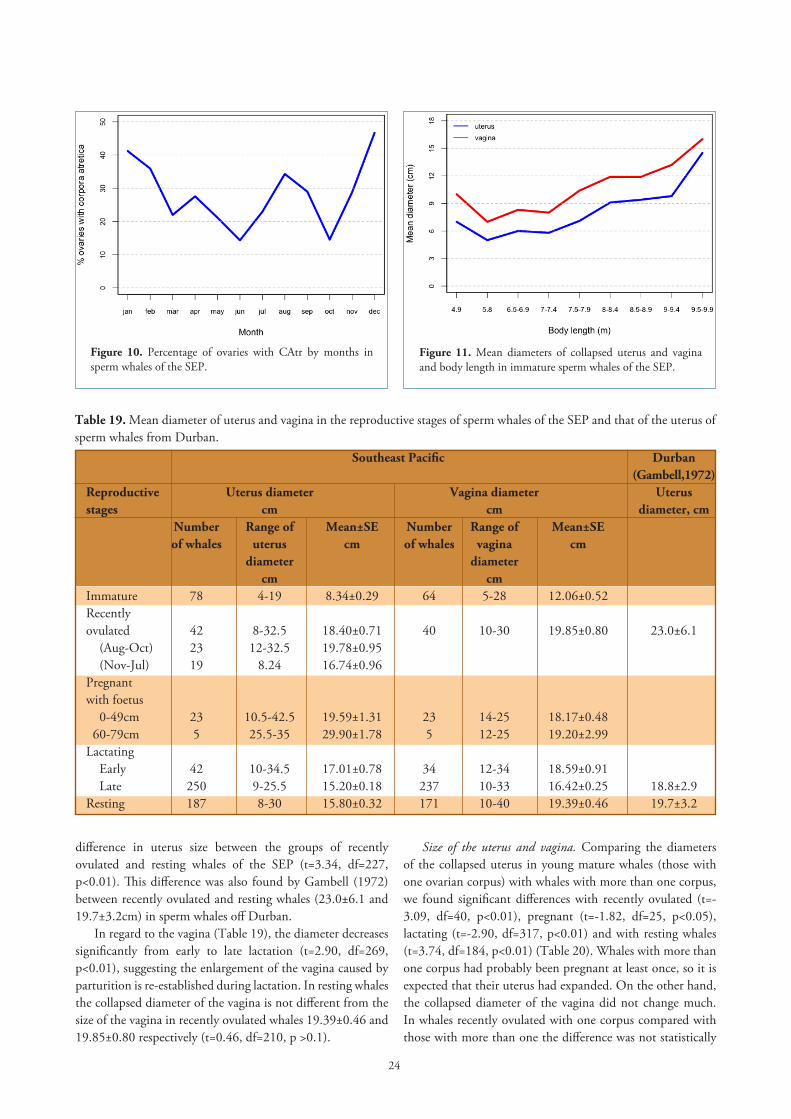
Corpora atretica by months. In Figure 10 the percentage of ovaries with CAtr by months shows two peaks, one around the months of pairing (August, September) and a bigger peak after oestrus (December). As it has been shown earlier, follicles are more abundant and also larger around the months of pairing, which means there are more maturing follicles at this time and therefore more chances for follicles to degenerate.
Uterus and vagina: their mean sizes in the reproductive stages
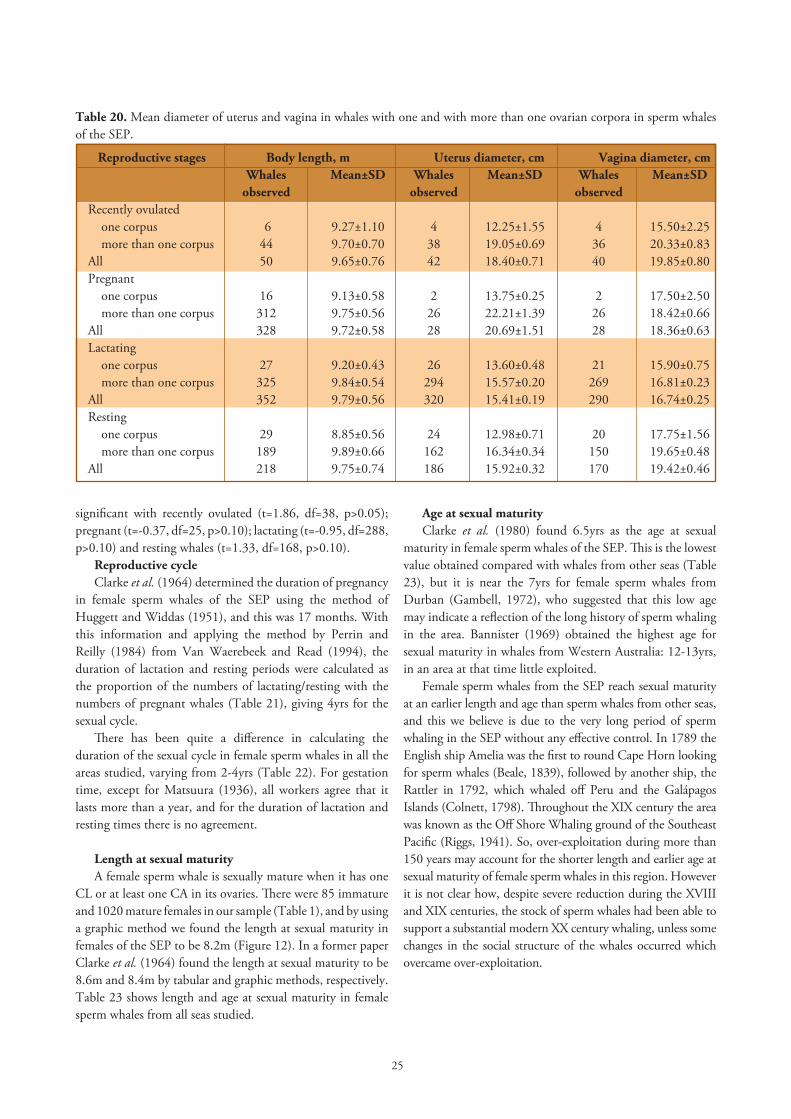
In Figure 11 we have plotted the mean sizes of the collapsed uterus and vagina against body length in the immature group, and as it is expected the uterus and vagina increase in size as the whale grows. The difference in the mean diameter of the uterus in immature and recently ovulated whales is statistically significant (t=15.32, df=118, p<0.01; Table 19). Matthews (1938) also found that recently ovulated sperm whales had a larger uterus than immature whales from the South Atlantic and the South Indian Ocean. During pregnancy the uterus increases gradually in size to accommodate the growing foetus, so in early pregnancy when foetuses are up to 49cm long, the uterus measured 19.59±1.31cm; and 29.90±1.78cm in whales with foetuses between 60 and 79cm. Measurements of the uterus in pregnant whales with larger foetuses are not available due to difficulties on the flensing platform. After parturition the shrinking of the uterus is probably fast especially at the
Figure 9. Proportion of ovaries with CAtr and the total number of ovarian corpora in sperm whales of the SEP.
Table 17. Incidence of CAtr and body length in female sperm whales of the SEP.
Body Number of whales Percentage with length CAtr m Examined With CAtr
7-8.1 9 0 0%
8.2-8.9 74 14 18.92%
9-9.9 462 110 23.81%
10-10.9 291 78 26.80%
11-11.9 22 7 31.82%
Total 858 209 24.36%
Table 18. Proportion of CAtr per ovary and body length in mature sperm whales of the SEP.
Body length, Ovaries with Number of Proportion m CAtr CAtr
8-8.9 14 19 1.36
9-9.9 110 167 1.52
10-10.9 78 149 1.91
11-11.9 7 31 4.43
beginning of lactation, and there is a significant reduction to the end of lactation from 17.01±0.78cm to 15.20±0.18cm (t=2.96, df=290, p<0.01). There is no significant reduction between late lactation and resting (t=1.56, df=435, p>0.10).
In recently ovulated whales that had ovulated around the months of pairing (August, September and October) there is a significant enlargement of the uterus (19.78± 0.95) compared with those which ovulated outside the main months of pairing (16.74± 0.96), t=2.23, df=40, p<0.05, suggesting an enlargement of the uterus at oestrus. There is a significant
24
difference in uterus size between the groups of recently ovulated and resting whales of the SEP (t=3.34, df=227, p<0.01). This difference was also found by Gambell (1972) between recently ovulated and resting whales (23.0±6.1 and 19.7±3.2cm) in sperm whales off Durban.
In regard to the vagina (Table 19), the diameter decreases significantly from early to late lactation (t=2.90, df=269, p<0.01), suggesting the enlargement of the vagina caused by parturition is re-established during lactation. In resting whales the collapsed diameter of the vagina is not different from the size of the vagina in recently ovulated whales 19.39±0.46 and 19.85±0.80 respectively (t=0.46, df=210, p >0.1).
Figure 10. Percentage of ovaries with CAtr by months in sperm whales of the SEP.
Figure 11. Mean diameters of collapsed uterus and vagina and body length in immature sperm whales of the SEP.
Table 19. Mean diameter of uterus and vagina in the reproductive stages of sperm whales of the SEP and that of the uterus of sperm whales from Durban.
Southeast Pacific Durban (Gambell,1972)Reproductive Uterus diameter Vagina diameter Uterus stages cm cm diameter, cm Number Range of Mean±SE Number Range of Mean±SE of whales uterus cm of whales vagina cm diameter diameter cm cm Immature 78 4-19 8.34±0.29 64 5-28 12.06±0.52Recently ovulated 42 8-32.5 18.40±0.71 40 10-30 19.85±0.80 23.0±6.1 (Aug-Oct) 23 12-32.5 19.78±0.95 (Nov-Jul) 19 8.24 16.74±0.96 Pregnantwith foetus 0-49cm 23 10.5-42.5 19.59±1.31 23 14-25 18.17±0.48 60-79cm 5 25.5-35 29.90±1.78 5 12-25 19.20±2.99 Lactating Early 42 10-34.5 17.01±0.78 34 12-34 18.59±0.91 Late 250 9-25.5 15.20±0.18 237 10-33 16.42±0.25 18.8±2.9Resting 187 8-30 15.80±0.32 171 10-40 19.39±0.46 19.7±3.2
Size of the uterus and vagina. Comparing the diameters of the collapsed uterus in young mature whales (those with one ovarian corpus) with whales with more than one corpus, we found significant differences with recently ovulated (t=-3.09, df=40, p<0.01), pregnant (t=-1.82, df=25, p<0.05), lactating (t=-2.90, df=317, p<0.01) and with resting whales (t=3.74, df=184, p<0.01) (Table 20). Whales with more than one corpus had probably been pregnant at least once, so it is expected that their uterus had expanded. On the other hand, the collapsed diameter of the vagina did not change much. In whales recently ovulated with one corpus compared with those with more than one the difference was not statistically
25
significant with recently ovulated (t=1.86, df=38, p>0.05); pregnant (t=-0.37, df=25, p>0.10); lactating (t=-0.95, df=288, p>0.10) and resting whales (t=1.33, df=168, p>0.10).
Reproductive cycleClarke et al. (1964) determined the duration of pregnancy
in female sperm whales of the SEP using the method of Huggett and Widdas (1951), and this was 17 months. With this information and applying the method by Perrin and Reilly (1984) from Van Waerebeek and Read (1994), the duration of lactation and resting periods were calculated as the proportion of the numbers of lactating/resting with the numbers of pregnant whales (Table 21), giving 4yrs for the sexual cycle.
There has been quite a difference in calculating the duration of the sexual cycle in female sperm whales in all the areas studied, varying from 2-4yrs (Table 22). For gestation time, except for Matsuura (1936), all workers agree that it lasts more than a year, and for the duration of lactation and resting times there is no agreement.
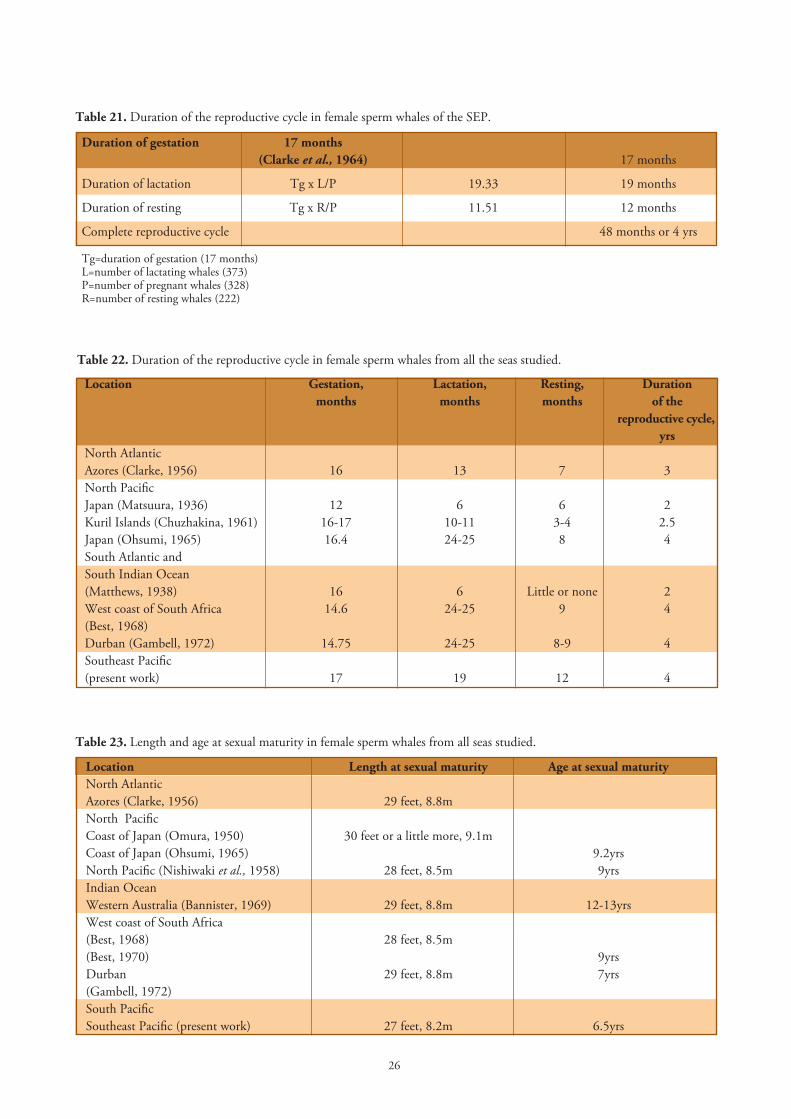
Length at sexual maturityA female sperm whale is sexually mature when it has one
CL or at least one CA in its ovaries. There were 85 immature and 1020 mature females in our sample (Table 1), and by using a graphic method we found the length at sexual maturity in females of the SEP to be 8.2m (Figure 12). In a former paper Clarke et al. (1964) found the length at sexual maturity to be 8.6m and 8.4m by tabular and graphic methods, respectively. Table 23 shows length and age at sexual maturity in female sperm whales from all seas studied.
Table 20. Mean diameter of uterus and vagina in whales with one and with more than one ovarian corpora in sperm whales of the SEP.
Reproductive stages Body length, m Uterus diameter, cm Vagina diameter, cm Whales Mean±SD Whales Mean±SD Whales Mean±SD observed observed observed Recently ovulated one corpus 6 9.27±1.10 4 12.25±1.55 4 15.50±2.25 more than one corpus 44 9.70±0.70 38 19.05±0.69 36 20.33±0.83All 50 9.65±0.76 42 18.40±0.71 40 19.85±0.80Pregnant one corpus 16 9.13±0.58 2 13.75±0.25 2 17.50±2.50 more than one corpus 312 9.75±0.56 26 22.21±1.39 26 18.42±0.66All 328 9.72±0.58 28 20.69±1.51 28 18.36±0.63Lactating one corpus 27 9.20±0.43 26 13.60±0.48 21 15.90±0.75 more than one corpus 325 9.84±0.54 294 15.57±0.20 269 16.81±0.23All 352 9.79±0.56 320 15.41±0.19 290 16.74±0.25Resting one corpus 29 8.85±0.56 24 12.98±0.71 20 17.75±1.56 more than one corpus 189 9.89±0.66 162 16.34±0.34 150 19.65±0.48All 218 9.75±0.74 186 15.92±0.32 170 19.42±0.46
Age at sexual maturityClarke et al. (1980) found 6.5yrs as the age at sexual
maturity in female sperm whales of the SEP. This is the lowest value obtained compared with whales from other seas (Table 23), but it is near the 7yrs for female sperm whales from Durban (Gambell, 1972), who suggested that this low age may indicate a reflection of the long history of sperm whaling in the area. Bannister (1969) obtained the highest age for sexual maturity in whales from Western Australia: 12-13yrs, in an area at that time little exploited.
Female sperm whales from the SEP reach sexual maturity at an earlier length and age than sperm whales from other seas, and this we believe is due to the very long period of sperm whaling in the SEP without any effective control. In 1789 the English ship Amelia was the first to round Cape Horn looking for sperm whales (Beale, 1839), followed by another ship, the Rattler in 1792, which whaled off Peru and the Galápagos Islands (Colnett, 1798). Throughout the XIX century the area was known as the Off Shore Whaling ground of the Southeast Pacific (Riggs, 1941). So, over-exploitation during more than 150 years may account for the shorter length and earlier age at sexual maturity of female sperm whales in this region. However it is not clear how, despite severe reduction during the XVIII and XIX centuries, the stock of sperm whales had been able to support a substantial modern XX century whaling, unless some changes in the social structure of the whales occurred which overcame over-exploitation.
26
Table 21. Duration of the reproductive cycle in female sperm whales of the SEP.
Duration of gestation 17 months (Clarke et al., 1964) 17 months
Duration of lactation Tg x L/P 19.33 19 months
Duration of resting Tg x R/P 11.51 12 months
Complete reproductive cycle 48 months or 4 yrs
Tg=duration of gestation (17 months) L=number of lactating whales (373)P=number of pregnant whales (328)R=number of resting whales (222)
Table 22. Duration of the reproductive cycle in female sperm whales from all the seas studied.
Location Gestation, Lactation, Resting, Duration months months months of the reproductive cycle, yrsNorth Atlantic Azores (Clarke, 1956) 16 13 7 3North PacificJapan (Matsuura, 1936) 12 6 6 2Kuril Islands (Chuzhakina, 1961) 16-17 10-11 3-4 2.5 Japan (Ohsumi, 1965) 16.4 24-25 8 4South Atlantic andSouth Indian Ocean(Matthews, 1938) 16 6 Little or none 2 West coast of South Africa 14.6 24-25 9 4(Best, 1968) Durban (Gambell, 1972) 14.75 24-25 8-9 4 Southeast Pacific (present work) 17 19 12 4
Table 23. Length and age at sexual maturity in female sperm whales from all seas studied.
Location Length at sexual maturity Age at sexual maturityNorth AtlanticAzores (Clarke, 1956) 29 feet, 8.8m North Pacific Coast of Japan (Omura, 1950) 30 feet or a little more, 9.1mCoast of Japan (Ohsumi, 1965) 9.2yrsNorth Pacific (Nishiwaki et al., 1958) 28 feet, 8.5m 9yrs Indian OceanWestern Australia (Bannister, 1969) 29 feet, 8.8m 12-13yrsWest coast of South Africa (Best, 1968) 28 feet, 8.5m(Best, 1970) 9yrsDurban 29 feet, 8.8m 7yrs(Gambell, 1972) South PacificSoutheast Pacific (present work) 27 feet, 8.2m 6.5yrs
27
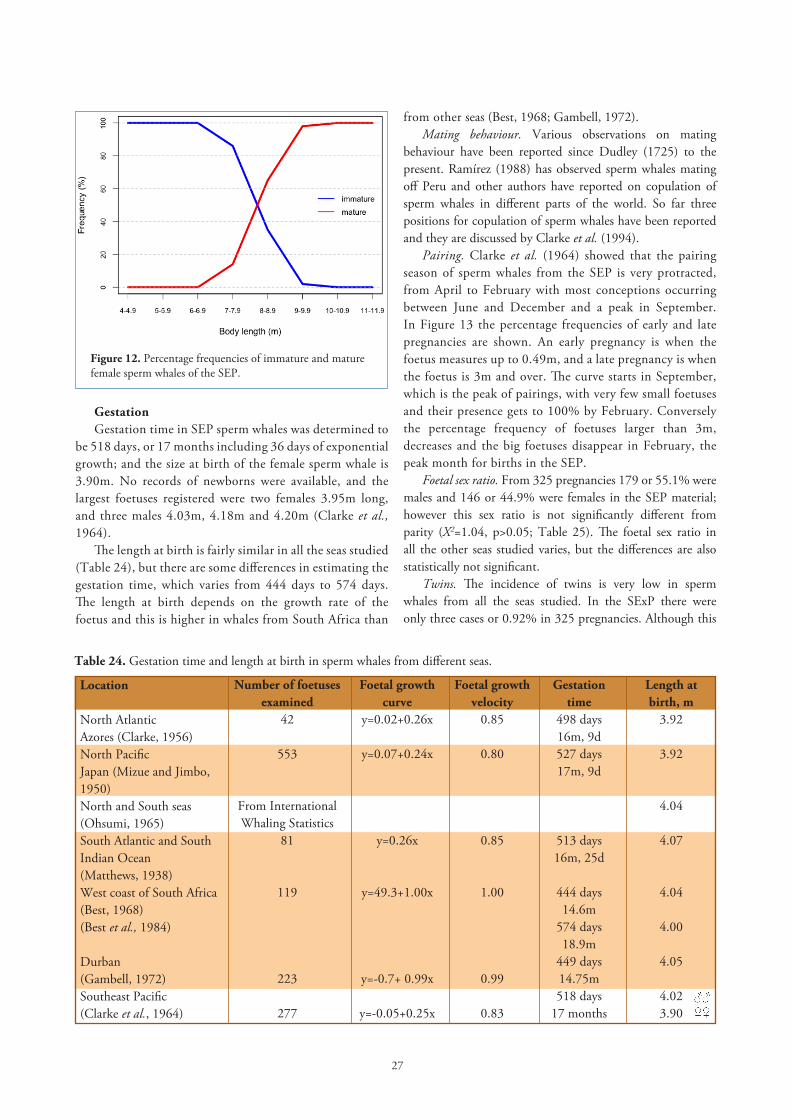
GestationGestation time in SEP sperm whales was determined to
be 518 days, or 17 months including 36 days of exponential growth; and the size at birth of the female sperm whale is 3.90m. No records of newborns were available, and the largest foetuses registered were two females 3.95m long, and three males 4.03m, 4.18m and 4.20m (Clarke et al., 1964).
The length at birth is fairly similar in all the seas studied (Table 24), but there are some differences in estimating the gestation time, which varies from 444 days to 574 days. The length at birth depends on the growth rate of the foetus and this is higher in whales from South Africa than
Figure 12. Percentage frequencies of immature and mature female sperm whales of the SEP.
from other seas (Best, 1968; Gambell, 1972).Mating behaviour. Various observations on mating
behaviour have been reported since Dudley (1725) to the present. Ramírez (1988) has observed sperm whales mating off Peru and other authors have reported on copulation of sperm whales in different parts of the world. So far three positions for copulation of sperm whales have been reported and they are discussed by Clarke et al. (1994).
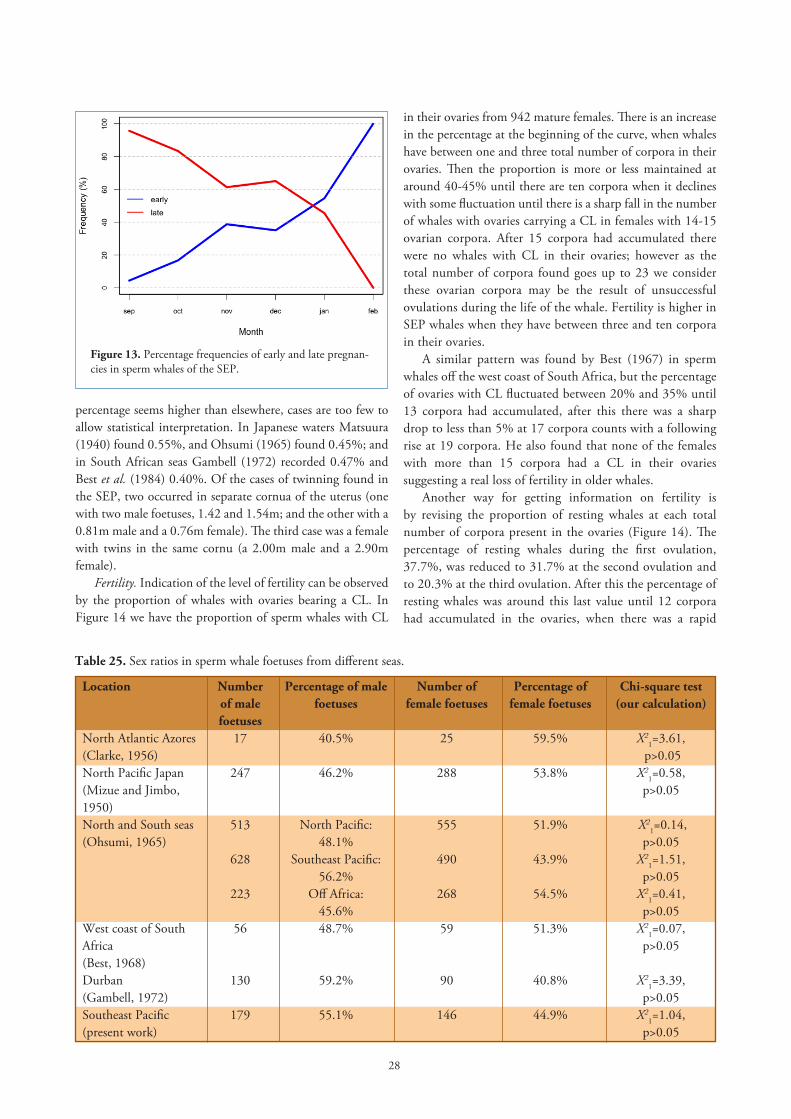
Pairing. Clarke et al. (1964) showed that the pairing season of sperm whales from the SEP is very protracted, from April to February with most conceptions occurring between June and December and a peak in September. In Figure 13 the percentage frequencies of early and late pregnancies are shown. An early pregnancy is when the foetus measures up to 0.49m, and a late pregnancy is when the foetus is 3m and over. The curve starts in September, which is the peak of pairings, with very few small foetuses and their presence gets to 100% by February. Conversely the percentage frequency of foetuses larger than 3m, decreases and the big foetuses disappear in February, the peak month for births in the SEP.
Foetal sex ratio. From 325 pregnancies 179 or 55.1% were males and 146 or 44.9% were females in the SEP material; however this sex ratio is not significantly different from parity (X2=1.04, p>0.05; Table 25). The foetal sex ratio in all the other seas studied varies, but the differences are also statistically not significant.
Twins. The incidence of twins is very low in sperm whales from all the seas studied. In the SExP there were only three cases or 0.92% in 325 pregnancies. Although this
Table 24. Gestation time and length at birth in sperm whales from different seas.
Location
North AtlanticAzores (Clarke, 1956)North Pacific Japan (Mizue and Jimbo, 1950)North and South seas(Ohsumi, 1965)South Atlantic and South Indian Ocean(Matthews, 1938)West coast of South Africa(Best, 1968)(Best et al., 1984)
Durban (Gambell, 1972)Southeast Pacific(Clarke et al., 1964)
Number of foetuses examined
42
553
From International Whaling Statistics
81
119
223
277
Foetal growthcurve
y=0.02+0.26x
y=0.07+0.24x
y=0.26x
y=49.3+1.00x
y=-0.7+ 0.99x
y=-0.05+0.25x
Foetal growth velocity
0.85
0.80
0.85
1.00
0.99
0.83
Gestationtime
498 days16m, 9d527 days17m, 9d
513 days16m, 25d
444 days14.6m
574 days18.9m
449 days14.75m518 days
17 months
Length atbirth, m
3.92
3.92
4.04
4.07
4.04
4.00
4.05
4.023.90
28
Figure 13. Percentage frequencies of early and late pregnan-cies in sperm whales of the SEP.
percentage seems higher than elsewhere, cases are too few to allow statistical interpretation. In Japanese waters Matsuura (1940) found 0.55%, and Ohsumi (1965) found 0.45%; and in South African seas Gambell (1972) recorded 0.47% and Best et al. (1984) 0.40%. Of the cases of twinning found in the SEP, two occurred in separate cornua of the uterus (one with two male foetuses, 1.42 and 1.54m; and the other with a 0.81m male and a 0.76m female). The third case was a female with twins in the same cornu (a 2.00m male and a 2.90m female).
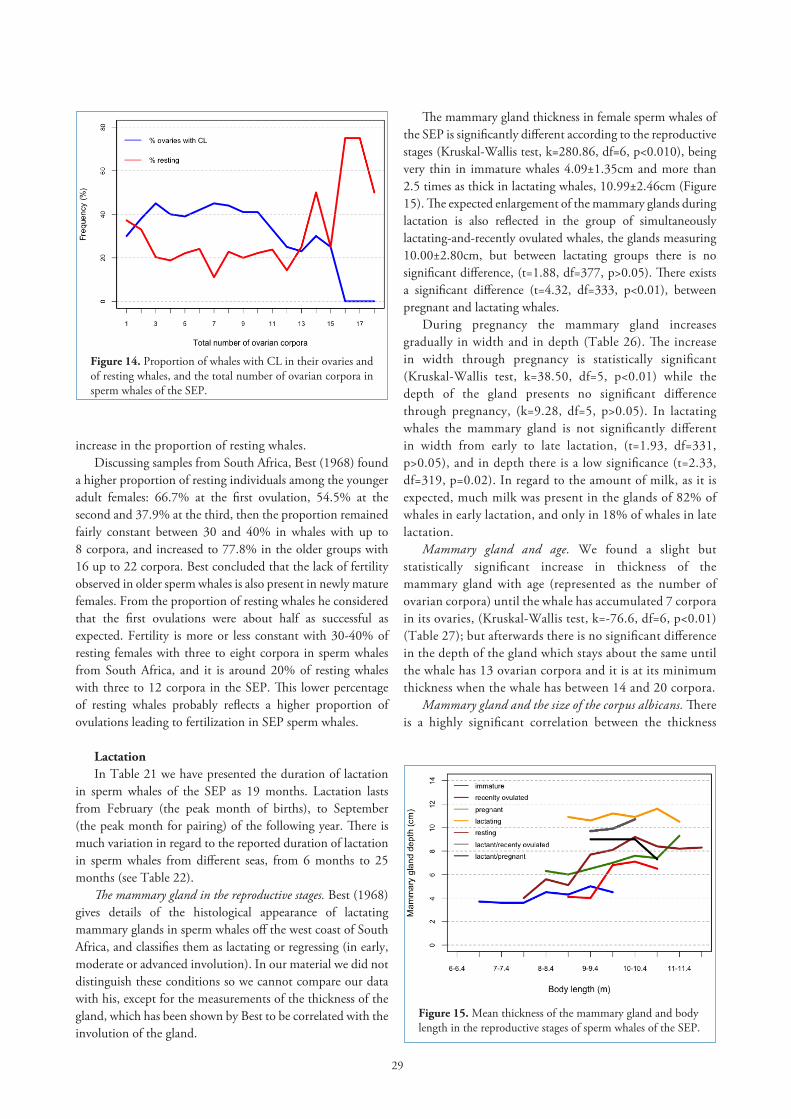
Fertility. Indication of the level of fertility can be observed by the proportion of whales with ovaries bearing a CL. In Figure 14 we have the proportion of sperm whales with CL
Table 25. Sex ratios in sperm whale foetuses from different seas.
Location
North Atlantic Azores (Clarke, 1956)North Pacific Japan (Mizue and Jimbo, 1950)North and South seas (Ohsumi, 1965)
West coast of South Africa(Best, 1968)Durban (Gambell, 1972)Southeast Pacific(present work)
Number of male foetuses
17
247
513
628
223
56
130
179
Percentage of male foetuses
40.5%
46.2%
North Pacific: 48.1%
Southeast Pacific:56.2%
Off Africa:45.6%48.7%
59.2%
55.1%
Number of female foetuses
25
288
555
490
268
59
90
146
Percentage of female foetuses
59.5%
53.8%
51.9%
43.9%
54.5%
51.3%
40.8%
44.9%
Chi-square test(our calculation)
X21=3.61,
p>0.05X2
1=0.58, p>0.05
X21=0.14,
p>0.05X2
1=1.51,p>0.05
X21=0.41,
p>0.05X2
1=0.07,p>0.05
X21=3.39,
p>0.05X2
1=1.04,p>0.05
in their ovaries from 942 mature females. There is an increase in the percentage at the beginning of the curve, when whales have between one and three total number of corpora in their ovaries. Then the proportion is more or less maintained at around 40-45% until there are ten corpora when it declines with some fluctuation until there is a sharp fall in the number of whales with ovaries carrying a CL in females with 14-15 ovarian corpora. After 15 corpora had accumulated there were no whales with CL in their ovaries; however as the total number of corpora found goes up to 23 we consider these ovarian corpora may be the result of unsuccessful ovulations during the life of the whale. Fertility is higher in SEP whales when they have between three and ten corpora in their ovaries.
A similar pattern was found by Best (1967) in sperm whales off the west coast of South Africa, but the percentage of ovaries with CL fluctuated between 20% and 35% until 13 corpora had accumulated, after this there was a sharp drop to less than 5% at 17 corpora counts with a following rise at 19 corpora. He also found that none of the females with more than 15 corpora had a CL in their ovaries suggesting a real loss of fertility in older whales.
Another way for getting information on fertility is by revising the proportion of resting whales at each total number of corpora present in the ovaries (Figure 14). The percentage of resting whales during the first ovulation, 37.7%, was reduced to 31.7% at the second ovulation and to 20.3% at the third ovulation. After this the percentage of resting whales was around this last value until 12 corpora had accumulated in the ovaries, when there was a rapid
29
increase in the proportion of resting whales.Discussing samples from South Africa, Best (1968) found
a higher proportion of resting individuals among the younger adult females: 66.7% at the first ovulation, 54.5% at the second and 37.9% at the third, then the proportion remained fairly constant between 30 and 40% in whales with up to 8 corpora, and increased to 77.8% in the older groups with 16 up to 22 corpora. Best concluded that the lack of fertility observed in older sperm whales is also present in newly mature females. From the proportion of resting whales he considered that the first ovulations were about half as successful as expected. Fertility is more or less constant with 30-40% of resting females with three to eight corpora in sperm whales from South Africa, and it is around 20% of resting whales with three to 12 corpora in the SEP. This lower percentage of resting whales probably reflects a higher proportion of ovulations leading to fertilization in SEP sperm whales.
LactationIn Table 21 we have presented the duration of lactation
in sperm whales of the SEP as 19 months. Lactation lasts from February (the peak month of births), to September (the peak month for pairing) of the following year. There is much variation in regard to the reported duration of lactation in sperm whales from different seas, from 6 months to 25 months (see Table 22).
The mammary gland in the reproductive stages. Best (1968) gives details of the histological appearance of lactating mammary glands in sperm whales off the west coast of South Africa, and classifies them as lactating or regressing (in early, moderate or advanced involution). In our material we did not distinguish these conditions so we cannot compare our data with his, except for the measurements of the thickness of the gland, which has been shown by Best to be correlated with the involution of the gland.
Figure 14. Proportion of whales with CL in their ovaries and of resting whales, and the total number of ovarian corpora in sperm whales of the SEP.
The mammary gland thickness in female sperm whales of the SEP is significantly different according to the reproductive stages (Kruskal-Wallis test, k=280.86, df=6, p<0.010), being very thin in immature whales 4.09±1.35cm and more than 2.5 times as thick in lactating whales, 10.99±2.46cm (Figure 15). The expected enlargement of the mammary glands during lactation is also reflected in the group of simultaneously lactating-and-recently ovulated whales, the glands measuring 10.00±2.80cm, but between lactating groups there is no significant difference, (t=1.88, df=377, p>0.05). There exists a significant difference (t=4.32, df=333, p<0.01), between pregnant and lactating whales.
During pregnancy the mammary gland increases gradually in width and in depth (Table 26). The increase in width through pregnancy is statistically significant (Kruskal-Wallis test, k=38.50, df=5, p<0.01) while the depth of the gland presents no significant difference through pregnancy, (k=9.28, df=5, p>0.05). In lactating whales the mammary gland is not significantly different in width from early to late lactation, (t=1.93, df=331, p>0.05), and in depth there is a low significance (t=2.33, df=319, p=0.02). In regard to the amount of milk, as it is expected, much milk was present in the glands of 82% of whales in early lactation, and only in 18% of whales in late lactation.
Mammary gland and age. We found a slight but statistically significant increase in thickness of the mammary gland with age (represented as the number of ovarian corpora) until the whale has accumulated 7 corpora in its ovaries, (Kruskal-Wallis test, k=-76.6, df=6, p<0.01) (Table 27); but afterwards there is no significant difference in the depth of the gland which stays about the same until the whale has 13 ovarian corpora and it is at its minimum thickness when the whale has between 14 and 20 corpora.
Mammary gland and the size of the corpus albicans. There is a highly significant correlation between the thickness
Figure 15. Mean thickness of the mammary gland and body length in the reproductive stages of sperm whales of the SEP.
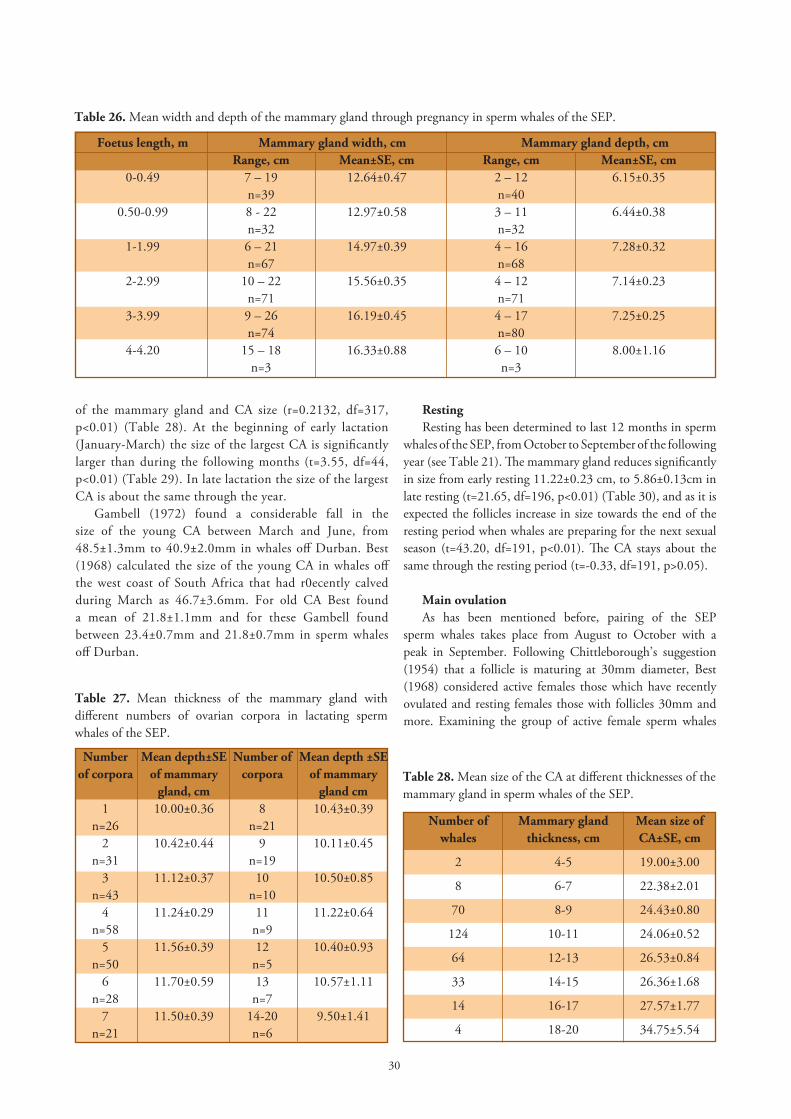
30
Table 26. Mean width and depth of the mammary gland through pregnancy in sperm whales of the SEP.
Foetus length, m Mammary gland width, cm Mammary gland depth, cm Range, cm Mean±SE, cm Range, cm Mean±SE, cm 0-0.49 7 – 19 12.64±0.47 2 – 12 6.15±0.35 n=39 n=40 0.50-0.99 8 - 22 12.97±0.58 3 – 11 6.44±0.38 n=32 n=32 1-1.99 6 – 21 14.97±0.39 4 – 16 7.28±0.32 n=67 n=68 2-2.99 10 – 22 15.56±0.35 4 – 12 7.14±0.23 n=71 n=71 3-3.99 9 – 26 16.19±0.45 4 – 17 7.25±0.25 n=74 n=80 4-4.20 15 – 18 16.33±0.88 6 – 10 8.00±1.16 n=3 n=3
of the mammary gland and CA size (r=0.2132, df=317, p<0.01) (Table 28). At the beginning of early lactation (January-March) the size of the largest CA is significantly larger than during the following months (t=3.55, df=44, p<0.01) (Table 29). In late lactation the size of the largest CA is about the same through the year.
Gambell (1972) found a considerable fall in the size of the young CA between March and June, from 48.5±1.3mm to 40.9±2.0mm in whales off Durban. Best (1968) calculated the size of the young CA in whales off the west coast of South Africa that had r0ecently calved during March as 46.7±3.6mm. For old CA Best found a mean of 21.8±1.1mm and for these Gambell found between 23.4±0.7mm and 21.8±0.7mm in sperm whales off Durban.
RestingResting has been determined to last 12 months in sperm
whales of the SEP, from October to September of the following year (see Table 21). The mammary gland reduces significantly in size from early resting 11.22±0.23 cm, to 5.86±0.13cm in late resting (t=21.65, df=196, p<0.01) (Table 30), and as it is expected the follicles increase in size towards the end of the resting period when whales are preparing for the next sexual season (t=43.20, df=191, p<0.01). The CA stays about the same through the resting period (t=-0.33, df=191, p>0.05).
Main ovulationAs has been mentioned before, pairing of the SEP
sperm whales takes place from August to October with a peak in September. Following Chittleborough’s suggestion (1954) that a follicle is maturing at 30mm diameter, Best (1968) considered active females those which have recently ovulated and resting females those with follicles 30mm and more. Examining the group of active female sperm whales
Table 27. Mean thickness of the mammary gland with different numbers of ovarian corpora in lactating sperm whales of the SEP.
Number Mean depth±SE Number of Mean depth ±SE of corpora of mammary corpora of mammary gland, cm gland cm 1 10.00±0.36 8 10.43±0.39 n=26 n=21 2 10.42±0.44 9 10.11±0.45 n=31 n=19 3 11.12±0.37 10 10.50±0.85 n=43 n=10 4 11.24±0.29 11 11.22±0.64 n=58 n=9 5 11.56±0.39 12 10.40±0.93 n=50 n=5 6 11.70±0.59 13 10.57±1.11 n=28 n=7 7 11.50±0.39 14-20 9.50±1.41 n=21 n=6
Number of Mammary gland Mean size of whales thickness, cm CA±SE, cm
2 4-5 19.00±3.00
8 6-7 22.38±2.01
70 8-9 24.43±0.80
124 10-11 24.06±0.52
64 12-13 26.53±0.84
33 14-15 26.36±1.68
14 16-17 27.57±1.77
4 18-20 34.75±5.54
Table 28. Mean size of the CA at different thicknesses of the mammary gland in sperm whales of the SEP.
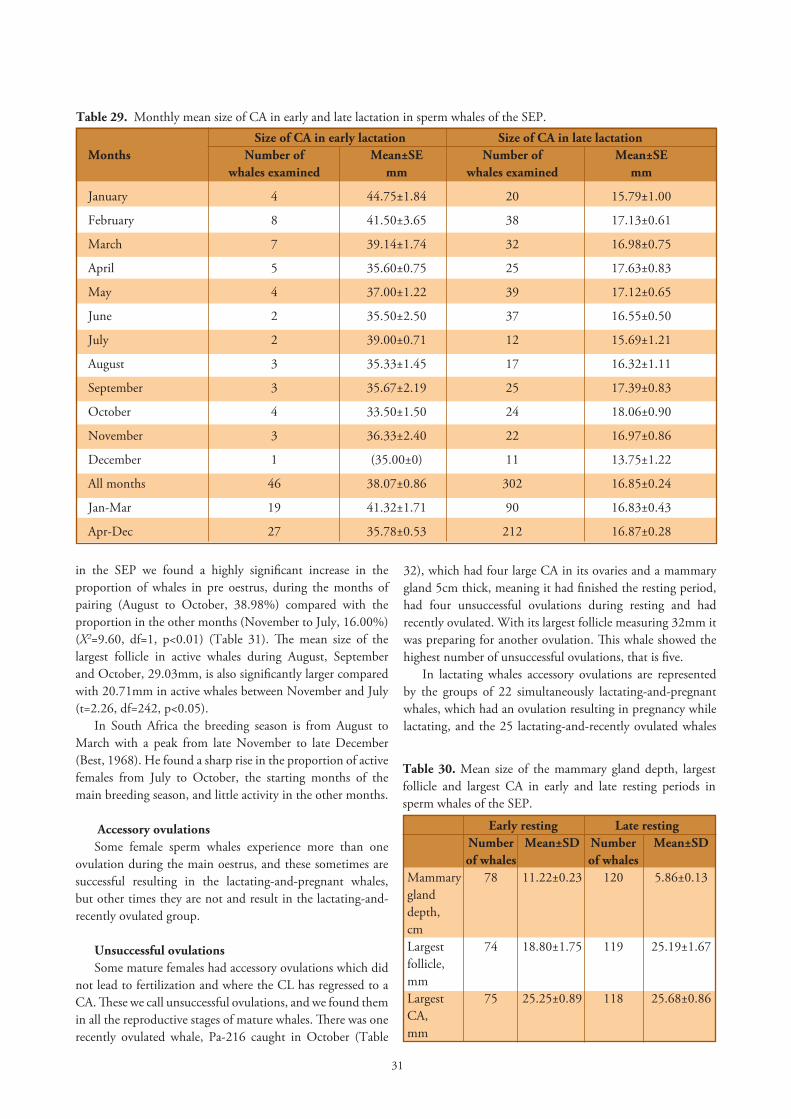
31
in the SEP we found a highly significant increase in the proportion of whales in pre oestrus, during the months of pairing (August to October, 38.98%) compared with the proportion in the other months (November to July, 16.00%) (X2=9.60, df=1, p<0.01) (Table 31). The mean size of the largest follicle in active whales during August, September and October, 29.03mm, is also significantly larger compared with 20.71mm in active whales between November and July (t=2.26, df=242, p<0.05).
In South Africa the breeding season is from August to March with a peak from late November to late December (Best, 1968). He found a sharp rise in the proportion of active females from July to October, the starting months of the main breeding season, and little activity in the other months.
Accessory ovulationsSome female sperm whales experience more than one
ovulation during the main oestrus, and these sometimes are successful resulting in the lactating-and-pregnant whales, but other times they are not and result in the lactating-and-recently ovulated group.
Unsuccessful ovulationsSome mature females had accessory ovulations which did
not lead to fertilization and where the CL has regressed to a CA. These we call unsuccessful ovulations, and we found them in all the reproductive stages of mature whales. There was one recently ovulated whale, Pa-216 caught in October (Table
Table 29. Monthly mean size of CA in early and late lactation in sperm whales of the SEP. Size of CA in early lactation Size of CA in late lactationMonths Number of Mean±SE Number of Mean±SE whales examined mm whales examined mm
January 4 44.75±1.84 20 15.79±1.00
February 8 41.50±3.65 38 17.13±0.61
March 7 39.14±1.74 32 16.98±0.75
April 5 35.60±0.75 25 17.63±0.83
May 4 37.00±1.22 39 17.12±0.65
June 2 35.50±2.50 37 16.55±0.50
July 2 39.00±0.71 12 15.69±1.21
August 3 35.33±1.45 17 16.32±1.11
September 3 35.67±2.19 25 17.39±0.83
October 4 33.50±1.50 24 18.06±0.90
November 3 36.33±2.40 22 16.97±0.86
December 1 (35.00±0) 11 13.75±1.22
All months 46 38.07±0.86 302 16.85±0.24
Jan-Mar 19 41.32±1.71 90 16.83±0.43
Apr-Dec 27 35.78±0.53 212 16.87±0.28
32), which had four large CA in its ovaries and a mammary gland 5cm thick, meaning it had finished the resting period, had four unsuccessful ovulations during resting and had recently ovulated. With its largest follicle measuring 32mm it was preparing for another ovulation. This whale showed the highest number of unsuccessful ovulations, that is five.
In lactating whales accessory ovulations are represented by the groups of 22 simultaneously lactating-and-pregnant whales, which had an ovulation resulting in pregnancy while lactating, and the 25 lactating-and-recently ovulated whales
Table 30. Mean size of the mammary gland depth, largest follicle and largest CA in early and late resting periods in sperm whales of the SEP.
Early resting Late resting Number Mean±SD Number Mean±SD of whales of whalesMammary 78 11.22±0.23 120 5.86±0.13glanddepth,cm Largest 74 18.80±1.75 119 25.19±1.67follicle,mm Largest 75 25.25±0.89 118 25.68±0.86CA,mm
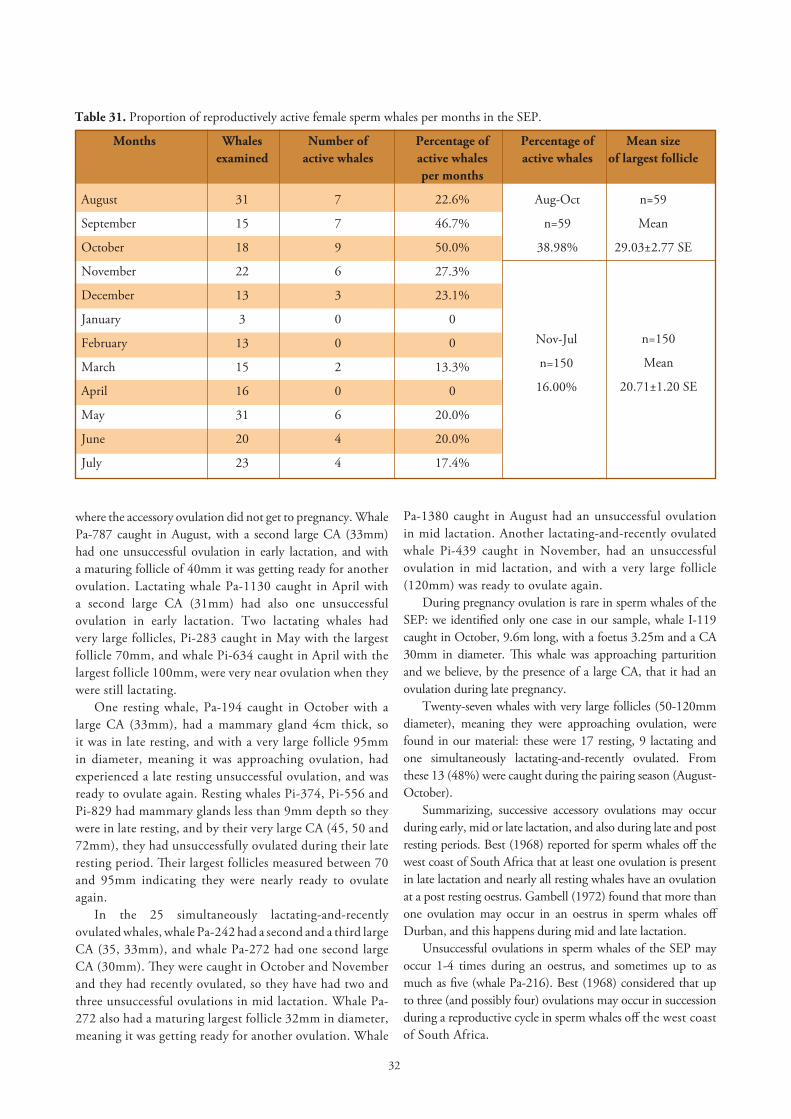
32
where the accessory ovulation did not get to pregnancy. Whale Pa-787 caught in August, with a second large CA (33mm) had one unsuccessful ovulation in early lactation, and with a maturing follicle of 40mm it was getting ready for another ovulation. Lactating whale Pa-1130 caught in April with a second large CA (31mm) had also one unsuccessful ovulation in early lactation. Two lactating whales had very large follicles, Pi-283 caught in May with the largest follicle 70mm, and whale Pi-634 caught in April with the largest follicle 100mm, were very near ovulation when they were still lactating.
One resting whale, Pa-194 caught in October with a large CA (33mm), had a mammary gland 4cm thick, so it was in late resting, and with a very large follicle 95mm in diameter, meaning it was approaching ovulation, had experienced a late resting unsuccessful ovulation, and was ready to ovulate again. Resting whales Pi-374, Pi-556 and Pi-829 had mammary glands less than 9mm depth so they were in late resting, and by their very large CA (45, 50 and 72mm), they had unsuccessfully ovulated during their late resting period. Their largest follicles measured between 70 and 95mm indicating they were nearly ready to ovulate again.
In the 25 simultaneously lactating-and-recently ovulated whales, whale Pa-242 had a second and a third large CA (35, 33mm), and whale Pa-272 had one second large CA (30mm). They were caught in October and November and they had recently ovulated, so they have had two and three unsuccessful ovulations in mid lactation. Whale Pa-272 also had a maturing largest follicle 32mm in diameter, meaning it was getting ready for another ovulation. Whale
Table 31. Proportion of reproductively active female sperm whales per months in the SEP.
Months Whales Number of Percentage of Percentage of Mean size examined active whales active whales active whales of largest follicle per months
August 31 7 22.6% Aug-Oct n=59
September 15 7 46.7% n=59 Mean
October 18 9 50.0% 38.98% 29.03±2.77 SE
November 22 6 27.3%
December 13 3 23.1%
January 3 0 0
February 13 0 0
March 15 2 13.3%
April 16 0 0
May 31 6 20.0%
June 20 4 20.0%
July 23 4 17.4%
Nov-Jul
n=150
16.00%
n=150
Mean
20.71±1.20 SE
Pa-1380 caught in August had an unsuccessful ovulation in mid lactation. Another lactating-and-recently ovulated whale Pi-439 caught in November, had an unsuccessful ovulation in mid lactation, and with a very large follicle (120mm) was ready to ovulate again.
During pregnancy ovulation is rare in sperm whales of the SEP: we identified only one case in our sample, whale I-119 caught in October, 9.6m long, with a foetus 3.25m and a CA 30mm in diameter. This whale was approaching parturition and we believe, by the presence of a large CA, that it had an ovulation during late pregnancy.
Twenty-seven whales with very large follicles (50-120mm diameter), meaning they were approaching ovulation, were found in our material: these were 17 resting, 9 lactating and one simultaneously lactating-and-recently ovulated. From these 13 (48%) were caught during the pairing season (August-October).
Summarizing, successive accessory ovulations may occur during early, mid or late lactation, and also during late and post resting periods. Best (1968) reported for sperm whales off the west coast of South Africa that at least one ovulation is present in late lactation and nearly all resting whales have an ovulation at a post resting oestrus. Gambell (1972) found that more than one ovulation may occur in an oestrus in sperm whales off Durban, and this happens during mid and late lactation.
Unsuccessful ovulations in sperm whales of the SEP may occur 1-4 times during an oestrus, and sometimes up to as much as five (whale Pa-216). Best (1968) considered that up to three (and possibly four) ovulations may occur in succession during a reproductive cycle in sperm whales off the west coast of South Africa.
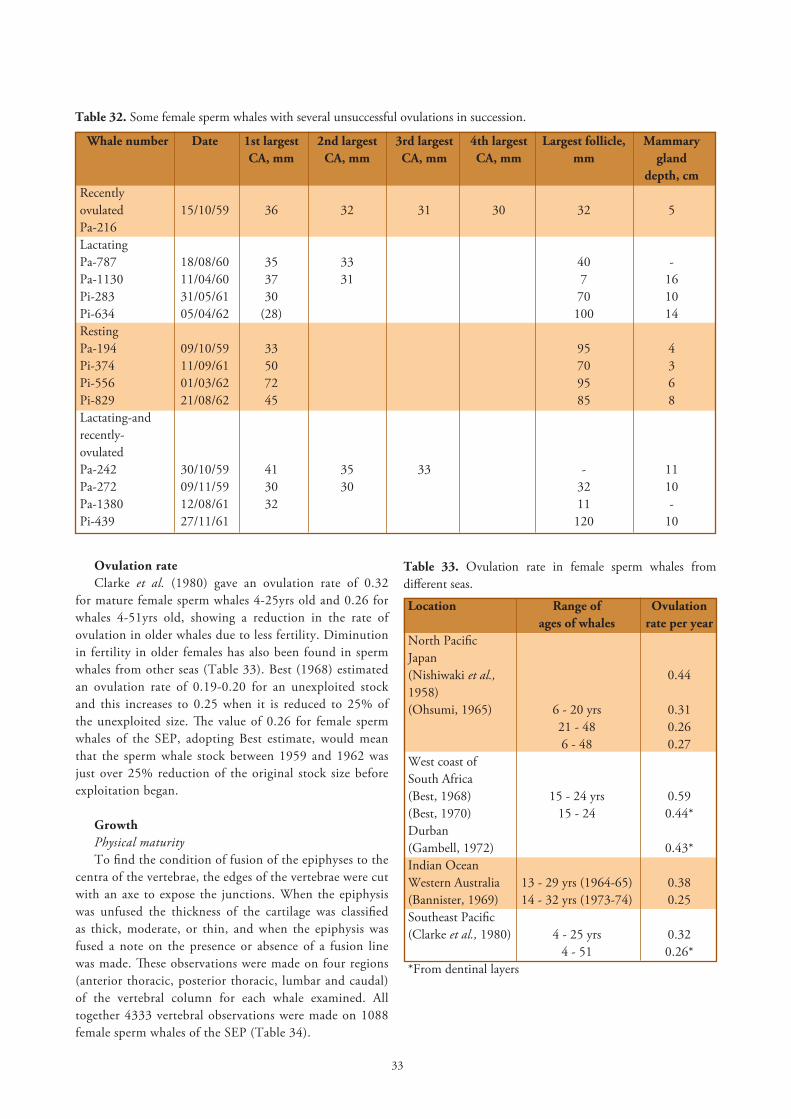
33
Ovulation rateClarke et al. (1980) gave an ovulation rate of 0.32
for mature female sperm whales 4-25yrs old and 0.26 for whales 4-51yrs old, showing a reduction in the rate of ovulation in older whales due to less fertility. Diminution in fertility in older females has also been found in sperm whales from other seas (Table 33). Best (1968) estimated an ovulation rate of 0.19-0.20 for an unexploited stock and this increases to 0.25 when it is reduced to 25% of the unexploited size. The value of 0.26 for female sperm whales of the SEP, adopting Best estimate, would mean that the sperm whale stock between 1959 and 1962 was just over 25% reduction of the original stock size before exploitation began.
GrowthPhysical maturityTo find the condition of fusion of the epiphyses to the
centra of the vertebrae, the edges of the vertebrae were cut with an axe to expose the junctions. When the epiphysis was unfused the thickness of the cartilage was classified as thick, moderate, or thin, and when the epiphysis was fused a note on the presence or absence of a fusion line was made. These observations were made on four regions (anterior thoracic, posterior thoracic, lumbar and caudal) of the vertebral column for each whale examined. All together 4333 vertebral observations were made on 1088 female sperm whales of the SEP (Table 34).
Table 32. Some female sperm whales with several unsuccessful ovulations in succession.
Whale number Date 1st largest 2nd largest 3rd largest 4th largest Largest follicle, Mammary CA, mm CA, mm CA, mm CA, mm mm gland depth, cmRecently ovulated 15/10/59 36 32 31 30 32 5Pa-216 LactatingPa-787 18/08/60 35 33 40 -Pa-1130 11/04/60 37 31 7 16Pi-283 31/05/61 30 70 10Pi-634 05/04/62 (28) 100 14RestingPa-194 09/10/59 33 95 4Pi-374 11/09/61 50 70 3Pi-556 01/03/62 72 95 6Pi-829 21/08/62 45 85 8Lactating-andrecently-ovulatedPa-242 30/10/59 41 35 33 - 11Pa-272 09/11/59 30 30 32 10Pa-1380 12/08/61 32 11 -Pi-439 27/11/61 120 10
Table 33. Ovulation rate in female sperm whales from different seas.
Location Range of Ovulation ages of whales rate per yearNorth PacificJapan(Nishiwaki et al., 0.441958)(Ohsumi, 1965) 6 - 20 yrs 0.31 21 - 48 0.26 6 - 48 0.27 West coast ofSouth Africa(Best, 1968) 15 - 24 yrs 0.59(Best, 1970) 15 - 24 0.44*Durban(Gambell, 1972) 0.43*Indian OceanWestern Australia 13 - 29 yrs (1964-65) 0.38(Bannister, 1969) 14 - 32 yrs (1973-74) 0.25Southeast Pacific(Clarke et al., 1980) 4 - 25 yrs 0.32 4 - 51 0.26**From dentinal layers
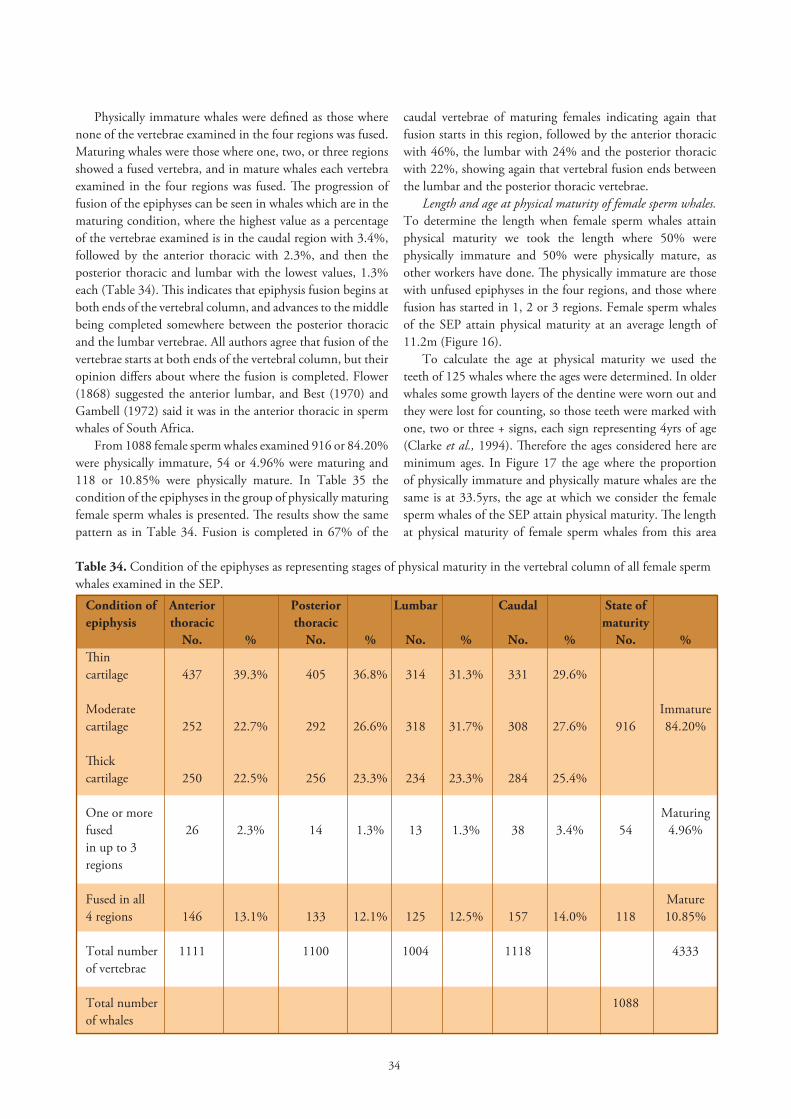
34
Physically immature whales were defined as those where none of the vertebrae examined in the four regions was fused. Maturing whales were those where one, two, or three regions showed a fused vertebra, and in mature whales each vertebra examined in the four regions was fused. The progression of fusion of the epiphyses can be seen in whales which are in the maturing condition, where the highest value as a percentage of the vertebrae examined is in the caudal region with 3.4%, followed by the anterior thoracic with 2.3%, and then the posterior thoracic and lumbar with the lowest values, 1.3% each (Table 34). This indicates that epiphysis fusion begins at both ends of the vertebral column, and advances to the middle being completed somewhere between the posterior thoracic and the lumbar vertebrae. All authors agree that fusion of the vertebrae starts at both ends of the vertebral column, but their opinion differs about where the fusion is completed. Flower (1868) suggested the anterior lumbar, and Best (1970) and Gambell (1972) said it was in the anterior thoracic in sperm whales of South Africa.
From 1088 female sperm whales examined 916 or 84.20% were physically immature, 54 or 4.96% were maturing and 118 or 10.85% were physically mature. In Table 35 the condition of the epiphyses in the group of physically maturing female sperm whales is presented. The results show the same pattern as in Table 34. Fusion is completed in 67% of the
caudal vertebrae of maturing females indicating again that fusion starts in this region, followed by the anterior thoracic with 46%, the lumbar with 24% and the posterior thoracic with 22%, showing again that vertebral fusion ends between the lumbar and the posterior thoracic vertebrae.
Length and age at physical maturity of female sperm whales. To determine the length when female sperm whales attain physical maturity we took the length where 50% were physically immature and 50% were physically mature, as other workers have done. The physically immature are those with unfused epiphyses in the four regions, and those where fusion has started in 1, 2 or 3 regions. Female sperm whales of the SEP attain physical maturity at an average length of 11.2m (Figure 16).
To calculate the age at physical maturity we used the teeth of 125 whales where the ages were determined. In older whales some growth layers of the dentine were worn out and they were lost for counting, so those teeth were marked with one, two or three + signs, each sign representing 4yrs of age (Clarke et al., 1994). Therefore the ages considered here are minimum ages. In Figure 17 the age where the proportion of physically immature and physically mature whales are the same is at 33.5yrs, the age at which we consider the female sperm whales of the SEP attain physical maturity. The length at physical maturity of female sperm whales from this area
Table 34. Condition of the epiphyses as representing stages of physical maturity in the vertebral column of all female sperm whales examined in the SEP.
Condition of Anterior Posterior Lumbar Caudal State of epiphysis thoracic thoracic maturity No. % No. % No. % No. % No. %Thin cartilage 437 39.3% 405 36.8% 314 31.3% 331 29.6% Moderate Immaturecartilage 252 22.7% 292 26.6% 318 31.7% 308 27.6% 916 84.20% Thick cartilage 250 22.5% 256 23.3% 234 23.3% 284 25.4% One or more Maturingfused 26 2.3% 14 1.3% 13 1.3% 38 3.4% 54 4.96% in up to 3 regions Fused in all Mature4 regions 146 13.1% 133 12.1% 125 12.5% 157 14.0% 118 10.85% Total number 1111 1100 1004 1118 4333of vertebrae
Total number 1088of whales
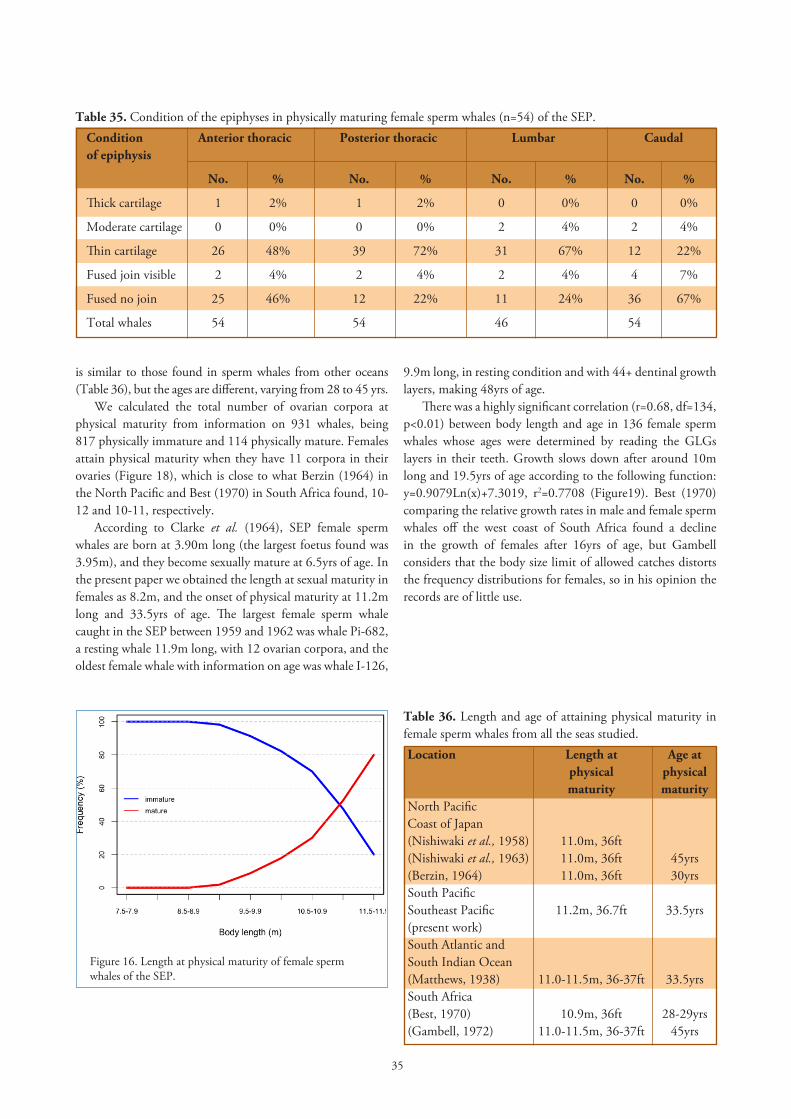
35
is similar to those found in sperm whales from other oceans (Table 36), but the ages are different, varying from 28 to 45 yrs.
We calculated the total number of ovarian corpora at physical maturity from information on 931 whales, being 817 physically immature and 114 physically mature. Females attain physical maturity when they have 11 corpora in their ovaries (Figure 18), which is close to what Berzin (1964) in the North Pacific and Best (1970) in South Africa found, 10-12 and 10-11, respectively.
According to Clarke et al. (1964), SEP female sperm whales are born at 3.90m long (the largest foetus found was 3.95m), and they become sexually mature at 6.5yrs of age. In the present paper we obtained the length at sexual maturity in females as 8.2m, and the onset of physical maturity at 11.2m long and 33.5yrs of age. The largest female sperm whale caught in the SEP between 1959 and 1962 was whale Pi-682, a resting whale 11.9m long, with 12 ovarian corpora, and the oldest female whale with information on age was whale I-126,
Table 35. Condition of the epiphyses in physically maturing female sperm whales (n=54) of the SEP.Condition Anterior thoracic Posterior thoracic Lumbar Caudal of epiphysis
No. % No. % No. % No. %
Thick cartilage 1 2% 1 2% 0 0% 0 0%
Moderate cartilage 0 0% 0 0% 2 4% 2 4%
Thin cartilage 26 48% 39 72% 31 67% 12 22%
Fused join visible 2 4% 2 4% 2 4% 4 7%
Fused no join 25 46% 12 22% 11 24% 36 67%
Total whales 54 54 46 54
9.9m long, in resting condition and with 44+ dentinal growth layers, making 48yrs of age.
There was a highly significant correlation (r=0.68, df=134, p<0.01) between body length and age in 136 female sperm whales whose ages were determined by reading the GLGs layers in their teeth. Growth slows down after around 10m long and 19.5yrs of age according to the following function: y=0.9079Ln(x)+7.3019, r2=0.7708 (Figure19). Best (1970) comparing the relative growth rates in male and female sperm whales off the west coast of South Africa found a decline in the growth of females after 16yrs of age, but Gambell considers that the body size limit of allowed catches distorts the frequency distributions for females, so in his opinion the records are of little use.
Figure 16. Length at physical maturity of female sperm whales of the SEP.
Table 36. Length and age of attaining physical maturity in female sperm whales from all the seas studied.Location
North PacificCoast of Japan(Nishiwaki et al., 1958)(Nishiwaki et al., 1963)(Berzin, 1964)South PacificSoutheast Pacific(present work)South Atlantic andSouth Indian Ocean(Matthews, 1938)South Africa(Best, 1970)(Gambell, 1972)
Length atphysicalmaturity
11.0m, 36ft11.0m, 36ft11.0m, 36ft
11.2m, 36.7ft
11.0-11.5m, 36-37ft
10.9m, 36ft11.0-11.5m, 36-37ft
Age atphysicalmaturity
45yrs30yrs
33.5yrs
33.5yrs
28-29yrs45yrs
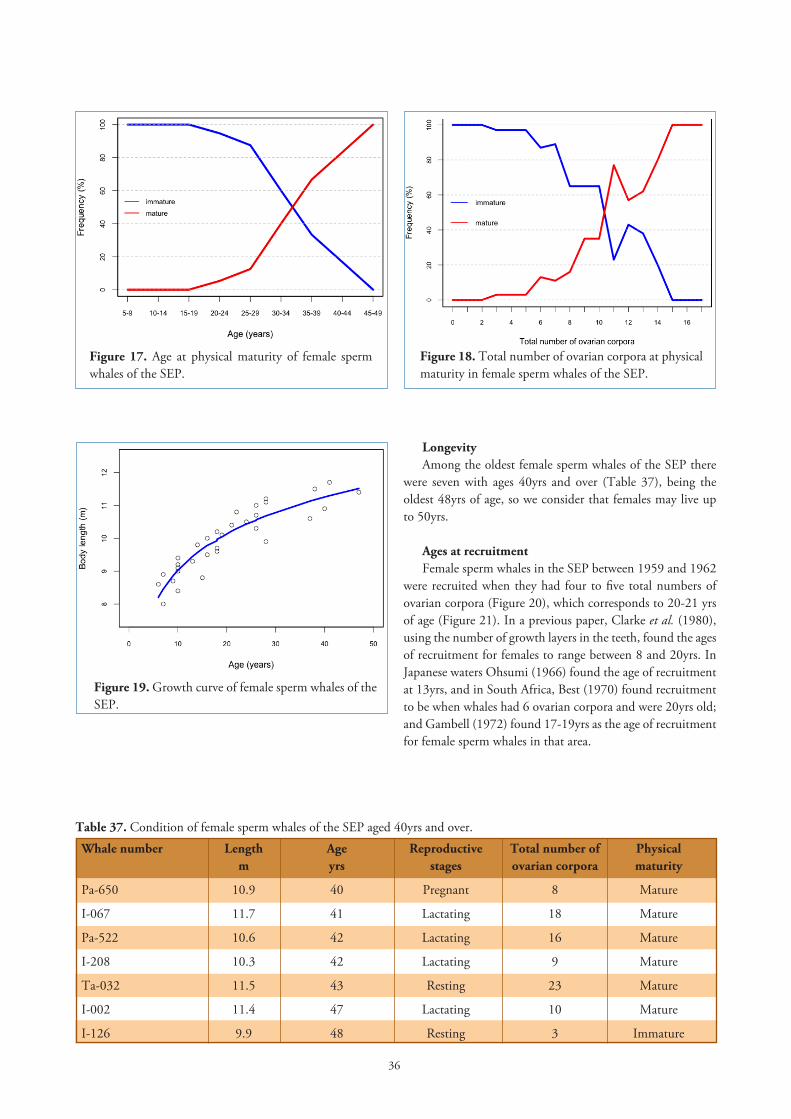
36
Table 37. Condition of female sperm whales of the SEP aged 40yrs and over.
Whale number Length Age Reproductive Total number of Physical m yrs stages ovarian corpora maturity
Pa-650 10.9 40 Pregnant 8 Mature
I-067 11.7 41 Lactating 18 Mature
Pa-522 10.6 42 Lactating 16 Mature
I-208 10.3 42 Lactating 9 Mature
Ta-032 11.5 43 Resting 23 Mature
I-002 11.4 47 Lactating 10 Mature
I-126 9.9 48 Resting 3 Immature
Figure 17. Age at physical maturity of female sperm whales of the SEP.
Figure 18. Total number of ovarian corpora at physical maturity in female sperm whales of the SEP.
Figure 19. Growth curve of female sperm whales of the SEP.
LongevityAmong the oldest female sperm whales of the SEP there
were seven with ages 40yrs and over (Table 37), being the oldest 48yrs of age, so we consider that females may live up to 50yrs.
Ages at recruitmentFemale sperm whales in the SEP between 1959 and 1962
were recruited when they had four to five total numbers of ovarian corpora (Figure 20), which corresponds to 20-21 yrs of age (Figure 21). In a previous paper, Clarke et al. (1980), using the number of growth layers in the teeth, found the ages of recruitment for females to range between 8 and 20yrs. In Japanese waters Ohsumi (1966) found the age of recruitment at 13yrs, and in South Africa, Best (1970) found recruitment to be when whales had 6 ovarian corpora and were 20yrs old; and Gambell (1972) found 17-19yrs as the age of recruitment for female sperm whales in that area.
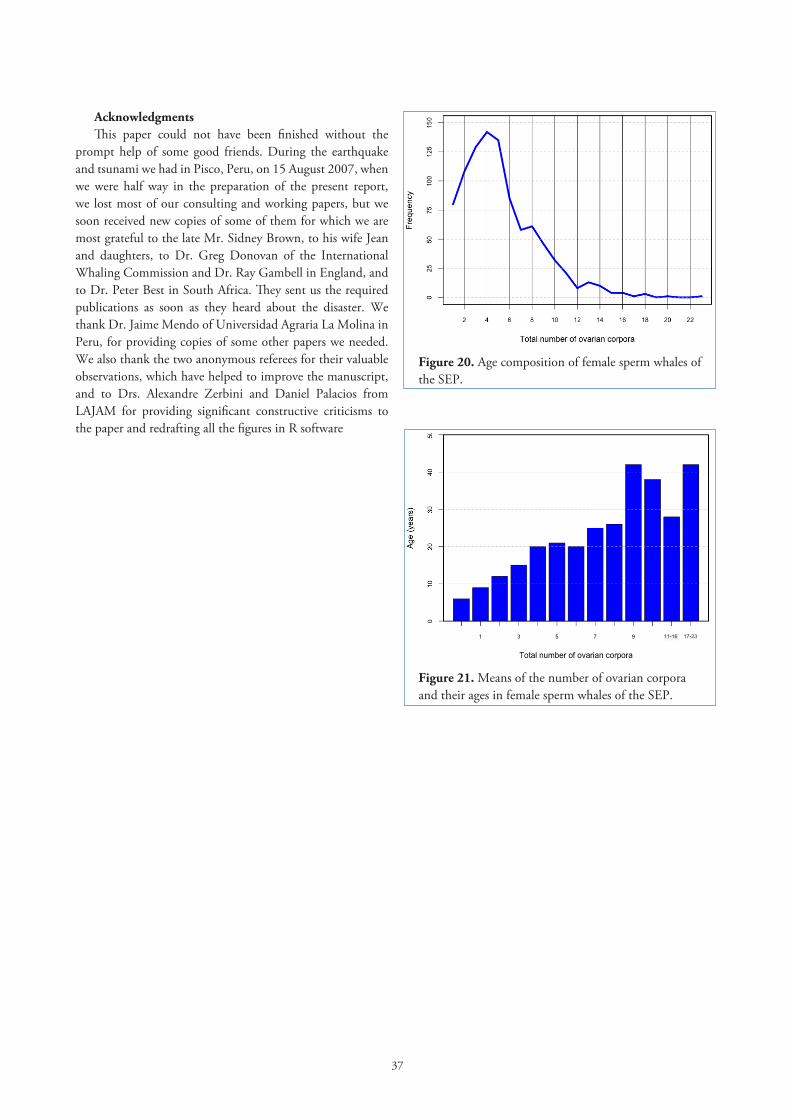
37
AcknowledgmentsThis paper could not have been finished without the
prompt help of some good friends. During the earthquake and tsunami we had in Pisco, Peru, on 15 August 2007, when we were half way in the preparation of the present report, we lost most of our consulting and working papers, but we soon received new copies of some of them for which we are most grateful to the late Mr. Sidney Brown, to his wife Jean and daughters, to Dr. Greg Donovan of the International Whaling Commission and Dr. Ray Gambell in England, and to Dr. Peter Best in South Africa. They sent us the required publications as soon as they heard about the disaster. We thank Dr. Jaime Mendo of Universidad Agraria La Molina in Peru, for providing copies of some other papers we needed. We also thank the two anonymous referees for their valuable observations, which have helped to improve the manuscript, and to Drs. Alexandre Zerbini and Daniel Palacios from LAJAM for providing significant constructive criticisms to the paper and redrafting all the figures in R software
Figure 21. Means of the number of ovarian corpora and their ages in female sperm whales of the SEP.
Figure 20. Age composition of female sperm whales of the SEP.
11-16 17-23
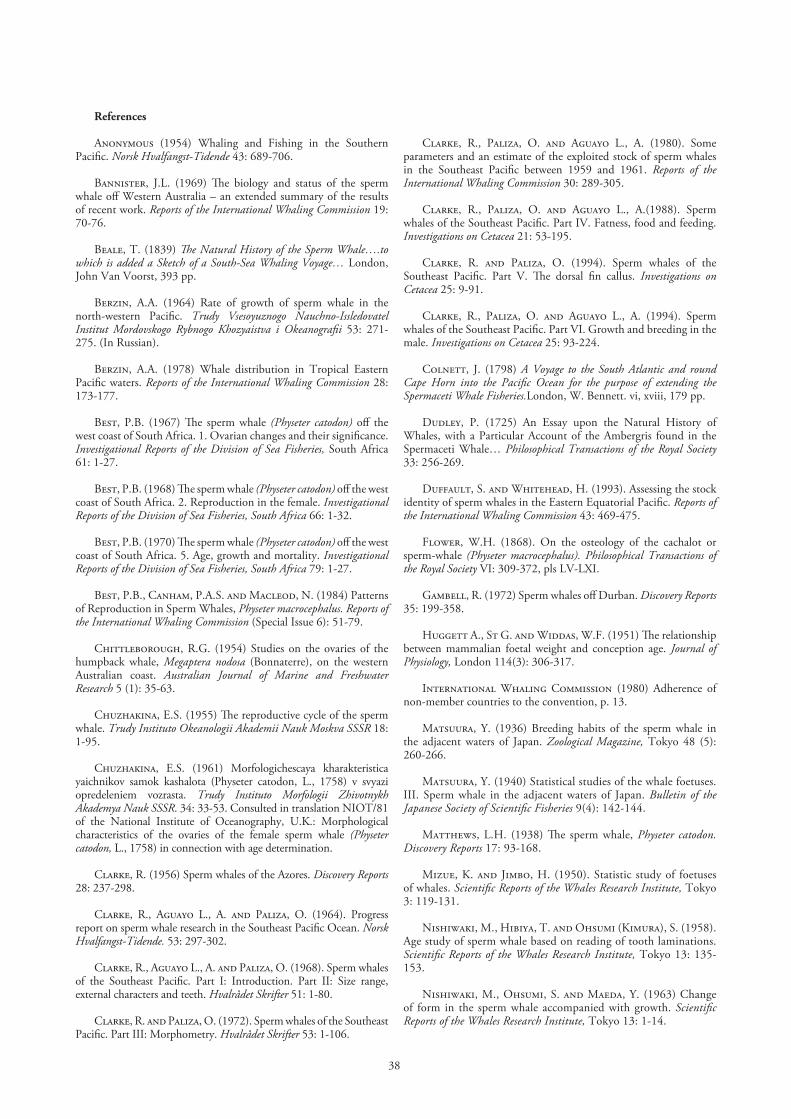
38
References
Anonymous (1954) Whaling and Fishing in the Southern Pacific. Norsk Hvalfangst-Tidende 43: 689-706.
Bannister, J.L. (1969) The biology and status of the sperm whale off Western Australia – an extended summary of the results of recent work. Reports of the International Whaling Commission 19: 70-76.
Beale, T. (1839) The Natural History of the Sperm Whale….to which is added a Sketch of a South-Sea Whaling Voyage… London, John Van Voorst, 393 pp.
Berzin, A.A. (1964) Rate of growth of sperm whale in the north-western Pacific. Trudy Vsesoyuznogo Nauchno-Issledovatel Institut Mordovskogo Rybnogo Khozyaistva i Okeanografii 53: 271-275. (In Russian).
Berzin, A.A. (1978) Whale distribution in Tropical Eastern Pacific waters. Reports of the International Whaling Commission 28: 173-177.
Best, P.B. (1967) The sperm whale (Physeter catodon) off the west coast of South Africa. 1. Ovarian changes and their significance. Investigational Reports of the Division of Sea Fisheries, South Africa 61: 1-27.
Best, P.B. (1968) The sperm whale (Physeter catodon) off the west coast of South Africa. 2. Reproduction in the female. Investigational Reports of the Division of Sea Fisheries, South Africa 66: 1-32.
Best, P.B. (1970) The sperm whale (Physeter catodon) off the west coast of South Africa. 5. Age, growth and mortality. Investigational Reports of the Division of Sea Fisheries, South Africa 79: 1-27.
Best, P.B., Canham, P.A.S. and Macleod, N. (1984) Patterns of Reproduction in Sperm Whales, Physeter macrocephalus. Reports of the International Whaling Commission (Special Issue 6): 51-79.
Chittleborough, R.G. (1954) Studies on the ovaries of the humpback whale, Megaptera nodosa (Bonnaterre), on the western Australian coast. Australian Journal of Marine and Freshwater Research 5 (1): 35-63.
Chuzhakina, E.S. (1955) The reproductive cycle of the sperm whale. Trudy Instituto Okeanologii Akademii Nauk Moskva SSSR 18: 1-95.
Chuzhakina, E.S. (1961) Morfologichescaya kharakteristica yaichnikov samok kashalota (Physeter catodon, L., 1758) v svyazi opredeleniem vozrasta. Trudy Instituto Morfologii Zhivotnykh Akademya Nauk SSSR. 34: 33-53. Consulted in translation NIOT/81 of the National Institute of Oceanography, U.K.: Morphological characteristics of the ovaries of the female sperm whale (Physeter catodon, L., 1758) in connection with age determination.
Clarke, R. (1956) Sperm whales of the Azores. Discovery Reports 28: 237-298.
Clarke, R., Aguayo L., A. and Paliza, O. (1964). Progress report on sperm whale research in the Southeast Pacific Ocean. Norsk Hvalfangst-Tidende. 53: 297-302.
Clarke, R., Aguayo L., A. and Paliza, O. (1968). Sperm whales of the Southeast Pacific. Part I: Introduction. Part II: Size range, external characters and teeth. Hvalrådet Skrifter 51: 1-80.
Clarke, R. and Paliza, O. (1972). Sperm whales of the Southeast Pacific. Part III: Morphometry. Hvalrådet Skrifter 53: 1-106.
Clarke, R., Paliza, O. and Aguayo L., A. (1980). Some parameters and an estimate of the exploited stock of sperm whales in the Southeast Pacific between 1959 and 1961. Reports of the International Whaling Commission 30: 289-305.
Clarke, R., Paliza, O. and Aguayo L., A.(1988). Sperm whales of the Southeast Pacific. Part IV. Fatness, food and feeding. Investigations on Cetacea 21: 53-195.
Clarke, R. and Paliza, O. (1994). Sperm whales of the Southeast Pacific. Part V. The dorsal fin callus. Investigations on Cetacea 25: 9-91.
Clarke, R., Paliza, O. and Aguayo L., A. (1994). Sperm whales of the Southeast Pacific. Part VI. Growth and breeding in the male. Investigations on Cetacea 25: 93-224.
Colnett, J. (1798) A Voyage to the South Atlantic and round Cape Horn into the Pacific Ocean for the purpose of extending the Spermaceti Whale Fisheries.London, W. Bennett. vi, xviii, 179 pp.
Dudley, P. (1725) An Essay upon the Natural History of Whales, with a Particular Account of the Ambergris found in the Spermaceti Whale… Philosophical Transactions of the Royal Society 33: 256-269.
Duffault, S. and Whitehead, H. (1993). Assessing the stock identity of sperm whales in the Eastern Equatorial Pacific. Reports of the International Whaling Commission 43: 469-475.
Flower, W.H. (1868). On the osteology of the cachalot or sperm-whale (Physeter macrocephalus). Philosophical Transactions of the Royal Society VI: 309-372, pls LV-LXI.
Gambell, R. (1972) Sperm whales off Durban. Discovery Reports 35: 199-358.
Huggett A., St G. and Widdas, W.F. (1951) The relationship between mammalian foetal weight and conception age. Journal of Physiology, London 114(3): 306-317.
International Whaling Commission (1980) Adherence of non-member countries to the convention, p. 13.
Matsuura, Y. (1936) Breeding habits of the sperm whale in the adjacent waters of Japan. Zoological Magazine, Tokyo 48 (5): 260-266.
Matsuura, Y. (1940) Statistical studies of the whale foetuses. III. Sperm whale in the adjacent waters of Japan. Bulletin of the Japanese Society of Scientific Fisheries 9(4): 142-144.
Matthews, L.H. (1938) The sperm whale, Physeter catodon. Discovery Reports 17: 93-168.
Mizue, K. and Jimbo, H. (1950). Statistic study of foetuses of whales. Scientific Reports of the Whales Research Institute, Tokyo 3: 119-131.
Nishiwaki, M., Hibiya, T. and Ohsumi (Kimura), S. (1958). Age study of sperm whale based on reading of tooth laminations. Scientific Reports of the Whales Research Institute, Tokyo 13: 135-153.
Nishiwaki, M., Ohsumi, S. and Maeda, Y. (1963) Change of form in the sperm whale accompanied with growth. Scientific Reports of the Whales Research Institute, Tokyo 13: 1-14.
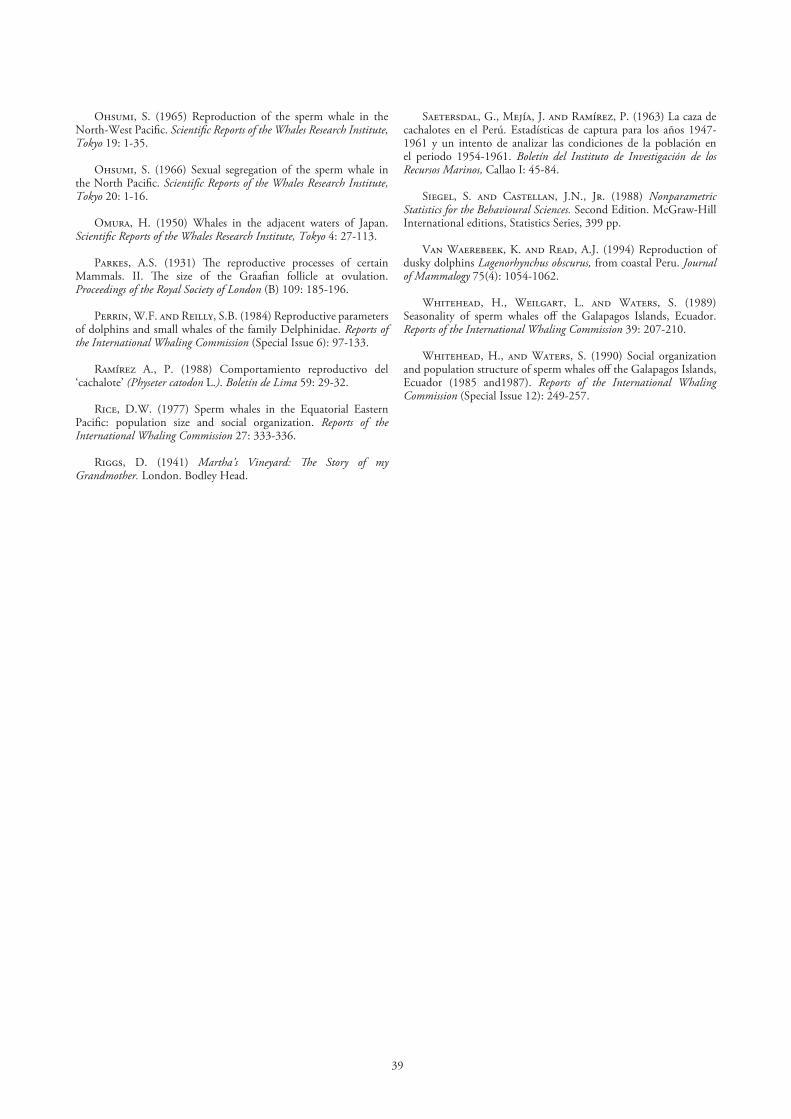
39
Ohsumi, S. (1965) Reproduction of the sperm whale in the North-West Pacific. Scientific Reports of the Whales Research Institute, Tokyo 19: 1-35.
Ohsumi, S. (1966) Sexual segregation of the sperm whale in the North Pacific. Scientific Reports of the Whales Research Institute, Tokyo 20: 1-16.
Omura, H. (1950) Whales in the adjacent waters of Japan. Scientific Reports of the Whales Research Institute, Tokyo 4: 27-113.
Parkes, A.S. (1931) The reproductive processes of certain Mammals. II. The size of the Graafian follicle at ovulation. Proceedings of the Royal Society of London (B) 109: 185-196.
Perrin, W.F. and Reilly, S.B. (1984) Reproductive parameters of dolphins and small whales of the family Delphinidae. Reports of the International Whaling Commission (Special Issue 6): 97-133.
Ramírez A., P. (1988) Comportamiento reproductivo del
‘cachalote’ (Physeter catodon L.). Boletín de Lima 59: 29-32.
Rice, D.W. (1977) Sperm whales in the Equatorial Eastern Pacific: population size and social organization. Reports of the International Whaling Commission 27: 333-336.
Riggs, D. (1941) Martha’s Vineyard: The Story of my Grandmother. London. Bodley Head.
Saetersdal, G., Mejía, J. and Ramírez, P. (1963) La caza de cachalotes en el Perú. Estadísticas de captura para los años 1947-1961 y un intento de analizar las condiciones de la población en el periodo 1954-1961. Boletín del Instituto de Investigación de los Recursos Marinos, Callao I: 45-84.
Siegel, S. and Castellan, J.N., Jr. (1988) Nonparametric Statistics for the Behavioural Sciences. Second Edition. McGraw-Hill International editions, Statistics Series, 399 pp.
Van Waerebeek, K. and Read, A.J. (1994) Reproduction of dusky dolphins Lagenorhynchus obscurus, from coastal Peru. Journal of Mammalogy 75(4): 1054-1062.
Whitehead, H., Weilgart, L. and Waters, S. (1989) Seasonality of sperm whales off the Galapagos Islands, Ecuador. Reports of the International Whaling Commission 39: 207-210.
Whitehead, H., and Waters, S. (1990) Social organization and population structure of sperm whales off the Galapagos Islands, Ecuador (1985 and1987). Reports of the International Whaling Commission (Special Issue 12): 249-257.