Embed Size (px)
Citation preview
Page 1 of 60
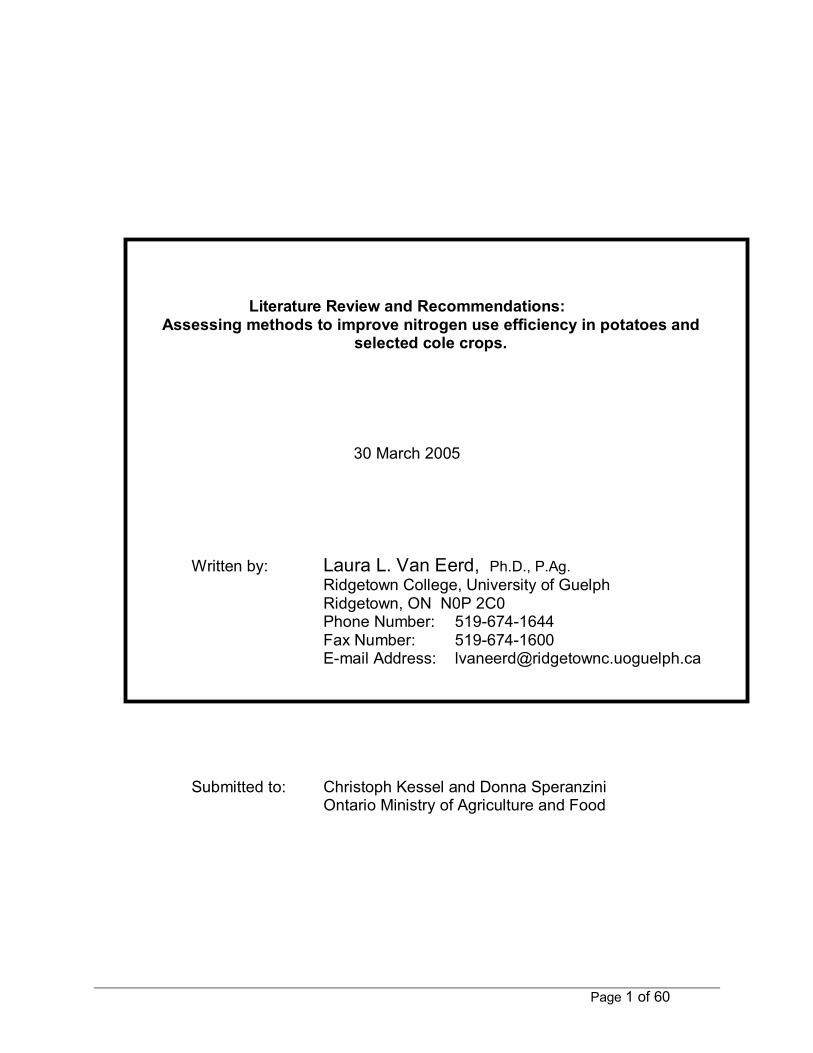
Literature Review and Recommendations: Assessing methods to improve nitrogen use efficiency in potatoes and
selected cole crops.
30 March 2005
Written by: Laura L. Van Eerd, Ph.D., P.Ag. Ridgetown College, University of Guelph Ridgetown, ON N0P 2C0 Phone Number: 519-674-1644 Fax Number: 519-674-1600 E-mail Address: [email protected]
Submitted to: Christoph Kessel and Donna Speranzini Ontario Ministry of Agriculture and Food
Page 2 of 60
1. EXECUTIVE SUMMARY Potato and cole crop nitrogen (N) fertility research and alternative nitrogen management strategies, such as optimizing N use efficiency (NUE) were reviewed. Best management practices (BMP) and current research needs were identified for Ontario production system which considers agronomic, economic, and environmental factors. There are many methods of calculating NUE but the crop, the harvested plant part, and the objectives of the research (i.e. soil versus crop focus) largely influences the appropriate NUE approach (Good et al. 2004). Generally, split N applications did not affect crop quality and provided little to no marketable yield advantage nor consistently improved NUE. There is very little evidence in the literature to suggest that N source, application timing, application method, or technology greatly improve NUE and/or minimize environmental N losses in potato or cole crop production. However, it may be possible to increase NUE through cultivar selection and breeding. For potatoes, BMPs which lower soil mineral N are preferred. Key to minimizing environmental N losses in cole crops is by implementing BMPs that capture mineral N as crop residues are mineralized. Current research needs among others include development and validation of a pre-sidedress N test (PSNT) and/or soil mineral N at planting to adjust N applications. The development of a vegetable production systems approach to optimizing NUE using different crop rotations should satisfy agronomic, economic, and environmental objectives.
Page 3 of 60
Table of Contents 1. EXECUTIVE SUMMARY .......................................................................................................................... 2
2. INTRODUCTION ....................................................................................................................................... 4
3. POTATOES................................................................................................................................................. 6 3.1. MANAGEMENT PRACTICES ....................................................................................................................... 6
3.1.1. Nitrogen source ............................................................................................................................... 7 3.1.2. Application timing ........................................................................................................................... 7
3.1.2.1. Impact on yield and crop quality.................................................................................................................. 7 3.1.2.2. Environmental impact................................................................................................................................. 7 3.1.2.3. Nitrogen use efficiency ............................................................................................................................... 8
3.1.3. Application methods ........................................................................................................................ 8 3.1.4. Technology...................................................................................................................................... 9
3.1.4.1. Formulations and other products.................................................................................................................. 9 3.1.5. Cultivar selection............................................................................................................................. 9
3.2. CONCLUSIONS ....................................................................................................................................... 11 3.3. RECOMMENDED BEST MANAGEMENT PRACTICES ..................................................................................... 12
4. COLE CROPS ........................................................................................................................................... 13 4.1. MANAGEMENT PRACTICES ..................................................................................................................... 13
4.1.1. Optimal N rates ............................................................................................................................. 13 4.1.1.1. Impact on yield..........................................................................................................................................13 4.1.1.2. Impact on crop quality ...............................................................................................................................14 4.1.1.3. Environmental impact................................................................................................................................15 4.1.1.4. Nitrogen use efficiency ..............................................................................................................................17
4.1.2. Nitrogen source ............................................................................................................................. 17 4.1.3. Application timing ......................................................................................................................... 18
4.1.3.1. Impact on yield and crop quality.................................................................................................................18 4.1.3.2. Environmental impact................................................................................................................................19 4.1.3.3. Nitrogen use efficiency ..............................................................................................................................19
4.1.4. Application methods ...................................................................................................................... 19 4.1.4.1. Impact on yield and crop quality.................................................................................................................19 4.1.4.2. Environmental impact................................................................................................................................20 4.1.4.3. Nitrogen use efficiency ..............................................................................................................................21
4.1.5. Technology.................................................................................................................................... 21 4.1.5.1. Pre-sidedress soil N test (PSNT).................................................................................................................21 4.1.5.2. Petiole sap quick tests ................................................................................................................................21 4.1.5.3. Fertigation.................................................................................................................................................22 4.1.5.4. Formulations and other products.................................................................................................................23 4.1.5.5. Modeling N uptake ....................................................................................................................................24
4.1.6. Cultivar selection........................................................................................................................... 24 4.2. CONCLUSIONS ....................................................................................................................................... 26 4.3. RECOMMENDED BEST MANAGEMENT PRACTICES ..................................................................................... 27
5. RECOMMENDED FUTURE RESEARCH.............................................................................................. 29 5.1. POTATOES ............................................................................................................................................. 30 5.2. COLE CROPS .......................................................................................................................................... 30
6. GENERAL CONCLUSIONS .................................................................................................................... 32
7. ABBREVIATIONS USED......................................................................................................................... 33
8. ACKNOWLEDGEMENTS....................................................................................................................... 33
9. REFERENCES .......................................................................................................................................... 33
Page 4 of 60
2. INTRODUCTION The intensification of agricultural production and increased pressure from society to protect consumers and the environment has facilitated the development of new Ontario legislation regarding nutrient management and drinking water source protection. As new nutrient management plans require producers to strictly adhere to provincial guidelines for nutrient applications, it may be more critical to match soil nitrate-nitrogen (NO3-N) with crop demand throughout the season in order to maintain crop yields and minimize environmental loss through leaching. Ontario vegetable producers have been relatively slow to modify nitrogen (N) fertilizer production practices according to nitrogen use efficiency (NUE) because of the need to validate and interpret scientific literature results in a manner that is useful to producers. Generally, much of the previous vegetable production research relied heavily on an agronomic and economic objective with little regard for the environment or nutrient use efficiency (Beegle et al. 2000). Clearly all these issues must be properly addressed if progress is to be made with respect to the development of best management practices (BMP) that improve the crop’s utilization of applied nutrients and/or bring about a reduction in the potential losses of nutrients to the environmental. For example, in Ontario cabbage studies, yield losses were estimated as high as $6,000 ha-1 between calculated yields at the most economic rate of N (MERN) and yields based on Ontario Ministry of Agriculture and Food (OMAF) recommended N rates (O'Halloran 1998a). Regrettably, higher N application rates for cabbage drastically reduced the overall NUE (< 30%) of the crop. Moreover, residual N left in the field after harvest often exceeded 200 kg N ha-1. If, in order to maintain crop yields and/or quality, these production systems require high N applications, which concomitantly results in excessive N losses, then the development of alternative management strategies will be crucial. These practices may include modifying nitrogen sources (urea, ammonium nitrate, calcium ammonium nitrate, calcium nitrate, etc), application timing (preplant vs split), application methods (broadcast, banded, incorporated, fertigation etc.), and/or technology (nitrification and urease inhibitors, soil and plant NO3-N quick tests). Moreover, the rate at which fertilizer N transformations occur in the soil after application can be altered by a variety of products and fertilizer formulations (e.g. urease inhibitors, nitrification inhibitors, slow release fertilizer formulations such as sulphur-coated, polymers etc.). There is potential that these technologies may offer increased yields and/or crop quality with less fertilizer applied and optimize NUE, thereby potentially minimizing environmental N losses. There has been significant research on the impact of different production practices on NUE worldwide. But the accuracy and understanding of this research from an Ontario vegetable production perspective needs to be critically evaluated in order to make BMP recommendations to Ontario potato and cole crop producers. There are many different definitions and methods for determining NUE and other related NUE indices (Table 1). There are four main differences in these calculations, which include: 1) inclusion of a zero N or low N control for comparisons and analysis or not, 2)
Page 5 of 60
estimates of soil supplied N compared to only N fertilizer applied, 3) plant weight versus yield weight and 4) plant or yield weights versus plant or yield N content. Often, NUE is the product of N uptake efficiency (NUpE) and N utilization efficiency (NUtE) (Table 1). Undoubtedly, the crop, the harvested portion, and the objectives of the research (soil versus crop focus) largely influences the appropriate NUE approach (Good et al. 2004). It is important to improve NUE and nutrient use efficiency of crop plants because of the economic costs of fertilization and the potential environmental damage of excessive fertilization (Good et al. 2004). However, it is critical that increases in nutrient use efficiency are not made at the expense of crop yield. If the global population reaches its estimated 9.1 billion people, there will be increased pressure to feed the world. Improving nutrient use efficiency may be one component of reaching this goal (Good et al. 2004) or it may adversely affect food production (Raun and Johnson 1999). This literature review analyzes scientific and grey literature from Ontario and other homoclimes and soil types on the effectiveness of different management practices to improve NUE in cole crops and potatoes. Moreover, the report provides recommendations on BMPs for Ontario potato and cole crop producers to minimize environmental N losses while maintaining crop yields and quality, which is especially important on sensitive soil hydrologic groups. It is anticipated that these recommended BMPs will meet the objectives of the public good with respect to soil, water and air quality while ensuring the Ontario agri-food sector remains sustainable and competitive on the global market. Finally, this literature review highlights areas where Ontario scientific research is warranted and which management practices should be further researched, developed and/or demonstrated.
Page 6 of 60
3. POTATOES
3.1. Management practices Generally, in potato, NUE decreases as the amount of available N increases (Kleinkopf et al. 1981) (Table 2 and 3). Overall, NUE (≈36%) did not vary with N application level (applied as a 1:1 split), genotype, or cropping year (Zvomuya et al. 2002). Increases in fertilizer N applications had no effect on vine N concentration (2.16%), but did linearly increase tuber N concentrations from 1.1% to 1.6% (Zvomuya et al. 2002). Moreover, N uptake in vines and tubers increased linearly as N application level increased (Zvomuya et al. 2002). However, yield increased with N rate in only one of two years. This research illustrates the difficulty of consistently improving overall NUE. In typical commercial New Brunswick potato fields, there was considerable variation in soil inorganic N available at planting between field and among years in the same field (Zebarth et al. 2003). For example, at planting, soil NO3-N ranged from 2 to 124 kg N ha-1 and soil NH4-N from 3 to 64 kg N ha-1 (Zebarth et al. 2003). The inorganic N at planting was either fertilizer N remaining from the previous crop or from nitrification during the spring (Zebarth et al. 2003); however it is difficult to estimate the proportion of fertilizer N. There was also large variation in potential losses of soil inorganic N between growing seasons (over the winter), which was highly dependent on precipitation and temperature (Zebarth et al. 2003). For example, spring soil NO3-N was between 3% to 100% of the NO3-N measured in the same field at harvest in the previous year (Zebarth et al. 2003). Therefore, assuming no nitrification between harvest and spring, there was between 0% to 97% losses in NO3-N. Fortunately, depending on the year only 12%, 19%, and 24% of all fields tested had NO3-N levels in excess of 100 kg N ha-1 at harvest (Zebarth et al. 2003). These fields tended to have high fertilization rates (≥200 kg N ha-1), but this was not true for all fields. Moreover, in a different study in Atlantic Canada the amount of mineral N accumulated in the nontreated plots (i.e. no fertilizer applied) was between 49 and 113 kg N ha-1 (Zebarth and Milburn 2003). Thus, in Atlantic Canada potato production, there was great variation in soil inorganic N at planting and at harvest and likewise high variation in potential environmental losses. It is very conceivable that similar variation NO3-N levels exist in Ontario, which illustrates the challenge of developing N fertilization recommendations and BMPs for all of Ontario. Residual soil N at harvest is generally considered available for loss over the fall and winter. However, there can be a high level of variation in the amount of N loss over this time period. For instance, N differences between winter and spring soil N levels on the same location over two winters was between 3.4 and 20.3% (Li et al. 1999). There was no corresponding increase in mineral N at deeper depths which suggests that either 1) the NO3-N leached below the sampling depth of 100cm or 2) leaching was not the major pathway of mineral N loss. Moreover, percent change in mineral N was not directly related to the amount of fertilizer N applied. For example the two highest changes in at-harvest versus spring mineral N (28% and 53%) were observed at fertilizer N rates of 70
Page 7 of 60
and 210 kg N ha-1, respectively. Unfortunately, N crop uptake and removal numbers were not obtained in this study (Li et al. 1999).
3.1.1. Nitrogen source To the best of author’s knowledge, there was no published literature on the effect of synthetic N source (urea, ammonium nitrate, calcium ammonium nitrate, calcium nitrate, etc) on potato NUE. Of the research summarized in Table 1, the majority (9 out of 17 manuscripts) of NUE research used ammonium nitrate as the N source. Furthermore, in 4 manuscripts, more than one N source was used in the experimental design, which suggests the authors’ perception that N source has little impact on NUE.
3.1.2. Application timing
3.1.2.1. Impact on yield and crop quality In one of three experiments, the split application (112 kg N ha-1) increased potato yield compared to a single application at planting (Joern and Vitosh 1995a). In a different study, in seasons with adequate rain-fed soil moisture, split applications had similar tuber size distribution and processing quality compared to preplant applications (Zebarth et al. 2004a; 2004b). In dry years, the split applications reduced tuber yield and size compared to preplant applications (Zebarth et al. 2004a; 2004b). Reducing N application levels at planting did not affect total yield but did lower culls and small sized tubers and increased larger tubers (Errebhi et al. 1998a). The observed lack of yield response to the split application in some studies (Li et al. 2003; 1999) was a result of the split application rate (140 kg N ha-1) being higher than the optimal N rate (70 kg N ha-1). Therefore one would not expect a yield advantage of applying more N above the optimal N fertilization. Overall, split N applications did not affect crop quality and had no consistent marketable yield advantage (Li et al. 2003; 1999; Vos 1997, 1999; Zebarth et al. 2004a; 2004b; Zebarth and Milburn 2003).
3.1.2.2. Environmental impact If heavy rainfall and/or excessive irrigation occur early in the season, application of high amounts of N at planting could lead to significant NO3-N leaching, even if the same total amount of N is applied throughout the season (Errebhi et al. 1998a). There was up to 50 days between planting and rapid crop N uptake, under typical New Brunswick conditions (Zebarth and Milburn 2003) during which the risk for NO3-N loss would be high. The actual loss of NO3-N during this time was dependent on weather, particularly excessive rainfall events. In fact, during the growing season, there was little evidence of NO3-N leaching (Zebarth and Milburn 2003). In fact, most NO3-N leaching in Atlantic Canada occurs in the fall and winter, which is similar to Ontario. Despite differences in fertilizer applied (0-200 kg N ha-1) and the timing of N applications, in two of three years of study, there were no differences in plant N accumulation or residual inorganic soil N at harvest (Zebarth et al. 2004a). Similarly, in one of two years of study, residual NO3-N at harvest was the same regardless of the
Page 8 of 60
amount of N fertilizer (0 - 135 kg N ha-1) applied at planting (Errebhi et al. 1998a). Therefore, in these studies there was no environmental benefit of split applications when the same total amount of N fertilizer was applied because splitting application just delayed when the losses could occur. It is likely that similar results would be observed in Ontario. Split applications had higher residual soil inorganic N at harvest compared to the equivalent amount of fertilizer N applied at planting (Li et al. 2003). Considering that tuber yield, plant N accumulation, and NUE were not different based on application timing (Li et al. 2003), the split application had either less N losses or immobilization during the growing season. Nevertheless, after harvest NO3-N would be susceptible to losses in the fall and winter. Therefore, because split applications do not increase plant N uptake (i.e. N removal from the soil), split applications only delay the potential risk of N loss to the fall/winter versus the spring for preplant N applications. Experiments with 15N-depleted fertilizer allow for the determination of what percentage of soil and plant N was derived from the fertilizer. In Michigan, regardless of timing and application amount, approximately 30-40% of applied 15N was not recovered and could have been in other plants or lost via leaching below 120cm, denitrification, and/or runoff (Joern and Vitosh 1995b). At harvest, approximately 27% of the applied 15N was found in the soil, most in the top 30cm. Moreover, >90% of 15N observed in the soil was in the organic form, regardless of fertilizer application timing and/or the amount applied. Most N studies do not have the ability to estimate N immobilization and organic N; therefore in calculated N budgets, unaccounted for N was assumed lost to the environment. Therefore, many studies may be overestimating the potential environmental losses of fertilizer N. It is possible that unaccounted for N could actually be immobilized and not immediately susceptible to leaching or denitrification. A specific portion of fertilizer 15N was immobilized into an organic form, regardless of timing and application N level (Joern and Vitosh 1995b).
3.1.2.3. Nitrogen use efficiency The N application amount and timing did not influence NUpE nor N partitioning in the plant (Joern and Vitosh 1995b). In a different study, in two of four years, crop N uptake and removal either increased by 10% or was not different in the split compared to preplant applications (Vos 1997, 1999). In one of two years of another study, total plant N accumulation decreased and NUE increased with reduced preplant N rates (Errebhi et al. 1998a). In other studies, no increase in NUE was observed with split application compared to preplant applications (Joern and Vitosh 1995a, 1995b; Li et al. 2003; 1999). Therefore, split applications did not consistently increase NUE in potato production.
3.1.3. Application methods According to common management practices, most (15 out of 17) NUE studies characterized in Tables 2-3 were banded N applications. No potato research was found in the literature which investigated the effect of different application methods on NUE.
Page 9 of 60
3.1.4. Technology
3.1.4.1. Formulations and other products The impact of a non-ionic surfactant on increasing NUE was evaluated based on the premise that the surfactant would minimize the presence of a dry zone in the potato hill and thus facilitate N uptake throughout the growing season (Kelling et al. 2003). There was no difference between nontreated and surfactant-treated plots with respect to total yield and US#1 yield. In one of the two years, crop N removal (i.e. tuber N content) and NUE were higher with surfactant compare to no surfactant, but only at the two higher N application rates (202 and 269 kg N ha-1). There may be potential to use non-ionic surfactants to increase N crop recovery (Kelling et al. 2003), however results were variable in the two year study. The use of nitrification inhibitors, such as nitrapyrin and dicyandiamide, and slow release N fertilizers, such as isobutylidene did not increase marketable tuber yield on irrigated sandy soil (Hendrickson et al. 1978; Martin et al. 1993), except in a year where rapid leaching of soil N was observed (Martin et al. 1993). Although soil NH4-N and NO3-N values were not determined, it was assumed that increased yield was a result of reduced NO3-N leaching (Martin et al. 1993). The use of nitrapyrin, a nitrification inhibitor, on irrigated loamy sand soil caused a predominance of NH4-N, which likely interfered with plant metabolism and reduced both total and marketable tuber yield (Hendrickson et al. 1978). Similarly, greenhouse grown potatoes yielded lower when fed 100% NH4-N compared to 100% NO3-N or 50% split (Serio et al. 2004). Moreover, on sandy soil with high porosity and low organic matter, nitrapyrin persistence was likely limited due to volatilization and hydrolysis under high temperatures (Hendrickson et al. 1978). Thus, although nitrification inhibitors reduce NO3-N soil levels and potential leaching, the negative impact on yield limits the adoption of this technology. Preplant application of polyolefin-coated urea (POCU) increased marketable yield by 3.3 tonne ha-1 compared to split application (1:1 planting:hilling) of urea (Zvomuya and Rosen 2001). Unfortunately, preplant application of urea was not conducted (Zvomuya and Rosen 2001), therefore a direct comparison of POCU and urea N source on potato yield was not possible because the experiment was confounded by application timing. Regardless, due to the expense of POCU net return was better for the split urea application despite lower yields (Zvomuya and Rosen 2001).
3.1.5. Cultivar selection Potato cultivars responded differently to N and have different optimal N application rates (Arsenault and Malone 1999). Early-maturing potato cultivars have lower NUE, NUtE (Zebarth et al. 2004c), and plant N uptake (Zvomuya et al. 2002) than mid-season or late-maturing cultivars. Despite differences in these NUE indices, soil NO3-N at harvest varied with cultivars but did not relate to date of maturity (Zebarth et al. 2003; 2004c). In an other study, although there were differences among early- or mid-season cultivars versus late-maturing cultivars with respect to NUE and yield, the trends were not consistent for the date of maturity (Kleinkopf et al. 1981). For some cultivars NUE was
Page 10 of 60
extremely variable depending on the growing season and for other cultivars NUE was relatively consistent (Errebhi et al. 1999). Overall, there was more variation in NUE between years compared to differences between cultivars and/or maturation (Zebarth et al. 2004c). Differences in NUE were observed in cultivars based on factors other than the length of maturity. The NUE of a cultivar can change considerably with different fertilization levels. The ‘NewLeaf Superior’ clone had a higher NUE and yield at lower N fertilization compared to ‘Superior’ (Zvomuya and Rosen 2002). In contrast, at higher N fertilization levels, ‘NewLeaf Superior’ had lower NUE and yield compared to ‘Superior’. It is clearly possible to increase NUE through cultivar selection and breeding (Errebhi et al. 1999; Errebhi et al. 1998b; Kleinkopf et al. 1981; Zebarth et al. 2004c; Zvomuya and Rosen 2002; Zvomuya et al. 2002). However, NUE varies greatly with growing season (Errebhi et al. 1999; Zebarth et al. 2004c), fertilization level (Zvomuya and Rosen 2002), and cultivar/clone (Kleinkopf et al. 1981). Given this and the observation that soil inorganic N concentrations at harvest did not relate to NUE or maturation (Zebarth et al. 2003; 2004c), it is unlikely that NUE is an appropriate tool for determining optimal N fertilization levels or for the prevention of environmental losses.
Page 11 of 60
3.2. Conclusions Application timing and method, N source and different technologies do not consistently increase NUE, improve yields, or minimize environmental losses. Overall, in the literature, there was very little variation in crop N uptake, removal and residue values (Table 3), which suggest little opportunity to improve NUE through crop N accumulation. The average NUE of data reported in Table 3 was 48% (standard error = 4.8). One method to estimate risk of environmental N loss was to compare crop N uptake or for an even more conservative estimate crop N removal, with fertilizer N application level. For example, there was only a 13 kg ha-1 difference between crop N removal and fertilization in potatoes with the optimum application of 134 kg N ha-1 (Tyler et al. 1983). Based on data presented in Table 3, only 6 out of 27 reported values had a difference between N fertilizer application and crop N removal greater than 80 kg N ha-1. Moreover, there were an almost equal number of cases (7 out of 27) where crop N removal was greater than fertilizer applied. With an average crop removal of 3.1 kg N per tonne of yield at a potato yield of 40.7 t ha-1 and an N application rate of 175 kg N ha-1, the difference between N input and output was 50 kg N ha-1 (Table 3). There are a number of questions that arise. What is the acceptable level of N losses to the environment? What is the acceptable level based on? Is 50 kg N ha-1 acceptable? And how or does this acceptable level change with soil hydrological groups with high leaching potential? Is the risk the same for losses do to denitrification or leaching? Clear and defined answers to these questions must be provided as nutrient management legislation impacts potato producers.
Page 12 of 60
3.3. Recommended best management practices BMP 1. Application rate of 150-175 kg N ha-1. Based on the literature, this
review paper, and information provided in Tables 2 and 3, an N application rate of 150-175 kg N ha-1 is recommended, which should be banded at planting. This recommendation is similar to current OMAF recommendations of 135-200 kg N ha-1 for expected marketable yields of 25-30 t ha-1 (OMAF 2004-2005). However, if the expected yield is 15 t ha-1 then OMAF recommends 50 kg N ha-1. The recommended rate of 150 to 175 kg N ha-1 is based on optimizing yields and does not ensure environmental protection. Appropriate N rates with BMPs listed below may lower environmental risk under typical Ontario conditions.
BMP 2. Banded N application. It is standard practice to band N applications.
This was typically method used in the research reported. Therefore, all N applications should be banded on either side of the seed/plant.
BMP 3. Preplant or split application. There was little to no benefit to split N
application of the same amount of N fertilizer because split applications do not consistently 1) provide a yield benefit, 2) improve NUE, or 3) reduce NO3-N quantities at harvest. From a BMP perspective, the main potential environmental benefit of split applications would be if the second application was not applied, thereby reducing the total fertilizer application.
BMP 4. No advantage of N technology products. Despite the potential
benefit of the aforementioned technology (nitrification inhibitors, slow release formulations, etc.) in wet years, use of these products is not justified because of the added cost and limited yield advantage. Moreover, at the time of preplant N application, it is practically impossible to predict ‘wet’ years when these technologies may be the most beneficial.
BMP 5. Reduce N application for early maturing cultivars. Differences in
NUE and optimal N application levels between cultivars and date of maturity indicate that different N recommendations should be used (Kleinkopf et al. 1981). A general BMP of reducing N applications by up to 50 kg N ha-1 for early maturing varieties is recommended. The proposed BMP is similar to OMAF’s recommended 70 kg N ha-1 for early varieties grown on mineral soil (OMAF 2004-2005). No other districts recommend N application according to cultivar or date of maturity (Table 7). Functionally, the difference in application rates between cultivars of 50 kg N ha-1 would be insignificant in light of year to year variation in N response and compared to the accuracy with which N is applied. Moreocer, adoption of this BMP by producers may be limited.
Page 13 of 60
4. COLE CROPS
4.1. Management practices
4.1.1. Optimal N rates In North America, cole crop fertilizer recommendations were developed based on experimentation and experience and range from 61.5 – 336 kg N ha-1, with a mode of 111 and 224 kg N ha-1 for low and high recommendations, respectively (Table 8). In Europe, cole crop fertilizer recommendations in different countries are based on relatively simple look-up tables and experience to adjustments to N rates based on spring Nmin to complex computer models (Rahn et al. 2001a). Despite differences in complexity, based on different field characteristics, there was good agreement between different European countries in their recommended N fertilization level for cauliflower; the majority recommending between 200 and 250 kg N ha-1. Cole crop response to increasing N applications has been described by the following models: quadratic, quadratic plateau, linear, linear exponential, or linear plateau (see Tables 5 and 6). For cauliflower, the linear plateau best described and estimated optimal fertilizer applications of pooled and individual data from seven site-years (Everaarts and van den Berg 1996). The linear plateau model considers the linear relationship between optimum fertilizer application and Nmin at planting and the quantity of N applied above which yield does not increase (i.e. the plateau).
4.1.1.1. Impact on yield Undoubtedly, cole crop yields increased with increasing N fertilization rates (Table 5 and 6). In the majority of experiments, there was a linear response of yield to N rates (Table 5 and 6), which suggest that the experimental N rates tested were not high enough to inhibit growth and that cole crops are very tolerant of excessive N. For Ontario broccoli production, calculated MERN values were between 297 and 312 kg N ha-1 (Bakker 2005). Zebarth et al. (1995) estimated the most profitable N rates for broccoli were between 395 and 508 kg N ha-1 depending on the time of planting and the year. However, lowering N application rates to 244 – 302 kg N ha-1 reduced broccoli yields by 0.5-1 t ha-1, while providing acceptable residual NO3-N at harvest level of 100 kg N ha-1 (Zebarth et al. 1995). Under fertigation, maximum cauliflower yield of No. 1 grade curds maximized at 292 and 400 kg N ha-1 depending on the year (McKeown and Bakker 2005b). Unfortunately, total marketable yield was not reported. Typically smaller heads (i.e. lower grade heads) were observed with lower N rates (Lisiewska and Kmiecik 1996; Rather et al. 1999; Thompson et al. 2000a). Therefore, in McKeown and Bakker’s (2005b) research, one would expect that maximum total marketable yield for cauliflower would be observed at lower N rates compared to rates needed to obtain No. 1 grade heads.
Page 14 of 60
Optimal N fertilizer application for cauliflower production in the Netherlands was 224 – Nmin (0-60cm) kg N ha-1 (Everaarts and De Moel 1995). In one of two years there was no differences in cabbage yield (Westerveld et al. 2004). In the other year, the zero N treatment had lower yields compared to all other treatments. In both years, there were differences in petiole sap N concentrations but high yields in low and high N rates suggest adequate soil N was present regardless of N fertilization. In contrast, on a clay loam site MERN values for cabbage were obtained at 349-406 kg N ha-1, however, MERN values were lower on lighter soil due to fertilizer toxicity (O'Halloran 1997, 1998a, 1998b). With fertigation, maximum cabbage yield was obtained with the highest N rate tested, 400 kg N ha-1 (McKeown and Bakker 2005a). The aforementioned cabbage studies were all conducted in Simcoe, Ontario. Likely weather, soil N mineralization, and other factors contributed to the observed differences in cabbage N response. In British Columbia, cabbage yields were calculated to maximize at 635 and 609 kg N ha-1, depending on the year with MERN values estimated at 5 and 2 kg N ha-1 lower, respectively (Zebarth et al. 1991). Optimal N fertilizer application for cabbage production in the Netherlands was 330 – 1.5Nmin (0-60cm) kg N ha-1 (Everaarts and Booij 2000). Overall, the applicability of MERN analysis of cole crops and likewise in many other vegetable crops was limited due to the 1) low cost of nitrogen fertilizer relative to total production costs, 2) relatively large price for the crop, and 3) the large variation in price during and between seasons (Everaarts and De Moel 1995; Everaarts and van den Berg 1996). For the aforementioned reasons, in most cases (see Tables 5) the MERN was typically very close to N rates required for maximum yield.
4.1.1.2. Impact on crop quality Nitrogen fertility had no affect on cole crop maturity in some studies (Kowalenko and Hall 1987a; Rather et al. 1999; Zebarth et al. 1995). In other studies, broccoli (Bakker 2005; Kahn et al. 1991; Lisiewska and Kmiecik 1996) and cauliflower (Lisiewska and Kmiecik 1996) maturity was delayed by at least five days with increasing N rates. In summer cabbage in one of two years, maturity of summer cabbage was delayed by three weeks at low N rates (Westerveld et al. 2004). The difference between cabbage and broccoli or cauliflower may be due to differences in plant growth stage when these crops are harvested. With respect to broccoli crop quality, the level of N fertilization had a different effect on crop quality depending on which parameter was measured. For instance, increasing N rates applied to broccoli decreased the number of misshapen heads and floret colour improved, but increased the incidence of hollow stem and head rot (Bakker 2005). No consistent relationship was reported between N fertilization rate and broccoli soft rot and hollow stem (Zebarth et al. 1995). In an Arizona fertigation study, increasing N rates had no effect on the incidences of hollow stem and discoloration (Thompson et al. 2002a). Similarly, N rates had no effect on storage quality of broccoli (Toivonen et al. 1994). Broccoli head weight and diameter (Kahn et al. 1991; Lisiewska and Kmiecik 1996; Thompson et al. 2002a; Toivonen et al. 1994) as well as NO3-N in the head
Page 15 of 60
(Bakker 2005; Lisiewska and Kmiecik 1996) increased with increasing N rates. For bunching broccoli, which have significantly smaller head size, optimal yield were achieved at lower N rates (125 – 250 kg N ha-1) (Toivonen et al. 1994). However, weather conditions had a larger impact on broccoli quality than N rate (Toivonen et al. 1994). Generally, cauliflower head size and weight were increased with increasing N fertilization (Lisiewska and Kmiecik 1996; Rather et al. 1999; Thompson et al. 2000a). In an Ontario fertigation study, in one of two years the incidences of ‘ricey’ heads was highest at the two lowest N rates (0, 68.5 kg N ha-1). In an Arizona cauliflower irrigation trial, ricey head, discoloured heads, as well as hollow and green stem were not affected by N rate (Thompson et al. 2000a). Likewise, defect bracting, malformed and ricey heads, and other curd characteristics such as colour, depth, density, or smoothness were not influenced by N availability (Rather et al. 1999). Cauliflower quality parameters such as loose and buttoned heads all increased when N was limiting (Rather et al. 1999). N application rates did not influence the storage quality of cabbage or yield losses due to disease (O'Halloran 1998b). The number of small or underdeveloped cabbage heads decreased with increasing N fertigation (McKeown and Bakker 2005a). Similarly, Chinese cabbage head size increased with increasing N fertilization (Warner et al. 2004). Although there was yearly variation, the incidence of bacterial soft rot and petiole spotting generally increased linearly and curvilinearly, respectively, with increasing N fertilization (Warner et al. 2004). In Denmark, in white cabbage, increased fertilization resulted in higher N removal and NO3-N content but lower dietary fiber and vitamin C content (Sorensen 1999). Regardless of the cole crops, for different quality parameters there was considerable variation between site-years (Kahn et al. 1991; McKeown and Bakker 2005b; Toivonen et al. 1994; Warner et al. 2004). This indicates that growing conditions, more than N rate strongly influenced cole crop quality (Toivonen et al. 1994). Therefore, by considering total marketable crop yield when determining optimal N rates, the specific and variable quality components would be intrinsically factored in.
4.1.1.3. Environmental impact Despite high N applications (up to 400 kg N ha-1), at harvest there was no difference between N rates in soil mineral N, with the majority of mineral N was in the top 30 cm of soil (Bakker 2005). Similar results were observed in cole crops grown in British Columbia (Kowalenko and Hall 1987a) and Arizona (Thompson et al. 2000b, 2002b). In these studies and others (Table 5), total plant N accumulation typically exceeded or was similar to N applications, suggesting that plant N output was equal to or exceeded N input. Furthermore, Bakker (2005) observed little evidence to suggest significant N losses to leaching or denitrification in studies conducted at Simcoe, Ontario Low residual mineral soil N (10 kg N ha-1) observed at harvest in Brussels sprouts was due to high N uptake rate, which resulted in rapid depletion of soil N and therefore risk of environmental losses were minimal during season (Booij et al. 1993). Similarly, in
Page 16 of 60
British Columbia, inorganic soil N was less 15 kg N ha-1 at harvest for all N application rates (0 to 500 kg N ha-1) in one of two years (Zebarth et al. 1991). In the other year, at harvest inorganic soil N was highest (30 kg N ha-1) at the highest N application rate. Zebarth et al. (1991) estimated that approximately 1/3rd of fertilizer N was unaccounted for, regardless of N application rate applied to cabbage. It is not known if the fertilizer N was lost to the environment. Similarly, independent of N application rate between 25% and 35% of available N was unaccounted for in cabbage grown in the Netherlands (Everaarts and Booij 2000). In the aforementioned study, the proportion of unaccounted for N was not influenced by application method (banded vs. broadcast) or timing (preplant vs. split). Because there was little evidence of leaching and the unlikely potential that denitrification or volatilization would cause such substantial N losses, it is hypothesized that the unaccounted for N was either immobilized in cabbage roots or most likely in leaves shed from the plant prior to harvest (Everaarts and Booij 2000). The fact that very similar quantities of unaccounted for N were identified in different site-years suggests that unaccounted N was related to biological (i.e. microorganisms or plants) rather than environmental (i.e. temperature or moisture) processes. In other studies, fertilizer N not utilized by the crop was apparently lost due to leaching or denitrification, which at an application rate of 440 kg N ha-1 amounted to as much as 200-250 kg N ha-1 (O'Halloran 1997). At harvest, there was 420 kg N ha-1 of NO3-N to the 75cm soil depth at the highest N rate tested (625 kg N ha-1) (Bowen et al. 1999; Zebarth et al. 1995). Whereas NH4-N averaged 28 kg N ha-1 in two out of three experiments, and was significantly higher (200 kg N ha-1) in one experiment. Lower N application rates of 244 – 302 kg N ha-1 lowered residual NO3-N at harvest to 100 kg N ha-1, with estimated broccoli yield reductions of 0.5-1 t ha-1 (Zebarth et al. 1995). Clearly for broccoli production in British Columbia, optimal N rates have been selected which were considered agronomically, economically and environmentally sound. Thus, there is an environmental risk associated with the high residual N and low fertilizer recovery. For cole crops, crop residues form the single largest source of potential losses of N to the environment (Everaarts and Booij 2000; Everaarts et al. 1996; Everaarts and de Willigen 1999). For example, in Brussels sprouts, at a fertilizer application rate of 300 kg N ha-1, it was estimated that 260 kg N ha-1 would remain in the field as crop residues (Booij et al. 1993). In cabbage, at the optimal N rate (330 – 1.5Nmin (0-60cm)), soil and crop residual N were 40 and 113 kg N ha-1, respectively (Everaarts and Booij 2000). Likewise, in cauliflower, 50-80 and 100-120 kg N ha-1 were observed at harvest in soil and crop residues, respectively. In aforementioned cabbage and cauliflower studies, there was no evidence for N leaching during the growing season. Brassicacaea residues quickly break down and release inorganic N, which is available for loss over the winter. Clearly, BMPs must be developed that minimize N losses when the crop residues breakdown.
Page 17 of 60
4.1.1.4. Nitrogen use efficiency Overall, as fertilizer N input increases NUE of cole crops decreases (Table 5). Apparent fertilizer recovery in the aboveground portion of the broccoli plant decreased with increasing fertilization from 91% to 4% at 125 to 625 kg N ha-1, respectively (Zebarth et al. 1995). In a British Columbia cabbage study NUE was approximately 32%, which was independent of N application rate (0-500 kg N ha-1) (Zebarth et al. 1991). In this study, there was a curvilinear yield response to N rate and a linear response of head N uptake to N rate applied. In Brussels sprouts, NUE (i.e. based on total plant N accumulation) was over 90% and independent of the amount of nitrogen applied (Booij et al. 1993). The higher cabbage yields with higher N applications resulted in drastically reduced overall NUE (< 30%) in cabbage (O'Halloran 1997, 1998b). Average NUE based on research summarized in Table 5 for broccoli, cauliflower, and cabbage were 38%, 47%, and 22%, respectively. In Ontario grown broccoli, total N accumulation increased with increasing N rates and head N accumulation was at a maximum of 99 kg N ha-1 when 340 kg N ha-1 was applied, giving a NUE of 29% (Bakker 2005). Estimated NUE in fertigated cabbage and cauliflower was 60% and 24%, respectively (McKeown and Bakker 2005a, 2005b). Under conditions typical of British Columbia broccoli production, the apparent fertilizer NUE at the 250 kg N ha-1 rate was 63% and 24% in the aboveground plant portion and the broccoli head, respectively (Kowalenko and Hall 1987a). Based on a more environmentally responsible N application (244 – 302 kg N ha-1), NUE of broccoli varied between 30% to 46% depending on planting date and year (Zebarth et al. 1995). Although higher N applications increased total plant N concentration, the proportion of N in the broccoli head was not influenced by N rate but did change significantly (38% to 57%) in different years (Kowalenko and Hall 1987a). This suggests little opportunity to increase NUE based on crop N accumulation if yields do no increase. At low N application rates (0, 125 kg N ha-1) inorganic soil N was extremely low (NO3-N; 4 kg N ha-1) when broccoli inflorescences were initiating (Bowen et al. 1999). However, marketable yields 57-76% of maxima were obtained at low fertilization because of N translocation from leaves to the inflorescence, which ensures inflorescence development (Bowen et al. 1999). Translocation of N was not observed at higher fertilization rates. Therefore, Bowen et al. (1999) suggests that N applications can be reduced without compromising marketable yield because the plant can compensate for low soil inorganic N levels by translocating N from the leaves to the broccoli head. Furthermore, the root depth and distribution of Brassicaceae species facilitates N uptake from more than 2 m deep (Kristensen and Thorup-Kristensen 2004b; Thorup-Kristensen and Van Den Boogaard 1998; Van Den Boogaard and Thorup-Kristensen 1997).
4.1.2. Nitrogen source In a southwestern Ontario study, Chinese cabbage head size increased with increasing N fertilization (0-300 kg N ha-1) (Warner et al. 2004). In this study, head size was larger
Page 18 of 60
with ammonium nitrate compared to calcium nitrate and urea applications but only in one of five site-years. Compared to other N sources, calcium nitrate and urea, ammonium nitrate increased the incidence of soft rot. In contrast, severity of petiole spotting was higher for calcium nitrate compared to urea. Perhaps the higher incidence of disease with different N sources related to the large percent of immediately available NO3-N although this was not assessed. Regardless, growers can lower the incidences of the aforementioned diseases by choosing disease resistant cultivars such as Yuki and avoiding excessive N applications. This research indicates that a balance between yield, quality (disease) and environmental protection can be optimized. Another report found in the literature on N source and NUE was on spring cabbage grown under high tunnels in Poland (Rozek et al. 1999; Sady et al. 1998). Besides the limited use of high tunnels in Ontario cole crop production, the applicability of this research was limited because 1) the experimental design was confounded by different application methods used for different N sources (e.g. potassium nitrate applied broadcast and banded applications of urea and ammonium sulfate) and 2) N rates were based on Nmin therefore the amount of immediately available nitrate was different for each treatment. With little evidence in the literature to suggest that N source consistently impacts cole crop yield, quality, or environmental losses, the usefulness of altering N source to optimize NUE is limiting.
4.1.3. Application timing
4.1.3.1. Impact on yield and crop quality The impact of split applications on yield varied with soil type (O'Halloran 1998b). On a sandy loam soil, the MERN and yields were higher for the split compared to the preplant application (318 vs 234 kg N ha-1). Thus on lighter soils, high N applications can result in yield reductions likely due to ammonium toxicity early in the season, therefore there was a benefit of split applying N. In one of two years, the MERN and yields on a clay loam soil were slightly lower for the split compared to the preplant application (389 vs 406 kg N ha-1). There was no yield difference in split applications between 50 and 100 kg N ha-1 applied at transplanting (O'Halloran 1998a). Furthermore, cabbage losses from disease and during storage were not different in split or preplant N treated plants. The benefit in terms of yield and quality of broccoli were negligible in a four site-year study in Quebec (Bélec et al. 2001; Coulombe et al. 1999). Increasing N rates at the time of sidedress application (35 days after transplanting (DAT)) increased hollow stem incidences without a proportionate increase in yield (Bélec et al. 2001; Coulombe et al. 1999). Thus preplant applications were favoured. Similarly, when N was applied preplant, cabbage yield was twice as high compared to split or delayed N applications (Wiedenfeld 1986). Cauliflower (Everaarts and De Moel 1995) and cabbage (Everaarts and Booij 2000; Westerveld et al. 2004) yield was no different or decreased when N was split applied versus preplant applications. In contrast, cauliflower yields were higher in split versus preplant application of ammonium sulfate in a single site-year
Page 19 of 60
Californian study with an application rate of 100 kg N ha-1 but there was no difference between split versus preplant application of 150 kg N ha-1 (Welch et al. 1985a; 1985b). Therefore based on the aforementioned research, when yield and quality are considered there was little evidence to support split applications of N from an agromonic and economic perspective.
4.1.3.2. Environmental impact Similarly, from the literature, there is little evidence to suggest an environmental benefit of split applications. Bakker (2005) observed little evidence to suggest significant N losses to leaching or denitrification in broccoli grown in Simcoe, Ontario. In another Ontario study, downward movement of N varied over the three years, depending on rainfall events but there was no cabbage yield benefit of split applications (O'Halloran 1997, 1998a, 1998b). The split application compared to preplant applications of 300 kg N ha-1 had the same (6 kg N ha-1) or slightly higher (27 vs. 17 kg N ha-1, respectively) soil residual N at harvest depending on the site-year (Everaarts and Booij 2000). Similar results were observed in cauliflower (Everaarts et al. 1996). Therefore, if the same amount of N is applied, split applications just delay potential N losses to the fall.
4.1.3.3. Nitrogen use efficiency Nitrogen use efficiency did not increase in the split versus preplant N application (O'Halloran 1997, 1998a, 1998b). In Denmark, in one of two years, reduced preplant N applications and increased split N application resulted in higher cauliflower yield and lower soil residual N by 14 t ha-1 and 21 kg N ha-1, respectively, while maintaining yield quality (Van Den Boogaard and Thorup-Kristensen 1997). Nitrogen use efficiency was 23.8% and 26.2% when more N was applied preplant compared to later in the growing season, respectively. Thus, NUE increased in the split application in one year but there were no differences observed in the other year. Similarly, there was no differences in cabbage (Everaarts and Booij 2000) and cauliflower (Everaarts et al. 1996) crop N uptake at harvest with split versus preplant N applications, which suggests no differences in NUE.
4.1.4. Application methods
4.1.4.1. Impact on yield and crop quality In broccoli, yield was highest at the highest N application rate (270 or 225 kg N ha-1) (Letey et al. 1983). In this study, conventional preplant and sidedress N application yielded higher than injecting N in the irrigation water (Letey et al. 1983). In PEI, there were differences in response of broccoli, Brussels sprouts, and cabbage to different application methods (Sanderson and Ivany 1999). Broadcast, banded, or split (65:35) application method of 120 kg N ha-1 did not influence Brussels sprouts marketable yield. For broccoli, the split application yielded higher than banded application and yield from the broadcast method was similar to the other aforementioned methods. In contrast, cabbage yield was reduced in the banded application compared to the other methods. It is important to note that yields of all cole crops were higher when a higher application
Page 20 of 60
rate of 150 kg N ha-1 was broadcast incorporated (Sanderson and Ivany 1999). Similarly, in an Ontario cabbage study, split N applications (50:225 or 100:175 kg N ha-
1) and strip-banding N applications (50:175 kg N ha-1) did not increase cabbage yields compared to the broadcast application (200 kg N ha-1), which had a lower total amount of N applied (O'Halloran 1998a). In Texas, cabbage yields were similar when preplant N was banded or broadcasted (Wiedenfeld 1986). Likewise, there was no cauliflower (Everaarts and De Moel 1995) or cabbage (Everaarts and Booij 2000) yield advantage of banding versus broadcasting preplant N. The lack of yield advantage for banding application methods was likely due to the root distribution of cole crops. Nitrogen depletion by the cole crop tended to be similar at different distances from the crop row, which suggests a uniform root distribution of cabbage (Everaarts and Booij 2000) and cauliflower (Everaarts et al. 1996). In cabbage, there was equal distribution of roots in rows and between rows, even to a depth of over 2 m (Kristensen and Thorup-Kristensen 2004b). Similar root distribution were observed in other Brassicaceae species such as cauliflower (Thorup-Kristensen and Van Den Boogaard 1998) and fodder radish (Kristensen and Thorup-Kristensen 2004a). Consequently, placement of fertilizer N was not critical because of the wide and deep root distribution, which will capture N throughout the soil profile. Moreover, cole crops are luxurious N consumers with the ability to translocation N from leaves to the infloresence under N limiting conditions (Bowen et al. 1999). It is not surprising that application method had a minimal effect on yield.
4.1.4.2. Environmental impact In an Ontario cabbage study, the method of application did not influence plant N uptake, NUE or residual soil NO3-N (O'Halloran 1998a) (see section 4.1.1 and 4.1.3 for more details). No soil NO3-N or crop N uptake values were reported in the PEI broccoli, Brussels sprouts, and cabbage study (Sanderson and Ivany 1999). As mentioned previous, with higher yields with broadcast N application (150 kg N ha-1) compared to the lower yielding banding and split application one would expect 1) more plant total N uptake based on typical plant %N, 2) similar quantities of residual soil NO3-N at harvest due to the low N fertilizer rates used, and 3) more crop residues at harvest because higher yields are generally associated with larger plants, which would result in more total N in the crop residues. Compared to fertigation, there was more residual NO3-N (52 kg N ha-1) at harvest when the same amount of N was applied as 3 split banded applications (Letey et al. 1983). There were no significant differences in soil residual mineral N at harvest in cabbage (Everaarts and Booij 2000) and cauliflower (Everaarts et al. 1996) when N was banded compared to broadcasted. In cabbage, at harvest, in the soil top 30 cm mineral N was relatively low (6 or 25 kg N ha-1 depending on the site-year) when 270 and 255 kg N ha-
1, respectively, were applied. In these cauliflower (Everaarts et al. 1996) and cabbage (Everaarts and Booij 2000) studies, there was little evidence of N leaching during the growing season and the proportion of unaccounted for N was similar for both application methods. Hence, environmental risk was similar for the different N application methods.
Page 21 of 60
4.1.4.3. Nitrogen use efficiency Banding granular fertilizer along the crop row increased fertilizer N recovery compared to fertigation (Letey et al. 1983). The method of application did influence total %N in leaves of broccoli, Brussels sprouts, or cabbage sampled at initial reproductive stages (Sanderson and Ivany 1999). Leaf N analysis indicated that these cole crops were not N deficient at this developmental stage. However, generally higher %N was observed in the broadcast 150 kg N ha-1 treatment, which corresponded to the highest yielding treatment for all three cole crops. At-harvest plant N uptake, NUE, or soil N analysis were not reported in this study. Cabbage (Everaarts and Booij 2000) and cauliflower (Everaarts et al. 1996) crop N uptake was similar regardless of banding versus broadcast N application, which suggest similar NUE, although NUE was not reported. In an Ontario cabbage study, application methods (i.e. banded versus broadcasted) did not improve NUE (O'Halloran 1998a). Overall, application methods should not be considered as techniques to improve NUE.
4.1.5. Technology
4.1.5.1. Pre-sidedress soil N test (PSNT) A PSNT test was developed in New Jersey and surrounding states on double-cropped autumn cabbage that followed sweet corn. Cabbage transplanting occurred between 25 July and 15 August, with harvest in late October to early November. The PSNT level of 24 ppm was established as the critical value indicating the need for split N application (Heckman et al. 2002). At 14-21 DAT, additional N applications applied when PSNT values >24 ppm did not improve cabbage marketable yields compared to non-treated plots. Based on Cate-Nelson analysis, N applications of 135 and 180 kg N ha-1 were necessary when PSNT values were 1-9 and 10-16 ppm, respectively. Clearly, the adoption of PSNT will reduce unnecessary N applications, thereby reducing monetary inputs and minimizing environmental N losses. The applicability of the PSNT to Ontario spring-grown cabbage requires experimental validation.
4.1.5.2. Petiole sap quick tests At selected growth stages, there was good correlation between the quick tests, such as the SPAD® and Cardy® NO3
- meter, and certified laboratory results for summer cabbage (Westerveld et al. 2003). Although the SPAD chlorophyll meter did not prevent the excessive application of N in one of two years, there is potential to use the SPAD with an over fertilized control to schedule split application (Westerveld et al. 2004). Regardless, there was little agreement between the SPAD and Cardy NO3
- meter and cabbage yields in 2001 when there was no difference in yield at the different N rates tested (0 - 340 kg N ha-1) (Westerveld et al. 2004, 2003). Samples of broccoli petiole sap NO3
- concentrations taken before and after sidedress application indicated that the on-farm quick tools detected increased NO3
- concentrations (Bélec et al. 2001; Coulombe et al. 1999). There was a quadratic response of marketable yield to petiole sap NO3
- concentration which accounted for 51-64% of the variability (Coulombe et al. 1999). However, this data set included only 3 of 4 experiments. The regression analysis between marketable yield and sap NO3
- was
Page 22 of 60
not as strong when sampling was taken before split N application (Coulombe et al. 1999). Similarly, there was a linear or quadratic response of petiole NO3
- concentration at the time of broccoli inflorescence initiation and N application (Kahn et al. 1991). But in three of four site-years, there was no yield response at the N rates tested (up to 280 kg N ha-1). Despite good correlation between certified laboratory and on-farm tool results, this technology may be limiting because petiole sap NO3
- concentrations at the time of split application did not relate to yields.
4.1.5.3. Fertigation In Ontario, cabbage and cauliflower responded differently to fertigation when 50% N was broadcast incorporated pre-transplant and the remainder N applied as 5 fertigation splits (McKeown and Bakker 2005a, 2005b). Cauliflower yield of No. 1 grade curds was highest at 292 or 400 kg N ha-1 depending on the year. However total marketable yield was not reported. Cabbage yields were maximized at the highest rate tested (400 kg N ha-1). Generally ricey cauliflower heads and undeveloped broccoli heads decreased with increasing N rate. Under fertigation, 200 and 400 kg N ha-1, NUE of cabbage was similar at 60.3% and 61.5%, despite large differences in yield 35 and 100 t ha-1, respectively (McKeown and Bakker 2005a). In contrast, cauliflower NUE of 23.5% and 45% was observed with application rates of 200 and 400 kg N ha-1 but with similar cauliflower yields of 27 and 23 t ha-1, respectively (McKeown and Bakker 2005b). Therefore, cabbage was a luxurious consumer of fertilizer N, with plant N accumulation exceeding N application (i.e. plant N accumulation of 286 and 415 kg N ha-1 at application rates of 200 and 400 kg N ha-1, respectively). In contrast, in cauliflower, plant N accumulation was similar regardless of the amount of N applied (i.e. plant N accumulation of 226 and 254 kg N ha-1 at application rates of 200 and 400 kg N ha-1, respectively). This suggests a potential loss of 146 kg N ha-1 at the high N rate. At harvest, the average residual NO3-N was 27-38 and 25-45 kg N ha-1 for cabbage and cauliflower, respectively for application rates of 0-400 kg N ha-1 (McKeown and Bakker 2005a, 2005b). Similar residual NO3-N at harvest for plots receiving 0 or 400 kg N ha-1 suggests that either 1) the plants receiving N fertilizer have taken up most of NO3-N and depleted the soil to levels similar to the non-treated plants; as was the case for cabbage or 2) there was significant losses of available NO3
-, either through leaching, denitrification, or immobilization in the treated plots during the growing season resulting in similar residual N; the likely explanation for cauliflower. In Denmark, it is estimated that a 100 kg N ha-1 increase in N supply (fertilizer N plus Nmin) resulted in more N in harvested cauliflower (15 kg N ha-1), soil (17 kg N ha-1), and crop residues (52 kg N ha-1) (Van Den Boogaard and Thorup-Kristensen 1997), suggesting 10 kg N ha-1 was unaccounted for. Thus, the majority of N was in crop residues. Likewise, the amount of N in the crop residue was 94 and 174 kg N ha-1 for cauliflower and cabbage, respectively (McKeown and Bakker 2005a, 2005b). Therefore, BMPs that consider the management of N from crop residue is important when considering potential environmental losses.
Page 23 of 60
In Arizona, when agronomic, economic, and environmental factors (i.e. ≥95% of maximum yield and ≤40 kg N ha-1 of soil residual N) were considered the optimal or near-optimal N rate was between 350-400 and 300-500 kg N ha-1 at a soil water tension of 10-12 and 10 kPa with subsurface drip fertigation of winter-seeded cauliflower (Thompson et al. 2000a, 2000b) and broccoli, respectively (Thompson et al. 2002a, 2002b). For winter broccoli production in Arizona, there was no difference in fertigation frequency (daily, weekly, bi-weekly, monthly) on total marketable yield (Thompson et al. 2003). In this fertigation study, as much as 39-41% and 42-46% of applied N was unaccounted in cauliflower (Thompson et al. 2000b) and broccoli (Thompson et al. 2002b), respectively and was presumably lost via leaching and/or denitrification. The highest amounts of unaccounted for N (i.e 293 and 230 kg N ha-1) for cauliflower and broccoli, respectively, occurred at the highest N application rates. Overall NUE generally decreased with increasing N rates in cauliflower; for instance 58% and 41% for application rates of 300-340 and 600 kg N ha-1, respectively (Thompson et al. 2000b). At high N rates (350 kg N ha-1) the frequency of fertigation did not impact broccoli NUE, but at lower N (250 kg N ha-1), the highest NUE was observed with bi-weekly fertigation (Thompson et al. 2003). For subsurface drip-fertigated broccoli, apparent NUE was 90 and 81% when 250 and 350 N ha-1 were applied (Thompson et al. 2003). Unfortunately, it is difficult to compare Ontario production to winter cole crop production in the Arizona desert. In this Arizona study, the breakdown of plant residues was not considered as part of the environmental impact. In Ontario, it is important that mineralization of plant residues be considered because of the humid temperate climate and the length of time between cole crop harvest and planting of the next crop.
4.1.5.4. Formulations and other products In two contrasting Texas growing seasons (i.e. cool and dry vs typical), there were no difference in cabbage yield when the following N sources and slow release N products were used: 1) water soluble forms; ammonium sulphate or ammonium nitrate, 2) sulphur-coated urea, and 3) methylene urea (Wiedenfeld 1986). In a single-year California study, application of the nitrification inhibitor, nitrapyrin, with ammonium sulphate increased yields of Brussels sprouts, cabbage, and cauliflower (Welch et al. 1985b) compared to ammonium sulphate alone (Welch et al. 1985a). In China, the use nitrification inhibitor DMPP (3,4-dimethylpyrazole phosphate) increased the marketable yield of cabbage in one of two years (Chao et al. 2004). At the same fertilization level (450 kg N ha-1), there were no differences in total accumulated plant N or NO3-N content between plants treated with or without DMPP. Therefore, in one out of two years NUE was higher when DMPP was used. Because of the year-to-year variation and the added costs the benefit of these technologies is considered limited. In Poland, over the course of a four year rotation (cabbage, onion, red beet, cabbage), the one time application of 1000 kg N ha-1 was applied as a slow release fertilizer (dissolving coefficients of 1.3% and 5% in a 1:1 mixture; no formulation or name was given). With one application, all four crop yields over the four year study were no different than yearly applications of ammonium nitrate or urea (150 or 200 kg N ha-1,
Page 24 of 60
depending on the crop) (Kolota et al. 1992). Unfortunately, soil mineral N was not determined, but because yields were higher with the slow release fertilizer than the non-treated control it is reasonable to assume that minimal N losses occurred over the four year study. Practically, the ratio of different dissolving coefficients could be modified to Ontario conditions, thereby providing a four year N supply with one application. However, the challenge may be to convince Ontario growers that adequate yields can be maintained 4 years after application. For instance, a grower might be tempted to apply additional N before the slow release N has been eliminated, which may result in large environmental losses.
4.1.5.5. Modeling N uptake In greenhouse studies, broccoli shoot dry weight and yield were increased by 10 and 58%, respectively by reducing N rates at inflorescence initiation (Nkoa et al. 2001; Nkoa et al. 2003). Although the direct applicability the greenhouse approach described by Nkoa et al. (2001) to field grown broccoli may be low, it clearly demonstrates the opportunity to increase broccoli NUE by matching plant N demand with supply. In field experiments, by determining plant N accumulation over the growing season it is possible to determine the rate and maximum amount of N uptake in relation to plant stage of development. Many researchers have followed this approach in broccoli, (Bakker 2005; Thompson et al. 2002a) and cauliflower (Alt et al. 2000; Everaarts 2000; Feller and Fink 1999; Kage et al. 2000; Thompson et al. 2000a). Ideally these models should be designed based on plant stage of development or growing degree days, rather than DAT to optimize the applicability of comparisons between seasons. More detailed models incorporate other data such as soil types, rainfall amounts, expected yields, light intensity, and many others to predict crop N requirements (Alt et al. 2000; Kage et al. 2003a, 2003b; Rahn et al. 2001b; Vågen et al. 2004). One such model, HRI WELL_N has been used by growers since 1994 (Rahn et al. 2001b). These models match soil N availability to crop N demand, which may be useful in scheduling N applications, particularly in fertigation.
4.1.6. Cultivar selection Cauliflower cultivars ‘White Empress’ and ‘Stovepipe’ had linear and quadratic responses, respectively, to increasing N rates but ‘White Empress’ overall yielded higher (Batal et al. 1997). Similar N responses were observed in two spring-planted collards cultivars (Dangler and Wood 1993). The difficulty with selecting vegetable, particularly cole crop, cultivars that have high NUE is due to the historic screening of cultivars based on yield potential under adequate N conditions. Rather et al. (1999) suggests that cultivars which are non-responsive to N inputs should be bred and selected for because this will ensure stable high yields under limiting and non-limiting N supply. For example, under N-limiting (zero fertilizer N) and –nonlimiting (fertilizer applied to N soil supply of 250 kg N ha-1) conditions three cauliflower cultivars were compared for yield and quality aspects (Rather et al. 1999). Compared to the other cultivars, ‘Marine’ was considered to have a high NUE because marketable yield was high under both N limiting and non-limiting soil conditions (see Table 1 for NUE definition). Using this method of cultivar selection protects growers from low yields and
Page 25 of 60
the corresponding low monetary returns if N becomes limiting (Rather et al. 1999). Furthermore, cultivars that can produce more plant biomass/yield for the same N input or conversely, produce the same biomass/yield under lower N conditions have the potential to minimize N losses to the environment by reducing overall N inputs or by removing more soil N (Rather et al. 1999).
Page 26 of 60
4.2. Conclusions Generally a linear response of cole crop yield to increasing N fertilizer indicates that cole crops are luxurious N consumers, which are seldom injured by excessive N. Similar to potatoes, there was very little variation in crop N uptake, removal and residue values (Table 5), which suggest little opportunity to improve NUE through crop N accumulation. The average NUE of data reported in Table 5 for broccoli, cabbage, and cauliflower were 38% (se = 7.7), 47% (se = 8.2), and 22% (se = 4.0), respectively. The difference in fertilizer N input and plant N accumulation based on data presented in Table 5, averaged 78, 111, 134 kg N ha-1 for broccoli, cabbage, and cauliflower, respectively. This represents considerable amounts of soil and particularly plant residual N in the field after harvest, which would be susceptible to leaching or denitrification losses. Based on OMAF research, there were considerable decreases in soil NO3-N quantified at harvest compared to in the spring (A. Verhallen; pers. comm.). Given the high N content in crop residues, there is potential for large quantities of N losses from cole crop production. To minimize N environmental losses, BMPs must be designed to minimize N losses after cole crop losses.
Page 27 of 60
4.3. Recommended best management practices BMP 1. Application rate of 250-300 kg N ha-1. Based on research reported on
in this literature review (Table 5), 250 to 300 kg N ha-1 is recommended for optimal cole crop production. Current Ontario recommendations for cole crop production are 130 kg N ha-1 for Broccoli, cauliflower, and Brussels sprouts and 170 kg N ha-1 for cabbage , with a suggested extra 40 kg N ha-1 sidedressed on sandy soils if rainfall is excessive (OMAF 2004-2005). This recommended rate of 250 to 300 kg N ha-1 is based on optimizing cole crop yields and does not ensure environmental protection. Appropriate N rates with BMPs listed below can lower environmental risk under typical conditions
BMP 2. Similar N rates for broccoli, cauliflower, and cabbage. Although
there are considerable differences between cole crops in yield, and plant N uptake, the impact of these differences on NUE does not warrant different recommendations for broccoli, cauliflower and cabbage. Broccoli, cauliflower, and cabbage yields of 19.5, 32.6 and 81.1 t ha-1, respectively would result in an estimated plant N accumulation of 300 kg N ha-1. These yields are not unusual for Ontario cole crop production. Thus, at the recommended rate of 300 kg N ha-1 fertilizer inputs have been shown to be very similar to crop N accumulation. Based on data presented in Table 5, average optimal N rates for yield of broccoli, cabbage, cauliflower, and Brussels sprouts was 282, 273, 243, and 147 kg N ha-1, respectively. Therefore, the recommended range of 250-300 kg N ha-1 encompasses three of four crops. There is not sufficient data on Brussels sprouts to base a recommendation for this crop. However, in Ontario (OMAF 2004-2005) and other regions in North America, N recommendations include Brussels sprouts with other cole crops (Table 8).
BMP 3 Broadcast application. Based on cole crop root growth and the lack
of yield advantage of other methods of application, broadcast N application with or without incorporation is recommended. There was little evidence in the literature to support adoption of other application methods.
BMP 4. Preplant or split application. There was little evidence of in-season
NO3-N leaching in the literature and in Ontario studies. Thus, there is little environmental benefit of split N applications. However, in Ontario, on lighter soil high preplant N applications did show reduced yields, likely due to ammonium toxicity (O'Halloran 1998a). Therefore on lighter soils split applications may be of economic benefit. It must be noted that in several studies, there was no yield benefit and in some instances a reduction in yield when N was split applied. From a BMP
Page 28 of 60
perspective, the potential environmental and economic benefit of split N applications would be if the second application was not applied, thereby reducing to total fertilizer application and the potential for environmental loss due to denitrification. Based on modeling of crop N uptake throughout the season in broccoli grown in Ontario, the most rapid N plant uptake occurs when plants were at the 8-11 leaf stage, approximately 20 to 30 DAT (Bakker 2005). Therefore, depending on application method and N source, split applications should be applied at the 6-8 leaf stage. Thus OMAF’s current recommendation of ¾ and ¼ N application preplant and 21 DAT (OMAF 2004-2005) is supported by the literature reviewed in this manuscript.
BMP 5. No advantage of N technology products. Similar to potatoes, the
potential benefit of the aforementioned technology (nitrification inhibitors or slow release formulations) in wet years was not sufficient to justify the added cost and limited yield advantage. Alternative N application strategies have not been widely adopted in cereal production largely because of the ease and affordability of applying more N than needed at or before planting (Raun and Johnson 1999). It is likely that the same is true for cole crop production. Regardless, no BMP can be recommended with regards to N source or technology because there is no evidence in the literature to suggest these production practices greatly improve NUE or minimize environmental N losses. Moreover, at the time of preplant N application, it is impossible to predict ‘wet’ years when these technologies may be the most beneficial.
BMP 6. Residue management. Cole crop residues quickly mineralize, which is
a concern for N losses to the environment in the fall and over winter. BMPs must be implemented that minimize N losses especially on hydrologically sensitive soils (i.e. group AA or A). Therefore, in order to significantly lower the risk of environmental contamination, the following BMPs are recommended:
1) On early harvested cole crops, cover crops should be planted and establish as soon as possible after harvest (Everaarts et al. 1996). However, there is often limited establishment of cover crops succeeding late harvested cole crops.
2) For late season harvests, a BMP to limit N losses through leaching would be to delay tillage and leave crop residues undisturbed through the winter (Wehrmann and Scharpf 1989). However, this may be of concern because of malodors.
3) Alternatively, cultivars that have a lower leaf-to-head weight ratio should be grown to reduce the amount of N in crop residues remaining in the field after harvest (Everaarts and Booij 2000).
4) Restrict production of late season/harvested cole crops on hydrologically sensitive soils. If autumn cole crops are grown then the majority of crop residues should be physically removal from the field (Everaarts and Booij 2000). Suggested uses for the residues include composting or feeding to livestock. Moreover, on hydrologically sensitive soils, early season cole crops must be cover cropped.
Page 29 of 60
5. RECOMMENDED FUTURE RESEARCH The following research has been identified as necessary based on gaps in knowledge and/or the need for validation in Ontario vegetable production systems.
1. Characterization of the fate and persistence of fertilizer N in vegetable crop production. Based on the results of Joern and Vitosh (1995a; 1995b) immobilization of fertilizer N may be underestimated and therefore losses to the environment via leaching and denitrification would be overestimated. Under Ontario vegetable field conditions, 15N studies should assess the fate and persistence of fertilizer N, with emphasis on partitioning into soil organic and inorganic fractions. This research should focus on potential N losses through the season, especially in relation to timing of split fertilizer applications. As well, the research should include characterizing NUE or fertilizer N recovery, and N partitioning within the plant. Ideally, these studies should follow N cycling through two growing seasons to better characterize N fate through season and over winter. It would be beneficial include two soil types. Anticipated results would provide information on the risk and pathway of N losses to the environment, which can then be used to develop BMPs.
2. Adjusting N fertilizer applications based on Nmin. For many years now,
determining Nmin at the time of planting has been successfully used in the European Union to adjust N fertilizer applications. For instance, a soil N supply of 250 kg N ha-1 (i.e. Nmin at 0-60 cm plus fertilizer N equals 250) was deemed optimal for cauliflower production (Rather et al. 1999). In this study, Nmin was between 20 to 116 kg N ha-1 at planting. Therefore fertilizer applications varied from 230 to 134 kg N ha-1 yet yields and crop N uptake did not vary significantly and plant N was deemed sufficient based on leaf N content. The applicability of using Nmin in Ontario vegetable production practices needs to be explored. Observations from research trials conducted in British Columbia (Zebarth et al. 1995) and Quebec (Bélec et al. 2001) indicate that Nmin determined at the time of broccoli transplanting provided a good estimate of N available to the crop during the growing season and was identified as an important factor when determining optimal N application. However, the aforementioned research did not focus on using Nmin to adjust N applications. Clearly, there is potential to use Nmin in Ontario, but adoption by growers will require considerable field research to optimize N rates according to Nmin.
3. Modelling N fertilizer needs. Detailed mathematical models, for example
HRI WELL_N (Rahn et al. 2001b)), have been designed to predict crop N demand and to direct growers on the optimize N fertilizer applications necessary. Future research should be initiated to validate HRI WELL_N or develop a similar model for use in Ontario vegetable production. There is opportunity to collaborate with Ontario Weather Network (OWN) to
Page 30 of 60
incorporate local weather data into models which predict N availability and crop demand. Ideally this model could be used by farmers as a decision tool for fertilizer applications which optimize yields and economic gains, while minimizing environmental N losses.
4. Validation of on-farm N status tests. The broad scale applicability of
petiole sap NO3-N quick tests may be limiting because petiole NO3
-N concentrations vary site-to-site and year-to-year, even at the same fertilization level (Bélec et al. 2001; Coulombe et al. 1999). It has been suggested that this limitation may be overcome by the inclusion of a over-fertilized zone within commercial fields to be used as a reference (Bélec et al. 2001). Bélec et al. (2001) and Coulombe et al. (1999) suggest that quick tests may be useful for the refinement of N fertilization during the broccoli growing season. More research is required to relate crop developmental stage to N concentration (Bélec et al. 2001; Coulombe et al. 1999). Therefore future research needs to examine the ability of on-farm quick N status tools (i.e. Cardy® meters, NO3-N test strips, SPAD® chlorophyll meter) to schedule split applications. Critical to this research is observed difference in yields at different N rates.
5.1. Potatoes Experimental design is critical for assessing the potential for split N applications to reduce total N application. In many of the potatoes studies summarized in Tables 2-3, the split application was either above the optimal N rate (Li et al. 2003; 1999), the same N rate applied preplant or split (Zebarth et al. 2004a; Zebarth et al. 2004b; 2003), or different N rates split in equal proportions (Joern and Vitosh 1995a, 1995b). Although these aforementioned studies were properly designed, the results do not adequately address the potential for split N applications to reduce total N application. Future potato research should focus on carefully designed experiments with the research objective of determining optimal split N applications to reduce total N application.
5.2. Cole crops 1. Development of a pre-sidedress soil N test (PSNT). Future research
should validate if soil N tests at time of transplanting and also at time of split application can be used to modify N application rates in Ontario. Validation of cabbage PSNT developed by Heckman et al. (2002) under Ontario conditions is required as well as the comparison of the cabbage PSNT for use in other cole crops. Following the design of Heckman et al. (2002), key to developing a new PSNT is compiling an extensive database with many trials (e.g. 40) over a number of growing seasons (e.g. 5). The PSNT would be an effective tool for farmers to determine the need for split N applications and provide guidance on the amount of fertilizer required. This would effectively reduce over application of N, thereby minimizing environmental losses. Based on results of an Ontario validated cabbage
Page 31 of 60
PSNT, other PSNTs should be developed for other vegetable crops, particularly those grown on hydrologically-sensitive soils.
2. Estimates of crop residue mineralization. Cole crop residues comprise
a significant portion of plant N accumulation (Table 5). For instance, increasing N supply from 150 to 400 kg N ha-1 resulted in increased crop residues from 90 to 221 kg N ha-1 (Van Den Boogaard and Thorup-Kristensen 1997). Due to a low C:N ratio (e.g. 16:1 for Brussels sprout leaves (Booij et al. 1993)), mineralization of cole crop residues is quick, leading to potential NO3-N losses over the fall and winter. There is a need to assess the extent and rate of mineralization of N from cole crop residues in Ontario under different management systems (e.g. incorporation, different soil types, cover crops, etc.). This research should also focus on identifying pathways of N losses through to the next growing season. It is anticipated that this research will lead to the development of BMPs that minimize environmental losses of N from cole crop production systems.
3. Adjusting C:N ratios to minimize N losses. One potential method of
immobilizing mineral N after cole crop harvest may be with the application of a carbon source such as paper mill or oily wastes (I.P. O’Halloran, pers. comm.). By balancing the low C:N ratio of cole crop plant residues with an application of a waste which has a high C:N ratio, it may be possible to immobilize N in microbial biomass. Future research should examine the applicability of using such wastes to immobilize N from cole crop residues in the fall and monitor N mineralization in the following spring. This could lead to the development of BMPs, which reduce contaminant loading into the environment from two sources; NO3-N from the field and paper mill and/or oily effluent wastes.
Page 32 of 60
6. GENERAL CONCLUSIONS Analysis of the literature confirms and validates much of current potato and cole crop production in Ontario, and highlights opportunities to reduce N inputs. Given increased pressure on agriculture from society to protect consumers and the environment, fertilizer N recommendations and BMPs must be based on agronomical, economical and environmental considerations. Generally, decreasing N fertilization and/or increasing plant N accumulation reduces NUE. From an environmental point of view, reduced N applications equate to reduced risk. Conversely, increasing plant N uptake does not necessarily result in less environmental N losses considering that N accumulated in cole crop residues may be rapidly mineralized and available for loss. The increased plant N uptake associated with increased fertilization often results in increased NO3-N in the edible portion of the crop. The health concerns of human consumption of excessive quantities of NO3 have been widely documented. The question arises, particularly from a vegetable perspective, should management practices that optimize NUE by increasing NO3-N content in the edible portion of the plant be encouraged? With increasing N fertilizer and other input cost, are BMPs that encourage optimal NUE sustainable. Is improving NUE really the correct goal producers should be aiming for? Perhaps a better goal would be to increase yields with reduced N inputs and minimal N loss. The long term impact of reducing N fertilization and thus NUE on principal soil parameters such as soil organic C needs to be considered. For instance, in winter wheat, higher N fertilization rates while decreasing NUE, increased long term soil organic carbon (Raun et al. 1998). Reducing N fertilization may have untoward effects on soil fertility in the long term. From a nutrient management perspective, knowledge of root growth and development in time and space can allow for vegetable cropping systems that maximize plant N uptake from different soil depths. A systems approach to nutrient management has the potential to minimize groundwater N contamination. Therefore, vegetable production systems BMPs should consider crop rooting depth within crop rotations to improve NUE of the system and minimize N losses by leaching (Kristensen and Thorup-Kristensen 2004b). The huge variation across years, soil characteristics, and management practices in soil NO3-N between harvest and the next spring (Zebarth et al. 2003) as well as at planting and at harvest, has serious implications for developing nutrient management strategies and recommendations. Large year-to-year variation in N cycling, not to mention the various weather and soil characteristics found in Ontario, makes it very challenging to make sweeping N recommendations which encompass agronomic, economic, and environmental objectives. The opportunity for growers to input data into software decision tools, such as NMAN, will take into account this variation and ideally provide for improved N management and reduced environmental risk on a farm-by-farm basis.
Page 33 of 60
7. ABBREVIATIONS USED BMPs, best management practices; DAT, days after transplanting; MERN, most economic rate of nitrogen; N, nitrogen; Nmin, soil mineral N concentration; NO3-N, nitrate-nitrogen; NUE, nitrogen use efficiency; NUpE, N uptake efficiency; NUtE, N utilization efficiency; OM, organic matter; OMAF, Ontario Ministry of Agriculture and Food; POCU, polyolefin-coated urea; PSNT, pre-sidedress soil nitrate test; SSC%, percent sand, silt, clay.
8. ACKNOWLEDGEMENTS The author gratefully acknowledges I.P. O’Halloran and J.W. Zandstra for their critical review and useful suggestions throughout the preparation of this manuscript. The assistance of M. Zink, M.A. Bulckaert, and B. Clark was appreciated. Funding for this manuscript was provided by the Ontario Ministry of Agriculture and Food.
9. REFERENCES 1. Alt, C., Kage, H., Stutzel, H. 2000. Modeling nitrogen content and distribution in cauliflower
(Brassica oleracea L. botrytis). Annals of Botany 86: 963-973. 2. Arsenault, W.J., Malone, A. 1999. Effects of nitrogen fertilization and in-row seedpiece
spacing on yield of three potato cultivars in Prince Edward Island. American Journal of Potato Research 76: 227-229.
3. Bakker, C.J. 2005. Nitrogen management of broccoli (Brassica oleracea var. italica). M.Sc. Thesis. Department of Plant Agriculture, University of Guelph, Guelph, Ontario. pp. 121.
4. Batal, K.M., Granberry, D.M., Mullinix, B.G., Jr 1997. Nitrogen, magnesium, and boron applications affect cauliflower yield, curd mass, and hollow stem disorder. HortScience 32: 75-78.
5. Beegle, D.B., Carton, O.T., Bailey, J.S. 2000. Nutrient management planning: Justification, theory, practice. Journal of Environmental Quality 29: 72-79.
6. Bélec, C., Villeneuve, S., Coulombe, J., Tremblay, N. 2001. Influence of nitrogen fertilization on yield, hollow stem incidence and sap nitrate concentration in broccoli. Canadian Journal of Plant Science 81: 765-772.
7. Booij, R., Enserink, C.T., Smit, A.L., Werf, v.d. 1993. Effects of nitrogen availability on crop growth and nitrogen uptake of brussels sprouts and leek. Acta horticulturae 339: 53-65.
8. Bowen, P.A., Zebarth, B.J., Toivonen, P.M.A. 1999. Dynamics of nitrogen and dry-matter partitioning and accumulation in broccoli (Brassica oleracea var. italica) in relation to extractable soil inorganic nitrogen. Canadian Journal of Plant Science 79: 277-286.
9. Burnette, R.R., Coffey, D.L., Brooker, J.R. 1993. Economic implications of nitrogen fertilization, drip irrigation and plastic culture on cole crops and tomatoes grown sequentially. Tennessee Farm and Home Science 168: 5-13.
10. Chao, X., Liang-Huan, W., XiaoTang, J., Fu-Suo, Z. 2004. Effects of nitrogen fertilizer with nitrification inhibitor DMPP (3,4-dimethylpyrazole phosphate) on nitrate accumulation and quality of cabbage (Brassica campastris L. ssp. pekinesis). Agricultural Sciences in China 3: 622-626.
11. Coulombe, J., Villeneuve, S., Lamy, P., Yelle, S., Bélec, C., Tremblay, N. 1999. Evaluation of soil and petiole sap nitrate quick tests for broccoli in Quebec. Acta horticulturae 506: 147-152.
Page 34 of 60
12. Dangler, J.M., Wood, C.W. 1993. Nitrogen rate, cultivar, and within-row spacing affect collard yield and leaf nutrient concentration. HortScience 28: 701-703.
13. Dufault, R.J., Waters, L.J. 1985. Interaction of nitrogen fertility and plant populations on transplanted broccoli and cauliflower yields. HortScience 20: 127-128.
14. Errebhi, M., Rosen, C.J., Gupta, S.C., Birong, D.E. 1998a. Potato yield response and nitrate leaching as influenced by nitrogen management. Agronomy Journal 90: 10-15.
15. Errebhi, M., Rosen, C.J., Lauer, F.I., Martin, M.W., Bamberg, J.B. 1999. Evaluation of tuber-bearing Solanum species for nitrogen use efficiency and biomass partitioning. American Journal of Potato Research 76: 143-151.
16. Errebhi, M., Rosen, C.J., Lauer, F.I., Martin, M.W., Bamberg, J.B., Birong, D.E. 1998b. Screening of exotic potato germplasm for nitrogen uptake and biomass production. American Journal of Potato Research 75: 93-100.
17. Everaarts, A.P. 2000. Nitrogen balance during growth of cauliflower. Scientia Horticulturae 83: 173-186.
18. Everaarts, A.P., Booij, R. 2000. The effect of nitrogen application on nitrogen utilization by white cabbage (Brassica oleracea bar. capitata) and on nitrogen in the soil at harvest. Journal of Horticultural Science and Biotechnology 75: 705-712.
19. Everaarts, A.P., De Moel, C.P. 1995. The effect of nitrogen and the method of application on the yield of cauliflower. Netherlands Journal of Agricultural Science 43: 409-418.
20. Everaarts, A.P., De Moel, C.P., Van Noordwijk, M. 1996. The effect of nitrogen and the method of application on nitrogen uptake of cauliflower and on nitrogen in crop residues and soil at harvest. Netherlands Journal of Agricultural Science 44: 43-55.
21. Everaarts, A.P., de Willigen, P. 1999. The effect of the rate and method of nitrogen application on nitrogen uptake and utilization by broccoli (Brassica oleracea var. italica). Netherlands Journal of Agricultural Science 47: 201-214.
22. Everaarts, A.P., van den Berg, W. 1996. A comparison of three nitrogen response models for cauliflower. Acta horticulturae 428: 171-179.
23. Feller, C., Fink, M. 1999. Estimation of nitrogen uptake of field vegetables. Acta Horticulturae 506: 117-122.
24. Gallais, A., Hirel, B. 2004. An approach to the genetics of nitrogen use efficiency in maize. Journal of Experimental Botany 55: 295-306.
25. Good, A.G., Shrawat, A.K., Muench, D.G. 2004. Can less yield more? Is reducing nutrient input into the environment compatible with maintaining crop production? Trends in Plant Science 9: 597-605.
26. Gupta, A.K., Samnotra, R.K. 2004. Effect of biofertilizers and nitrogen on growth, quality and yield of cabbage (Brassica oleracea var capitata L.) cv Golden Acre. Environment and Ecology 22: 551-553.
27. Gutezeit, B. 2004. Yield and nitrogen balance of broccoli at different soil moisture levels. Irrigation Science 23: 21-27.
28. Heckman, J.R., Morris, T., Sims, J.T., Sieczka, J.B., Krogmann, U., Nitzsche, P., Ashley, R. 2002. Pre-sidedress soil nitrate test is effective for fall cabbage. HortScience 27: 113-117.
29. Hendrickson, L.L., Keeney, D.R., Walsh, L.M., Liegel, E.A. 1978. Evaluation of nitrapyrin as a means of improving N efficiency in irrigated sands. Agronomy Journal 70: 699-704.
30. Joern, B.C., Vitosh, M.L. 1995a. Influence of applied nitrogen on potato Part I: Yield, quality, and nitrogen uptake. American Potato Journal 72: 51-63.
31. Joern, B.C., Vitosh, M.L. 1995b. Influence of applied nitrogen on potato Part II: Recovery and partitioning of applied nitrogen. American Potato Journal 72: 73-84.
32. Kage, H., Alt, C., Stutzel, H. 2003a. Aspects of nitrogen use efficiency of cauliflower. I. A simulation modelling based analysis of nitrogen availability under field conditions. Journal of Agricultural Science 141: 1-16.
Page 35 of 60
33. Kage, H., Alt, C., Stutzel, H. 2003b. Aspects of nitrogen use efficiency of cauliflower. II. Productivity and nitrogen partitioning as influenced by N supply. Journal of Agricultural Science 141: 17-29.
34. Kage, H., Kochler, M., Stutzel, H. 2000. Root growth of cauliflower (Brassica oleracea L. botrytis) under unstressed conditions: Measurement and modelling. Plant and Soil 225: 131-145.
35. Kahn, B.A., Shilling, P.G., Brusewitz, G.H., McNew, R.W. 1991. Force to shear the stalk, stalk diameter, and yield of broccoli in response to nitrogen fertilization and within-row spacing. Journal of the American Society for Horticultural Science 116: 222-227.
36. Kelling, K.A., Speth, P.E., Arriaga, F.J., Lowery, B. 2003. Use of a nonionic surfactant to improve nitrogen use efficiency of potato. Acta Horticulturae 619: 225-232.
37. Kleinkopf, G.E., Westermann, D.T., Dwelle, R.B. 1981. Dry matter production and nitrogen utilization by six potato cultivars. Agronomy Journal 73: 799-802.
38. Kolota, E., Beresniewicz, A., Krezel, J., Nowosielski, O. 1992. Slow release fertilizers on organic carriers as the source of N for vegetable crops production in the open field. Acta horticulturae 339: 241-249.
39. Kowalenko, C.G., Hall, J.W. 1987a. Effects of nitrogen applications on direct-seeded broccoli from a single harvest adjusted for maturity. Journal of the American Society for Horticultural Science 112: 9-13.
40. Kowalenko, C.G., Hall, J.W. 1987b. Nitrogen recovery in single- and multiple- harvested direct-seeded broccoli trials. Journal of American Society for Horticultural Science 112: 4-8.
41. Kristensen, H.L., Thorup-Kristensen, K. 2004a. Root growth and nitrate uptake of three different catch crops in deep soil layers. Soil Science Society of America Journal 2: 529-537.
42. Kristensen, H.L., Thorup-Kristensen, K. 2004b. Uptake of 15N labeled nitrate by root systems of sweet corn, carrot and white cabbage from 0.2-2.5 meters depth. Plant and Soil 265: 93-100.
43. Kuldeep, S., Dhaka, R.S., Fageria, M.S. 2004. Response of cauliflower (Brassica oleracea var. botrytis L.) cultivars to row spacing and nitrogen fertilization. Progressive Horticulture 36: 171-173.
44. Letey, J., Jarrell, W.M., Valoras, N., Beverly, R. 1983. Fertilizer application and irrigation management of broccoli production and fertilizer use efficiency. Agronomy Journal 75: 502-507.
45. Li, H., Parent, L.E., Karam, A., Tremblay, C. 2003. Efficiency of soil and fertilizer nitrogen of a sod-potato system in the humid, acid and cool environment. Plant and Soil 251: 23-36.
46. Li, H., Parent, L.E., Tremblay, C., Karam, A. 1999. Potato response to crop sequence and nitrogen fertilization following sod breakup in a gleyed humo-ferric podzol. Canadian Journal of Plant Science 79: 439-446.
47. Lisiewska, Z., Kmiecik, W. 1996. Effects of level of nitrogen fertilizer, processing conditions and period of storage for frozen broccoli and cauliflower on vitamin C retention. Food Chemistry 57: 267-270.
48. Martin, H.W., Graetz, D.A., Locascio, S.J., Hensel, D.R. 1993. Nitrification inhibitor influences on potato. Agronomy Journal 85: 651-655.
49. McKeown, A.W., Bakker, C.J., 2005a. Determination of water and nitrogen requirements of cabbage using fertigation. In: Ontario Fruit and Vegetable Convention. St. Catherines, pp. Poster.
50. McKeown, A.W., Bakker, C.J., 2005b. Determination of water and nitrogen requirements of cauliflower using fertigation. In: Ontario Fruit and Vegetable Convention. St. Catherines, pp. Poster.
Page 36 of 60
51. McKeown, A.W., Bakker, C.J. 2003. The response of late storage cabbage and broccoli to applications of sulphur and calcium. Canadian Journal of Plant Science 83: 947-950.
52. Meyer, R.D., Marcum, D.B. 1998. Potato yield, petiole nitrogen, and soil nitrogen response to water and nitrogen. Agronomy Journal 90: 420-429.
53. Nkoa, R., Coulombe, J., Desjardins, Y., Tremblay, N. 2001. Towards optimization of growth via nutrient supply phasing: nitrogen supply phasing increases broccoli (Brassica oleracea var. italica) growth and yield. Journal of Experimental Botany 52: 821-827.
54. Nkoa, R., Desjardins, Y., Tremblay, N., Querrec, L., Baana, M., Nkoa, B. 2003. A mathematical model for nitrogen demand quantification and a link to broccoli (Brassica oleracea var. italica) glutamine synthetase activity. Plant Science 165: 483-496.
55. O'Halloran, I.P. 1997. Fertilization recommendations for cabbage production and the impact rates on yield. Final report to OMAFRA: Environment and Natural Resources Program pp. 4.
56. O'Halloran, I.P. 1998a. Fertilizer recommendations for cabbage production and the impact of fertilization rates on potential nitrate leaching. Final report to OMAFRA: Environment and Natural Resources Program pp. 8.
57. O'Halloran, I.P. 1998b. Impact of fertilization rates on yield and quality on cabbage and nitrate leaching. Final report to OMAFRA: Environment and Natural Resources Program pp. 6.
58. OMAF 2004-2005. Vegetable Production Recommendations. Ontario Ministry of Agriculture and Food. Publication 363: 201.
59. Rahn, C., De Neve, S., Bath, B., Bianco, V.V., Dachler, M., Cordovil, M.S.C., Fink, M., Gysi, C., Hofman, G., Koivunen, M., Panagiotopoulos, L., Poulain, D., Ramos, C., Riley, H., Setatou, H., Sorensen, J.N., Titulaer, H., Weier, U. 2001a. A comparison of fertiliser recommendation systems for cauliflowers in Europe. Acta Horticulturae 563.
60. Rahn, C., Mead, A., Draycott, A., Lillywhite, R., Salo, T. 2001b. A sensitivity analysis of the prediction of the nitrogen requirement of cauliflower crops using the HRI WELL_N computer model. Journal of Agricultural Science 137: 55-69.
61. Rather, K., Schenk, M.K., Everaarts, A.P., Vethman, S. 1999. Response of yield and quality of cauliflower varieties (Brassica oleracea var. botrytis) to nitrogen supply. Journal of Horticultural Science and Biotechnology 74: 658-664.
62. Raun, W.R., Johnson, G.V. 1999. Improving nitrogen use efficiency for cereal production. Agronomy Journal 91: 357-363.
63. Raun, W.R., Johnson, G.V., Phillips, S.B., Westerman, P.W. 1998. Effect of long-term N fertilization on soil organic C and total N in continuous wheat under conventional tillage in Oklahoma. Soil & Tillage Research 47: 323-330.
64. Rosen, C.J. 1990. Leaf tipburn in cauliflower as affected by cultivar, calcium sprays, and nitrogen nutrition. HortScience 25: 660-663.
65. Rozek, S., Leja, M., Wojciechowska, R., Sady, W. 1999. Nitrate and nitrite contents in spring cabbage as related to nitrogen fertilizer type, method of fertilizer application and to nitrate and nitrite reductase activity. Acta Horticulturae 506: 153-157.
66. Sady, W., Rozek, S., Leja, M., Mareczek, A. 1998. Spring cabbage yield and quality as related to nitrogen fertilizer type and method of fertilizer application. Acta horticulturae 506: 77-80.
67. Sanderson, K.R., Ivany, J.A. 1999. Cole crop yield response to reduced nitrogen rates. Canadian Journal of Plant Science 79: 149-151.
68. Serio, F., Elia, A., Signore, A., Santamaria, P. 2004. Influence of nitrogen form on yield and nitrate content of subirrigated early potato. Journal of the Science of Food and Agriculture. 84: 1428-1432.
69. Sorensen, J.N. 1999. Nitrogen effects on vegetable crop production and chemical composition. Acta horticulturae 506: 41-49.
Page 37 of 60
70. Thompson, T.L., Doerge, T.A., Godin, R.E. 2000a. Nitrogen and water interactions in subsurface drip-irrigated cauliflower: I. Plant response. Soil Science Society of America Journal 64: 406-411.
71. Thompson, T.L., Doerge, T.A., Godin, R.E. 2000b. Nitrogen and water interactions in subsurface drip-irrigated cauliflower: II. Agronomic, economic, and environmental outcomes. Soil Science Society of America Journal 64: 412-418.
72. Thompson, T.L., Doerge, T.A., Godin, R.E. 2002a. Subsurface drip irrigation and fertigation of broccoli: I. Yield, quality, and nitrogen uptake. Soil Science Society of America Journal 66: 186-192.
73. Thompson, T.L., Doerge, T.A., Godin, R.E. 2002b. Subsurface drip irrigation and fertigation of broccoli: II. Agronomic, economic, and environmental outcomes. Soil Science Society of America Journal 66: 178-185.
74. Thompson, T.L., White, S.A., Walworth, J., Sower, G.J. 2003. Fertigation frequency for subsurface drip-irrigated broccoli. Soil Science Society of America Journal 67: 910-918.
75. Thorup-Kristensen, K., Van Den Boogaard, R. 1998. Temporal and spatial root development of cauliflower (Brassica oleracea L. var. botrytis L.). Plant and Soil 201: 37–47.
76. Toivonen, P.M.A., Zebarth, B.J., Bowen, P.A. 1994. Effect of nitrogen fertilization on head size, vitamin C content and storage life of broccoli (Brassica oleracea var. Italica). Canadian Journal of Plant Science 74: 607-610.
77. Tyler, K.B., Broadbent, F.E., Bishop, J.C. 1983. Efficiency of nitrogen uptake by potatoes. American Potato Journal 60: 261-269.
78. Vågen, I.M., Skjelvåg, A.O., Bonesmo, H. 2004. Growth analysis of broccoli in relation to fertilizer nitrogen application. Journal of Horticultural Science and Biotechnology 79: 484-492.
79. Van Den Boogaard, R., Thorup-Kristensen, K. 1997. Effects of nitrogen fertilization on growth and soil nitrogen depletion in cauliflower. Acta Agriculturae Scandinavica - Section B Soil and Plant Science 47: 149-155.
80. Vos, J. 1997. The nitrogen response of potato (Solanum tuberosum L.) in the field: nitrogen uptake and yield, harvest index and nitrogen concentration. Potato Research 40: 237-248.
81. Vos, J. 1999. Split nitrogen application in potato: effects on accumulation of nitrogen and dry matter in the crop and on the soil nitrogen budget. Journal of Agricultural Science 133: 263-274.
82. Warner, J., Cerkauskas, R., Zhang, T.Q. 2004. Nitrogen management and cultivar evaluation for controlling petiole spotting and bacterial soft rot of Chinese cabbage. Acta Horticulturae 635: 151-157.
83. Wehrmann, J., Scharpf, H.-S., 1989. Reduction of nitrate leaching in a vegetable farm - fertilization, crop rotation, plant residues. In: Germon, J.G. (Ed.), Management Systems to Reduce Impact of Nitrates. Elsevier, London, pp. 147-157.
84. Welch, N.C., Tyler, K.B., Ririe, D. 1985a. Nitrogen rates and nitrapyrin influence on yields of Brussels sprouts, cabbage, cauliflower, and celery. HortScience 20: 1110-1112.
85. Welch, N.C., Tyler, K.B., Ririe, D. 1987. Split nitrogen applications best for cauliflower. California Agriculture 21-22.
86. Welch, N.C., Tyler, K.B., Ririe, D., Broadbent, F.E. 1985b. Nitrogen uptake by cauliflower: Adding nitropyrin to fertilizer improved nitrogen uptake and crop yield. California Agriculture 13-14.
87. Westerveld, S.M., McKeown, A.W., Scott-Dupree, C.D., McDonald, M.R. 2004. Assessment of chlorophyll and nitrate meters as field tissue nitrogen tests for cabbage, onions, and carrots. HortTechnology 14: 179-188.
Page 38 of 60
88. Westerveld, S.M., McKeown, A.W., Scott-Dupree, C.D., McDonald, M.R. 2003. How well do critical nitrogen concentrations work for cabbage, carrot, and onion crops? HortScience 38: 1122-1128.
89. Wiedenfeld, R.P. 1986. Rate, timing, and slow-release nitrogen fertilizers on cabbage and onions. HortScience 21: 236-238.
90. Zebarth, B.J., Bowen, R.A., Toivonen, P.M.A. 1995. Influence of nitrogen fertilization on broccoli yield, nitrogen accumulation and apparent fertilizer-nitrogen recovery. Canadian Journal of Plant Science 75: 717-725.
91. Zebarth, B.J., Freyman, S., Kowalenko, C.G. 1991. Influence of nitrogen fertilization on cabbage yield, head nitrogen content and extractable soil inorganic nitrogen at harvest. Canadian Journal of Plant Science 71: 1275-1280.
92. Zebarth, B.J., Leclerc, Y., Moreau, G. 2004a. Rate and timing of nitrogen fertilization of Russet Burbank potato: Nitrogen use efficiency. Canadian Journal of Plant Science 84: 845-854.
93. Zebarth, B.J., Leclerc, Y., Moreau, G., Botha, E. 2004b. Rate and timing of nitrogen fertilization of Russet Burbank potato: Yield and processing quality. Canadian Journal of Plant Science 84: 855-863.
94. Zebarth, B.J., Leclerc, Y., Moreau, G., Gareau, R., Milburn, P.H. 2003. Soil inorganic nitrogen content in commercial potato fields in New Brunswick. Canadian Journal of Soil Science 83: 425-429.
95. Zebarth, B.J., Milburn, P.H. 2003. Spatial and temporal distribution of soil inorganic nitrogen concentration in potato hills. Canadian Journal of Soil Science 83: 183–195.
96. Zebarth, B.J., Tai, G., Tarn, R., de Jong, H., Milburn, P.H. 2004c. Nitrogen use efficiency characteristics of commercial potato cultivars. Canadian Journal of Plant Science 84: 589-598.
97. Zvomuya, F., Rosen, C.J. 2002. Biomass partitioning and nitrogen use efficiency of 'Superior' potato following genetic transformation for resistant to Colorado potato beetle. Journal of the American Society for Horticultural Science 127: 703-709.
98. Zvomuya, F., Rosen, C.J. 2001. Evaluation of polyofefin-coated urea for potato production on a sandy soil. HortScience 36: 1057-1060.
99. Zvomuya, F., Rosen, C.J., Miller, J.C.J. 2002. Response of Russet Norkotah clonal selections to nitrogen fertilization. American Journal of Potato Research 79: 231-239.
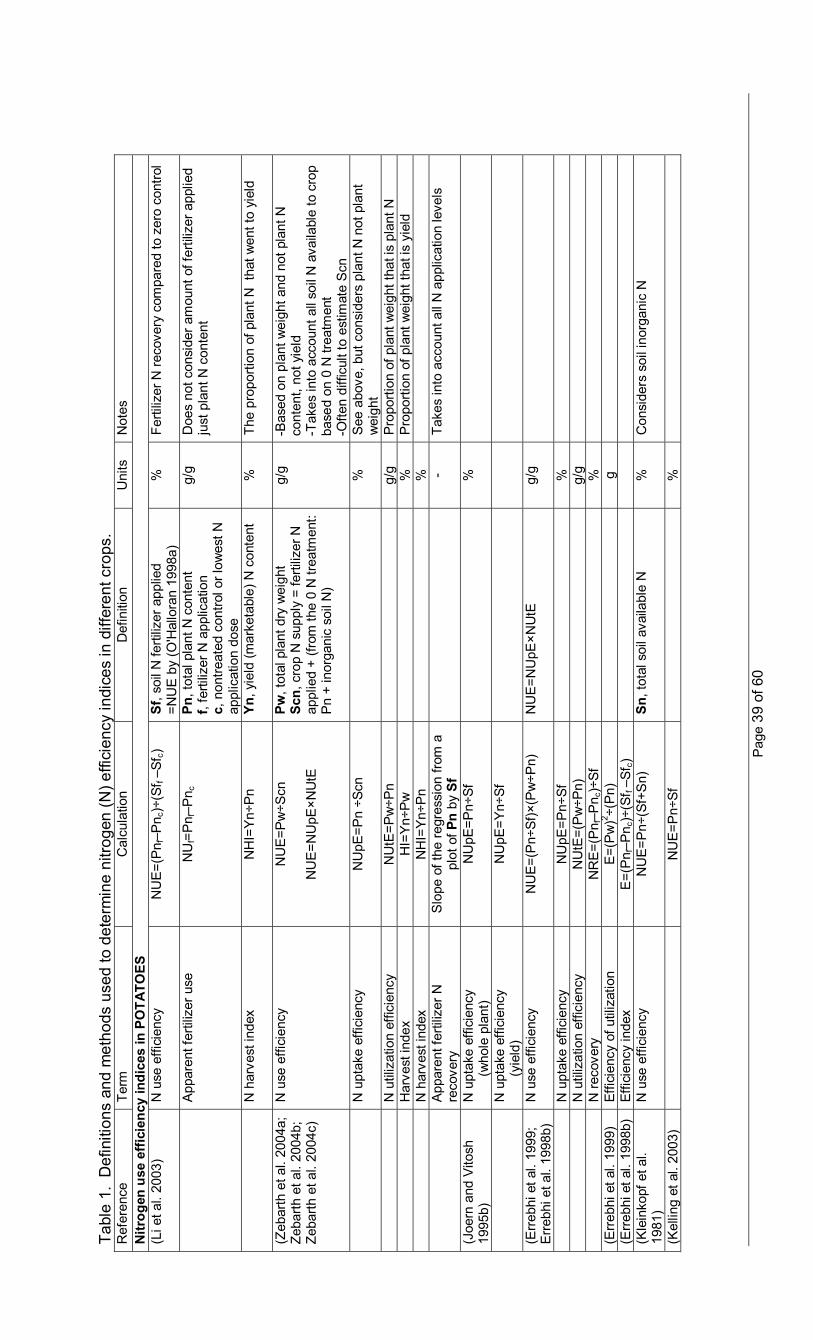
Pag
e 39
of 6
0
Tabl
e 1.
Def
initi
ons
and
met
hods
use
d to
det
erm
ine
nitro
gen
(N) e
ffici
ency
indi
ces
in d
iffer
ent c
rops
. R
efer
ence
Te
rm
Cal
cula
tion
Def
initi
on
Uni
ts
Not
es
Nitr
ogen
use
effi
cien
cy in
dice
s in
PO
TATO
ES
(Li e
t al.
2003
) N
use
effi
cien
cy
NU
E=(
Pn f
–Pn c
)÷(S
f f –S
f c)
Sf, s
oil N
ferti
lizer
app
lied
=N
UE
by
(O'H
allo
ran
1998
a)
%
Ferti
lizer
N re
cove
ry c
ompa
red
to z
ero
cont
rol
A
ppar
ent f
ertil
izer
use
N
Uf=
Pn f
–Pn c
Pn
, tot
al p
lant
N c
onte
nt
f, fe
rtiliz
er N
app
licat
ion
c, n
ontre
ated
con
trol o
r low
est N
ap
plic
atio
n do
se
g/g
Doe
s no
t con
side
r am
ount
of f
ertil
izer
app
lied
just
pla
nt N
con
tent
N
har
vest
inde
x N
HI=
Yn÷
Pn
Yn, y
ield
(mar
keta
ble)
N c
onte
nt
%
Th
e pr
opor
tion
of p
lant
N t
hat w
ent t
o yi
eld
(Zeb
arth
et a
l. 20
04a;
Ze
barth
et a
l. 20
04b;
Ze
barth
et a
l. 20
04c)
N u
se e
ffici
ency
N
UE
=Pw
÷Scn
NU
E=N
UpE
×NU
tE
Pw, t
otal
pla
nt d
ry w
eigh
t Sc
n, c
rop
N s
uppl
y =
ferti
lizer
N
appl
ied
+ (fr
om th
e 0
N tr
eatm
ent:
Pn
+ in
orga
nic
soil
N)
g/g
-Bas
ed o
n pl
ant w
eigh
t and
not
pla
nt N
co
nten
t, no
t yie
ld
-Tak
es in
to a
ccou
nt a
ll so
il N
ava
ilabl
e to
cro
p ba
sed
on 0
N tr
eatm
ent
-Ofte
n di
fficu
lt to
est
imat
e S
cn
N
upt
ake
effic
ienc
y N
UpE
=Pn
÷Scn
%
See
abo
ve, b
ut c
onsi
ders
pla
nt N
not
pla
nt
wei
ght
N
util
izat
ion
effic
ienc
y N
UtE
=Pw
÷Pn
g/
g P
ropo
rtion
of p
lant
wei
ght t
hat i
s pl
ant N
Har
vest
inde
x H
I=Y
n÷P
w
%
P
ropo
rtion
of p
lant
wei
ght t
hat i
s yi
eld
N
har
vest
inde
x N
HI=
Yn÷
Pn
%
A
ppar
ent f
ertil
izer
N
reco
very
S
lope
of t
he re
gres
sion
from
a
plot
of P
n by
Sf
-
Take
s in
to a
ccou
nt a
ll N
app
licat
ion
leve
ls
(Joe
rn a
nd V
itosh
19
95b)
N
upt
ake
effic
ienc
y
(w
hole
pla
nt)
NU
pE=P
n÷Sf
%
N
upt
ake
effic
ienc
y
(y
ield
) N
UpE
=Yn÷
Sf
(Err
ebhi
et a
l. 19
99;
Err
ebhi
et a
l. 19
98b)
N
use
effi
cien
cy
NU
E=(
Pn÷
Sf)×
(Pw
÷Pn)
N
UE
=NU
pE×N
UtE
g/
g
N
upt
ake
effic
ienc
y N
UpE
=Pn÷
Sf
%
N
util
izat
ion
effic
ienc
y N
UtE
=(P
w÷P
n)
g/
g
N
reco
very
N
RE
=(P
n f–P
n c)÷
Sf
%
(Err
ebhi
et a
l. 19
99)
Effic
ienc
y of
util
izat
ion
E=(
Pw
)2 ÷(P
n)
g
(E
rreb
hi e
t al.
1998
b)
Effic
ienc
y in
dex
E=(
Pn f
–Pn c
)÷(S
f f –S
f c)
(K
lein
kopf
et a
l. 19
81)
N u
se e
ffici
ency
N
UE
=Pn÷
(Sf+
Sn)
Sn
, tot
al s
oil a
vaila
ble
N
%
Con
side
rs s
oil i
norg
anic
N
(Kel
ling
et a
l. 20
03)
N
UE
=Pn÷
Sf
%
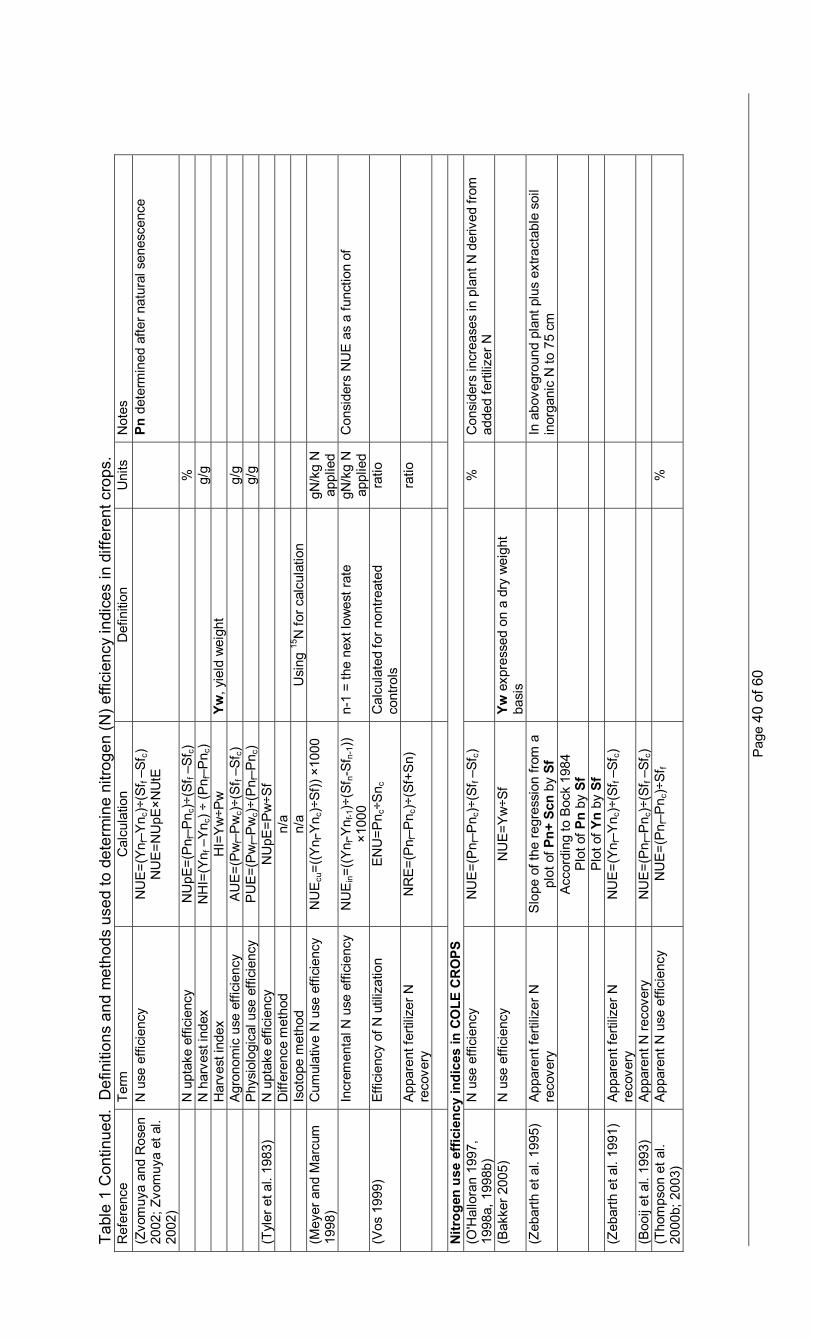
Pag
e 40
of 6
0
Tabl
e 1
Con
tinue
d. D
efin
ition
s an
d m
etho
ds u
sed
to d
eter
min
e ni
troge
n (N
) effi
cien
cy in
dice
s in
diff
eren
t cro
ps.
Ref
eren
ce
Term
C
alcu
latio
n D
efin
ition
U
nits
N
otes
(Z
vom
uya
and
Ros
en
2002
; Zvo
muy
a et
al.
2002
)
N u
se e
ffici
ency
N
UE
=(Y
n f–Y
n c)÷
(Sf f
–Sf c)
N
UE
=NU
pE×N
UtE
Pn
det
erm
ined
afte
r nat
ural
sen
esce
nce
N
upt
ake
effic
ienc
y N
UpE
=(P
n f–P
n c)÷
(Sf f
–Sf c)
%
N h
arve
st in
dex
NH
I=(Y
n f –
Yn c
) ÷ (P
n f–P
n c)
g/
g
H
arve
st in
dex
HI=
Yw
÷Pw
Yw
, yie
ld w
eigh
t
Agr
onom
ic u
se e
ffici
ency
A
UE
=(P
wf–
Pw
c)÷(
Sf f
–Sf c)
g/g
Phy
siol
ogic
al u
se e
ffici
ency
P
UE
=(P
wf–
Pw
c)÷(
Pn f
–Pn c
)
g/g
(T
yler
et a
l. 19
83)
N u
ptak
e ef
ficie
ncy
NU
pE=P
w÷S
f
D
iffer
ence
met
hod
n/a
Isot
ope
met
hod
n/a
Usi
ng 15
N fo
r cal
cula
tion
(Mey
er a
nd M
arcu
m
1998
) C
umul
ativ
e N
use
effi
cien
cy
NU
Ecu
=((Y
n f-Y
n c)÷
Sf))
×10
00
gN
/kg
N
appl
ied
In
crem
enta
l N u
se e
ffici
ency
N
UE
in=(
(Yn f
-Yn f
-1)÷
(Sf n
-Sf n-
1))
×100
0 n-
1 =
the
next
low
est r
ate
gN/k
g N
ap
plie
d C
onsi
ders
NU
E a
s a
func
tion
of
(Vos
199
9)
Effic
ienc
y of
N u
tiliz
atio
n E
NU
=Pn c
÷Sn c
C
alcu
late
d fo
r non
treat
ed
cont
rols
ra
tio
A
ppar
ent f
ertil
izer
N
reco
very
N
RE
=(P
n f–P
n c)÷
(Sf+
Sn)
ratio
Nitr
ogen
use
effi
cien
cy in
dice
s in
CO
LE C
RO
PS
(O'H
allo
ran
1997
, 19
98a,
199
8b)
N u
se e
ffici
ency
N
UE
=(P
n f–P
n c)÷
(Sf f
–Sf c)
%
Con
side
rs in
crea
ses
in p
lant
N d
eriv
ed fr
om
adde
d fe
rtiliz
er N
(B
akke
r 200
5)
N u
se e
ffici
ency
N
UE
=Yw
÷Sf
Yw
exp
ress
ed o
n a
dry
wei
ght
basi
s
(Zeb
arth
et a
l. 19
95)
App
aren
t fer
tiliz
er N
re
cove
ry
Slo
pe o
f the
regr
essi
on fr
om a
pl
ot o
f Pn+
Scn
by
Sf
In a
bove
grou
nd p
lant
plu
s ex
tract
able
soi
l in
orga
nic
N to
75
cm
Acc
ordi
ng to
Boc
k 19
84
Plo
t of P
n by
Sf
Plo
t of Y
n by
Sf
(Z
ebar
th e
t al.
1991
) A
ppar
ent f
ertil
izer
N
reco
very
N
UE
=(Y
n f–Y
n c)÷
(Sf f
–Sf c)
(Boo
ij et
al.
1993
) A
ppar
ent N
reco
very
N
UE
=(P
n f–P
n c)÷
(Sf f
–Sf c)
(Tho
mps
on e
t al.
2000
b; 2
003)
A
ppar
ent N
use
effi
cien
cy
NU
E=(
Pn f
–Pn c
)÷Sf
f
%
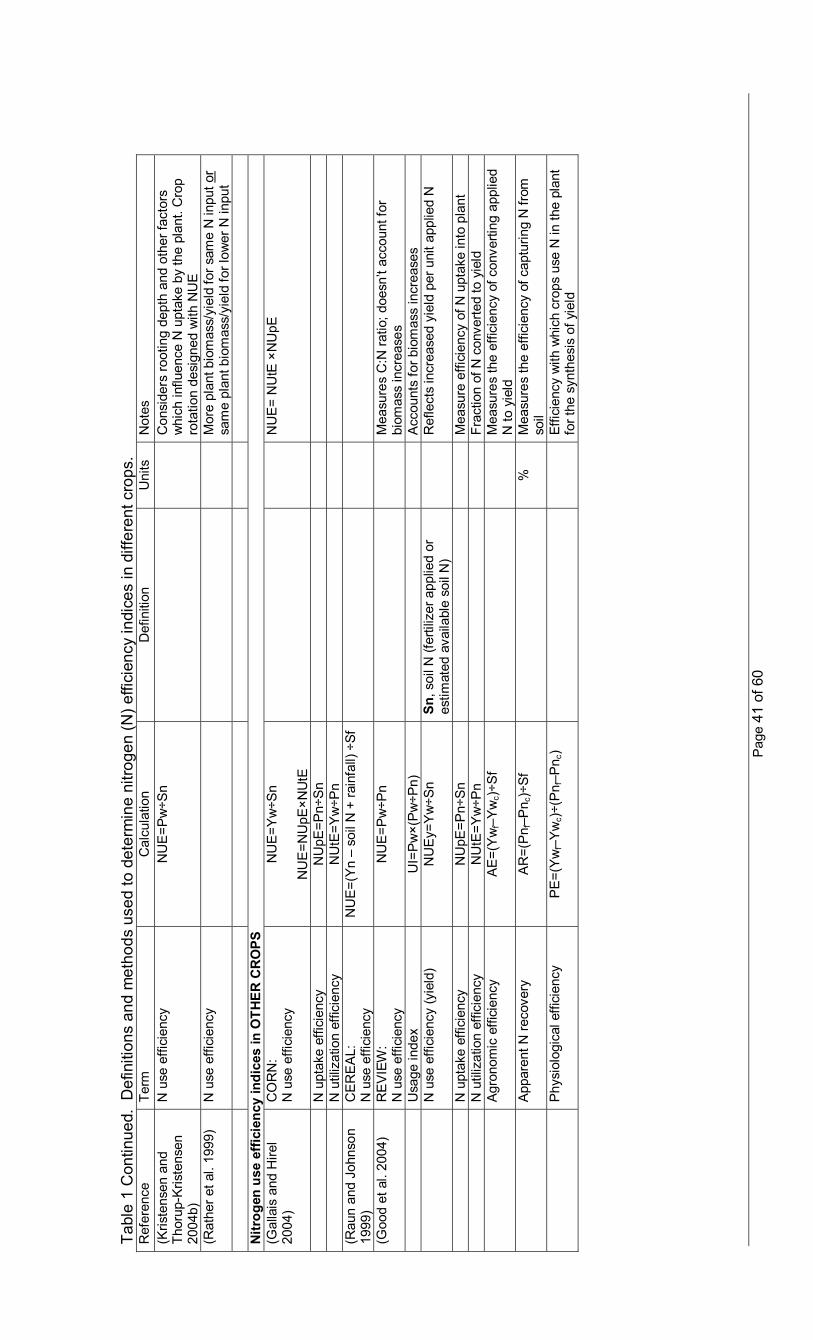
Pag
e 41
of 6
0
Tabl
e 1
Con
tinue
d. D
efin
ition
s an
d m
etho
ds u
sed
to d
eter
min
e ni
troge
n (N
) effi
cien
cy in
dice
s in
diff
eren
t cro
ps.
Ref
eren
ce
Term
C
alcu
latio
n D
efin
ition
U
nits
N
otes
(K
riste
nsen
and
Th
orup
-Kris
tens
en
2004
b)
N u
se e
ffici
ency
N
UE
=Pw
÷Sn
Con
side
rs ro
otin
g de
pth
and
othe
r fac
tors
w
hich
influ
ence
N u
ptak
e by
the
plan
t. C
rop
rota
tion
desi
gned
with
NU
E
(Rat
her e
t al.
1999
) N
use
effi
cien
cy
M
ore
plan
t bio
mas
s/yi
eld
for s
ame
N in
put o
r sa
me
plan
t bio
mas
s/yi
eld
for l
ower
N in
put
Nitr
ogen
use
effi
cien
cy in
dice
s in
OTH
ER C
RO
PS
(Gal
lais
and
Hire
l 20
04)
CO
RN
: N
use
effi
cien
cy
NU
E=Y
w÷S
n
N
UE
=NU
pE×N
UtE
NU
E=
NU
tE ×
NU
pE
N
upt
ake
effic
ienc
y N
UpE
=Pn÷
Sn
N u
tiliz
atio
n ef
ficie
ncy
NU
tE=Y
w÷P
n
(Rau
n an
d Jo
hnso
n 19
99)
CE
RE
AL:
N
use
effi
cien
cy
NU
E=(
Yn
– so
il N
+ ra
infa
ll) ÷
Sf
(Goo
d et
al.
2004
) R
EV
IEW
: N
use
effi
cien
cy
NU
E=P
w÷P
n
M
easu
res
C:N
ratio
; doe
sn’t
acco
unt f
or
biom
ass
incr
ease
s
Usa
ge in
dex
UI=
Pw
×(P
w÷P
n)
Acc
ount
s fo
r bio
mas
s in
crea
ses
N
use
effi
cien
cy (y
ield
) N
UE
y=Y
w÷S
n Sn
, soi
l N (f
ertil
izer
app
lied
or
estim
ated
ava
ilabl
e so
il N
)
Ref
lect
s in
crea
sed
yiel
d pe
r uni
t app
lied
N
N
upt
ake
effic
ienc
y N
UpE
=Pn÷
Sn
Mea
sure
effi
cien
cy o
f N u
ptak
e in
to p
lant
N u
tiliz
atio
n ef
ficie
ncy
NU
tE=Y
w÷P
n
Fr
actio
n of
N c
onve
rted
to y
ield
Agr
onom
ic e
ffici
ency
A
E=(
Yw
f–Y
wc)
÷Sf
Mea
sure
s th
e ef
ficie
ncy
of c
onve
rting
app
lied
N to
yie
ld
A
ppar
ent N
reco
very
A
R=(
Pn f
–Pn c
)÷Sf
%
Mea
sure
s th
e ef
ficie
ncy
of c
aptu
ring
N fr
om
soil
P
hysi
olog
ical
effi
cien
cy
PE
=(Y
wf–
Yw
c)÷(
Pn f
–Pn c
)
Ef
ficie
ncy
with
whi
ch c
rops
use
N in
the
plan
t fo
r the
syn
thes
is o
f yie
ld
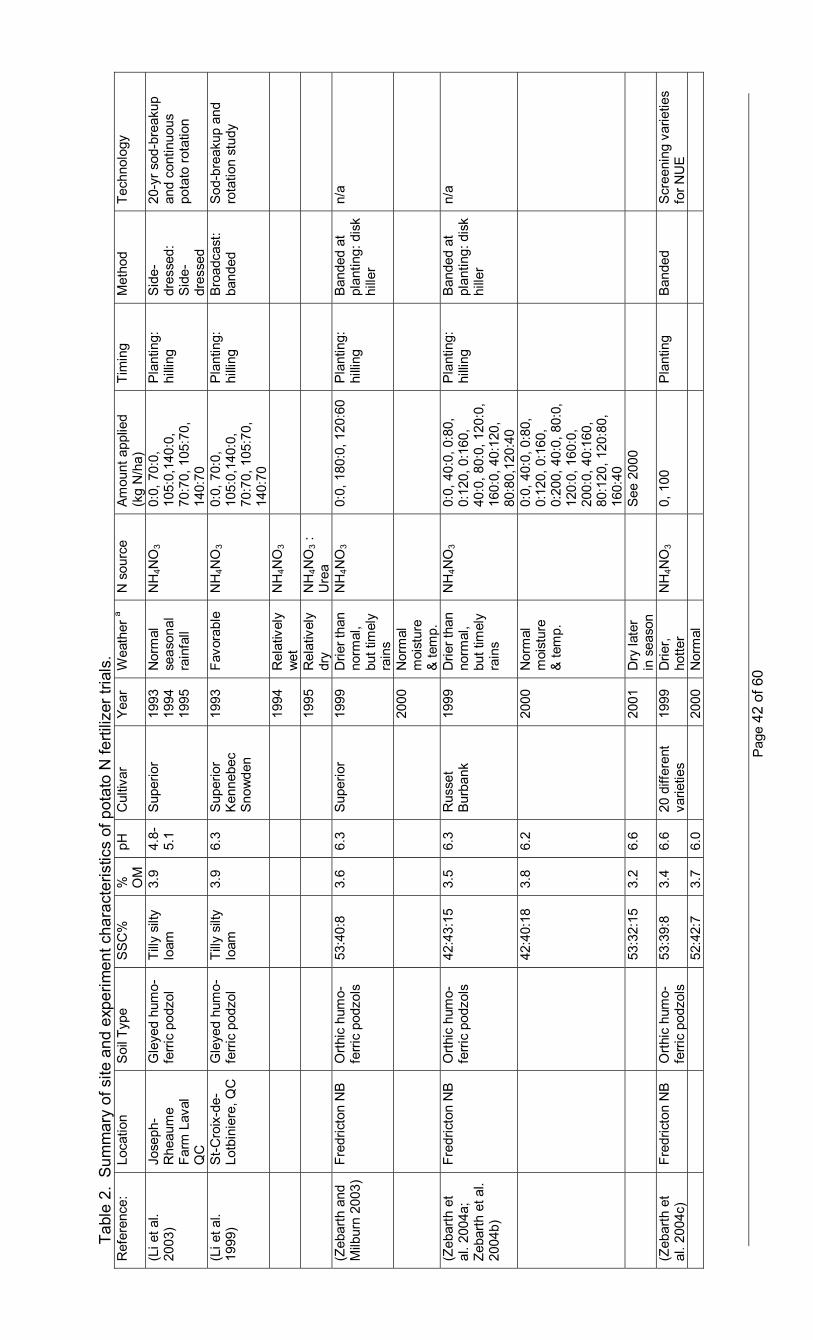
Pag
e 42
of 6
0
Tabl
e 2.
Sum
mar
y of
site
and
exp
erim
ent c
hara
cter
istic
s of
pot
ato
N fe
rtiliz
er tr
ials
. R
efer
ence
: Lo
catio
n S
oil T
ype
SS
C%
%
O
M
pH
Cul
tivar
Y
ear
Wea
ther
a N
sou
rce
Amou
nt a
pplie
d (k
g N
/ha)
Ti
min
g
Met
hod
Te
chno
logy
(Li e
t al.
2003
) Jo
seph
-R
heau
me
Farm
Lav
al
QC
Gle
yed
hum
o-fe
rric
podz
ol
Tilly
silt
y lo
am
3.9
4.8-
5.1
Sup
erio
r 19
93
1994
19
95
Nor
mal
se
ason
al
rain
fall
NH
4NO
3 0:
0, 7
0:0,
10
5:0,
140:
0,
70:7
0, 1
05:7
0,
140:
70
Pla
ntin
g:
hillin
g S
ide-
dres
sed:
S
ide-
dres
sed
20-y
r sod
-bre
akup
an
d co
ntin
uous
po
tato
rota
tion
(Li e
t al.
1999
) S
t-Cro
ix-d
e-Lo
tbin
iere
, QC
G
leye
d hu
mo-
ferri
c po
dzol
Ti
lly s
ilty
loam
3.
9 6.
3 S
uper
ior
Ken
nebe
c S
now
den
1993
Fa
vora
ble
NH
4NO
3 0:
0, 7
0:0,
10
5:0,
140:
0,
70:7
0, 1
05:7
0,
140:
70
Pla
ntin
g:
hillin
g B
road
cast
: ba
nded
S
od-b
reak
up a
nd
rota
tion
stud
y
19
94
Rel
ativ
ely
wet
N
H4N
O3
19
95
Rel
ativ
ely
dry
NH
4NO
3 :
Ure
a
(Zeb
arth
and
M
ilbur
n 20
03)
Fred
ricto
n N
B
Orth
ic h
umo-
ferri
c po
dzol
s 53
:40:
8 3.
6 6.
3 S
uper
ior
19
99
D
rier t
han
norm
al,
but t
imel
y ra
ins
NH
4NO
3 0:
0, 1
80:0
, 120
:60
Pla
ntin
g:
hillin
g B
ande
d at
pl
antin
g: d
isk
hille
r
n/a
20
00
Nor
mal
m
oist
ure
& te
mp.
(Zeb
arth
et
al. 2
004a
; Ze
barth
et a
l. 20
04b)
Fred
ricto
n N
B
Orth
ic h
umo-
ferri
c po
dzol
s 42
:43:
15
3.5
6.3
Rus
set
Bur
bank
19
99
Drie
r tha
n no
rmal
, bu
t tim
ely
rain
s
NH
4NO
3 0:
0, 4
0:0,
0:8
0,
0:12
0, 0
:160
, 40
:0, 8
0:0,
120
:0,
160:
0, 4
0:12
0,
80:8
0,12
0:40
Pla
ntin
g:
hillin
g B
ande
d at
pl
antin
g: d
isk
hille
r
n/a
42
:40:
18
3.8
6.2
20
00
Nor
mal
m
oist
ure
& te
mp.
0:
0, 4
0:0,
0:8
0,
0:12
0, 0
:160
, 0:
200,
40:
0, 8
0:0,
12
0:0,
160
:0,
200:
0, 4
0:16
0,
80:1
20, 1
20:8
0,
160:
40
53
:32:
15
3.2
6.6
20
01
Dry
late
r in
sea
son
S
ee 2
000
(Zeb
arth
et
al. 2
004c
) Fr
edric
ton
NB
O
rthic
hum
o-fe
rric
podz
ols
53:3
9:8
3.4
6.6
20 d
iffer
ent
varie
ties
1999
D
rier,
hotte
r N
H4N
O3
0, 1
00
Pla
ntin
g B
ande
d
Scr
eeni
ng v
arie
ties
for N
UE
52:4
2:7
3.7
6.0
20
00
Nor
mal
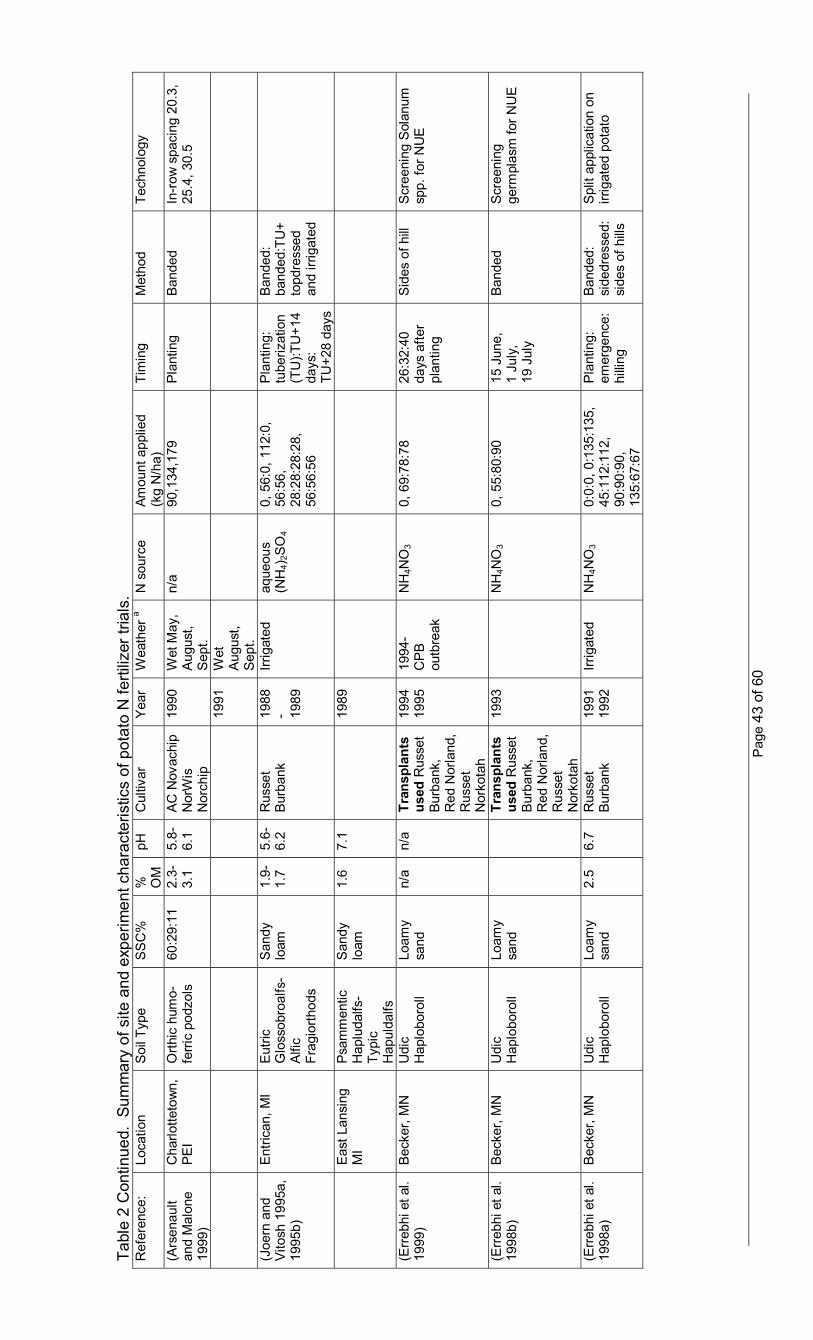
Pag
e 43
of 6
0
Tabl
e 2
Con
tinue
d. S
umm
ary
of s
ite a
nd e
xper
imen
t cha
ract
eris
tics
of p
otat
o N
ferti
lizer
tria
ls.
Ref
eren
ce:
Loca
tion
Soi
l Typ
e S
SC
%
%
OM
pH
C
ultiv
ar
Yea
r W
eath
er a
N s
ourc
e Am
ount
app
lied
(kg
N/h
a)
Tim
ing
M
etho
d
Tech
nolo
gy
(Ars
enau
lt an
d M
alon
e 19
99)
Cha
rlotte
tow
n,
PE
I O
rthic
hum
o-fe
rric
podz
ols
60:2
9:11
2.
3-3.
1 5.
8-6.
1 A
C N
ovac
hip
Nor
Wis
N
orch
ip
1990
W
et M
ay,
Aug
ust,
Sep
t.
n/a
90,1
34,1
79
Pla
ntin
g
Ban
ded
In-r
ow s
paci
ng 2
0.3,
25
.4, 3
0.5
19
91
Wet
A
ugus
t, S
ept.
(Joe
rn a
nd
Vito
sh 1
995a
, 19
95b)
Ent
rican
, MI
Eut
ric
Glo
ssob
roal
fs-
Alfi
c Fr
agio
rthod
s
San
dy
loam
1.
9-1.
7 5.
6-6.
2 R
usse
t B
urba
nk
1988
- 1989
Irrig
ated
aq
ueou
s (N
H4)
2SO
4 0,
56:
0, 1
12:0
, 56
:56,
28
:28:
28:2
8,
56:5
6:56
Pla
ntin
g:
tube
rizat
ion
(TU
):TU
+14
days
: TU
+28
days
Ban
ded:
ba
nded
:TU
+ to
pdre
ssed
an
d irr
igat
ed
E
ast L
ansi
ng
MI
Psa
mm
entic
H
aplu
dalfs
-Ty
pic
Hap
ulda
lfs
San
dy
loam
1.
6 7.
1
1989
(Err
ebhi
et a
l. 19
99)
Bec
ker,
MN
U
dic
Hap
lobo
roll
Loam
y sa
nd
n/a
n/a
Tran
spla
nts
used
Rus
set
Bur
bank
, R
ed N
orla
nd,
Rus
set
Nor
kota
h
1994
19
95
1994
- C
PB
ou
tbre
ak
NH
4NO
3 0,
69:
78:7
8 26
:32:
40
days
afte
r pl
antin
g
Sid
es o
f hill
Scr
eeni
ng S
olan
um
spp.
for N
UE
(Err
ebhi
et a
l. 19
98b)
B
ecke
r, M
N
Udi
c H
aplo
boro
ll Lo
amy
sand
Tr
ansp
lant
s us
ed R
usse
t B
urba
nk,
Red
Nor
land
, R
usse
t N
orko
tah
1993
NH
4NO
3 0,
55:
80:9
0 15
Jun
e,
1 Ju
ly,
19 J
uly
Ban
ded
Scr
eeni
ng
germ
plas
m fo
r NU
E
(Err
ebhi
et a
l. 19
98a)
B
ecke
r, M
N
Udi
c H
aplo
boro
ll Lo
amy
sand
2.
5 6.
7 R
usse
t B
urba
nk
1991
19
92
Irrig
ated
N
H4N
O3
0:0:
0, 0
:135
:135
, 45
:112
:112
, 90
:90:
90,
135:
67:6
7
Pla
ntin
g:
emer
genc
e:
hillin
g
Ban
ded:
si
dedr
esse
d:
side
s of
hills
Spl
it ap
plic
atio
n on
irr
igat
ed p
otat
o
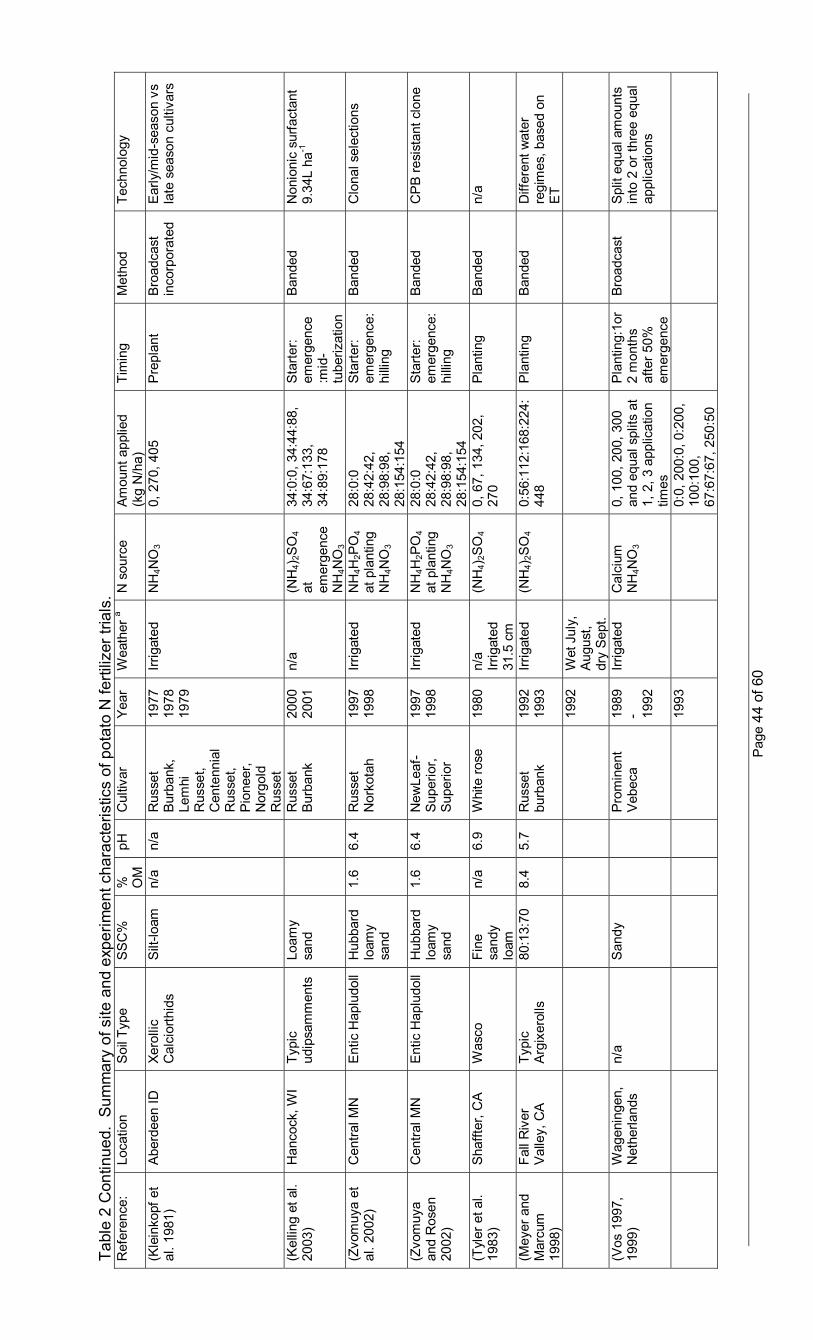
Pag
e 44
of 6
0
Tabl
e 2
Con
tinue
d. S
umm
ary
of s
ite a
nd e
xper
imen
t cha
ract
eris
tics
of p
otat
o N
ferti
lizer
tria
ls.
Ref
eren
ce:
Loca
tion
Soi
l Typ
e S
SC
%
%
OM
pH
C
ultiv
ar
Yea
r W
eath
er a
N s
ourc
e Am
ount
app
lied
(kg
N/h
a)
Tim
ing
M
etho
d
Tech
nolo
gy
(Kle
inko
pf e
t al
. 198
1)
Abe
rdee
n ID
Xe
rolli
c C
alci
orth
ids
Silt
-loam
n/
a n/
a R
usse
t B
urba
nk,
Lem
hi
Rus
set,
Cen
tenn
ial
Rus
set,
Pio
neer
, N
orgo
ld
Rus
set
1977
19
78
1979
Irrig
ated
N
H4N
O3
0, 2
70, 4
05
Pre
plan
t B
road
cast
in
corp
orat
ed
Ear
ly/m
id-s
easo
n vs
la
te s
easo
n cu
ltiva
rs
(Kel
ling
et a
l. 20
03)
Han
cock
, WI
Typi
c ud
ipsa
mm
ents
Lo
amy
sand
R
usse
t B
urba
nk
2000
20
01
n/a
(NH
4)2S
O4
at
emer
genc
e N
H4N
O3
34:0
:0, 3
4:44
:88,
34
:67:
133,
34
:89:
178
Sta
rter:
emer
genc
e :m
id-
tube
rizat
ion
Ban
ded
Non
ioni
c su
rfact
ant
9.34
L ha
-1
(Zvo
muy
a et
al
. 200
2)
Cen
tral M
N
Ent
ic H
aplu
doll
Hub
bard
lo
amy
sand
1.6
6.4
Rus
set
Nor
kota
h 19
97
1998
Irr
igat
ed
NH
4H2P
O4
at p
lant
ing
NH
4NO
3
28:0
:0
28:4
2:42
, 28
:98:
98,
28:1
54:1
54
Sta
rter:
emer
genc
e:hi
lling
Ban
ded
Clo
nal s
elec
tions
(Zvo
muy
a an
d R
osen
20
02)
Cen
tral M
N
Ent
ic H
aplu
doll
Hub
bard
lo
amy
sand
1.6
6.4
New
Leaf
-S
uper
ior,
Sup
erio
r
1997
19
98
Irrig
ated
N
H4H
2PO
4 at
pla
ntin
g N
H4N
O3
28:0
:0
28:4
2:42
, 28
:98:
98,
28:1
54:1
54
Sta
rter:
emer
genc
e:hi
lling
Ban
ded
CP
B re
sist
ant c
lone
(Tyl
er e
t al.
1983
) S
hafft
er, C
A
Was
co
Fine
sa
ndy
loam
n/a
6.9
Whi
te ro
se
1980
n/
a Irr
igat
ed
31.5
cm
(NH
4)2S
O4
0, 6
7, 1
34, 2
02,
270
Pla
ntin
g B
ande
d
n/a
(Mey
er a
nd
Mar
cum
19
98)
Fall
Riv
er
Val
ley,
CA
Ty
pic
Arg
ixer
olls
80
:13:
70
8.4
5.7
Rus
set
burb
ank
1992
1993
Irr
igat
ed
(NH
4)2S
O4
0:56
:112
:168
:224
:44
8 P
lant
ing
B
ande
d D
iffer
ent w
ater
re
gim
es, b
ased
on
ET
19
92
Wet
Jul
y,
Aug
ust,
dry
Sep
t.
(Vos
199
7,
1999
) W
agen
inge
n,
Net
herla
nds
n/a
San
dy
Pro
min
ent
Veb
eca
1989
- 1992
Irrig
ated
C
alci
um
NH
4NO
3 0,
100
, 200
, 300
an
d eq
ual s
plits
at
1, 2
, 3 a
pplic
atio
n tim
es
Pla
ntin
g:1o
r 2
mon
ths
afte
r 50%
em
erge
nce
Bro
adca
st
Spl
it eq
ual a
mou
nts
into
2 o
r thr
ee e
qual
ap
plic
atio
ns
19
93
0:0,
200
:0, 0
:200
, 10
0:10
0,
67:6
7:67
, 250
:50
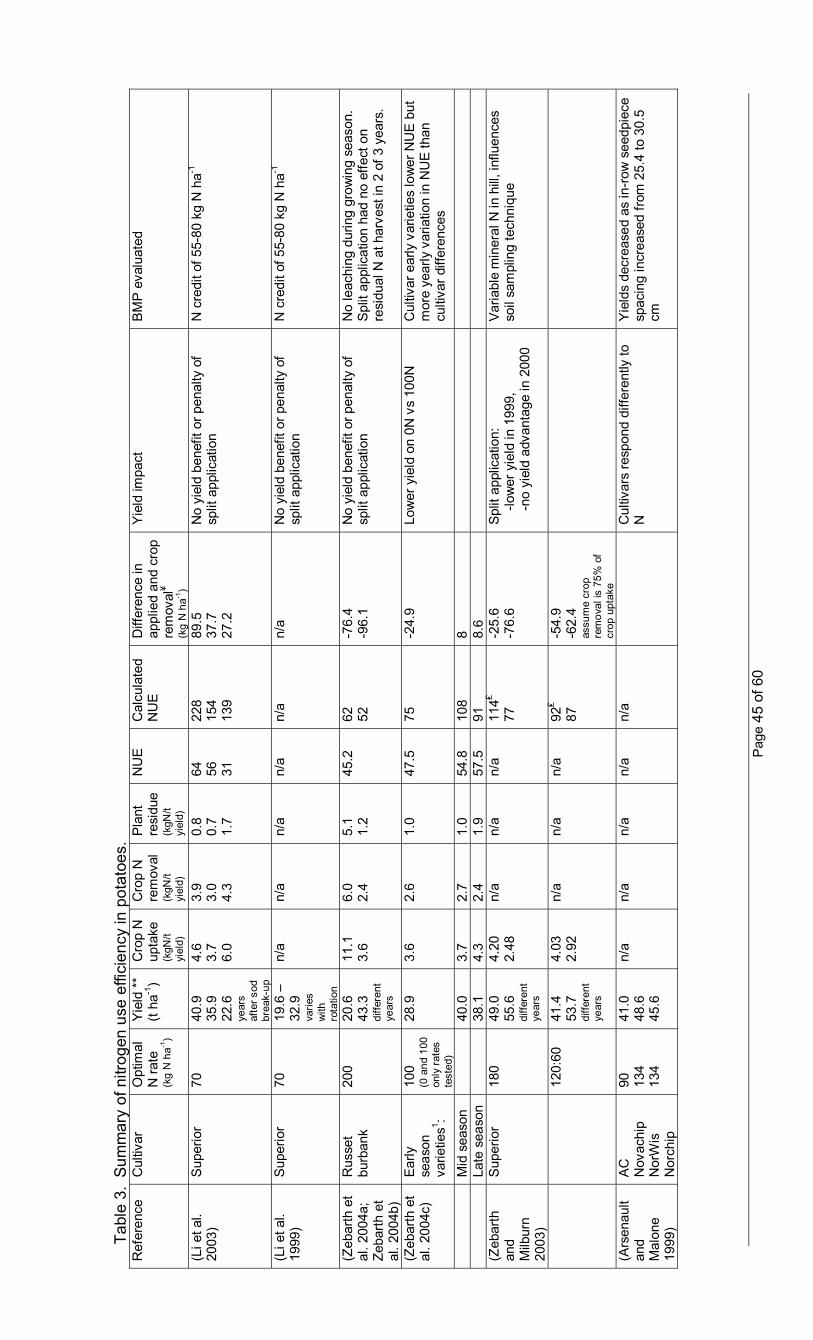
Pag
e 45
of 6
0
Tabl
e 3.
Sum
mar
y of
nitr
ogen
use
effi
cien
cy in
pot
atoe
s.
Ref
eren
ce
Cul
tivar
O
ptim
al
N ra
te
(kg
N h
a-1)
Yie
ld *
* (t
ha-1
) C
rop
N
upta
ke
(kgN
/t
yiel
d)
Cro
p N
re
mov
al
(kgN
/t
yiel
d)
Pla
nt
resi
due
(kgN
/t yi
eld)
NU
E
Cal
cula
ted
NU
E
Diff
eren
ce in
ap
plie
d an
d cr
op
rem
oval
¥ (k
g N
ha-1
)
Yie
ld im
pact
B
MP
eva
luat
ed
(Li e
t al.
2003
) S
uper
ior
70
40.9
35
.9
22.6
ye
ars
afte
r sod
br
eak-
up
4.6
3.7
6.0
3.9
3.0
4.3
0.8
0.7
1.7
64
56
31
228
154
139
89.5
37
.7
27.2
No
yiel
d be
nefit
or p
enal
ty o
f sp
lit a
pplic
atio
n N
cre
dit o
f 55-
80 k
g N
ha-1
(Li e
t al.
1999
) S
uper
ior
70
19.6
–
32.9
va
ries
with
ro
tatio
n
n/a
n/a
n/a
n/a
n/a
n/a
No
yiel
d be
nefit
or p
enal
ty o
f sp
lit a
pplic
atio
n N
cre
dit o
f 55-
80 k
g N
ha-1
(Zeb
arth
et
al. 2
004a
; Ze
barth
et
al. 2
004b
)
Rus
set
burb
ank
200
20
.6
43.3
di
ffere
nt
year
s
11.1
3.
6 6.
0 2.
4 5.
1 1.
2 45
.2
62
52
-76.
4 -9
6.1
No
yiel
d be
nefit
or p
enal
ty o
f sp
lit a
pplic
atio
n N
o le
achi
ng d
urin
g gr
owin
g se
ason
. S
plit
appl
icat
ion
had
no e
ffect
on
resi
dual
N a
t har
vest
in 2
of 3
yea
rs.
(Zeb
arth
et
al. 2
004c
) E
arly
se
ason
va
rietie
s1 :
100
(0
and
100
on
ly ra
tes
test
ed)
28.9
3.
6 2.
6 1.
0 47
.5
75
-24.
9 Lo
wer
yie
ld o
n 0N
vs
100N
C
ultiv
ar e
arly
var
ietie
s lo
wer
NU
E b
ut
mor
e ye
arly
var
iatio
n in
NU
E th
an
culti
var d
iffer
ence
s
Mid
sea
son
40.0
3.
7 2.
7 1.
0 54
.8
108
8
Late
sea
son
38
.1
4.3
2.4
1.9
57.5
91
8.
6
(Z
ebar
th
and
Milb
urn
2003
)
Sup
erio
r 18
0 49
.0
55.6
di
ffere
nt
year
s
4.20
2.
48
n/a
n/a
n/a
114₤
77
-25.
6 -7
6.6
Spl
it ap
plic
atio
n:
-low
er y
ield
in 1
999,
-n
o yi
eld
adva
ntag
e in
200
0
Var
iabl
e m
iner
al N
in h
ill, in
fluen
ces
soil
sam
plin
g te
chni
que
120:
60
41.4
53
.7
diffe
rent
ye
ars
4.03
2.
92
n/a
n/a
n/a
92₤
87
-54.
9 -6
2.4
assu
me
crop
re
mov
al is
75%
of
crop
upt
ake
(Ars
enau
lt an
d M
alon
e 19
99)
AC
N
ovac
hip
Nor
Wis
N
orch
ip
90
134
134
41.0
48
.6
45.6
n/a
n/a
n/a
n/a
n/a
C
ultiv
ars
resp
ond
diffe
rent
ly to
N
Y
ield
s de
crea
sed
as in
-row
see
dpie
ce
spac
ing
incr
ease
d fro
m 2
5.4
to 3
0.5
cm
Pag
e 46
of 6
0
Tabl
e 3
Con
tinue
d. S
umm
ary
of n
itrog
en u
se e
ffici
ency
in p
otat
oes.
R
efer
ence
C
ultiv
ar
Opt
imal
N
rate
(k
g N
ha-1
)
Yie
ld *
* (t
ha-1
) C
rop
N
upta
ke
(kgN
/t
yiel
d)
Cro
p N
re
mov
al
(kgN
/t
yiel
d)
Pla
nt
resi
due
(kgN
/t yi
eld)
NU
E
Cal
cula
ted
NU
E
Diff
eren
ce in
ap
plie
d an
d cr
op
rem
oval
¥ (k
g N
ha-1
)
Yie
ld im
pact
B
MP
eva
luat
ed
(Joe
rn a
nd
Vito
sh
1995
a,
1995
b)
Rus
set
Bur
bank
, 11
2 (0
and
112
on
ly ra
te
test
ed)
≈35
≈43
diffe
rent
si
tes
6.4
4.7
2.0
3.1
2.9
1.9
3.4
1.8
0.1
34
200
147
77
-5
-10
-30
1 ou
t of 3
exp
erim
ents
had
in
crea
sed
yiel
ds w
ith s
plit
appl
icat
ions
(Err
ebhi
et
al. 1
999)
Tr
ansp
lant
s us
ed
Rus
set
Bur
bank
, R
usse
t N
orko
tah
R
ed N
orla
nd
225
(0 a
nd 2
25
only
rate
s te
sted
)
Yie
ld n
ot
repo
rted
639g
N/
plan
t 43
5 29
8
433
gN/p
lant
39
9 27
0
206
gN/p
lant
36
28
15.5
10
.5
7.5
n/
a
NU
E v
arie
s m
ore
with
yea
r co
mpa
red
to c
ultiv
ar d
iffer
ence
s P
oten
tial t
o us
e So
lanu
m s
pp. t
o in
crea
se N
UE
(Err
ebhi
et
al. 1
998b
) Tr
ansp
lant
s us
ed
Rus
set
Bur
bank
, R
usse
t N
orko
tah
R
ed N
orla
nd
225
(0 a
nd 2
25
only
rate
s te
sted
)
Yie
ld n
ot
repo
rted
304
gN/p
lant
16
1 94
230
gN/p
lant
15
1 89
74
gN/p
lant
10
5
44.8
23
.8
14.3
n/
a R
.Bur
bank
, R.N
orko
tah
=Goo
d N
fora
ger a
nd re
spon
se
Red
Nor
land
=poo
r for
ager
, go
od N
resp
onse
Pot
entia
l to
use
Sola
num
spp
. to
incr
ease
NU
E
(Err
ebhi
et
al. 1
998a
) R
usse
t B
urba
nk
270
(0 a
nd 2
70
only
rate
s te
sted
)
54.4
65
.3
diffe
rent
ye
ars
3.1
3.6
2.2
3.2
0.9
0.4
33.1
56
.1
44
77
-150
.3
-61.
0 N
o di
ffere
nce
in y
ield
but
less
cu
lls w
hen
low
er N
at p
lant
ing
Red
ucin
g %
of N
app
lied
at p
lant
ing
(Kle
inko
pf
et a
l. 19
81)
Rus
set
Bur
bank
, Le
mhi
R
usse
t, C
ente
nnia
l R
usse
t, P
ione
er,
Nor
gold
R
usse
t
270
48.5
5.
1 ≈3
.6±
≈1.5
55
.3
65
-95.
4 N
o re
latio
nshi
p be
twee
n yi
eld
or N
UE
and
dat
e of
mat
urity
. N
o re
latio
nshi
p be
twee
n N
UE
and
da
te o
f mat
urity
.
(Kel
ling
et
al. 2
003)
R
usse
t B
urba
nk
202
46
.0
59.6
di
ffere
nt
year
s
n/a
2.92
2.
76
n/a
66
₤ 81
-6
7.9
-37.
5 N
o be
nefit
of s
urfa
ctan
t on
yiel
d.
In o
ne y
ear,m
ore
crop
N re
mov
al a
t hi
gher
rate
s w
ith s
urfa
ctan
t
Pag
e 47
of 6
0
Tabl
e 3
Con
tinue
d. S
umm
ary
of n
itrog
en u
se e
ffici
ency
in p
otat
oes.
R
efer
ence
C
ultiv
ar
Opt
imal
N
rate
(k
g N
ha-1
)
Yie
ld *
* (t
ha-1
) C
rop
N
upta
ke
(kgN
/t
yiel
d)
Cro
p N
re
mov
al
(kgN
/t
yiel
d)
Pla
nt
resi
due
(kgN
/t yi
eld)
NU
E
Cal
cula
ted
NU
E
Diff
eren
ce in
ap
plie
d an
d cr
op
rem
oval
¥ (k
g N
ha-1
)
Yie
ld im
pact
B
MP
eva
luat
ed
(Zvo
muy
a et
al.
2002
) R
usse
t N
orko
tah
112
224
41.1
42
.2
3.0
3.9
2.7
3.2
0.3
0.7
40.3
36
.6
99
60
-1.0
-8
9.0
Yie
ld in
crea
sed
with
N ra
te in
on
e of
two
year
s.
New
clo
nes
(Zvo
muy
a an
d R
osen
20
02)
New
Leaf
-S
uper
ior,
Sup
erio
r
112
224
8.9
9.2
3.0
2.8
2.2
2.4
0.8
0.4
48.0
47
.9
17
10
-92.
4 -2
01.9
N
o di
ffere
nce
in y
ield
bet
wee
n cl
ones
Tw
o cl
ones
: New
Leaf
, res
ista
nt to
C
PB
, has
hig
her N
UE
at lo
w N
fe
rtiliz
er a
pplic
atio
ns
(Tyl
er e
t al.
1983
) W
hite
rose
13
4 58
.9
n/a
3.0
n/a
64.3
13
2 42
.7
15
N la
bele
d fe
rtiliz
er u
sed
to s
ee N
fro
m fe
rtiliz
er v
s so
il av
aila
ble
N
(Mey
er a
nd
Mar
cum
19
98)
Rus
set
Bur
bank
56
22
4 41
.6
51.6
n/
a 4.
4 3.
2 n/
a >2
00
>300
g
kg-1
327
74
127.
0 -5
8.9
Cal
iforn
ia d
ata
1.1
to 1
.3 E
T c a
pplie
d ov
erhe
ad w
ater
fo
r nea
r max
imum
yie
lds
Aver
age
142
40.7
4.
2 3.
1 1.
3 48
89
-3
6.1
Sta
ndar
d er
ror
13.4
2.
5 0.
4 0.
2 0.
3 4.
8
13.4
Num
ber
18
31
22
23
18
28
27
* In
dica
tes
tota
l pla
nt N
upt
ake
** D
iffer
ent n
umbe
rs in
dica
tes
diffe
renc
es o
bser
ved
in d
iffer
ent y
ears
. H
ighe
st a
nd lo
wes
t num
bers
are
repo
rted.
Cro
p up
take
and
rem
oval
and
oth
er c
olum
n ar
e re
porte
d fo
r eac
h yi
eld.
If
one
N a
pplic
atio
n ra
te is
giv
en, t
hen
valu
es a
re fo
r diff
eren
t cul
tivar
s.
1 Ave
rage
s fo
r ear
ly-,
mid
-, an
d la
te-m
atur
ing
varie
ties
are
repo
rted.
± T
abul
ated
num
bers
bas
ed o
n es
timat
ed v
alue
s ta
ken
from
gra
phs.
¥ P
ositi
ve v
alue
s in
dica
te m
ore
crop
rem
oval
of N
than
ferti
lizer
app
lied
and
vice
ver
sa fo
r neg
ativ
e va
lues
. ₤ N
o N
UE
det
erm
ined
in th
e m
anus
crip
t. V
alue
s ca
lcul
ated
by
NU
pE=P
n÷Sf
×100
or
NU
pE=Y
n÷Sf
×100
dep
endi
ng o
n da
ta a
vaila
ble.
Pag
e 48
of 6
0
Tabl
e 4.
Sum
mar
y of
site
and
exp
erim
ent c
hara
cter
istic
s of
col
e cr
op N
ferti
lizer
tria
ls.
Ref
eren
ce:
Loca
tion
Soi
l Typ
e S
SC
%
OM
%
pH
C
rop:
V
arie
ty
Yea
r W
eath
er
N s
ourc
e Am
ount
app
lied
(kg
N h
a-1)
Tim
ing
M
etho
d
Tech
nolo
gy
(Bak
ker
2005
) S
imco
e, O
N
Bru
niso
lic
Gra
y B
row
n Lu
viso
l
64:3
1:5
1.3
6.6
Bro
ccol
i: D
ecat
hlon
C
apta
in
2000
20
01
Tric
kle
irrig
atio
n 19
7 -2
50
mm
NH
4NO
3 0,
50,
100
, 150
, 20
0, 3
00, 4
00
Tran
spla
ntin
g B
road
cast
in
corp
orat
ed
(McK
eow
n an
d B
akke
r 20
05a,
20
05b)
Sim
coe,
ON
C
aulif
low
er:
Ape
x C
abba
ge:
Hur
on
2003
20
04
Ferti
gate
d n/
a 0
– 40
0
50%
pre
plan
t: 50
% w
eekl
y fe
rtiga
tion
Bro
adca
st:
ferti
gatio
n In
tera
ctio
n of
wat
er a
nd
N
(O'H
allo
ran
1997
) S
imco
e, O
N
2 si
tes:
S
andy
lo
am,
Cla
y lo
am
n/a
n/a
Cab
bage
19
96
Floo
ding
in
Sep
t. N
H4N
O3
100,
270
, 440
Tr
ansp
lant
ing
n/
a In
tera
ctio
n be
twee
n ra
tios
of N
:P:K
(O'H
allo
ran
1998
b)
Sim
coe,
ON
2
site
s:
San
dy
loam
, C
lay
loam
19
97
N
H4N
O3
143,
215
, 286
, 430
Tr
ansp
lant
ing
or
50%
:25%
:25%
pl
antin
g:21
DAT
:49D
AT
n/a
Spl
it ap
plic
atio
ns
(O'H
allo
ran
1998
a)
Sim
coe,
ON
2
site
s:
San
dy
loam
, C
lay
loam
19
98
Dry
N
H4N
O3
100:
0, 2
00:0
, 40
0:0,
50:
25,
50:7
5, 5
0:12
5,
50:1
75, 1
00:2
5,
100:
75, 1
00:1
25,
100:
175
Tran
spla
ntin
g:
21 D
AT
Bro
adca
st o
r st
rip
Spl
it ap
plic
atio
ns a
nd
strip
vs
broa
dcas
t app
ly
(Bél
ec e
t al.
2001
; C
oulo
mbe
et
al. 1
999)
St-C
roix
-de-
Lotb
inie
re,
QC
Bed
ford
S
andy
cl
ay
loam
5.9
B
rocc
oli
1995
19
96
Irrig
ated
C
alci
um
NH
4NO
3 N
min, 5
0 - N
min,
100
- Nm
in, w
ith
four
sid
edre
ss o
f 0,
50,
100
, 150
Tran
spla
ntin
g:
35 D
AT
Bro
adca
st:
side
dres
sed
Pet
iole
sap
test
s to
de
term
ine
suffi
cien
cy
At 3
0 cm
dep
th in
199
6:
Nm
in =
15 1
997:
Nm
in =
33
L’
Aca
die
St-B
lais
e C
lay
loam
6.
5
N
min =
15
(San
ders
on
and
Ivan
y 19
99)
PE
I H
umo-
Ferr
ic
Pod
zols
2.
3 – 3.
3
5.3-
6.1
Bro
ccol
i: P
rem
ium
C
rop
1988
- 1991
n/a
NH
4NO
3 90
:0, 1
20:0
, 150
:0,
78:4
2, 4
8:42
Tr
ansp
lant
ing:
28
DA
T B
road
cast
in
corp
orat
ed
App
licat
ion
met
hod:
br
oadc
ast,
band
ed, s
plit
Loam
y sa
nd –
sa
ndy
loam
B
russ
els
spro
uts:
V
alia
nt
Cab
bage
: Le
nnox
Tran
spla
ntin
g:
48 D
AT
Pag
e 49
of 6
0
Tabl
e 4.
Sum
mar
y of
site
and
exp
erim
ent c
hara
cter
istic
s of
col
e cr
op N
ferti
lizer
tria
ls.
Ref
eren
ce:
Loca
tion
Soi
l Typ
e S
SC
%
OM
%
pH
C
rop:
V
arie
ty
Yea
r W
eath
er
N s
ourc
e Am
ount
app
lied
(kg
N h
a-1)
Tim
ing
M
etho
d
Tech
nolo
gy
(Bow
en e
t al
. 199
9;
Toiv
onen
et
al. 1
994;
Ze
barth
et
al. 1
995)
Aga
ssiz
, BC
E
utric
E
luvi
ated
B
runi
sol
Med
ium
te
xtur
ed
1.9
5.9
Bro
ccol
i: Em
pero
r 19
90
1991
Irr
igat
ed
NH
4NO
3 0:
0, 6
2.5:
62.5
, 12
5:12
5,
187.
5:18
7.5,
31
2.5:
312.
5,
Tran
spla
ntin
g:1
4 D
ATα
B
road
cast
by
han
d n/
a E
qual
spl
its a
nd n
o pr
epla
nt a
pplic
atio
n
(Zeb
arth
et
al. 1
991)
A
gass
iz, B
C
Eut
ric
Elu
viat
ed
Bru
niso
l
Med
ium
te
xtur
ed
5.5
5.5
Cab
bage
: B
arto
lo
1987
Irr
igat
ed
Ure
a
0:0,
50:
50,
100:
100,
120
:120
20
0:20
0, 2
50:2
50
Pre
-tran
spla
nt:
early
Jun
e B
road
cast
in
corp
orat
ed:b
road
cast
4.0
5.7
19
88
(Kow
alen
ko
and
Hal
l 19
87a,
19
87b)
Aga
ssiz
, BC
E
utric
E
luvi
ated
B
runi
sol
Med
ium
te
xtur
ed
n/a
n/a
Bro
ccol
i: P
rem
ium
C
rop
1979
Nor
mal
ea
rly,
then
dry
NH
4NO
3 25
, 125
, 250
P
lant
ing,
dire
ct
seed
ed
Bro
adca
st
inco
rpor
ated
n/
a E
valu
ated
N ra
te
impa
ct o
n m
atur
ity
19
82
Dry
-Jun
, w
et-J
ul
NH
4NO
3 0,
25,
125
, 250
(Let
ey e
t al.
1983
) S
anta
Ana
C
A
Tupi
c Xe
roflu
vent
S
andy
lo
am
n/a
n/a
Bro
ccol
i: G
reen
C
omet
1980
D
ry la
nd
+ Irrig
ated
NH
4 Fe
rtiga
tion:
N
H4N
O3
30:3
0:30
, 60
:60:
60, 9
0:90
:90
Ferti
gatio
n- 3
0:
with
all
irrig
atio
n ev
ents
for 4
2 D
AT
Pla
ntin
g:15
D
ATα
:35D
AT
Ferti
gatio
n-
plan
ting:
irrig
ati
on w
ater
Ban
ded
Ferti
gatio
n –
dow
n fu
rrow
s
Ferti
gatio
n vs
soi
l ap
plie
d
S
orre
nto
CA
C
alci
c H
aplo
xero
ll Lo
am
19
81
Dry
land
+ Irr
igat
ed
NH
4 Fe
rtiga
tion:
U
AN
38:3
8:38
, 75:
75:7
5 P
lant
ing:
42
DA
Pα :5
6DA
P Fe
rtiga
tion-
pl
antin
g:irr
igat
ion
wat
er
(Tho
mps
on
et a
l. 20
00a,
20
00b)
Ariz
ona
Tupi
c N
atia
rgid
S
andy
lo
am
2.9
8.5
Cau
liflo
wer
: C
andi
d C
harm
Win
ter
1993
D
rip
Ferti
gate
dFe
rtiga
tion
UA
N
60, 3
40, 4
50, 6
00
5 fe
rtiga
tion
appl
icat
ions
S
ub-s
urfa
ce
ferti
gatio
n N
rate
by
wat
er
inte
ract
ions
W
inte
r 19
9419
95
100,
200
, 300
, 500
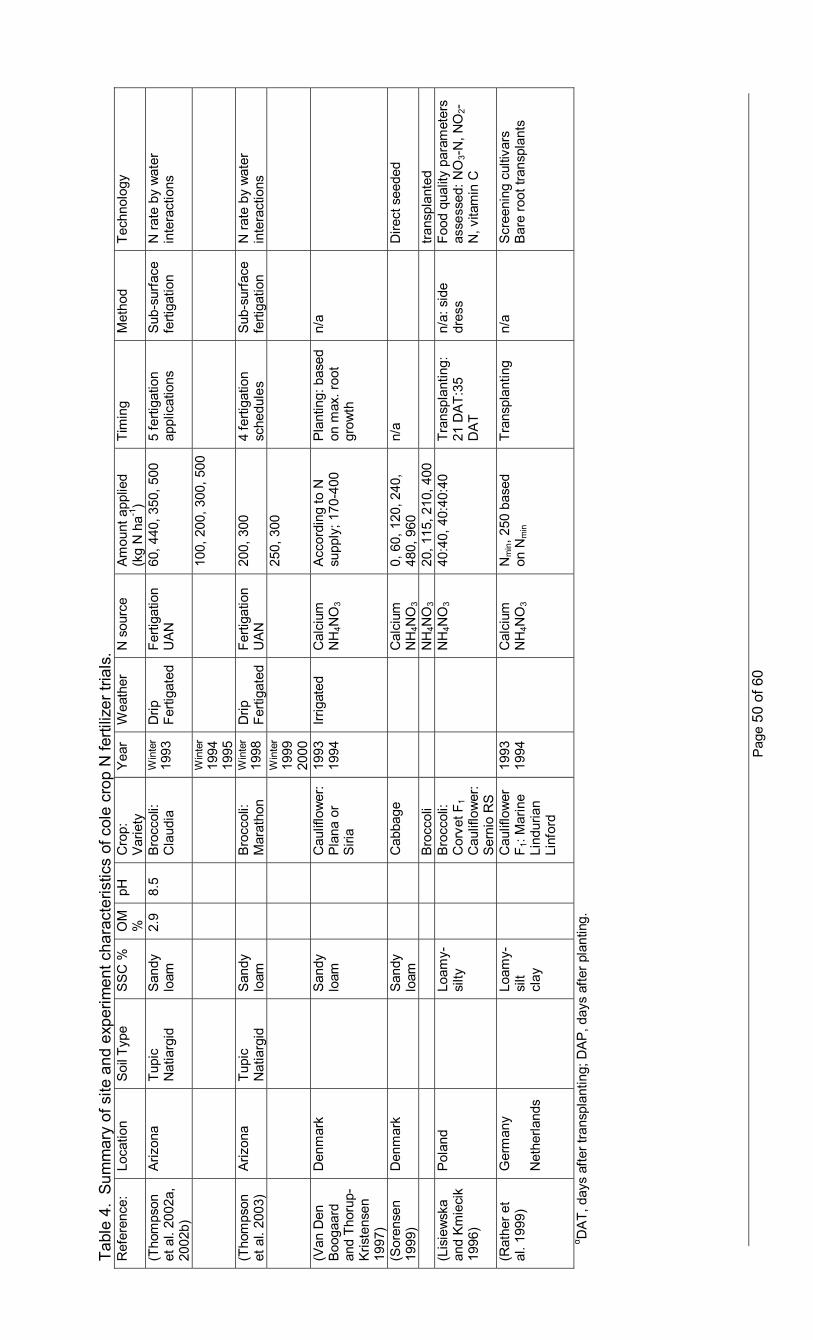
Pag
e 50
of 6
0
Tabl
e 4.
Sum
mar
y of
site
and
exp
erim
ent c
hara
cter
istic
s of
col
e cr
op N
ferti
lizer
tria
ls.
Ref
eren
ce:
Loca
tion
Soi
l Typ
e S
SC
%
OM
%
pH
C
rop:
V
arie
ty
Yea
r W
eath
er
N s
ourc
e Am
ount
app
lied
(kg
N h
a-1)
Tim
ing
M
etho
d
Tech
nolo
gy
(Tho
mps
on
et a
l. 20
02a,
20
02b)
Ariz
ona
Tupi
c N
atia
rgid
S
andy
lo
am
2.9
8.5
Bro
ccol
i: C
laud
ia
Win
ter
1993
D
rip
Ferti
gate
dFe
rtiga
tion
UA
N
60, 4
40, 3
50, 5
00
5 fe
rtiga
tion
appl
icat
ions
S
ub-s
urfa
ce
ferti
gatio
n N
rate
by
wat
er
inte
ract
ions
W
inte
r 19
9419
95
100,
200
, 300
, 500
(Tho
mps
on
et a
l. 20
03)
Ariz
ona
Tupi
c N
atia
rgid
S
andy
lo
am
Bro
ccol
i: M
arat
hon
Win
ter
1998
D
rip
Ferti
gate
dFe
rtiga
tion
UA
N
200,
300
4
ferti
gatio
n sc
hedu
les
Sub
-sur
face
fe
rtiga
tion
N ra
te b
y w
ater
in
tera
ctio
ns
W
inte
r 19
9920
00
250,
300
(Van
Den
B
ooga
ard
and
Thor
up-
Kris
tens
en
1997
)
Den
mar
k
San
dy
loam
C
aulif
low
er:
Pla
na o
r S
iria
1993
19
94
Irrig
ated
C
alci
um
NH
4NO
3 A
ccor
ding
to N
su
pply
; 170
-400
P
lant
ing:
bas
ed
on m
ax. r
oot
grow
th
n/a
(Sor
ense
n 19
99)
Den
mar
k
San
dy
loam
C
abba
ge
Cal
cium
N
H4N
O3
0, 6
0, 1
20, 2
40,
480,
960
n/
a
Dire
ct s
eede
d
Bro
ccol
i
N
H4N
O3
20, 1
15, 2
10, 4
00
trans
plan
ted
(Lis
iew
ska
and
Km
ieci
k 19
96)
Pol
and
Lo
amy-
silty
B
rocc
oli:
Cor
vet F
1 C
aulif
low
er:
Ser
nio
RS
NH
4NO
3 40
:40,
40:
40:4
0 Tr
ansp
lant
ing:
21
DA
T:35
D
AT
n/a:
sid
e dr
ess
Food
qua
lity
para
met
ers
asse
ssed
: NO
3-N
, NO
2-N
, vita
min
C
(Rat
her e
t al
. 199
9)
Ger
man
y N
ethe
rland
s
Lo
amy-
silt
clay
Cau
liflo
wer
F 1
: Mar
ine
Lind
uria
n Li
nfor
d
1993
19
94
C
alci
um
NH
4NO
3 N
min, 2
50 b
ased
on
Nm
in
Tran
spla
ntin
g
n/a
Scr
eeni
ng c
ultiv
ars
Bar
e ro
ot tr
ansp
lant
s
α DA
T, d
ays
afte
r tra
nspl
antin
g; D
AP
, day
s af
ter p
lant
ing.
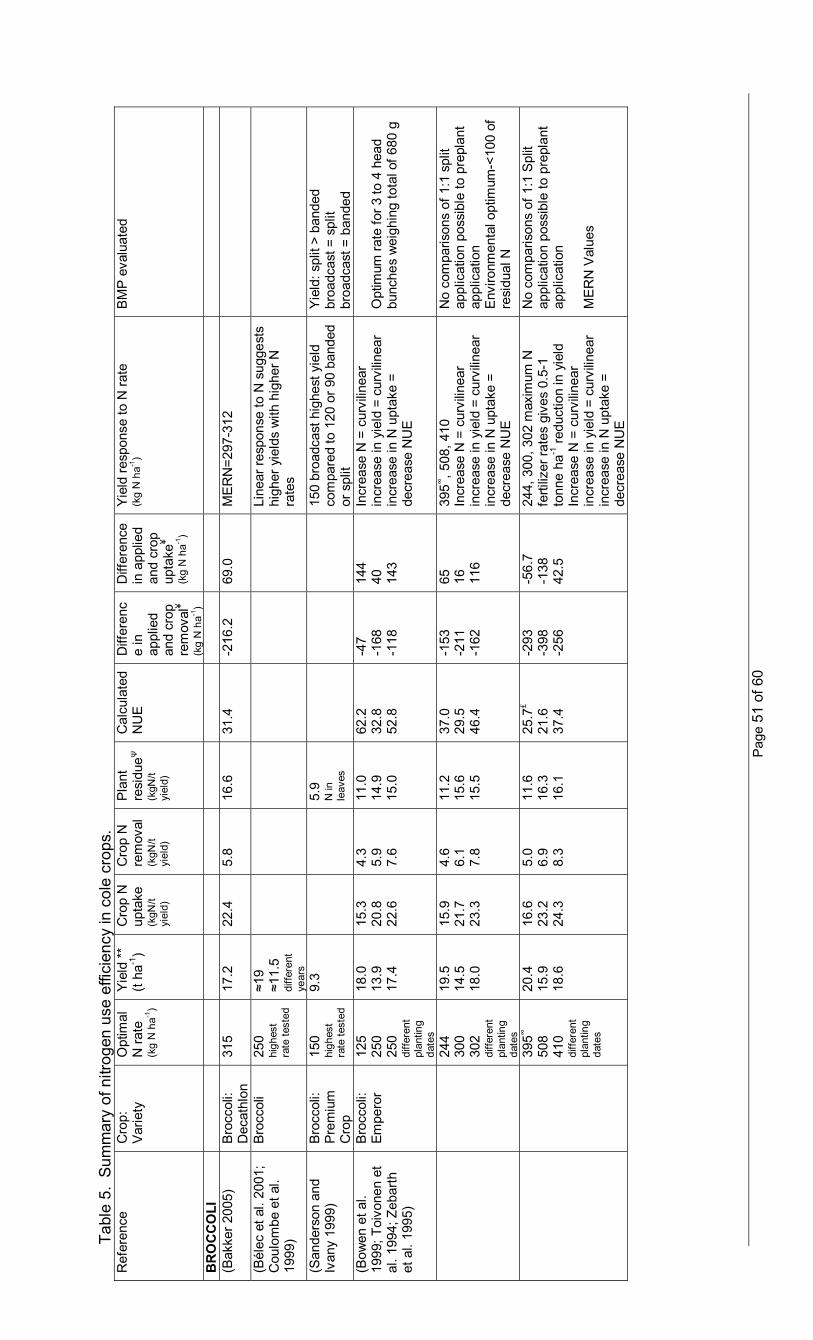
Pag
e 51
of 6
0
Tabl
e 5.
Sum
mar
y of
nitr
ogen
use
effi
cien
cy in
col
e cr
ops.
R
efer
ence
C
rop:
V
arie
ty
Opt
imal
N
rate
(k
g N
ha-1
)
Yie
ld *
* (t
ha-1
) C
rop
N
upta
ke
(kgN
/t
yiel
d)
Cro
p N
re
mov
al
(kgN
/t
yiel
d)
Pla
nt
resi
dueψ
(k
gN/t
yiel
d)
Cal
cula
ted
NU
E
Diff
eren
ce
in
appl
ied
and
crop
re
mov
al¥
(kg
N h
a-1)
Diff
eren
ce
in a
pplie
d an
d cr
op
upta
ke¥
(kg
N h
a-1)
Yie
ld re
spon
se to
N ra
te
(kg
N h
a-1)
BM
P e
valu
ated
BR
OC
CO
LI
(B
akke
r 200
5)
Bro
ccol
i: D
ecat
hlon
31
5 17
.2
22.4
5.
8 16
.6
31.4
-2
16.2
69
.0
ME
RN
=297
-312
(Bél
ec e
t al.
2001
; C
oulo
mbe
et a
l. 19
99)
Bro
ccol
i 25
0 hi
ghes
t ra
te te
sted
≈19
≈11.
5
diffe
rent
ye
ars
Line
ar re
spon
se to
N s
ugge
sts
high
er y
ield
s w
ith h
ighe
r N
rate
s
(San
ders
on a
nd
Ivan
y 19
99)
Bro
ccol
i: P
rem
ium
C
rop
150
high
est
rate
test
ed
9.3
5.9
N in
le
aves
15
0 br
oadc
ast h
ighe
st y
ield
co
mpa
red
to 1
20 o
r 90
band
ed
or s
plit
Yie
ld: s
plit
> ba
nded
br
oadc
ast =
spl
it br
oadc
ast =
ban
ded
(B
owen
et a
l. 19
99; T
oivo
nen
et
al. 1
994;
Zeb
arth
et
al.
1995
)
Bro
ccol
i: Em
pero
r 12
5 25
0 25
0 di
ffere
nt
plan
ting
date
s
18.0
13
.9
17.4
15.3
20
.8
22.6
4.3
5.9
7.6
11.0
14
.9
15.0
62.2
32
.8
52.8
-47
-168
-1
18
144
40
143
Incr
ease
N =
cur
vilin
ear
incr
ease
in y
ield
= c
urvi
linea
r in
crea
se in
N u
ptak
e =
decr
ease
NU
E
Opt
imum
rate
for 3
to 4
hea
d bu
nche
s w
eigh
ing
tota
l of 6
80 g
244
300
302
diffe
rent
pl
antin
g da
tes
19.5
14
.5
18.0
15.9
21
.7
23.3
4.6
6.1
7.8
11.2
15
.6
15.5
37.0
29
.5
46.4
-153
-2
11
-162
65
16
116
395∞
, 508
, 410
In
crea
se N
= c
urvi
linea
r in
crea
se in
yie
ld =
cur
vilin
ear
incr
ease
in N
upt
ake
= de
crea
se N
UE
No
com
paris
ons
of 1
:1 s
plit
appl
icat
ion
poss
ible
to p
repl
ant
appl
icat
ion
Env
ironm
enta
l opt
imum
-<10
0 of
re
sidu
al N
39
5∞
508
410
diffe
rent
pl
antin
g da
tes
20.4
15
.9
18.6
16.6
23
.2
24.3
5.0
6.9
8.3
11.6
16
.3
16.1
25.7
₤ 21
.6
37.4
-293
-3
98
-256
-56.
7 -1
38
42.5
244,
300
, 302
max
imum
N
ferti
lizer
rate
s gi
ves
0.5-
1 to
nne
ha-1
redu
ctio
n in
yie
ld
Incr
ease
N =
cur
vilin
ear
incr
ease
in y
ield
= c
urvi
linea
r in
crea
se in
N u
ptak
e =
decr
ease
NU
E
No
com
paris
ons
of 1
:1 S
plit
appl
icat
ion
poss
ible
to p
repl
ant
appl
icat
ion
ME
RN
Val
ues

Pag
e 52
of 6
0
Tabl
e 5
Con
tinue
d. S
umm
ary
of n
itrog
en u
se e
ffici
ency
in c
ole
crop
s.
Ref
eren
ce
Cro
p:
Var
iety
O
ptim
al
N ra
te
(kg
N h
a-1)
Yie
ld *
* (t
ha-1
) C
rop
N
upta
ke
(kgN
/t
yiel
d)
Cro
p N
re
mov
al
(kgN
/t
yiel
d)
Pla
nt
resi
dueψ
(k
gN/t
yiel
d)
Cal
cula
ted
NU
E
Diff
eren
ce
in
appl
ied
and
crop
re
mov
al¥
(kg
N h
a-1)
Diff
eren
ce
in a
pplie
d an
d cr
op
upta
ke¥
(kg
N h
a-1)
Yie
ld re
spon
se to
N ra
te
(kg
N h
a-1)
BM
P e
valu
ated
436
558
441
diffe
rent
pl
antin
g da
tes
20.4
16
.0
18.6
16.8
23
.2
24.6
5.1
7.1
8.4
11.7
16
.1
16.2
23.8
20
.2
35.4
-332
-4
45
-285
-93.
9 -1
87
17
244,
300
, 302
max
imum
N
ferti
lizer
rate
s gi
ves
0.5-
1 to
nne
ha-1
redu
ctio
n in
yie
ld
Incr
ease
N =
cur
vilin
ear
incr
ease
in y
ield
= c
urvi
linea
r in
crea
se in
N u
ptak
e =
decr
ease
NU
E
No
com
paris
ons
of 1
:1 s
plit
appl
icat
ion
poss
ible
to p
repl
ant
appl
icat
ion
Max
imum
yie
ld v
alue
s
(Kow
alen
ko a
nd
Hal
l 198
7a, 1
987b
) B
rocc
oli:
Pre
miu
m
Cro
p
250
high
est
rate
test
ed
11.7
16
.6
diffe
rent
ye
ars
10.1
10
.2
8.1
6.0
2.0
4.2
38.0
₤ 39
.6
-155
-1
51
-89
19
Hig
hest
rate
= 2
50 =
hig
hest
yi
eld
Effe
ct o
f N ra
te o
n m
atur
ity
(Let
ey e
t al.
1983
) B
rocc
oli:
Gre
en
Com
et
270
high
est
rate
test
ed
8.8
4.1
76.0
₤
-100
H
ighe
st ra
te =
270
= h
ighe
st
yiel
d B
ette
r fer
tiliz
er re
cove
ry o
f soi
l ap
plie
d vs
ferti
gatio
n
225
high
est
rate
test
ed
17.4
13
.4
7.2
6.2
55.6
₤ -1
00
9 H
ighe
st ra
te =
225
= h
ighe
st
yiel
d
(Tho
mps
on e
t al.
2002
a, 2
002b
) B
rocc
oli:
Cla
udia
35
0 13
.0
18.9
11
.5
diffe
rent
ye
ars
23.5
12
.7
24.8
n/a
87
.4₤
69.0
81
.3
-4
4 -1
08
-66
Cap
ture
s 95
% o
f max
. yie
ld fo
r al
l 3 y
ears
(n
ear)
opt
imal
agr
onom
ic,
econ
omic
, and
env
ironm
enta
l ou
tcom
es
410
436
390
di
ffere
nt
year
s
13.3
19
.6
11.6
25.5
14
25
.3
82.7
₤ 63
.1
75.4
-7
1 -1
61
-96
Cal
cula
ted
N ra
tes
to g
ive
max
imum
yie
lds
Tabl
e 5
Con
tinue
d. S
umm
ary
of n
itrog
en u
se e
ffici
ency
in c
ole
crop
s.
Ref
eren
ce
Cro
p:
Var
iety
O
ptim
al
N ra
te
(kg
N h
a-1)
Yie
ld *
* (t
ha-1
) C
rop
N
upta
ke
(kgN
/t
yiel
d)
Cro
p N
re
mov
al
(kgN
/t
yiel
d)
Pla
nt
resi
dueψ
(k
gN/t
yiel
d)
Cal
cula
ted
NU
E
Diff
eren
ce
in
appl
ied
and
crop
Diff
eren
ce
in a
pplie
d an
d cr
op
upta
ke¥
Yie
ld re
spon
se to
N ra
te
(kg
N h
a-1)
BM
P e
valu
ated
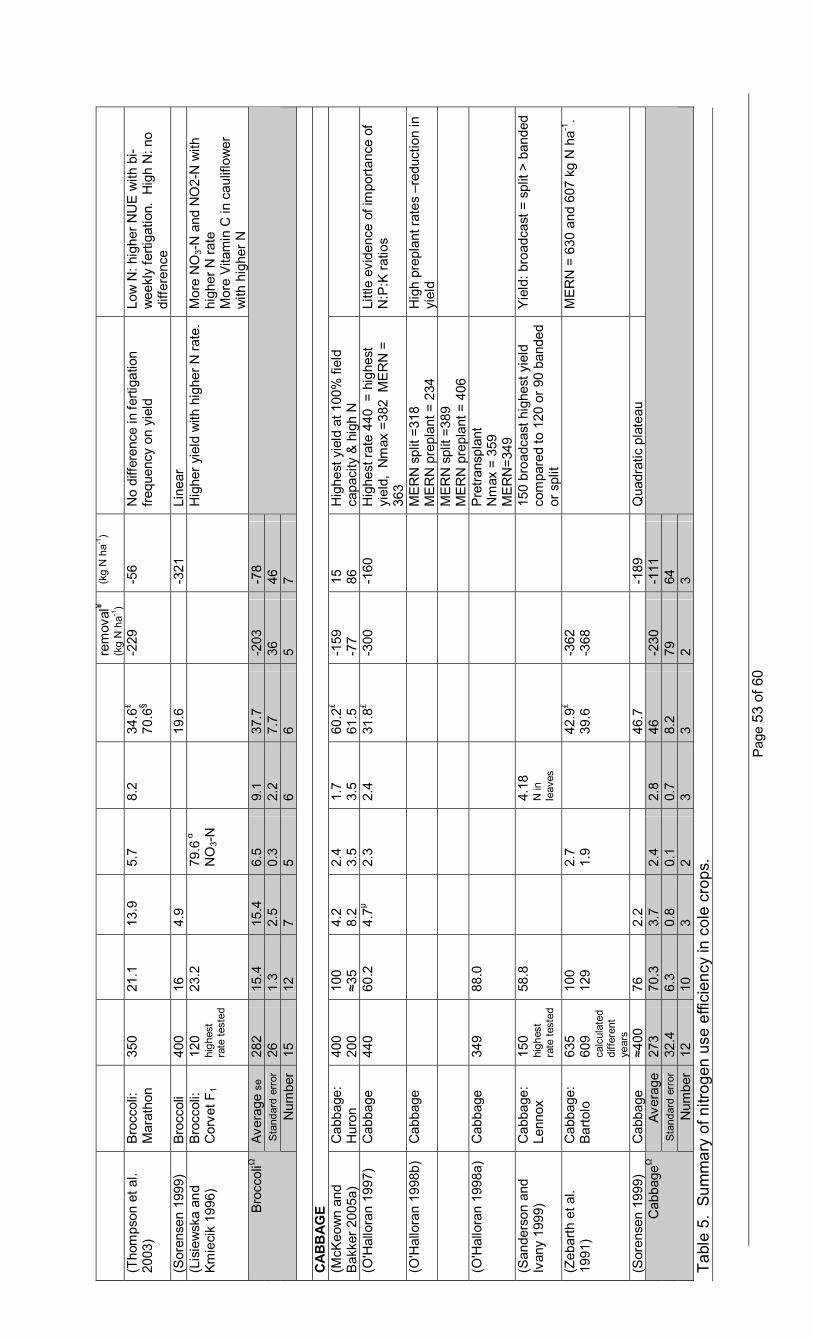
Pag
e 53
of 6
0
rem
oval
¥ (k
g N
ha-1
) (k
g N
ha-1
)
(Tho
mps
on e
t al.
2003
) B
rocc
oli:
Mar
atho
n 35
0 21
.1
13.9
5.
7 8.
2 34
.6₤
70.6
§ -2
29
-56
No
diffe
renc
e in
ferti
gatio
n fre
quen
cy o
n yi
eld
Low
N: h
ighe
r NU
E w
ith b
i-w
eekl
y fe
rtiga
tion.
Hig
h N
: no
diffe
renc
e (S
oren
sen
1999
) B
rocc
oli
400
16
4.9
19.6
-321
Li
near
(Lis
iew
ska
and
Kmie
cik
1996
) B
rocc
oli:
Cor
vet F
1 12
0 hi
ghes
t ra
te te
sted
23.2
79
.6 α
N
O3-
N
Hig
her y
ield
with
hig
her N
rate
. M
ore
NO
3-N
and
NO
2-N
with
hi
gher
N ra
te
Mor
e V
itam
in C
in c
aulif
low
er
with
hig
her N
Av
erag
e se
28
2 15
.4
15.4
6.
5 9.
1 37
.7
-203
-7
8 S
tand
ard
erro
r 26
1.
3 2.
5 0.
3 2.
2 7.
7 36
46
B
rocc
oliΩ
Num
ber
15
12
7 5
6 6
5 7
CAB
BAG
E (M
cKeo
wn
and
Bak
ker 2
005a
) C
abba
ge:
Hur
on
400
20
0 10
0 ≈3
5 4.
2 8.
2 2.
4 3.
5 1.
7 3.
5 60
.2₤
61.5
-1
59
-77
15
86
Hig
hest
yie
ld a
t 100
% fi
eld
capa
city
& h
igh
N
(O'H
allo
ran
1997
) C
abba
ge
440
60
.2
4.7µ
2.3
2.4
31.8
₤ -3
00
-160
H
ighe
st ra
te 4
40 =
hig
hest
yi
eld,
Nm
ax =
382
ME
RN
=
363
Littl
e ev
iden
ce o
f im
porta
nce
of
N:P
:K ra
tios
(O'H
allo
ran
1998
b)
Cab
bage
M
ER
N s
plit
=318
M
ER
N p
repl
ant =
234
H
igh
prep
lant
rate
s –r
educ
tion
in
yiel
d
ME
RN
spl
it =3
89
ME
RN
pre
plan
t = 4
06
(O'H
allo
ran
1998
a)
Cab
bage
34
9 88
.0
Pre
trans
plan
t N
max
= 3
59
ME
RN
=349
(San
ders
on a
nd
Ivan
y 19
99)
Cab
bage
: Le
nnox
15
0 hi
ghes
t ra
te te
sted
58.8
4.
18
N in
le
aves
15
0 br
oadc
ast h
ighe
st y
ield
co
mpa
red
to 1
20 o
r 90
band
ed
or s
plit
Yie
ld: b
road
cast
= s
plit
> ba
nded
(Zeb
arth
et a
l. 19
91)
Cab
bage
: B
arto
lo
635
609
calc
ulat
ed
diffe
rent
ye
ars
100
129
2.
7 1.
9
42.9
₤ 39
.6
-362
-3
68
ME
RN
= 6
30 a
nd 6
07 k
g N
ha-1
.
(Sor
ense
n 19
99)
Cab
bage
≈4
00
76
2.2
46.7
-189
Q
uadr
atic
pla
teau
Aver
age
273
70.3
3.
7 2.
4 2.
8 46
-2
30
-111
S
tand
ard
erro
r 32
.4
6.3
0.8
0.1
0.7
8.2
79
64
Cab
bage
Ω
Num
ber
12
10
3 2
3 3
2 3
Tabl
e 5.
Sum
mar
y of
nitr
ogen
use
effi
cien
cy in
col
e cr
ops.
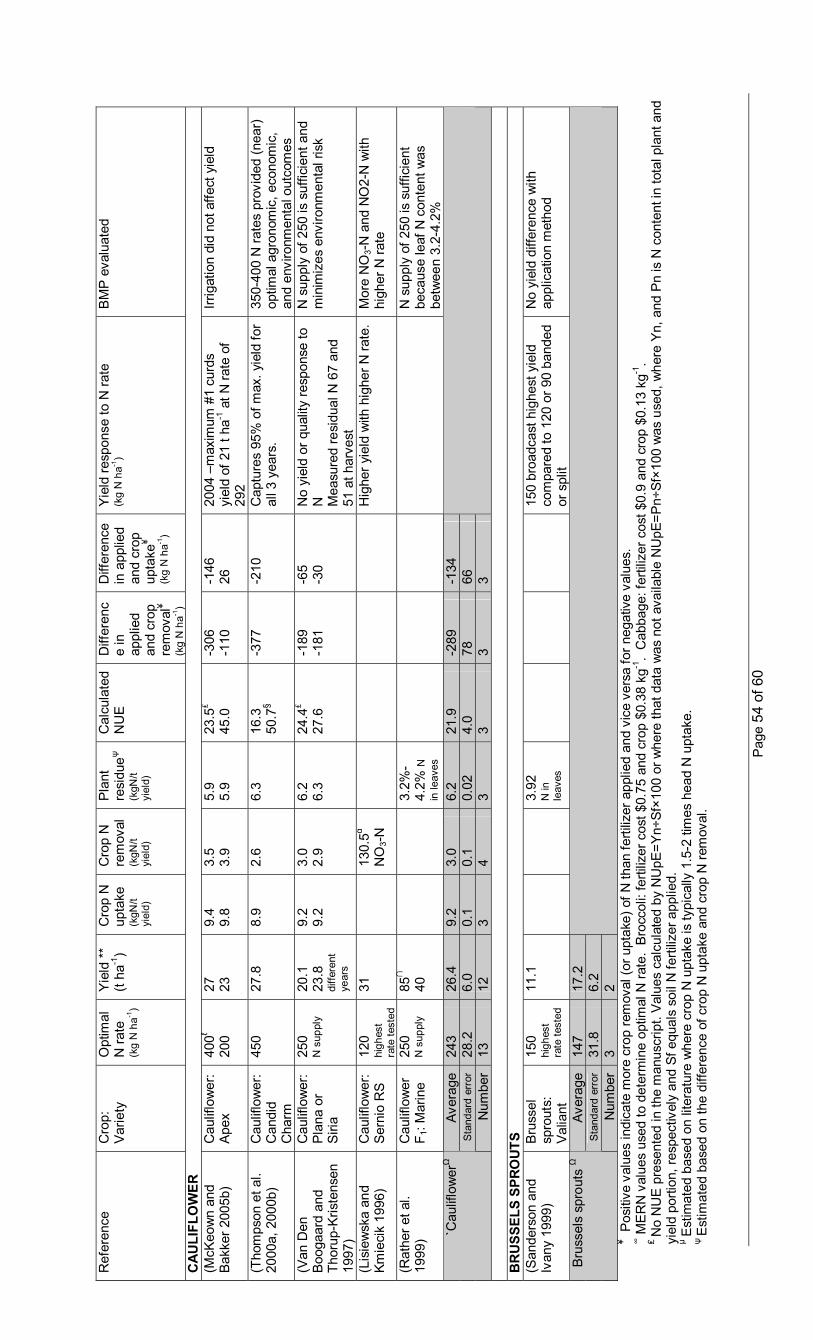
Pag
e 54
of 6
0
Ref
eren
ce
Cro
p:
Var
iety
O
ptim
al
N ra
te
(kg
N h
a-1)
Yie
ld *
* (t
ha-1
) C
rop
N
upta
ke
(kgN
/t
yiel
d)
Cro
p N
re
mov
al
(kgN
/t
yiel
d)
Pla
nt
resi
dueψ
(k
gN/t
yiel
d)
Cal
cula
ted
NU
E
Diff
eren
ce
in
appl
ied
and
crop
re
mov
al¥
(kg
N h
a-1)
Diff
eren
ce
in a
pplie
d an
d cr
op
upta
ke¥
(kg
N h
a-1)
Yie
ld re
spon
se to
N ra
te
(kg
N h
a-1)
BM
P e
valu
ated
CAU
LIFL
OW
ER
(McK
eow
n an
d B
akke
r 200
5b)
Cau
liflo
wer
: A
pex
400ℓ
20
0 27
23
9.
4 9.
8 3.
5 3.
9 5.
9 5.
9 23
.5₤
45.0
-3
06
-110
-1
46
26
2004
–m
axim
um #
1 cu
rds
yiel
d of
21
t ha-1
at N
rate
of
292
Irrig
atio
n di
d no
t affe
ct y
ield
(Tho
mps
on e
t al.
2000
a, 2
000b
) C
aulif
low
er:
Can
did
Cha
rm
450
27.8
8.
9 2.
6 6.
3 16
.3
50.7
§ -3
77
-210
C
aptu
res
95%
of m
ax. y
ield
for
all 3
yea
rs.
350-
400
N ra
tes
prov
ided
(nea
r) op
timal
agr
onom
ic, e
cono
mic
, an
d en
viro
nmen
tal o
utco
mes
(V
an D
en
Boo
gaar
d an
d Th
orup
-Kris
tens
en
1997
)
Cau
liflo
wer
: P
lana
or
Siri
a
250
N s
uppl
y 20
.1
23.8
di
ffere
nt
year
s
9.2
9.2
3.0
2.9
6.2
6.3
24.4
₤ 27
.6
-189
-1
81
-65
-30
No
yiel
d or
qua
lity
resp
onse
to
N
Mea
sure
d re
sidu
al N
67
and
51 a
t har
vest
N s
uppl
y of
250
is s
uffic
ient
and
m
inim
izes
env
ironm
enta
l ris
k
(Lis
iew
ska
and
Kmie
cik
1996
) C
aulif
low
er:
Ser
nio
RS
12
0 hi
ghes
t ra
te te
sted
31
13
0.5α
N
O3-
N
Hig
her y
ield
with
hig
her N
rate
. M
ore
NO
3-N
and
NO
2-N
with
hi
gher
N ra
te
(Rat
her e
t al.
1999
) C
aulif
low
er
F 1: M
arin
e 25
0
N s
uppl
y 85
∩
40
3.2%
-4.
2% N
in
leav
es
N s
uppl
y of
250
is s
uffic
ient
be
caus
e le
af N
con
tent
was
be
twee
n 3.
2-4.
2%
Aver
age
243
26.4
9.
2 3.
0 6.
2 21
.9
-289
-1
34
Sta
ndar
d er
ror
28.2
6.
0 0.
1 0.
1 0.
02
4.0
78
66
`Cau
liflo
wer
Ω
Num
ber
13
12
3 4
3 3
3 3
BR
USS
ELS
SPRO
UTS
(San
ders
on a
nd
Ivan
y 19
99)
Bru
ssel
sp
rout
s:
Val
iant
150
high
est
rate
test
ed
11.1
3.
92
N in
le
aves
15
0 br
oadc
ast h
ighe
st y
ield
co
mpa
red
to 1
20 o
r 90
band
ed
or s
plit
No
yiel
d di
ffere
nce
with
ap
plic
atio
n m
etho
d
Aver
age
147
17.2
S
tand
ard
erro
r 31
.8
6.2
Bru
ssel
s sp
rout
s Ω
Num
ber
3 2
¥ Pos
itive
val
ues
indi
cate
mor
e cr
op re
mov
al (o
r upt
ake)
of N
than
ferti
lizer
app
lied
and
vice
ver
sa fo
r neg
ativ
e va
lues
. ∞ M
ER
N v
alue
s us
ed to
det
erm
ine
optim
al N
rate
. B
rocc
oli:
ferti
lizer
cos
t $0.
75 a
nd c
rop
$0.3
8 kg
-1.
Cab
bage
: fer
tiliz
er c
ost $
0.9
and
crop
$0.
13 k
g-1.
₤ N
o N
UE
pre
sent
ed in
the
man
uscr
ipt.
Val
ues
calc
ulat
ed b
y N
UpE
=Yn÷
Sf×1
00 o
r whe
re th
at d
ata
was
not
ava
ilabl
e N
UpE
=Pn÷
Sf×1
00 w
as u
sed,
whe
re Y
n, a
nd P
n is
N c
onte
nt in
tota
l pla
nt a
nd
yiel
d po
rtion
, res
pect
ivel
y an
d Sf
equ
als
soil
N fe
rtiliz
er a
pplie
d.
µ E
stim
ated
bas
ed o
n lit
erat
ure
whe
re c
rop
N u
ptak
e is
typi
cally
1.5
-2 ti
mes
hea
d N
upt
ake.
ψ
Est
imat
ed b
ased
on
the
diffe
renc
e of
cro
p N
upt
ake
and
crop
N re
mov
al.
Pag
e 55
of 6
0
∩ Y
ield
resu
lt in
man
uscr
ipt e
xpre
ssed
as
dry
wei
ght.
Val
ues
repo
rted
are
base
d on
an
assu
med
10%
dry
wei
ght f
or c
aulif
low
er.
ℓ Yie
ld p
rese
nted
as
No.
1 g
rade
cur
ds, t
otal
yie
ld n
ot p
rovi
ded.
§ A
ppar
ent N
UE
cal
cula
ted
in th
e m
anus
crip
t as
NU
E=(
Pn f
–Pn c
)÷Sf
f α H
ead
N c
onte
nt n
ot re
porte
d. V
alue
s ar
e kg
NO
3-N
ha-1
. Ω C
alcu
latio
ns: a
vera
ge, s
tand
ard
erro
r, an
d nu
mbe
r are
bas
ed o
n da
ta p
rese
nted
in T
able
s 5
and
6.
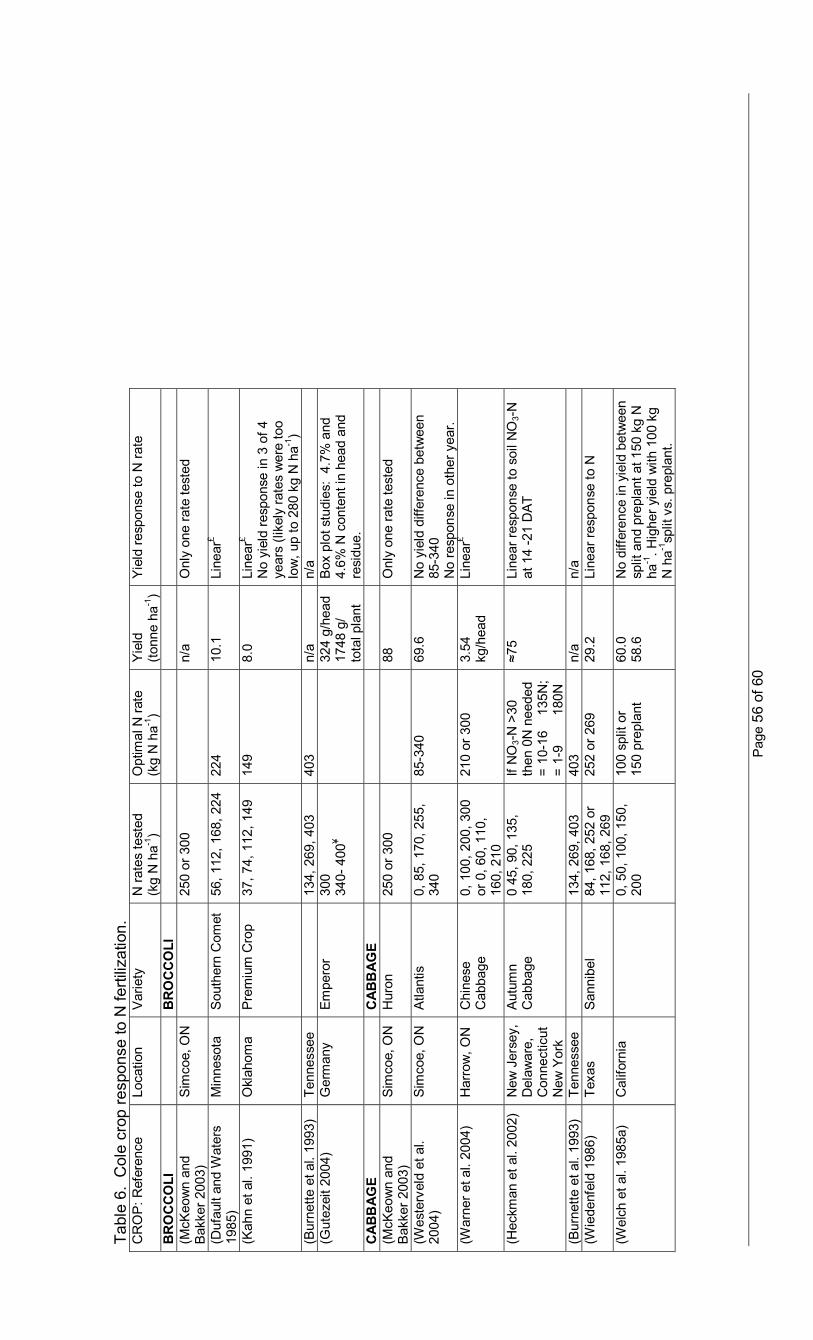
Pag
e 56
of 6
0
Tabl
e 6.
Col
e cr
op re
spon
se to
N fe
rtiliz
atio
n.
CR
OP
: Ref
eren
ce
Loca
tion
Var
iety
N
rate
s te
sted
(k
g N
ha-1
) O
ptim
al N
rate
(k
g N
ha-1
) Y
ield
(to
nne
ha-1
) Y
ield
resp
onse
to N
rate
BR
OC
CO
LI
B
RO
CC
OLI
(M
cKeo
wn
and
Bak
ker 2
003)
S
imco
e, O
N
25
0 or
300
n/a
Onl
y on
e ra
te te
sted
(Duf
ault
and
Wat
ers
1985
) M
inne
sota
S
outh
ern
Com
et
56, 1
12, 1
68, 2
24
224
10.1
Li
near
£
(Kah
n et
al.
1991
) O
klah
oma
Pre
miu
m C
rop
37, 7
4, 1
12, 1
49
149
8.0
Line
ar£
No
yiel
d re
spon
se in
3 o
f 4
year
s (li
kely
rate
s w
ere
too
low
, up
to 2
80 k
g N
ha-1
) (B
urne
tte e
t al.
1993
) Te
nnes
see
13
4, 2
69, 4
03
403
n/a
n/a
(Gut
ezei
t 200
4)
Ger
man
y Em
pero
r 30
0 34
0- 4
00¥
32
4 g/
head
17
48 g
/ to
tal p
lant
Box
plo
t stu
dies
: 4.
7% a
nd
4.6%
N c
onte
nt in
hea
d an
d re
sidu
e.
CAB
BAG
E
CAB
BAG
E
(M
cKeo
wn
and
Bak
ker 2
003)
S
imco
e, O
N
Hur
on
250
or 3
00
88
O
nly
one
rate
test
ed
(Wes
terv
eld
et a
l. 20
04)
Sim
coe,
ON
A
tlant
is
0, 8
5, 1
70, 2
55,
340
85-3
40
69.6
N
o yi
eld
diffe
renc
e be
twee
n 85
-340
N
o re
spon
se in
oth
er y
ear.
(W
arne
r et a
l. 20
04)
Har
row
, ON
C
hine
se
Cab
bage
0,
100
, 200
, 300
or
0, 6
0, 1
10,
160,
210
210
or 3
00
3.54
kg
/hea
d Li
near
£
(Hec
kman
et a
l. 20
02)
New
Jer
sey,
D
elaw
are,
C
onne
ctic
ut
New
Yor
k
Aut
umn
Cab
bage
0
45, 9
0, 1
35,
180,
225
If
NO
3-N
>30
th
en 0
N n
eede
d =
10-1
6
135N
; =
1-9
180
N
≈75
Line
ar re
spon
se to
soi
l NO
3-N
at
14
-21
DAT
(Bur
nette
et a
l. 19
93)
Tenn
esse
e
134,
269
, 403
40
3 n/
a n/
a (W
iede
nfel
d 19
86)
Texa
s S
anni
bel
84, 1
68, 2
52 o
r 11
2, 1
68, 2
69
252
or 2
69
29.2
Li
near
resp
onse
to N
(Wel
ch e
t al.
1985
a)
Cal
iforn
ia
0,
50,
100
, 150
, 20
0 10
0 sp
lit o
r 15
0 pr
epla
nt
60.0
58
.6
No
diffe
renc
e in
yie
ld b
etw
een
split
and
pre
plan
t at 1
50 k
g N
ha
-1. H
ighe
r yie
ld w
ith 1
00 k
g N
ha-1
split
vs.
pre
plan
t.
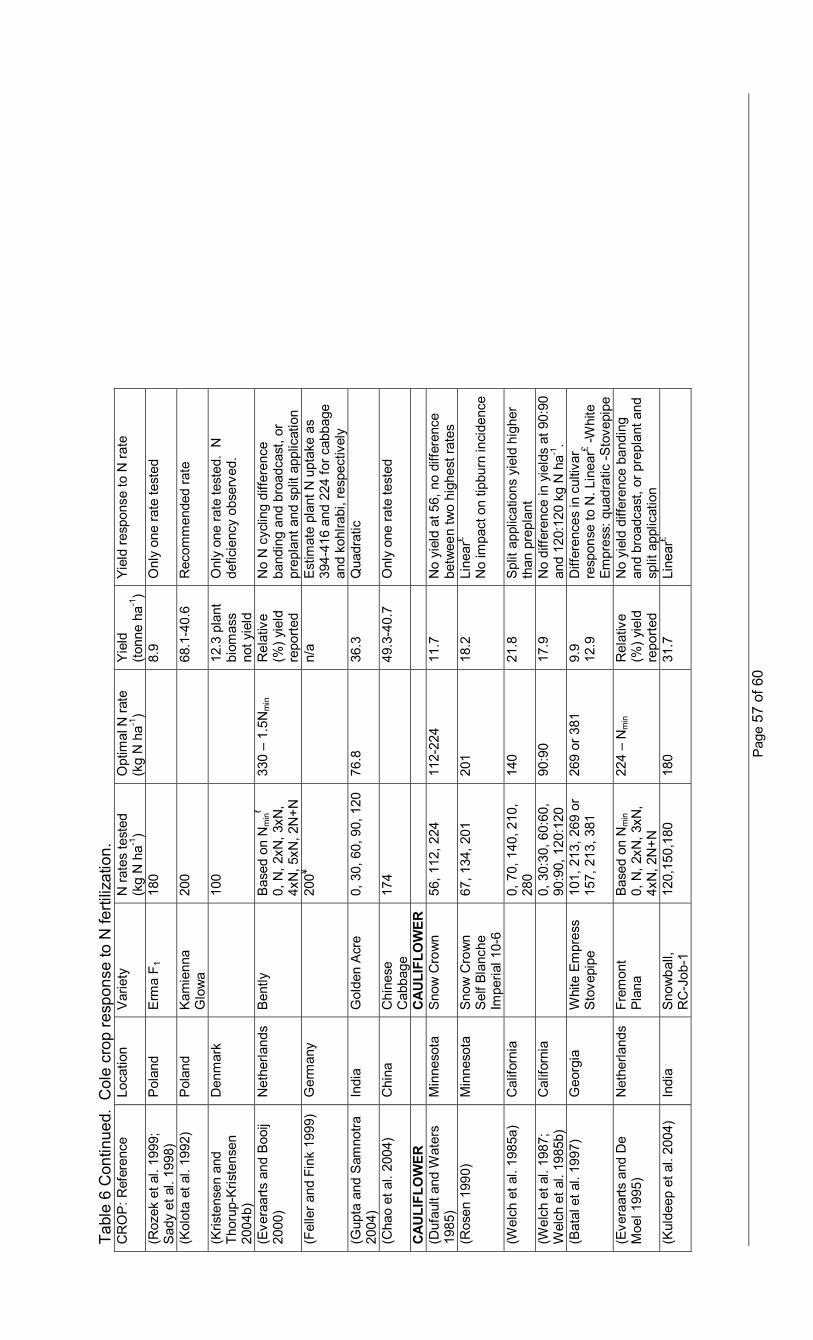
Pag
e 57
of 6
0
Tabl
e 6
Con
tinue
d. C
ole
crop
resp
onse
to N
ferti
lizat
ion.
C
RO
P: R
efer
ence
Lo
catio
n V
arie
ty
N ra
tes
test
ed
(kg
N h
a-1)
Opt
imal
N ra
te
(kg
N h
a-1)
Yie
ld
(tonn
e ha
-1)
Yie
ld re
spon
se to
N ra
te
(Roz
ek e
t al.
1999
; S
ady
et a
l. 19
98)
Pol
and
Erm
a F 1
18
0
8.9
Onl
y on
e ra
te te
sted
(Kol
ota
et a
l. 19
92)
Pol
and
Kam
ienn
a G
low
a 20
0
68.1
-40.
6 R
ecom
men
ded
rate
(Kris
tens
en a
nd
Thor
up-K
riste
nsen
20
04b)
Den
mar
k
100
12
.3 p
lant
bi
omas
s no
t yie
ld
Onl
y on
e ra
te te
sted
. N
de
ficie
ncy
obse
rved
.
(Eve
raar
ts a
nd B
ooij
2000
) N
ethe
rland
s B
ently
B
ased
on
Nm
inℓ
0, N
, 2xN
, 3xN
, 4x
N, 5
xN, 2
N+N
330
– 1.
5Nm
in
Rel
ativ
e (%
) yie
ld
repo
rted
No
N c
yclin
g di
ffere
nce
band
ing
and
broa
dcas
t, or
pr
epla
nt a
nd s
plit
appl
icat
ion
(Fel
ler a
nd F
ink
1999
) G
erm
any
20
0¥
n/a
Est
imat
e pl
ant N
upt
ake
as
394-
416
and
224
for c
abba
ge
and
kohl
rabi
, res
pect
ivel
y (G
upta
and
Sam
notra
20
04)
Indi
a G
olde
n A
cre
0, 3
0, 6
0, 9
0, 1
20
76.8
36
.3
Qua
drat
ic
(Cha
o et
al.
2004
) C
hina
C
hine
se
Cab
bage
17
4
49.3
-40.
7 O
nly
one
rate
test
ed
CAU
LIFL
OW
ER
C
AULI
FLO
WER
(D
ufau
lt an
d W
ater
s 19
85)
Min
neso
ta
Sno
w C
row
n 56
, 112
, 224
11
2-22
4 11
.7
No
yiel
d at
56,
no
diffe
renc
e be
twee
n tw
o hi
ghes
t rat
es
(Ros
en 1
990)
M
inne
sota
S
now
Cro
wn
Sel
f Bla
nche
Im
peria
l 10-
6
67, 1
34, 2
01
201
18.2
Li
near
£ N
o im
pact
on
tipbu
rn in
cide
nce
(Wel
ch e
t al.
1985
a)
Cal
iforn
ia
0,
70,
140
, 210
, 28
0 14
0 21
.8
Spl
it ap
plic
atio
ns y
ield
hig
her
than
pre
plan
t (W
elch
et a
l. 19
87;
Wel
ch e
t al.
1985
b)
Cal
iforn
ia
0,
30:
30, 6
0:60
, 90
:90,
120
:120
90
:90
17.9
N
o di
ffere
nce
in y
ield
s at
90:
90
and
120:
120
kg N
ha-1
. (B
atal
et a
l. 19
97)
Geo
rgia
W
hite
Em
pres
s S
tove
pipe
10
1, 2
13, 2
69 o
r 15
7, 2
13, 3
81
269
or 3
81
9.9
12.9
D
iffer
ence
s in
cul
tivar
re
spon
se to
N. L
inea
r£ -Whi
te
Empr
ess:
qua
drat
ic -S
tove
pipe
(E
vera
arts
and
De
Moe
l 199
5)
Net
herla
nds
Frem
ont
Pla
na
Bas
ed o
n N
min
0, N
, 2xN
, 3xN
, 4x
N, 2
N+N
224
– N
min
Rel
ativ
e (%
) yie
ld
repo
rted
No
yiel
d di
ffere
nce
band
ing
and
broa
dcas
t, or
pre
plan
t and
sp
lit a
pplic
atio
n (K
ulde
ep e
t al.
2004
) In
dia
Sno
wba
ll,
RC
-Job
-1
120,
150,
180
180
31.7
Li
near
£
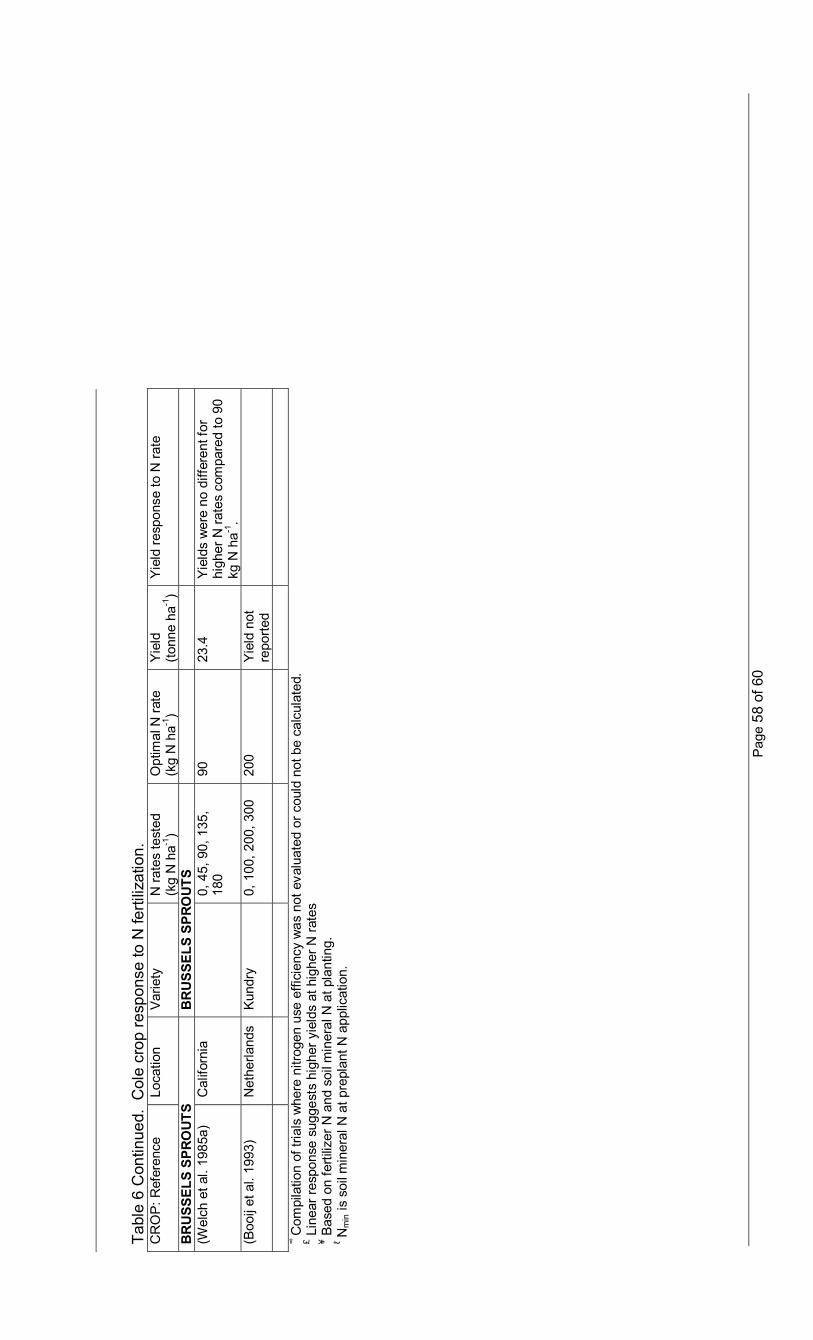
Pag
e 58
of 6
0
Tabl
e 6
Con
tinue
d. C
ole
crop
resp
onse
to N
ferti
lizat
ion.
C
RO
P: R
efer
ence
Lo
catio
n V
arie
ty
N ra
tes
test
ed
(kg
N h
a-1)
Opt
imal
N ra
te
(kg
N h
a-1)
Yie
ld
(tonn
e ha
-1)
Yie
ld re
spon
se to
N ra
te
BR
USS
ELS
SPRO
UTS
BR
USS
ELS
SPRO
UTS
(W
elch
et a
l. 19
85a)
C
alifo
rnia
0, 4
5, 9
0, 1
35,
180
90
23.4
Y
ield
s w
ere
no d
iffer
ent f
or
high
er N
rate
s co
mpa
red
to 9
0 kg
N h
a-1.
(Boo
ij et
al.
1993
) N
ethe
rland
s K
undr
y 0,
100
, 200
, 300
20
0
Yie
ld n
ot
repo
rted
∞
Com
pila
tion
of tr
ials
whe
re n
itrog
en u
se e
ffici
ency
was
not
eva
luat
ed o
r cou
ld n
ot b
e ca
lcul
ated
. £ L
inea
r res
pons
e su
gges
ts h
ighe
r yie
lds
at h
ighe
r N ra
tes
¥ Bas
ed o
n fe
rtiliz
er N
and
soi
l min
eral
N a
t pla
ntin
g.
ℓ Nm
in is
soi
l min
eral
N a
t pre
plan
t N a
pplic
atio
n.
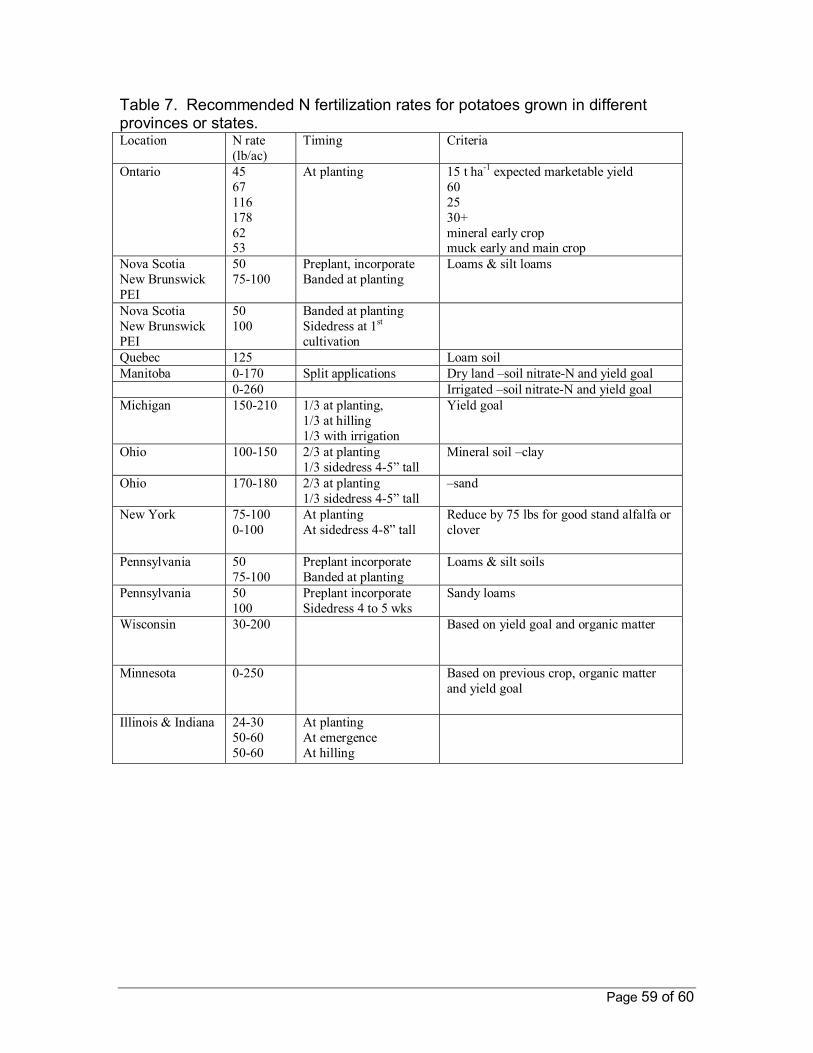
Page 59 of 60
Table 7. Recommended N fertilization rates for potatoes grown in different provinces or states. Location N rate
(lb/ac) Timing Criteria
Ontario 45 67 116 178 62 53
At planting 15 t ha-1 expected marketable yield 60 25 30+ mineral early crop muck early and main crop
Nova Scotia New Brunswick PEI
50 75-100
Preplant, incorporate Banded at planting
Loams & silt loams
Nova Scotia New Brunswick PEI
50 100
Banded at planting Sidedress at 1st cultivation
Quebec 125 Loam soil Manitoba 0-170 Split applications Dry land –soil nitrate-N and yield goal 0-260 Irrigated –soil nitrate-N and yield goal Michigan 150-210 1/3 at planting,
1/3 at hilling 1/3 with irrigation
Yield goal
Ohio 100-150 2/3 at planting 1/3 sidedress 4-5” tall
Mineral soil –clay
Ohio 170-180 2/3 at planting 1/3 sidedress 4-5” tall
–sand
New York 75-100 0-100
At planting At sidedress 4-8” tall
Reduce by 75 lbs for good stand alfalfa or clover
Pennsylvania 50 75-100
Preplant incorporate Banded at planting
Loams & silt soils
Pennsylvania 50 100
Preplant incorporate Sidedress 4 to 5 wks
Sandy loams
Wisconsin 30-200 Based on yield goal and organic matter
Minnesota 0-250 Based on previous crop, organic matter and yield goal
Illinois & Indiana 24-30 50-60 50-60
At planting At emergence At hilling
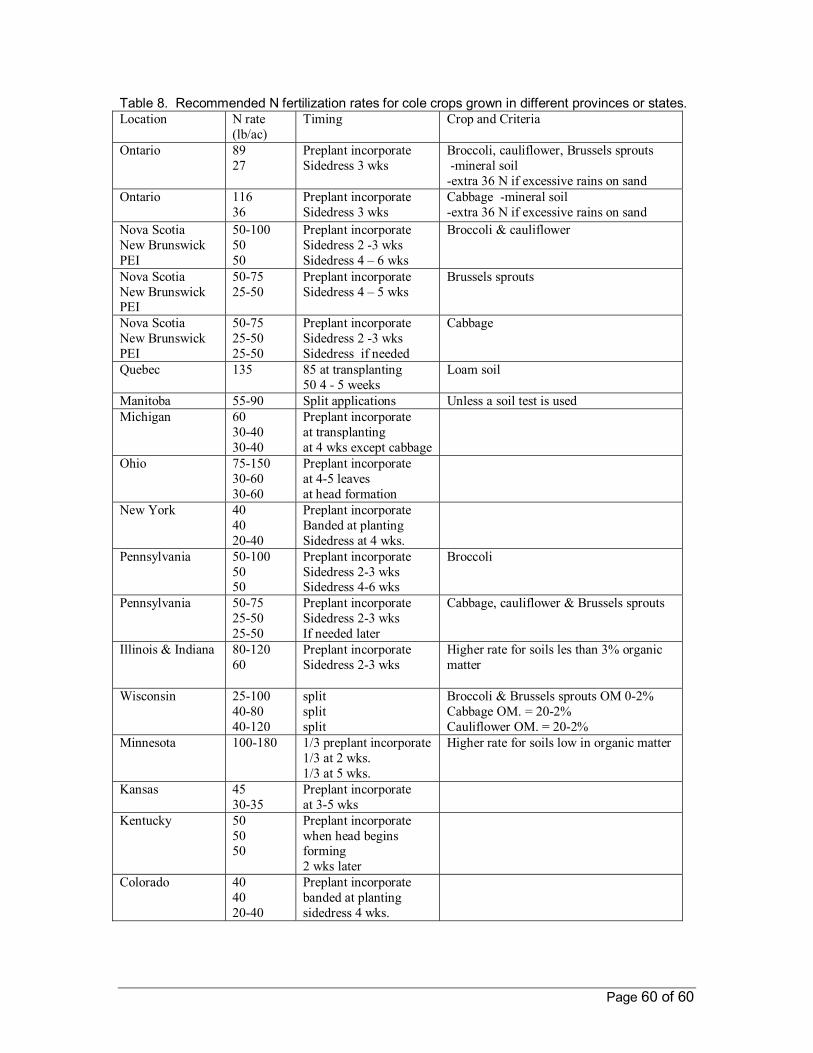
Page 60 of 60
Table 8. Recommended N fertilization rates for cole crops grown in different provinces or states. Location N rate
(lb/ac) Timing Crop and Criteria
Ontario 89 27
Preplant incorporate Sidedress 3 wks
Broccoli, cauliflower, Brussels sprouts -mineral soil -extra 36 N if excessive rains on sand
Ontario 116 36
Preplant incorporate Sidedress 3 wks
Cabbage -mineral soil -extra 36 N if excessive rains on sand
Nova Scotia New Brunswick PEI
50-100 50 50
Preplant incorporate Sidedress 2 -3 wks Sidedress 4 – 6 wks
Broccoli & cauliflower
Nova Scotia New Brunswick PEI
50-75 25-50
Preplant incorporate Sidedress 4 – 5 wks
Brussels sprouts
Nova Scotia New Brunswick PEI
50-75 25-50 25-50
Preplant incorporate Sidedress 2 -3 wks Sidedress if needed
Cabbage
Quebec 135 85 at transplanting 50 4 - 5 weeks
Loam soil
Manitoba 55-90 Split applications Unless a soil test is used Michigan 60
30-40 30-40
Preplant incorporate at transplanting at 4 wks except cabbage
Ohio 75-150 30-60 30-60
Preplant incorporate at 4-5 leaves at head formation
New York 40 40 20-40
Preplant incorporate Banded at planting Sidedress at 4 wks.
Pennsylvania 50-100 50 50
Preplant incorporate Sidedress 2-3 wks Sidedress 4-6 wks
Broccoli
Pennsylvania 50-75 25-50 25-50
Preplant incorporate Sidedress 2-3 wks If needed later
Cabbage, cauliflower & Brussels sprouts
Illinois & Indiana 80-120 60
Preplant incorporate Sidedress 2-3 wks
Higher rate for soils les than 3% organic matter
Wisconsin 25-100 40-80 40-120
split split split
Broccoli & Brussels sprouts OM 0-2% Cabbage OM. = 20-2% Cauliflower OM. = 20-2%
Minnesota 100-180 1/3 preplant incorporate 1/3 at 2 wks. 1/3 at 5 wks.
Higher rate for soils low in organic matter
Kansas 45 30-35
Preplant incorporate at 3-5 wks
Kentucky 50 50 50
Preplant incorporate when head begins forming 2 wks later
Colorado 40 40 20-40
Preplant incorporate banded at planting sidedress 4 wks.