Embed Size (px)
Citation preview
Layar shows significant reach, conversion and click-through rates from paper to digital content.
2
This document contains recent information from Layar, industry leader in mobile augmented reality since June 2009.
© Layar 2012 All Rights Reserved
Layar shows significant reach, conversion and click-through rates from paper to digital content. May 2012
3
Table of Contents
1. Introduction 4
2. Market penetration of smartphones 6
3. Market penetration of mobile AR applications 8
4. Conversion rates from print to digital content 11
5. Click-through rates 12
6. Conclusion 13
4
Recently, Layar has set its focus squarely on making print interactive with digital content by activating the pages of magazines, newspapers, flyers and posters with videos, links to websites and the ability to share to social networks.
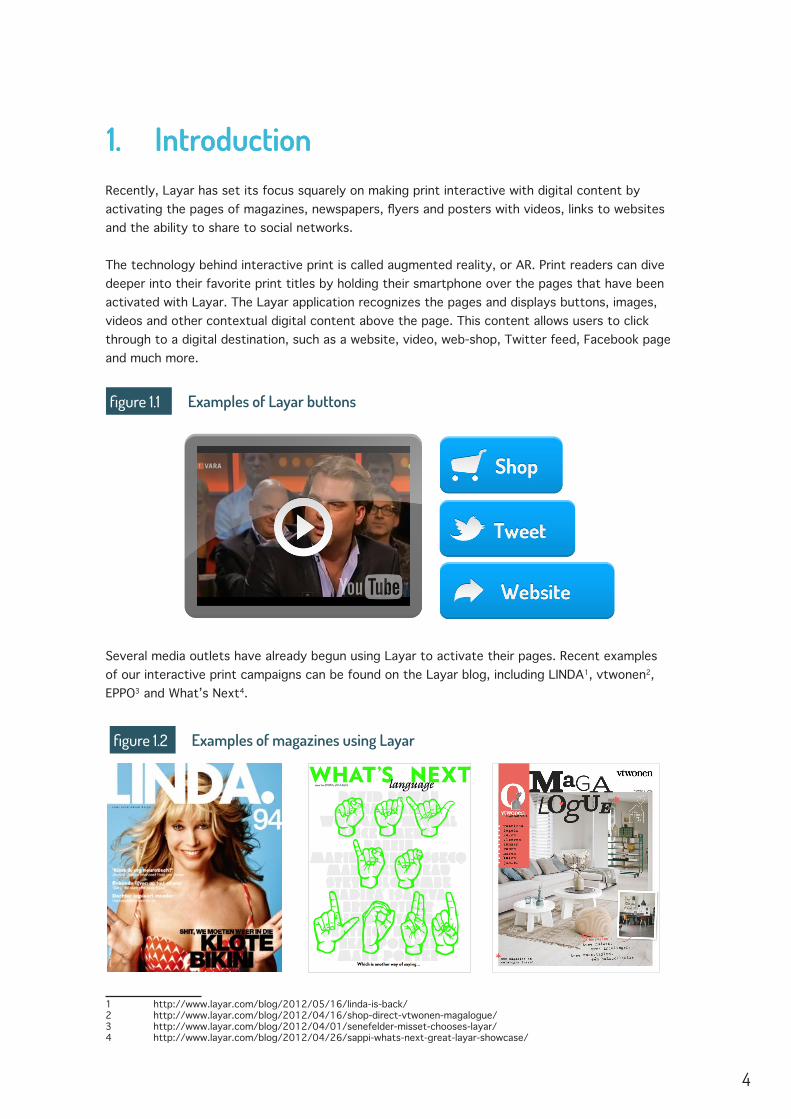
The technology behind interactive print is called augmented reality, or AR. Print readers can dive deeper into their favorite print titles by holding their smartphone over the pages that have been activated with Layar. The Layar application recognizes the pages and displays buttons, images, videos and other contextual digital content above the page. This content allows users to click through to a digital destination, such as a website, video, web-shop, Twitter feed, Facebook page and much more.
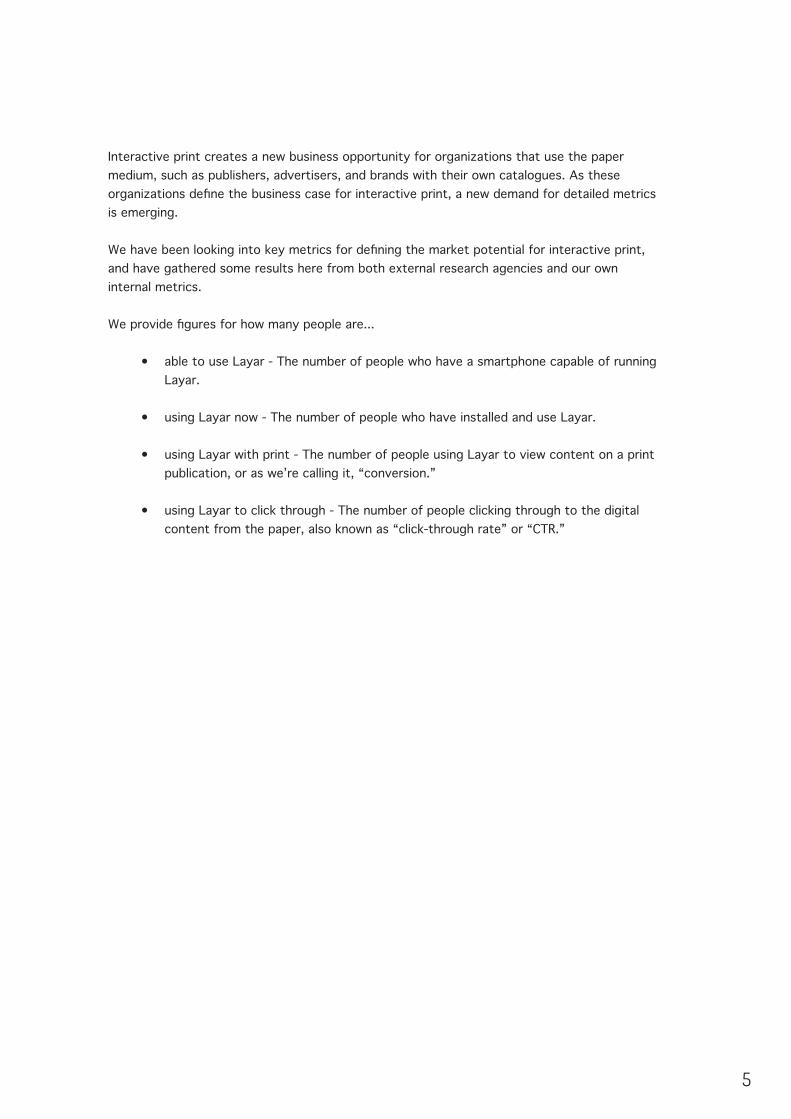
Several media outlets have already begun using Layar to activate their pages. Recent examples of our interactive print campaigns can be found on the Layar blog, including LINDA1, vtwonen2, EPPO3 and What’s Next4.
1 http://www.layar.com/blog/2012/05/16/linda-is-back/2 http://www.layar.com/blog/2012/04/16/shop-direct-vtwonen-magalogue/3 http://www.layar.com/blog/2012/04/01/senefelder-misset-chooses-layar/4 http://www.layar.com/blog/2012/04/26/sappi-whats-next-great-layar-showcase/
1. Introduction
figure 1.1 Examples of Layar buttons
1. Introduction
figure 1.2 Examples of magazines using Layar
5
Interactive print creates a new business opportunity for organizations that use the paper medium, such as publishers, advertisers, and brands with their own catalogues. As these organizations define the business case for interactive print, a new demand for detailed metrics is emerging.
We have been looking into key metrics for defining the market potential for interactive print, and have gathered some results here from both external research agencies and our own internal metrics.
We provide figures for how many people are...
• able to use Layar - The number of people who have a smartphone capable of running Layar.
• using Layar now - The number of people who have installed and use Layar.
• using Layar with print - The number of people using Layar to view content on a print publication, or as we’re calling it, “conversion.”
• using Layar to click through - The number of people clicking through to the digital content from the paper, also known as “click-through rate” or “CTR.”
6
2. Market penetration of smartphones
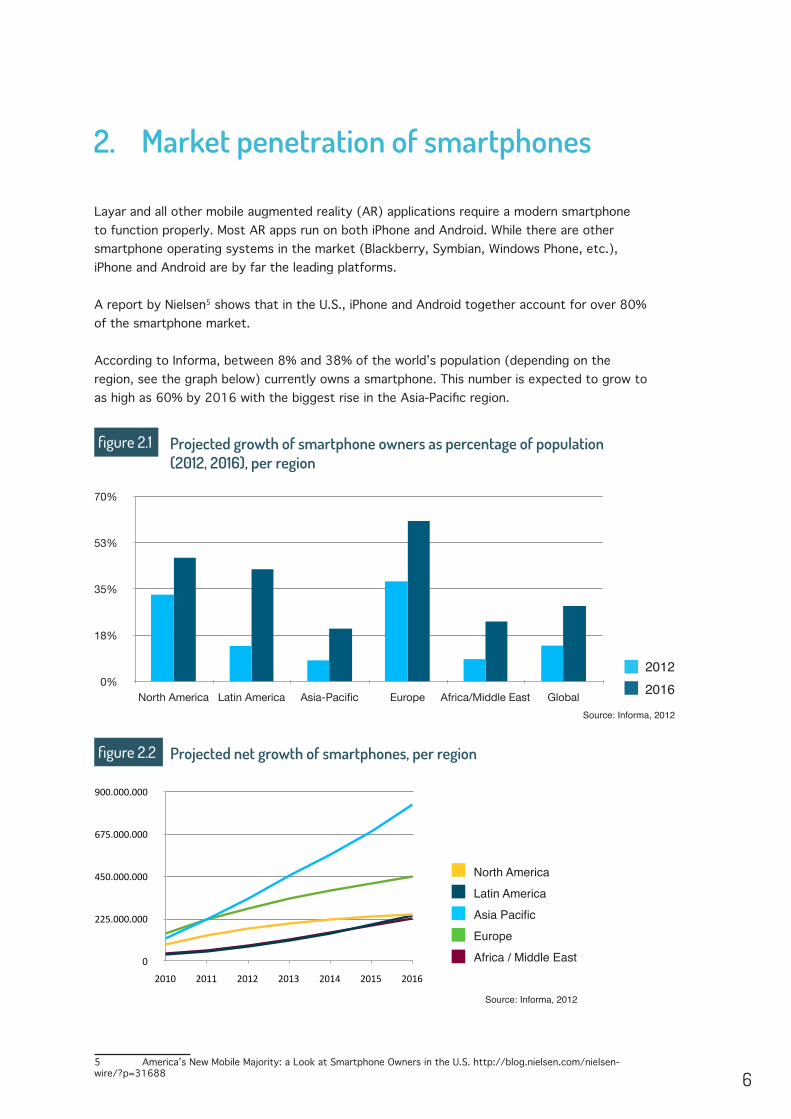
Projected growth of smartphone owners as percentage of population (2012, 2016), per region
Layar and all other mobile augmented reality (AR) applications require a modern smartphone to function properly. Most AR apps run on both iPhone and Android. While there are other smartphone operating systems in the market (Blackberry, Symbian, Windows Phone, etc.), iPhone and Android are by far the leading platforms.
A report by Nielsen5 shows that in the U.S., iPhone and Android together account for over 80% of the smartphone market.
According to Informa, between 8% and 38% of the world’s population (depending on the region, see the graph below) currently owns a smartphone. This number is expected to grow to as high as 60% by 2016 with the biggest rise in the Asia-Pacific region.
5 America’s New Mobile Majority: a Look at Smartphone Owners in the U.S. http://blog.nielsen.com/nielsen-wire/?p=31688
Source: Informa, 2012
0%
18%
35%
53%
70%
North America Latin America Asia-Pacific Europe Africa/Middle East Global
20122016
Projected net growth of smartphones, per region
North AmericaLatin AmericaAsia PacificEuropeAfrica / Middle East0
225.000.000
450.000.000
675.000.000
900.000.000
2010 2011 2012 2013 2014 2015 2016
Source: Informa, 2012
figure 2.1
figure 2.2
7
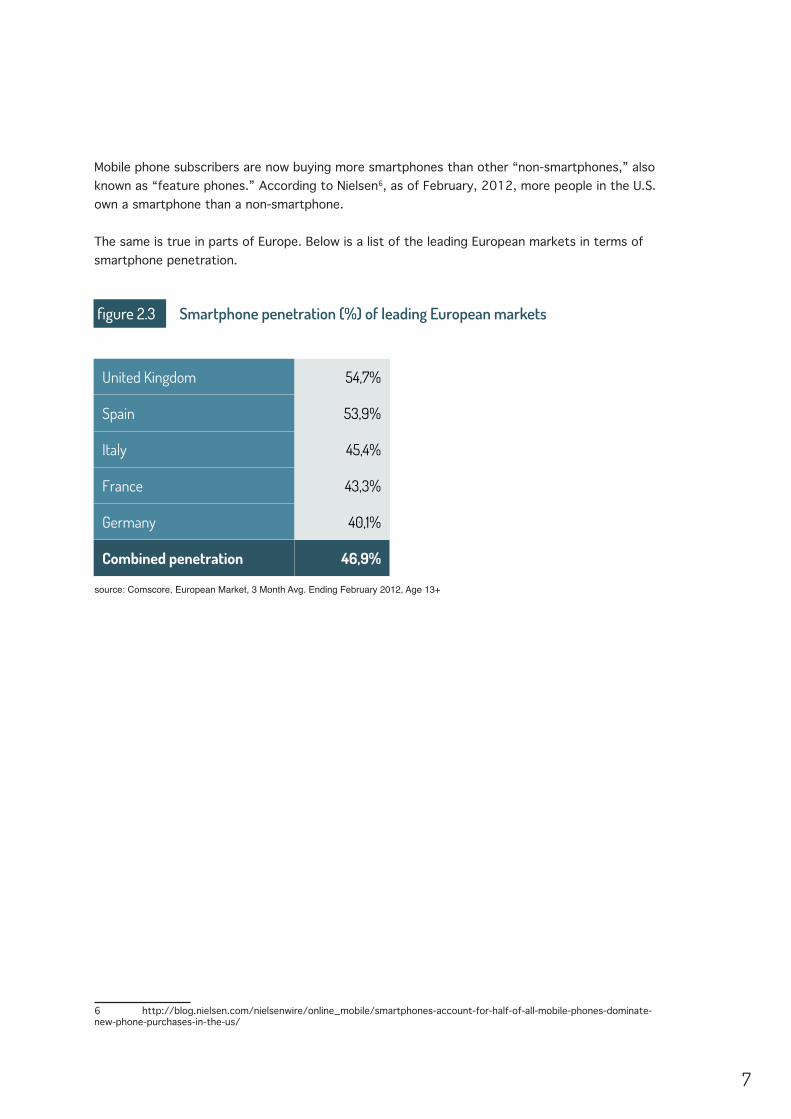
Smartphone penetration (%) of leading European markets
Mobile phone subscribers are now buying more smartphones than other “non-smartphones,” also known as “feature phones.” According to Nielsen6, as of February, 2012, more people in the U.S. own a smartphone than a non-smartphone.
The same is true in parts of Europe. Below is a list of the leading European markets in terms of smartphone penetration.
6 http://blog.nielsen.com/nielsenwire/online_mobile/smartphones-account-for-half-of-all-mobile-phones-dominate-new-phone-purchases-in-the-us/
source: Comscore, European Market, 3 Month Avg. Ending February 2012, Age 13+
figure 2.3
United Kingdom 54,7%
Spain 53,9%
Italy 45,4%
France 43,3%
Germany 40,1%
Combined penetration 46,9%
8
3. Market penetration of mobile AR applications
3.1 Installed base and usage of Layar
Layar has been installed and used on over 20 million devices globally, aided largely by pre-installation on Samsung devices between 2010 and 2011. Usage (traffic) on Layar is predominantly from Android; the rest is from iPhone. We no longer calculate usage statistics for the Symbian, Blackberry and Bada versions of the Layar application after ceasing support for these platforms.
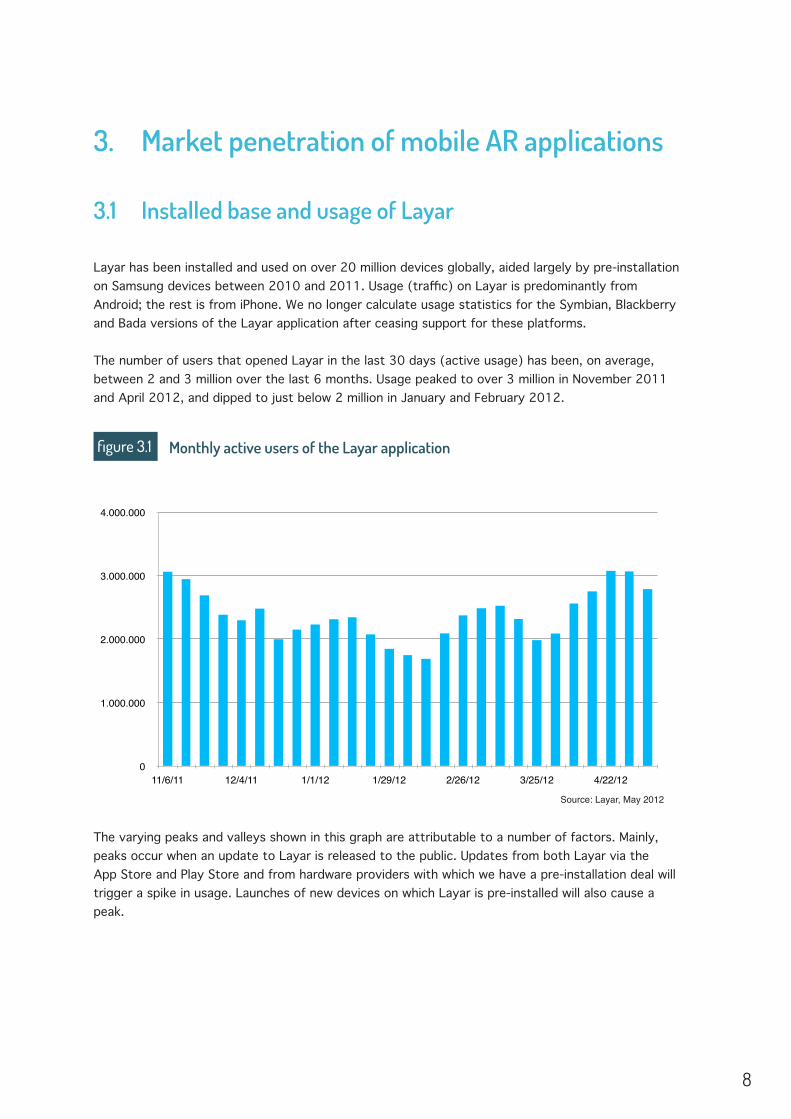
The number of users that opened Layar in the last 30 days (active usage) has been, on average, between 2 and 3 million over the last 6 months. Usage peaked to over 3 million in November 2011 and April 2012, and dipped to just below 2 million in January and February 2012.
The varying peaks and valleys shown in this graph are attributable to a number of factors. Mainly, peaks occur when an update to Layar is released to the public. Updates from both Layar via the App Store and Play Store and from hardware providers with which we have a pre-installation deal will trigger a spike in usage. Launches of new devices on which Layar is pre-installed will also cause a peak.
Monthly active users of the Layar application
Source: Layar, May 2012
figure 3.1
0
1.000.000
2.000.000
3.000.000
4.000.000
11/6/11 12/4/11 1/1/12 1/29/12 2/26/12 3/25/12 4/22/12
9
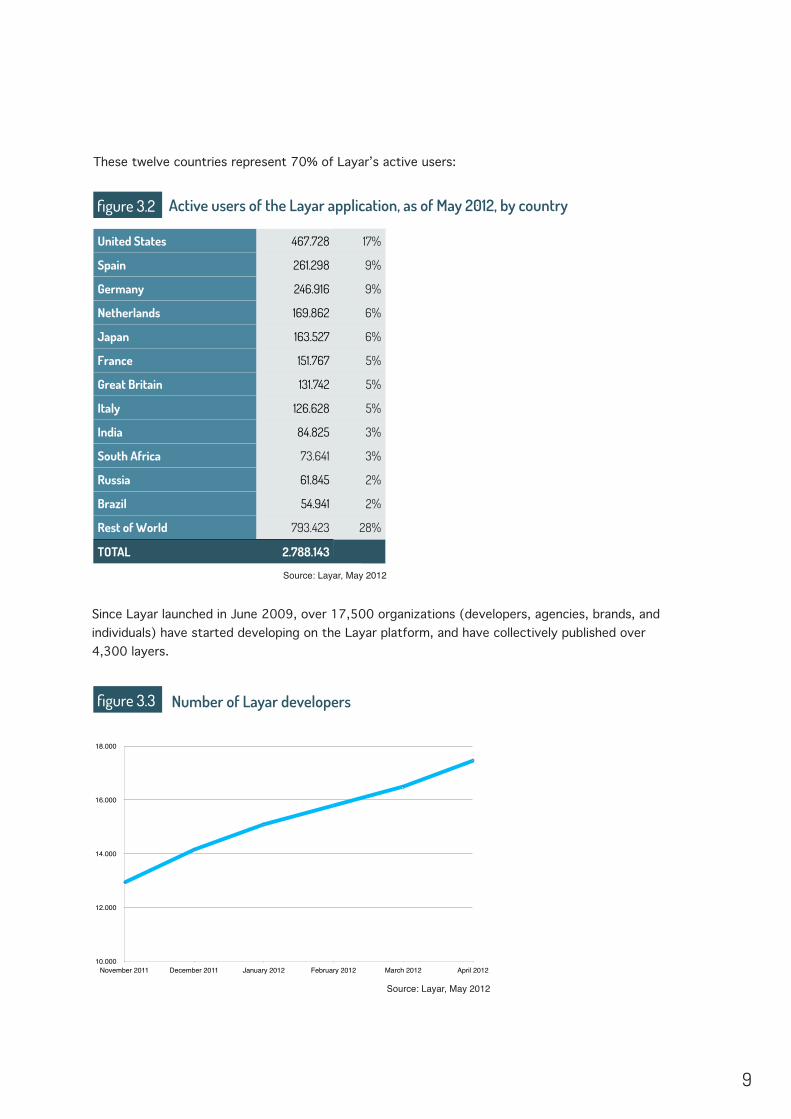
These twelve countries represent 70% of Layar’s active users:
Active users of the Layar application, as of May 2012, by country
Source: Layar, May 2012
Since Layar launched in June 2009, over 17,500 organizations (developers, agencies, brands, and individuals) have started developing on the Layar platform, and have collectively published over 4,300 layers.
Number of Layar developers
Source: Layar, May 2012
United States 467.728 17%
Spain 261.298 9%
Germany 246.916 9%
Netherlands 169.862 6%
Japan 163.527 6%
France 151.767 5%
Great Britain 131.742 5%
Italy 126.628 5%
India 84.825 3%
South Africa 73.641 3%
Russia 61.845 2%
Brazil 54.941 2%
Rest of World 793.423 28%
TOTAL 2.788.143
figure 3.2
figure 3.3
10.000
12.000
14.000
16.000
18.000
November 2011 December 2011 January 2012 February 2012 March 2012 April 2012
10
3.2 Other mobile AR applications
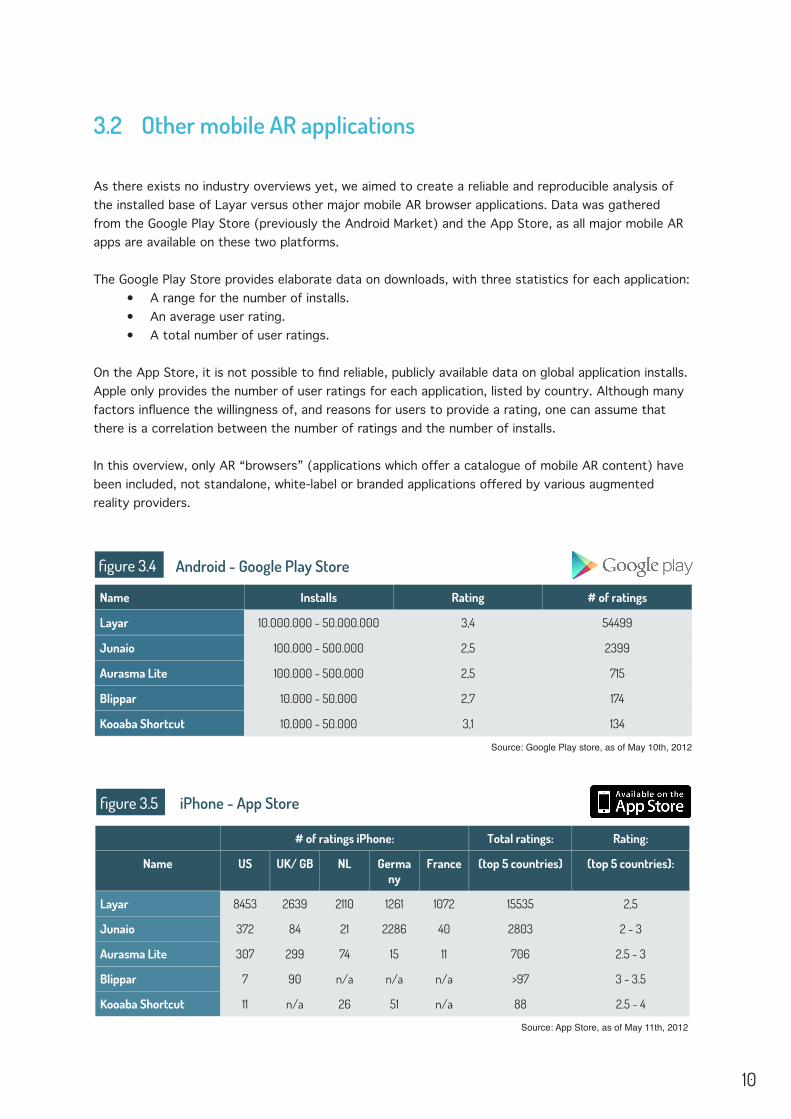
As there exists no industry overviews yet, we aimed to create a reliable and reproducible analysis of the installed base of Layar versus other major mobile AR browser applications. Data was gathered from the Google Play Store (previously the Android Market) and the App Store, as all major mobile AR apps are available on these two platforms.
The Google Play Store provides elaborate data on downloads, with three statistics for each application: • A range for the number of installs.• An average user rating.• A total number of user ratings.
On the App Store, it is not possible to find reliable, publicly available data on global application installs. Apple only provides the number of user ratings for each application, listed by country. Although many factors influence the willingness of, and reasons for users to provide a rating, one can assume that there is a correlation between the number of ratings and the number of installs.
In this overview, only AR “browsers” (applications which offer a catalogue of mobile AR content) have been included, not standalone, white-label or branded applications offered by various augmented reality providers.
Android - Google Play Store
Source: Google Play store, as of May 10th, 2012
iPhone - App Store
Source: App Store, as of May 11th, 2012
Name
Layar
Junaio
Aurasma Lite
Blippar
Kooaba Shortcut
Installs Rating # of ratings
10.000.000 - 50.000.000 3,4 54499
100.000 - 500.000 2,5 2399
100.000 - 500.000 2,5 715
10.000 - 50.000 2,7 174
10.000 - 50.000 3,1 134
Name
# of ratings iPhone:# of ratings iPhone:# of ratings iPhone:# of ratings iPhone:# of ratings iPhone: Total ratings: Rating:
US UK/ GB NL Germany
France (top 5 countries) (top 5 countries):
Layar
Junaio
Aurasma Lite
Blippar
Kooaba Shortcut
8453 2639 2110 1261 1072 15535 2,5
372 84 21 2286 40 2803 2 - 3
307 299 74 15 11 706 2.5 - 3
7 90 n/a n/a n/a >97 3 - 3.5
11 n/a 26 51 n/a 88 2.5 - 4
figure 3.4
figure 3.5
11
4. Conversion rates from print to digital content
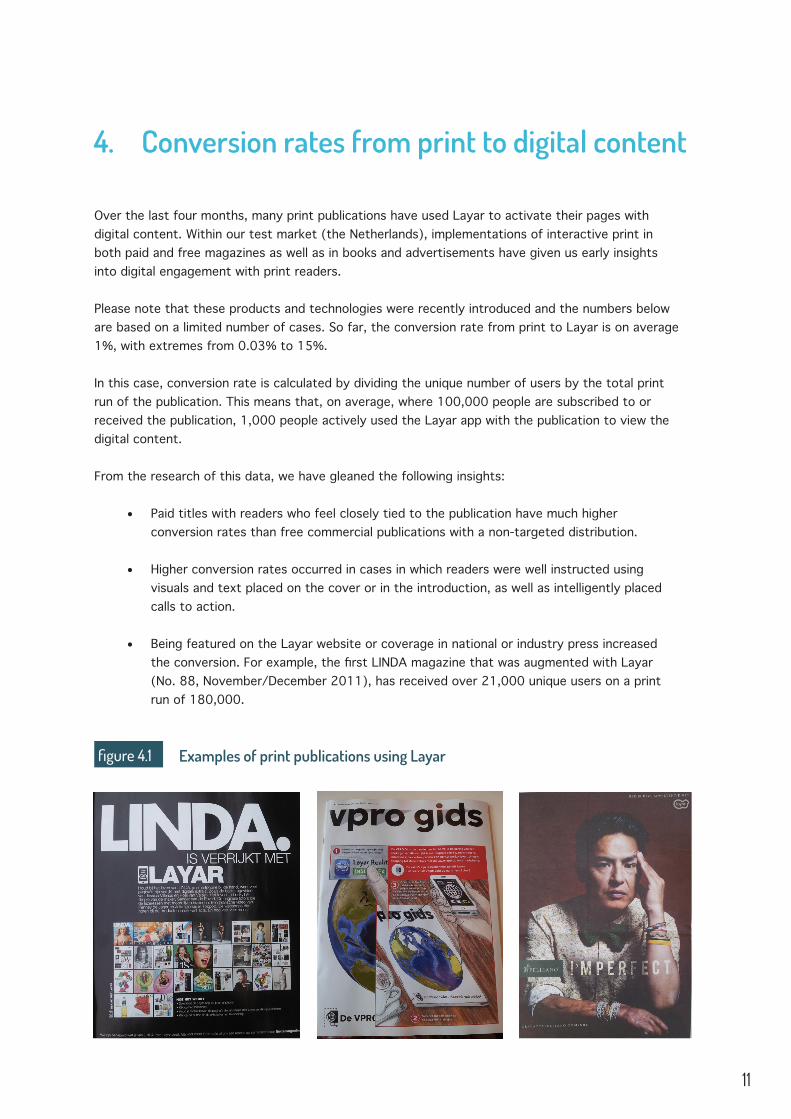
Over the last four months, many print publications have used Layar to activate their pages with digital content. Within our test market (the Netherlands), implementations of interactive print in both paid and free magazines as well as in books and advertisements have given us early insights into digital engagement with print readers.
Please note that these products and technologies were recently introduced and the numbers below are based on a limited number of cases. So far, the conversion rate from print to Layar is on average 1%, with extremes from 0.03% to 15%.
In this case, conversion rate is calculated by dividing the unique number of users by the total print run of the publication. This means that, on average, where 100,000 people are subscribed to or received the publication, 1,000 people actively used the Layar app with the publication to view the digital content.
From the research of this data, we have gleaned the following insights:
• Paid titles with readers who feel closely tied to the publication have much higher conversion rates than free commercial publications with a non-targeted distribution.
• Higher conversion rates occurred in cases in which readers were well instructed using visuals and text placed on the cover or in the introduction, as well as intelligently placed calls to action.
• Being featured on the Layar website or coverage in national or industry press increased the conversion. For example, the first LINDA magazine that was augmented with Layar (No. 88, November/December 2011), has received over 21,000 unique users on a print run of 180,000.
Examples of print publications using Layarfigure 4.1
12
5. Click-through rates
Click-through rates (CTRs) have become the norm for measuring the effect of advertising and other “triggers for desire” in the digital world. We now see that it is not only possible to measure CTRs online, but in print as well. We calculate print CTR as the ratio of clicks on an augment (e.g., a YouTube video, a website link, a direct buy link, etc.) to the number of augments shown.
On Layar, CTRs are consistently between 10% and 30%, and reach as high as 32% in cases with a clear and relevant call to action.
Big market opportunity for interactive printAlthough conversion and CTRs for interactive print cannot be fully compared to those of banner ads on websites, it is clear that there is a huge market opportunity.
Digital banners on websites currently have, according to Wikipedia7, a click-through rate of roughly 0.2% or 0.3%. The effect of interactive print which we have demonstrated is as much as 100x larger than that of traditional banner ads.
The fact that Layar can accurately measure interactivity on print creates a substantial opportunity for both advertisers and publishers.
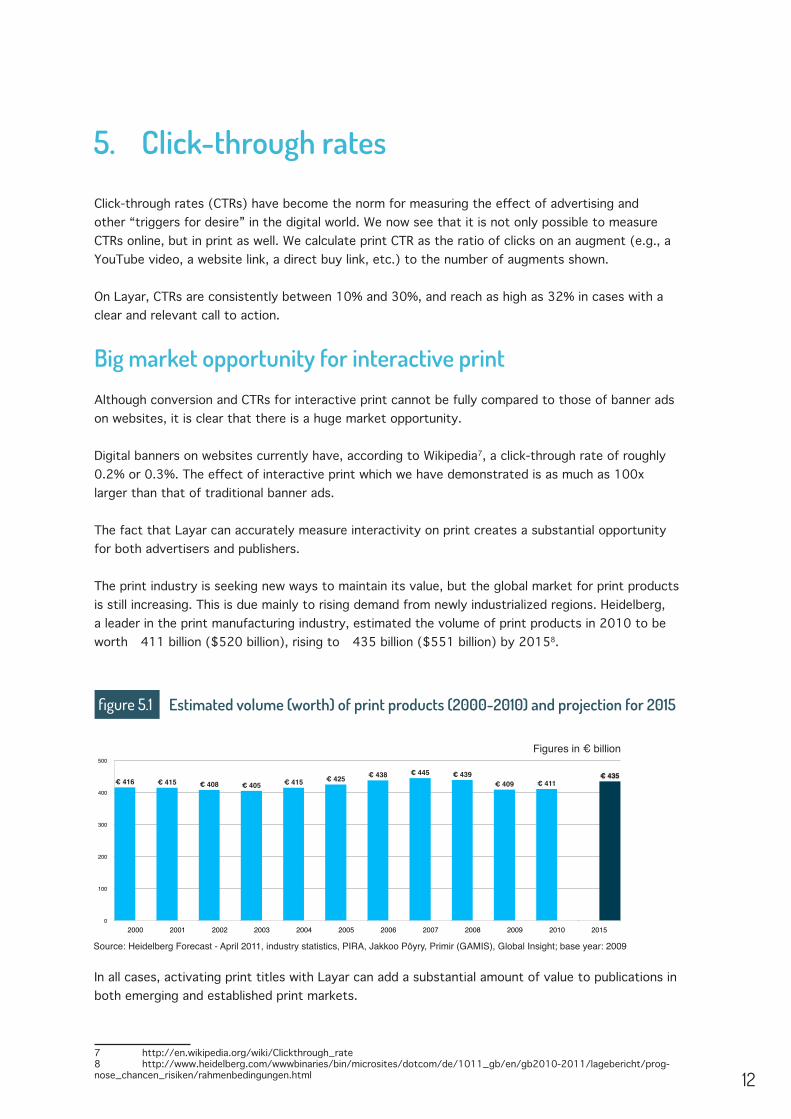
The print industry is seeking new ways to maintain its value, but the global market for print products is still increasing. This is due mainly to rising demand from newly industrialized regions. Heidelberg, a leader in the print manufacturing industry, estimated the volume of print products in 2010 to be worth €411 billion ($520 billion), rising to €435 billion ($551 billion) by 20158.
In all cases, activating print titles with Layar can add a substantial amount of value to publications in both emerging and established print markets.
7 http://en.wikipedia.org/wiki/Clickthrough_rate 8 http://www.heidelberg.com/wwwbinaries/bin/microsites/dotcom/de/1011_gb/en/gb2010-2011/lagebericht/prog-nose_chancen_risiken/rahmenbedingungen.html
Estimated volume (worth) of print products (2000-2010) and projection for 2015figure 5.1
Source: Heidelberg Forecast - April 2011, industry statistics, PIRA, Jakkoo Pöyry, Primir (GAMIS), Global Insight; base year: 2009
Figures in € billion
0
100
200
300
400
500
2000 2001 2002 2003 2004 2005 2006 2007 2008 2009 2010 2015
€ 435€ 411€ 409
€ 439€ 445€ 438€ 425€ 415€ 405€ 408€ 415€ 416

13
6. Conclusion
This document clearly shows that the market for mobile augmented reality is quickly maturing. We believe this whitepaper gives organizations interested in activating their print publications with digital content the information they need to create a viable business case.
If you are interested in doing your AR business with Layar, please contact us by visiting:
www.layar.com/business
Join the discussion!
With this document we are aiming to kick-start a discussion about these and other metrics in the augmented reality industry. Independent industry expert Christine Perey is seeking to partner with application providers to collect raw data about the mobile augmented reality market, including the installed bases of the various AR apps.
If you are active in this field and wish to contribute your data in a secure and private manner, visit the Mobile AR Metrics portal http://www.perey.com/MobileARMetrics/ or contact her at [email protected].
If you wish to include your data directly to a future update of this document, please contact Claire Boonstra at [email protected].

www.layar.com