Embed Size (px)
Citation preview
1 © Hess, Karin K., (Ed.) December 2010. Learning Progressions Frameworks Designed for Use with the Common Core State Standards in Mathematics K-12. National Alternate
Assessment Center at the University of Kentucky and the National Center for the Improvement of Educational Assessment, Dover, N.H. (updated- v.3)
Learning Progressions Frameworks Designed for Use with The Common Core State Standards in Mathematics K-12
Karin K. Hess, NCIEA, Project Director
Jacqui Kearns, NAAC at UKY, NACC Principal Investigator December 31, 2010 (updated 2/24/2011)
This project was funded with partial support from the U.S. Department of Education Office of Special Education Programs Grant number: H324U0400001, The National Alternate Assessment Center (NAAC) at the University of Kentucky, and The National Center for the Improvement of Educational Assessment (NCIEA), Dover, N.H. The opinions expressed herein do not necessarily
reflect those of the U.S. Department of Education or offices within it.
Please send comments, questions, or feedback about using the draft LPFs or related instructional support modules to Karin Hess, National Center for the Improvement of Educational Assessment [ [email protected] ].
2 © Hess, Karin K., (Ed.) December 2010. Learning Progressions Frameworks Designed for Use with the Common Core State Standards in Mathematics K-12. National Alternate
Assessment Center at the University of Kentucky and the National Center for the Improvement of Educational Assessment, Dover, N.H. (updated- v.3)
Introduction
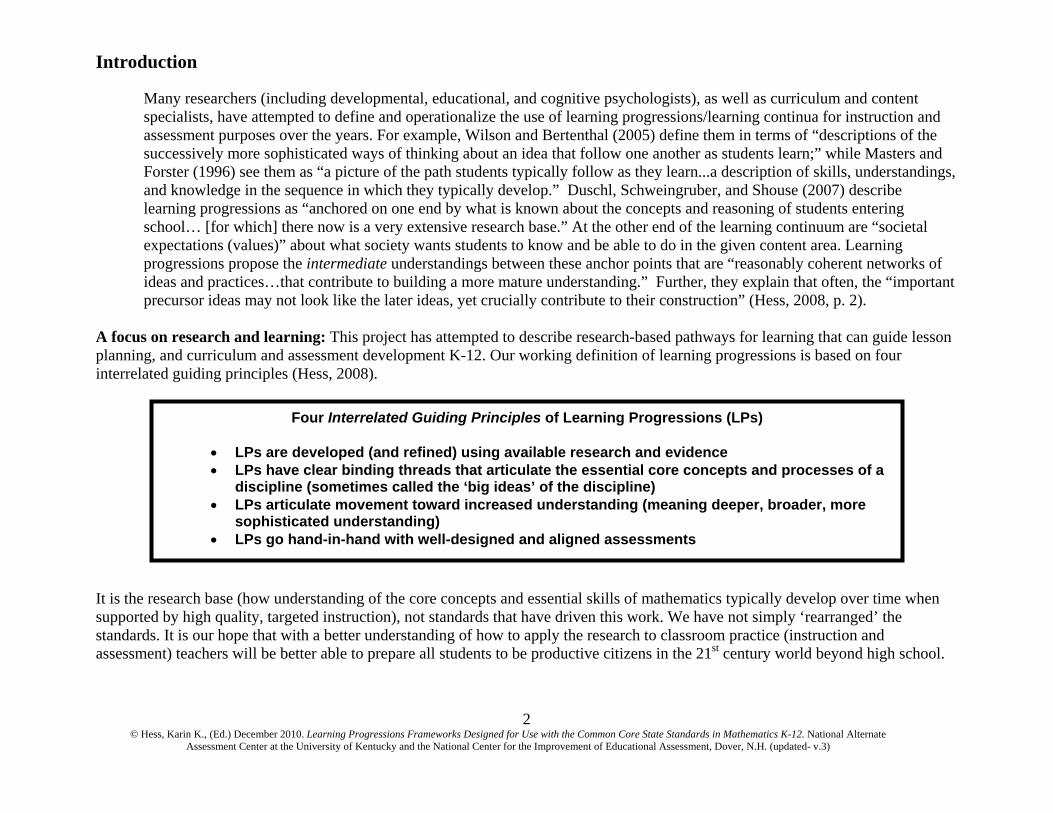
Many researchers (including developmental, educational, and cognitive psychologists), as well as curriculum and content specialists, have attempted to define and operationalize the use of learning progressions/learning continua for instruction and assessment purposes over the years. For example, Wilson and Bertenthal (2005) define them in terms of “descriptions of the successively more sophisticated ways of thinking about an idea that follow one another as students learn;” while Masters and Forster (1996) see them as “a picture of the path students typically follow as they learn...a description of skills, understandings, and knowledge in the sequence in which they typically develop.” Duschl, Schweingruber, and Shouse (2007) describe learning progressions as “anchored on one end by what is known about the concepts and reasoning of students entering school… [for which] there now is a very extensive research base.” At the other end of the learning continuum are “societal expectations (values)” about what society wants students to know and be able to do in the given content area. Learning progressions propose the intermediate understandings between these anchor points that are “reasonably coherent networks of ideas and practices…that contribute to building a more mature understanding.” Further, they explain that often, the “important precursor ideas may not look like the later ideas, yet crucially contribute to their construction” (Hess, 2008, p. 2).
A focus on research and learning: This project has attempted to describe research-based pathways for learning that can guide lesson planning, and curriculum and assessment development K-12. Our working definition of learning progressions is based on four interrelated guiding principles (Hess, 2008). It is the research base (how understanding of the core concepts and essential skills of mathematics typically develop over time when supported by high quality, targeted instruction), not standards that have driven this work. We have not simply ‘rearranged’ the standards. It is our hope that with a better understanding of how to apply the research to classroom practice (instruction and assessment) teachers will be better able to prepare all students to be productive citizens in the 21st century world beyond high school.
Four Interrelated Guiding Principles of Learning Progressions (LPs)
LPs are developed (and refined) using available research and evidence LPs have clear binding threads that articulate the essential core concepts and processes of a
discipline (sometimes called the ‘big ideas’ of the discipline) LPs articulate movement toward increased understanding (meaning deeper, broader, more
sophisticated understanding) LPs go hand-in-hand with well-designed and aligned assessments
3 © Hess, Karin K., (Ed.) December 2010. Learning Progressions Frameworks Designed for Use with the Common Core State Standards in Mathematics K-12. National Alternate
Assessment Center at the University of Kentucky and the National Center for the Improvement of Educational Assessment, Dover, N.H. (updated- v.3)
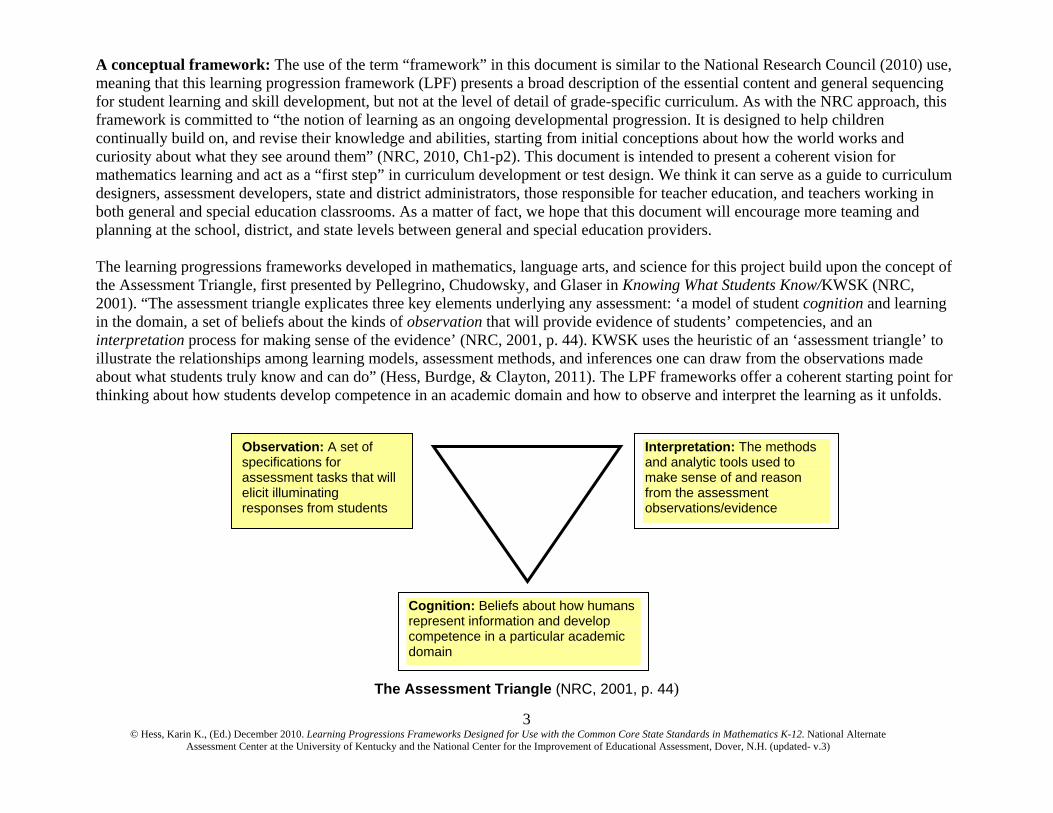
A conceptual framework: The use of the term “framework” in this document is similar to the National Research Council (2010) use, meaning that this learning progression framework (LPF) presents a broad description of the essential content and general sequencing for student learning and skill development, but not at the level of detail of grade-specific curriculum. As with the NRC approach, this framework is committed to “the notion of learning as an ongoing developmental progression. It is designed to help children continually build on, and revise their knowledge and abilities, starting from initial conceptions about how the world works and curiosity about what they see around them” (NRC, 2010, Ch1-p2). This document is intended to present a coherent vision for mathematics learning and act as a “first step” in curriculum development or test design. We think it can serve as a guide to curriculum designers, assessment developers, state and district administrators, those responsible for teacher education, and teachers working in both general and special education classrooms. As a matter of fact, we hope that this document will encourage more teaming and planning at the school, district, and state levels between general and special education providers. The learning progressions frameworks developed in mathematics, language arts, and science for this project build upon the concept of the Assessment Triangle, first presented by Pellegrino, Chudowsky, and Glaser in Knowing What Students Know/KWSK (NRC, 2001). “The assessment triangle explicates three key elements underlying any assessment: ‘a model of student cognition and learning in the domain, a set of beliefs about the kinds of observation that will provide evidence of students’ competencies, and an interpretation process for making sense of the evidence’ (NRC, 2001, p. 44). KWSK uses the heuristic of an ‘assessment triangle’ to illustrate the relationships among learning models, assessment methods, and inferences one can draw from the observations made about what students truly know and can do” (Hess, Burdge, & Clayton, 2011). The LPF frameworks offer a coherent starting point for thinking about how students develop competence in an academic domain and how to observe and interpret the learning as it unfolds.
The Assessment Triangle (NRC, 2001, p. 44)
Observation: A set of specifications for assessment tasks that will elicit illuminating responses from students
Interpretation: The methods and analytic tools used to make sense of and reason from the assessment observations/evidence
Cognition: Beliefs about how humans represent information and develop competence in a particular academic domain
4 © Hess, Karin K., (Ed.) December 2010. Learning Progressions Frameworks Designed for Use with the Common Core State Standards in Mathematics K-12. National Alternate
Assessment Center at the University of Kentucky and the National Center for the Improvement of Educational Assessment, Dover, N.H. (updated- v.3)
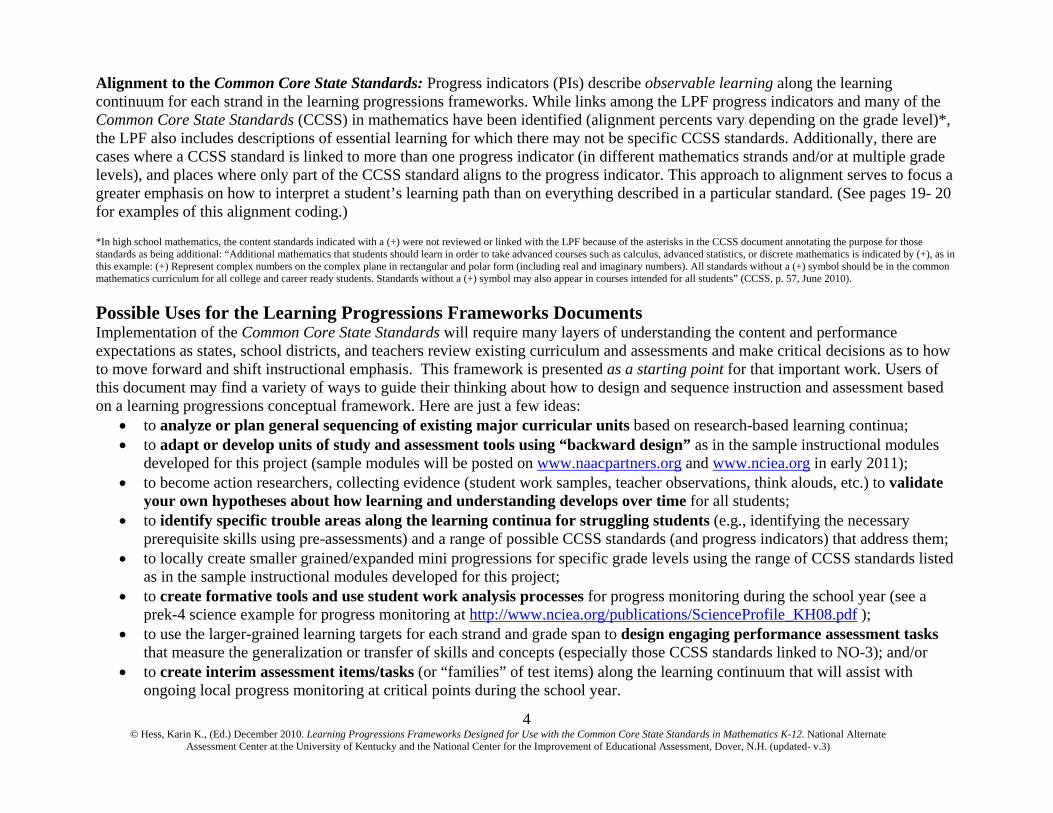
Alignment to the Common Core State Standards: Progress indicators (PIs) describe observable learning along the learning continuum for each strand in the learning progressions frameworks. While links among the LPF progress indicators and many of the Common Core State Standards (CCSS) in mathematics have been identified (alignment percents vary depending on the grade level)*, the LPF also includes descriptions of essential learning for which there may not be specific CCSS standards. Additionally, there are cases where a CCSS standard is linked to more than one progress indicator (in different mathematics strands and/or at multiple grade levels), and places where only part of the CCSS standard aligns to the progress indicator. This approach to alignment serves to focus a greater emphasis on how to interpret a student’s learning path than on everything described in a particular standard. (See pages 19- 20 for examples of this alignment coding.) *In high school mathematics, the content standards indicated with a (+) were not reviewed or linked with the LPF because of the asterisks in the CCSS document annotating the purpose for those standards as being additional: “Additional mathematics that students should learn in order to take advanced courses such as calculus, advanced statistics, or discrete mathematics is indicated by (+), as in this example: (+) Represent complex numbers on the complex plane in rectangular and polar form (including real and imaginary numbers). All standards without a (+) symbol should be in the common mathematics curriculum for all college and career ready students. Standards without a (+) symbol may also appear in courses intended for all students” (CCSS, p. 57, June 2010). Possible Uses for the Learning Progressions Frameworks Documents Implementation of the Common Core State Standards will require many layers of understanding the content and performance expectations as states, school districts, and teachers review existing curriculum and assessments and make critical decisions as to how to move forward and shift instructional emphasis. This framework is presented as a starting point for that important work. Users of this document may find a variety of ways to guide their thinking about how to design and sequence instruction and assessment based on a learning progressions conceptual framework. Here are just a few ideas:
to analyze or plan general sequencing of existing major curricular units based on research-based learning continua; to adapt or develop units of study and assessment tools using “backward design” as in the sample instructional modules
developed for this project (sample modules will be posted on www.naacpartners.org and www.nciea.org in early 2011); to become action researchers, collecting evidence (student work samples, teacher observations, think alouds, etc.) to validate
your own hypotheses about how learning and understanding develops over time for all students; to identify specific trouble areas along the learning continua for struggling students (e.g., identifying the necessary
prerequisite skills using pre-assessments) and a range of possible CCSS standards (and progress indicators) that address them; to locally create smaller grained/expanded mini progressions for specific grade levels using the range of CCSS standards listed
as in the sample instructional modules developed for this project; to create formative tools and use student work analysis processes for progress monitoring during the school year (see a
prek-4 science example for progress monitoring at http://www.nciea.org/publications/ScienceProfile_KH08.pdf ); to use the larger-grained learning targets for each strand and grade span to design engaging performance assessment tasks
that measure the generalization or transfer of skills and concepts (especially those CCSS standards linked to NO-3); and/or to create interim assessment items/tasks (or “families” of test items) along the learning continuum that will assist with
ongoing local progress monitoring at critical points during the school year.
5 © Hess, Karin K., (Ed.) December 2010. Learning Progressions Frameworks Designed for Use with the Common Core State Standards in Mathematics K-12. National Alternate
Assessment Center at the University of Kentucky and the National Center for the Improvement of Educational Assessment, Dover, N.H. (updated- v.3)
Table of Contents
Pages
Part I: Developing the Learning Progressions Frameworks
About the Learning Progressions Frameworks and Curriculum Development Committees
6-8
The Learning Progressions Frameworks (LPFs) Development Process
9-10
Some Key Research Ideas Considered during LPF Development (for each strand)
11-17
Reading and Interpreting the LPF for a Grade Span
18
“Unpacking” the LPF Grade Span for a Grade Level An “expanded version” of the LPF to show smaller learning progressions and links to the CCSS standards
19
20
Part II: Learning Progressions Frameworks for Mathematics K-12
Symbolic Expression (SE) – page 22 The Nature of Numbers and Operations (NO) – pages 23-25 Measurement (M) – pages 26-27 Patterns, Relations, and Functions (PFR) – pages 28-29 Geometry (G) – pages 30-31 Data Analysis, Probability, and Statistics (DPS) – pages 32-33
21-33
References/Research Consulted During LPF Development
34-36
6 © Hess, Karin K., (Ed.) December 2010. Learning Progressions Frameworks Designed for Use with the Common Core State Standards in Mathematics K-12. National Alternate
Assessment Center at the University of Kentucky and the National Center for the Improvement of Educational Assessment, Dover, N.H. (updated- v.3)
About the Learning Progressions Frameworks and Curriculum Development Committees Two separate committees worked on this project during 2010 in each content area (mathematics, language arts, and science). Educators represented seventeen (17) different states, eight (8) colleges and universities, and seven (7) state or national educational organizations. The first committee to meet was comprised of content experts and researchers from both general education and special education. Their tasks were to review and synthesize the research literature about mathematics learning and draft the conceptual learning progressions frameworks (LPFs), in this case for mathematics. This work included identification of enduring understandings and essential learning targets for the elementary (K-4), middle (5-8), and high school (9-12) grade spans. The second committee included a mix of master teachers and professional development providers with classroom experience at each grade span – organized in teams of both general education and special education working together. Curriculum development committee tasks were to: (1) “zoom in” and break down specific targeted sections of the draft LPFs into what we called more detailed “mini progressions” for a smaller grade span, often adding some additional “interim steps” (progress indicators) to the mini progressions; (2) use the more detailed and focused mini progressions to design instructional modules (with a series of 4-6 detailed lessons) illustrating how a teacher in the general education classroom might move students along this smaller grain-sized learning progression using best practices in instruction; and (3) draw from best practices in instruction for students with significant cognitive disabilities to incorporate suggestions to each lesson plan for how to make the academic content more accessible for all students. One sample instructional module, with access (universally designed) suggestions for instruction, was developed for each grade span in each content area using the LPFs to illustrate how teaching might look and academic learning might develop over time. Since this project was an iterative process over many months, members of both committees were continually asked to review and refine the progress indicators (descriptors) in the learning progressions frameworks and link them back to the specific standards in the Common Core State Standards (June 2010) when possible. We see the LPFs as articulating conceptual hypotheses about mathematics learning to be validated with evidence seen in student performance across the grades. As teachers and researchers continue to use the LPF learning targets and progress indicators for each strand, we will refine our thinking about how mathematics learning develops over time for different populations of learners. Feedback from the field will be used to modify the sequencing of strand descriptors accordingly. We invite users of these materials to become action researchers with us and share what you are learning. The sample instructional modules developed as part of this project are intended to demonstrate how practitioners might use the LPFs to break down descriptors into smaller mini progressions and design and sequence classroom instruction to monitor progress. Instructional modules are NOT intended to be prescriptive about how to teach the academic content. The modules ARE intended to be used to clarify what the academic content is, how it can be made more accessible for all students, and what units of study might look like when sequencing skills and concepts along a research-based learning continuum. (Sample instructional modules will be posted in 2011 on the www.naacpartners.org/publications and on the www.nciea.org/publications websites when final editing is completed. As new instructional modules aligned with the CCSS continue to be developed, they too will be made available on these websites.) Please send comments or questions about the draft LPFs or related instructional support materials to Karin Hess [[email protected]].
7 © Hess, Karin K., (Ed.) December 2010. Learning Progressions Frameworks Designed for Use with the Common Core State Standards in Mathematics K-12. National Alternate
Assessment Center at the University of Kentucky and the National Center for the Improvement of Educational Assessment, Dover, N.H. (updated- v.3)
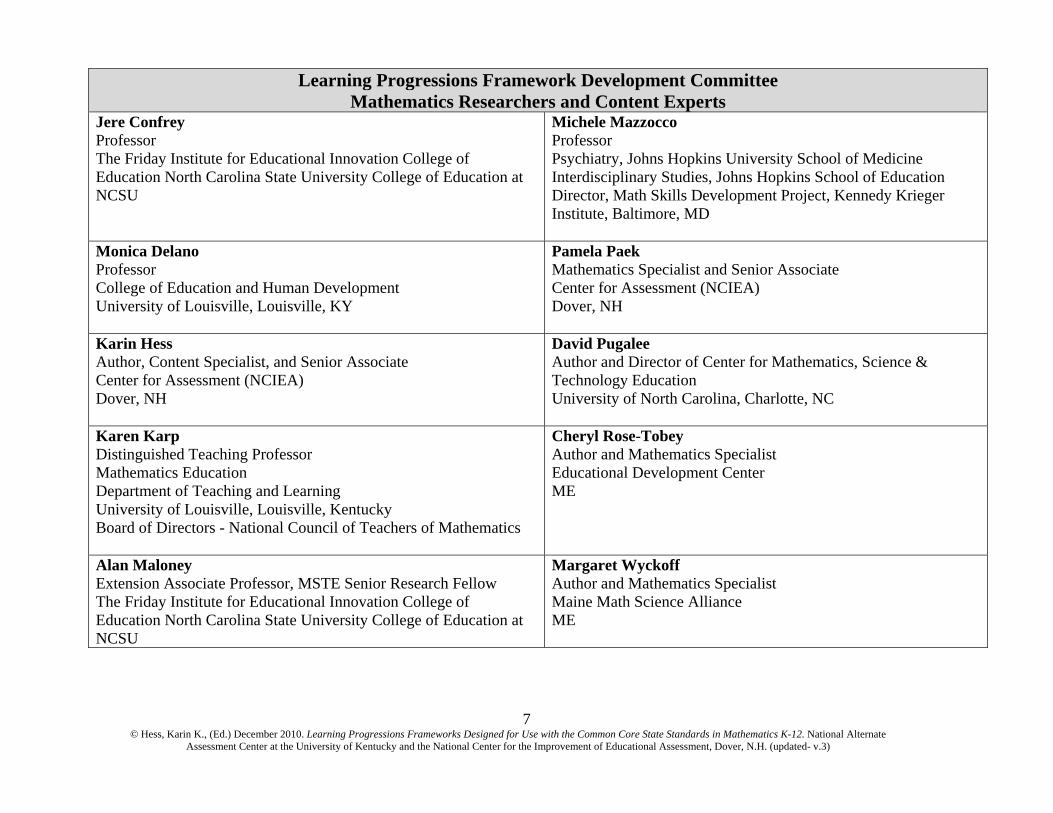
Learning Progressions Framework Development Committee Mathematics Researchers and Content Experts
Jere Confrey Professor The Friday Institute for Educational Innovation College of Education North Carolina State University College of Education at NCSU
Michele Mazzocco Professor Psychiatry, Johns Hopkins University School of Medicine Interdisciplinary Studies, Johns Hopkins School of Education Director, Math Skills Development Project, Kennedy Krieger Institute, Baltimore, MD
Monica Delano Professor College of Education and Human Development University of Louisville, Louisville, KY
Pamela Paek Mathematics Specialist and Senior Associate Center for Assessment (NCIEA) Dover, NH
Karin Hess Author, Content Specialist, and Senior Associate Center for Assessment (NCIEA) Dover, NH
David Pugalee Author and Director of Center for Mathematics, Science & Technology Education University of North Carolina, Charlotte, NC
Karen Karp Distinguished Teaching Professor Mathematics Education Department of Teaching and Learning University of Louisville, Louisville, Kentucky Board of Directors - National Council of Teachers of Mathematics
Cheryl Rose-Tobey Author and Mathematics Specialist Educational Development Center ME
Alan Maloney Extension Associate Professor, MSTE Senior Research Fellow The Friday Institute for Educational Innovation College of Education North Carolina State University College of Education at NCSU
Margaret Wyckoff Author and Mathematics Specialist Maine Math Science Alliance ME
8 © Hess, Karin K., (Ed.) December 2010. Learning Progressions Frameworks Designed for Use with the Common Core State Standards in Mathematics K-12. National Alternate
Assessment Center at the University of Kentucky and the National Center for the Improvement of Educational Assessment, Dover, N.H. (updated- v.3)
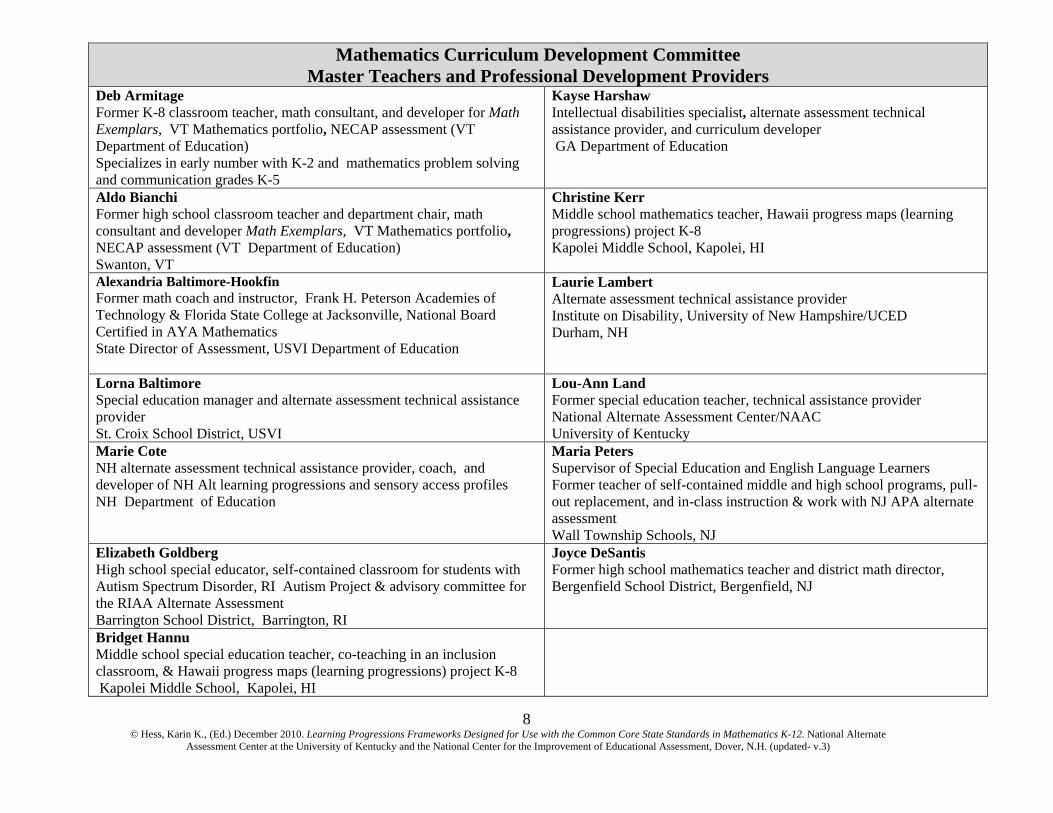
Mathematics Curriculum Development Committee Master Teachers and Professional Development Providers
Deb Armitage Former K-8 classroom teacher, math consultant, and developer for Math Exemplars, VT Mathematics portfolio, NECAP assessment (VT Department of Education) Specializes in early number with K-2 and mathematics problem solving and communication grades K-5
Kayse Harshaw Intellectual disabilities specialist, alternate assessment technical assistance provider, and curriculum developer GA Department of Education
Aldo Bianchi Former high school classroom teacher and department chair, math consultant and developer Math Exemplars, VT Mathematics portfolio, NECAP assessment (VT Department of Education) Swanton, VT
Christine Kerr Middle school mathematics teacher, Hawaii progress maps (learning progressions) project K-8 Kapolei Middle School, Kapolei, HI
Alexandria Baltimore-Hookfin Former math coach and instructor, Frank H. Peterson Academies of Technology & Florida State College at Jacksonville, National Board Certified in AYA Mathematics State Director of Assessment, USVI Department of Education
Laurie Lambert Alternate assessment technical assistance provider Institute on Disability, University of New Hampshire/UCED Durham, NH
Lorna Baltimore Special education manager and alternate assessment technical assistance provider St. Croix School District, USVI
Lou-Ann Land Former special education teacher, technical assistance provider National Alternate Assessment Center/NAAC University of Kentucky
Marie Cote NH alternate assessment technical assistance provider, coach, and developer of NH Alt learning progressions and sensory access profiles NH Department of Education
Maria Peters Supervisor of Special Education and English Language Learners Former teacher of self-contained middle and high school programs, pull-out replacement, and in-class instruction & work with NJ APA alternate assessment Wall Township Schools, NJ
Elizabeth Goldberg High school special educator, self-contained classroom for students with Autism Spectrum Disorder, RI Autism Project & advisory committee for the RIAA Alternate Assessment Barrington School District, Barrington, RI
Joyce DeSantis Former high school mathematics teacher and district math director, Bergenfield School District, Bergenfield, NJ
Bridget Hannu Middle school special education teacher, co-teaching in an inclusion classroom, & Hawaii progress maps (learning progressions) project K-8 Kapolei Middle School, Kapolei, HI
9 © Hess, Karin K., (Ed.) December 2010. Learning Progressions Frameworks Designed for Use with the Common Core State Standards in Mathematics K-12. National Alternate
Assessment Center at the University of Kentucky and the National Center for the Improvement of Educational Assessment, Dover, N.H. (updated- v.3)
The Learning Progressions Frameworks (LPFs) Development Process The approach used to identify the content progressions and specific standards within the Common Core State Standards (CCSS) considered three important dimensions. First, national content experts and researchers in mathematics were asked to identify specific content strands that represented a way to organize essential learning for all students, K-12. Next, the committee was asked to describe the “enduring understandings” (as defined by Wiggins and McTighe, 2005) for each particular content strand, as well as articulate what the learning targets would look like if students were demonstrating achievement of the enduring understandings at the end of each grade span (K-4, 5-8, and 9-12). The grade span learning targets for each strand (pp. 11-17) are stated as broader performance indicators (e.g., use equations and expressions involving basic operations to represent a given context; Build flexibility with whole numbers and fractions to understand the nature of number and number systems). The larger grained grade span learning targets are designed to describe progressively more complex demonstrations of learning across the grade spans and use wording similar to what one might see in performance level descriptors for a given grade or grade span. In mathematics, six major LPF strands were established. Below is a brief description of the six strands identified by the LPF content committee. “For each content area, these essential threads [strands] interact to build greater understanding of the discipline over time. Identifying a small number of essential threads makes the learning progression manageable for the classroom teacher in terms of tracking ongoing progress in the classroom” (Hess, 2008, p.5). It is not the intent that skills/concepts from a particular strand be taught in isolation in a linear sequence, but rather be integrated among strands, such as in a problem solving situation where students are demonstrating their understanding of measurement concepts while applying their knowledge of numbers and operations and using symbolic expression. In other words, the LPFs should be thought of as a general map for learning, not a single route to a destination. Symbolic Expression (SE) – Symbolic Expression, presented in this document as the first strand, is a reminder NOT to teach
symbolic representations before students have begun to demonstrate conceptual understanding of what the symbols or procedures actually mean (e.g., what joining together (+) and taking apart (-) sets means; understanding relative magnitude of part-whole; that “equivalence” (=) means different names for the same number). Progress indicators for the Symbolic Expression strand should be taught in conjunction with skills and concepts described in PIs from other strands and introduced with building conceptual understanding in mind. (See page 11 for key learning targets for the Symbolic Expression strand.)
The Nature of Numbers & Operations (NO) – The skills and concepts within the Nature of Numbers and Operations strands form the foundation - and often are the prerequisite skills and concepts - for many of the other mathematics strands. Local curriculum development efforts should always consider how the skills and concepts described in the Numbers & Operations progress indicators can be introduced, practiced, and extended with skills/concepts found in the other strands. The third N&O strand (p. 12) focuses on mathematical reasoning and problem solving. These progress indicators can be integrated with many CCSS standards at each grade level using problem solving contexts. While listed under the Nature of Numbers & Operations strand, the skills and concepts described in these progress indicators could apply to concepts in different mathematics strands, such as when developing proofs in Geometry. (See pages 12-13 for key learning targets for the Numbers & Operations strand.)
10 © Hess, Karin K., (Ed.) December 2010. Learning Progressions Frameworks Designed for Use with the Common Core State Standards in Mathematics K-12. National Alternate
Assessment Center at the University of Kentucky and the National Center for the Improvement of Educational Assessment, Dover, N.H. (updated- v.3)
Measurement (ME) – Progress indicators are organized under two key learning targets for each grade span (p. 14). Patterns, Relations, & Functions (PFR) – Progress indicators are organized under two key learning targets for each grade span
(p. 15). Geometry (GM) – Progress indicators are organized under one key learning target for each grade span (p. 16). Data Analysis, Probability, & Statistics (DPS) – Progress indicators are organized under two key learning targets for each grade
span (p. 17). There is minimal emphasis in the CCSS on Data Analysis, Probability, & Statistics at grades K-6. Because many of the DPS mathematics skills and concepts are essential to science and social studies instruction at these grade levels, progress indicators are included in the DPS strand to guide unit development where organizing and interpreting data is important. However, you will not find many links to the CCSS mathematics standards in this strand.
These first two steps - developing six major strands, each with progressively more sophisticated or complex grade span learning targets - established the underlying conceptual framework that could be built upon across the grades and linked to specific research-based progressions of skills and concepts needed to achieve the designated learning targets. Once the content committee had established the broader grade span learning targets for each strand, they were asked to identify and describe the essential skills and concepts needed to achieve the grade span expectations; use research syntheses to establish a general order of how those skills and concepts emerge for most students; and further break down the descriptors into smaller grades spans: K-2, 3-4, 5-6, 7-8, and high school. The descriptors of related skills and concepts became what we now call the progress indicators and the ordering/numbering used (1a, 1b, 1c, etc.) reflects the research base used to establish a general learning continuum. Descriptions of earlier skills build the foundation for later skills at the next grade level or grade span. The final step in the LPF development process was to look backward and forward (grades K-12) to identify alignment with specific CCSS mathematics content standards in order to create guidance for a cohesive curriculum experience across grades. Sometimes multiple standards from within the smaller grade spans could be linked to the same progress indicator (PI); sometimes there was only one or no standard that aligned. For example, in some strands and grade spans you will see PI descriptors that do not link (align) with an existing CCSS standard; however, the research review identified critical learning needed at certain stages during the learning process or skills that may be essential for conceptual understanding and for making progress; therefore, progress indicators with no CCSS links are also included in the LPF to guide instruction and progress monitoring. The following pages show the six mathematics strands with statements of enduring understanding (in the white area at the top) and grade span learning targets for elementary, middle, and high school (in the color-shaded areas under the enduring understanding). A few selected research findings are highlighted for each strand as well.
11 © Hess, Karin K., (Ed.) December 2010. Learning Progressions Frameworks Designed for Use with the Common Core State Standards in Mathematics K-12. National Alternate
Assessment Center at the University of Kentucky and the National Center for the Improvement of Educational Assessment, Dover, N.H. (updated- v.3)
Strand 1: Symbolic Expression
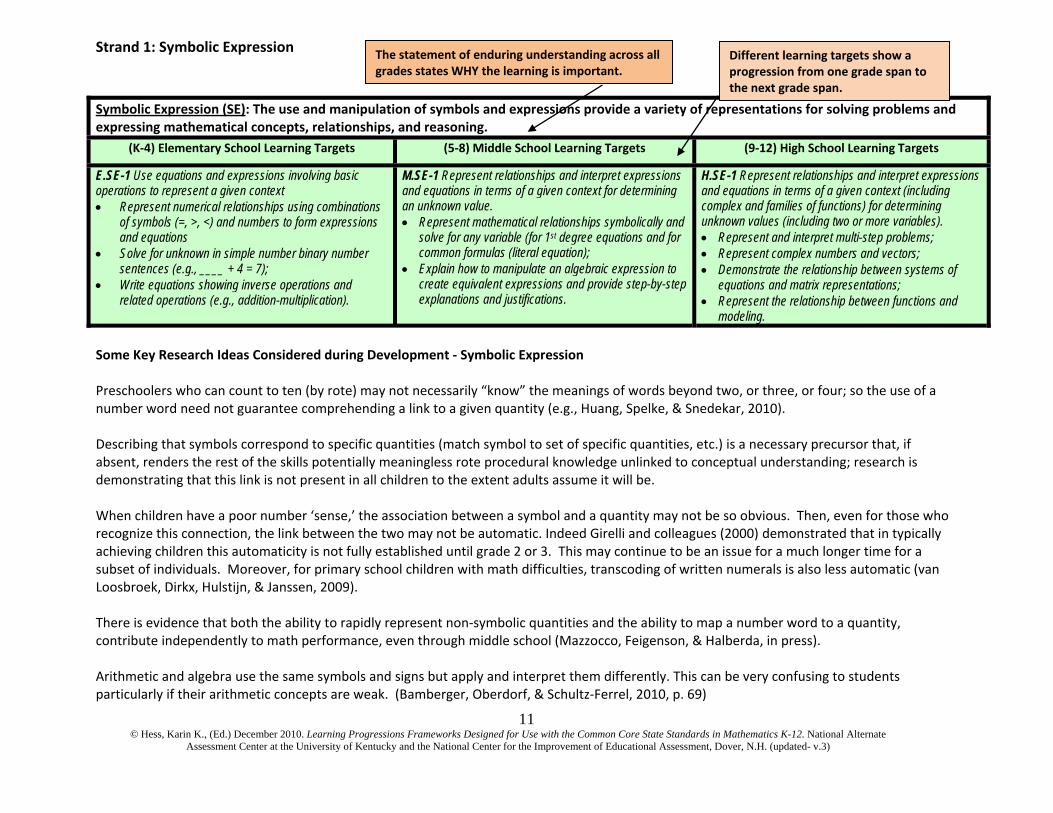
Some Key Research Ideas Considered during Development ‐ Symbolic Expression Preschoolers who can count to ten (by rote) may not necessarily “know” the meanings of words beyond two, or three, or four; so the use of a number word need not guarantee comprehending a link to a given quantity (e.g., Huang, Spelke, & Snedekar, 2010). Describing that symbols correspond to specific quantities (match symbol to set of specific quantities, etc.) is a necessary precursor that, if absent, renders the rest of the skills potentially meaningless rote procedural knowledge unlinked to conceptual understanding; research is demonstrating that this link is not present in all children to the extent adults assume it will be. When children have a poor number ‘sense,’ the association between a symbol and a quantity may not be so obvious. Then, even for those who recognize this connection, the link between the two may not be automatic. Indeed Girelli and colleagues (2000) demonstrated that in typically achieving children this automaticity is not fully established until grade 2 or 3. This may continue to be an issue for a much longer time for a subset of individuals. Moreover, for primary school children with math difficulties, transcoding of written numerals is also less automatic (van Loosbroek, Dirkx, Hulstijn, & Janssen, 2009). There is evidence that both the ability to rapidly represent non‐symbolic quantities and the ability to map a number word to a quantity, contribute independently to math performance, even through middle school (Mazzocco, Feigenson, & Halberda, in press). Arithmetic and algebra use the same symbols and signs but apply and interpret them differently. This can be very confusing to students particularly if their arithmetic concepts are weak. (Bamberger, Oberdorf, & Schultz‐Ferrel, 2010, p. 69)
Symbolic Expression (SE): The use and manipulation of symbols and expressions provide a variety of representations for solving problems and expressing mathematical concepts, relationships, and reasoning.
(K‐4) Elementary School Learning Targets (5‐8) Middle School Learning Targets (9‐12) High School Learning Targets
E.SE-1 Use equations and expressions involving basic operations to represent a given context Represent numerical relationships using combinations
of symbols (=, >, <) and numbers to form expressions and equations
Solve for unknown in simple number binary number sentences (e.g., ____ + 4 = 7);
Write equations showing inverse operations and related operations (e.g., addition-multiplication).
M.SE-1 Represent relationships and interpret expressions and equations in terms of a given context for determining an unknown value. Represent mathematical relationships symbolically and
solve for any variable (for 1st degree equations and for common formulas (literal equation);
Explain how to manipulate an algebraic expression to create equivalent expressions and provide step-by-step explanations and justifications.
H.SE-1 Represent relationships and interpret expressions and equations in terms of a given context (including complex and families of functions) for determining unknown values (including two or more variables). Represent and interpret multi-step problems; Represent complex numbers and vectors; Demonstrate the relationship between systems of
equations and matrix representations; Represent the relationship between functions and
modeling.
The statement of enduring understanding across all grades states WHY the learning is important.
Different learning targets show a progression from one grade span to the next grade span.
12 © Hess, Karin K., (Ed.) December 2010. Learning Progressions Frameworks Designed for Use with the Common Core State Standards in Mathematics K-12. National Alternate
Assessment Center at the University of Kentucky and the National Center for the Improvement of Educational Assessment, Dover, N.H. (updated- v.3)
Strand 2: The Nature of Numbers and Operations
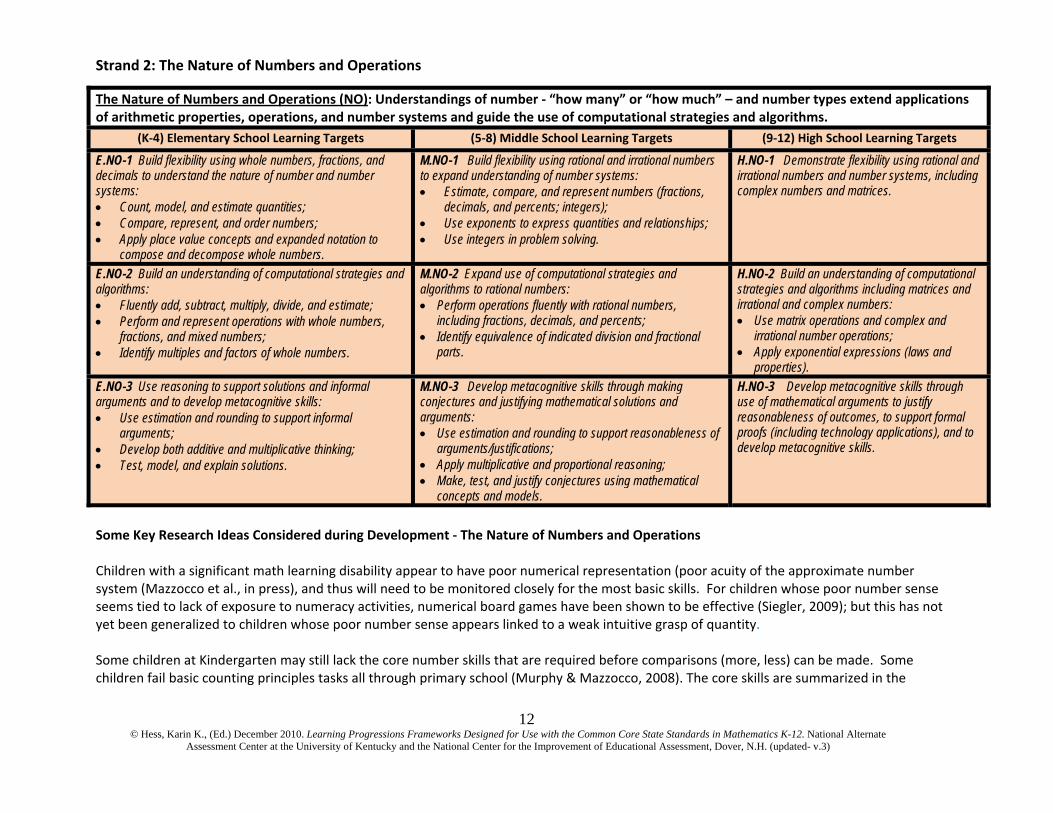
Some Key Research Ideas Considered during Development ‐ The Nature of Numbers and Operations Children with a significant math learning disability appear to have poor numerical representation (poor acuity of the approximate number system (Mazzocco et al., in press), and thus will need to be monitored closely for the most basic skills. For children whose poor number sense seems tied to lack of exposure to numeracy activities, numerical board games have been shown to be effective (Siegler, 2009); but this has not yet been generalized to children whose poor number sense appears linked to a weak intuitive grasp of quantity.
Some children at Kindergarten may still lack the core number skills that are required before comparisons (more, less) can be made. Some children fail basic counting principles tasks all through primary school (Murphy & Mazzocco, 2008). The core skills are summarized in the
The Nature of Numbers and Operations (NO): Understandings of number ‐ “how many” or “how much” – and number types extend applications of arithmetic properties, operations, and number systems and guide the use of computational strategies and algorithms.
(K‐4) Elementary School Learning Targets (5‐8) Middle School Learning Targets (9‐12) High School Learning Targets
E.NO-1 Build flexibility using whole numbers, fractions, and decimals to understand the nature of number and number systems: Count, model, and estimate quantities; Compare, represent, and order numbers; Apply place value concepts and expanded notation to
compose and decompose whole numbers.
M.NO-1 Build flexibility using rational and irrational numbers to expand understanding of number systems: Estimate, compare, and represent numbers (fractions,
decimals, and percents; integers); Use exponents to express quantities and relationships; Use integers in problem solving.
H.NO-1 Demonstrate flexibility using rational and irrational numbers and number systems, including complex numbers and matrices.
E.NO-2 Build an understanding of computational strategies and algorithms: Fluently add, subtract, multiply, divide, and estimate; Perform and represent operations with whole numbers,
fractions, and mixed numbers; Identify multiples and factors of whole numbers.
M.NO-2 Expand use of computational strategies and algorithms to rational numbers: Perform operations fluently with rational numbers,
including fractions, decimals, and percents; Identify equivalence of indicated division and fractional
parts.
H.NO-2 Build an understanding of computational strategies and algorithms including matrices and irrational and complex numbers: Use matrix operations and complex and
irrational number operations; Apply exponential expressions (laws and
properties). E.NO-3 Use reasoning to support solutions and informal arguments and to develop metacognitive skills: Use estimation and rounding to support informal
arguments; Develop both additive and multiplicative thinking; Test, model, and explain solutions.
M.NO-3 Develop metacognitive skills through making conjectures and justifying mathematical solutions and arguments: Use estimation and rounding to support reasonableness of
arguments/justifications; Apply multiplicative and proportional reasoning; Make, test, and justify conjectures using mathematical
concepts and models.
H.NO-3 Develop metacognitive skills through use of mathematical arguments to justify reasonableness of outcomes, to support formal proofs (including technology applications), and to develop metacognitive skills.
13 © Hess, Karin K., (Ed.) December 2010. Learning Progressions Frameworks Designed for Use with the Common Core State Standards in Mathematics K-12. National Alternate
Assessment Center at the University of Kentucky and the National Center for the Improvement of Educational Assessment, Dover, N.H. (updated- v.3)
National Research Council 2009 publication, Mathematics Learning in Early Childhood (p. 129); they include cardinality, and 1‐1 correspondence, and number constancy.
“In traditional instruction, young children are often expected to use mental computation before they completely understand the concept of addition” (Bamberger et al., p. 118).
Mazzocco & Thompson (2005) demonstrated that third graders with math learning disabilities were more likely to have failed number constancy items, (as well as numeral identification, and magnitude comparison items) at Kindergarten than were there typically achieving peers. Several others have shown that these and other number sense skills are predictive of later math achievement levels (e.g., de Smedt, Verschaffel, & Ghesquiere, 2009; Geary, Bailey, et al., 2009; Locuniak & Jordan, 2008).
There is evidence that students who struggle with fractions (even in middle school) are often not able to represent fractions on a number line (Bamberger, Oberdorf, & Schultz‐Ferrell, 2010). “Number lines can be used to build an understanding of the relative magnitude of fractions, equivalence, addition and subtraction of fractions, and the density of rational numbers” (Petit, Laird, & Marsden, p. 99). Linear number line skills promote development of a linear representation of a mental number line (Siegler, 2009) ‐ This particular review pertains to pre‐K children, and to low income children only, but other research demonstrates that low income and K‐2 students who have linear vs. nonlinear representations of number line are better at memory for number, and since memory for number is linked to achievement, enhancing these skills may be an important component of helping students understand number. Geary et al. (2008) show that children with math difficulties have poorer number line skills through at least grade 2, so working on these number line skills at K‐2 is essential for children with (or at risk for) poor math achievement. There is also some evidence that most 6th grade children who fail to read decimals with number words have persistent conceptual difficulty with decimals (Mazzocco & Devlin, 2007), suggestive of a failure to recognize that fractions represent specific quantities. The Institute of Education Sciences (IES) recently published (2010) an empirically guided Practice Guide for fractions instruction that includes these recommendations:
Rec.1. Build on students’ informal understanding of sharing and proportionality to develop initial fraction concepts Rec 2. Help students recognize that fractions are numbers and that they expand the number system beyond whole numbers. Use
number lines as a central representational tool in teaching this and other fraction concepts from the early grades onward. Rec 3. Help students understand why procedures for computations with fractions make sense. Rec 4. Develop students’ conceptual understanding of strategies for solving ratio, rate, and proportion problems before exposing them
to cross‐multiplication as a procedure to use to solve such problems. From page 9 of the same IES report: “Number lines are particularly advantageous for assessing knowledge of fractions and for teaching students about them. They provide a common tool for representing the sizes of common fractions, decimals, and percents; positive and negative fractions; fractions that are less than one and greater than one; and equivalent and nonequivalent fractions.
14 © Hess, Karin K., (Ed.) December 2010. Learning Progressions Frameworks Designed for Use with the Common Core State Standards in Mathematics K-12. National Alternate
Assessment Center at the University of Kentucky and the National Center for the Improvement of Educational Assessment, Dover, N.H. (updated- v.3)
Strand 3: Measurement
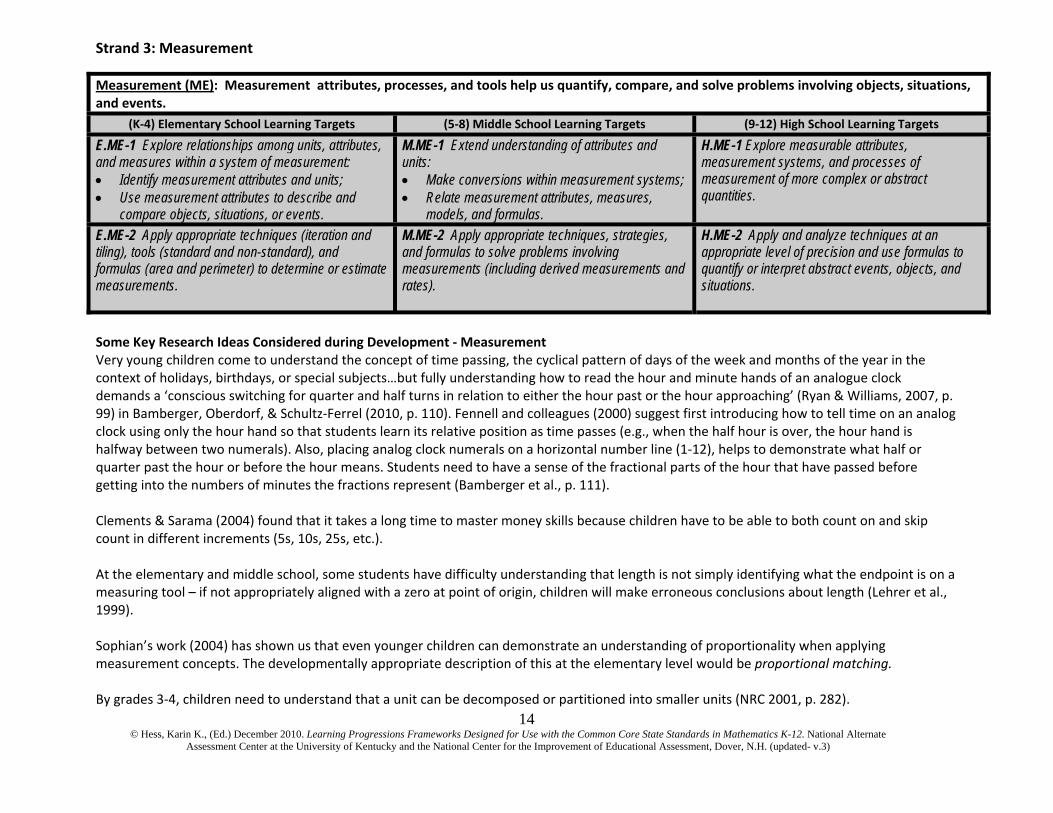
Some Key Research Ideas Considered during Development ‐ Measurement Very young children come to understand the concept of time passing, the cyclical pattern of days of the week and months of the year in the context of holidays, birthdays, or special subjects…but fully understanding how to read the hour and minute hands of an analogue clock demands a ‘conscious switching for quarter and half turns in relation to either the hour past or the hour approaching’ (Ryan & Williams, 2007, p. 99) in Bamberger, Oberdorf, & Schultz‐Ferrel (2010, p. 110). Fennell and colleagues (2000) suggest first introducing how to tell time on an analog clock using only the hour hand so that students learn its relative position as time passes (e.g., when the half hour is over, the hour hand is halfway between two numerals). Also, placing analog clock numerals on a horizontal number line (1‐12), helps to demonstrate what half or quarter past the hour or before the hour means. Students need to have a sense of the fractional parts of the hour that have passed before getting into the numbers of minutes the fractions represent (Bamberger et al., p. 111). Clements & Sarama (2004) found that it takes a long time to master money skills because children have to be able to both count on and skip count in different increments (5s, 10s, 25s, etc.). At the elementary and middle school, some students have difficulty understanding that length is not simply identifying what the endpoint is on a measuring tool – if not appropriately aligned with a zero at point of origin, children will make erroneous conclusions about length (Lehrer et al., 1999). Sophian’s work (2004) has shown us that even younger children can demonstrate an understanding of proportionality when applying measurement concepts. The developmentally appropriate description of this at the elementary level would be proportional matching. By grades 3‐4, children need to understand that a unit can be decomposed or partitioned into smaller units (NRC 2001, p. 282).
Measurement (ME): Measurement attributes, processes, and tools help us quantify, compare, and solve problems involving objects, situations, and events.
(K‐4) Elementary School Learning Targets (5‐8) Middle School Learning Targets (9‐12) High School Learning Targets
E.ME-1 Explore relationships among units, attributes, and measures within a system of measurement: Identify measurement attributes and units; Use measurement attributes to describe and
compare objects, situations, or events.
M.ME-1 Extend understanding of attributes and units: Make conversions within measurement systems; Relate measurement attributes, measures,
models, and formulas.
H.ME-1 Explore measurable attributes, measurement systems, and processes of measurement of more complex or abstract quantities.
E.ME-2 Apply appropriate techniques (iteration and tiling), tools (standard and non-standard), and formulas (area and perimeter) to determine or estimate measurements.
M.ME-2 Apply appropriate techniques, strategies, and formulas to solve problems involving measurements (including derived measurements and rates).
H.ME-2 Apply and analyze techniques at an appropriate level of precision and use formulas to quantify or interpret abstract events, objects, and situations.
15 © Hess, Karin K., (Ed.) December 2010. Learning Progressions Frameworks Designed for Use with the Common Core State Standards in Mathematics K-12. National Alternate
Assessment Center at the University of Kentucky and the National Center for the Improvement of Educational Assessment, Dover, N.H. (updated- v.3)
Strand 4: Patterns, Relations, and Functions
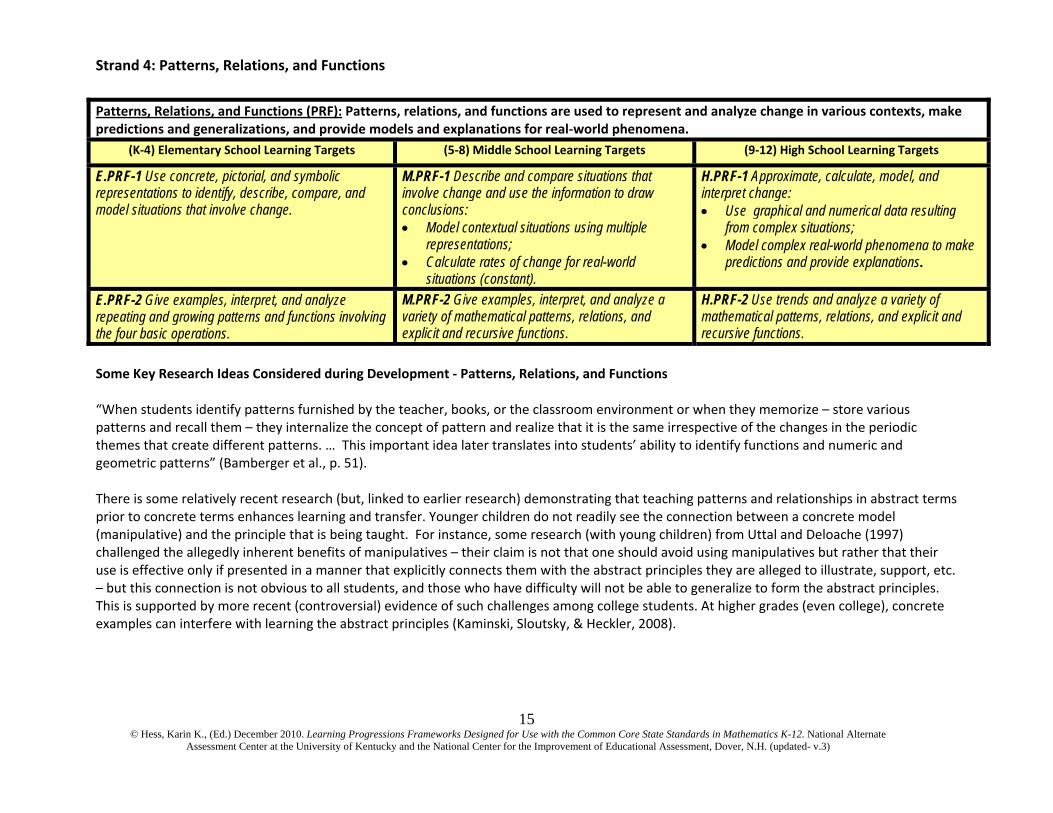
Some Key Research Ideas Considered during Development ‐ Patterns, Relations, and Functions “When students identify patterns furnished by the teacher, books, or the classroom environment or when they memorize – store various patterns and recall them – they internalize the concept of pattern and realize that it is the same irrespective of the changes in the periodic themes that create different patterns. … This important idea later translates into students’ ability to identify functions and numeric and geometric patterns” (Bamberger et al., p. 51). There is some relatively recent research (but, linked to earlier research) demonstrating that teaching patterns and relationships in abstract terms prior to concrete terms enhances learning and transfer. Younger children do not readily see the connection between a concrete model (manipulative) and the principle that is being taught. For instance, some research (with young children) from Uttal and Deloache (1997) challenged the allegedly inherent benefits of manipulatives – their claim is not that one should avoid using manipulatives but rather that their use is effective only if presented in a manner that explicitly connects them with the abstract principles they are alleged to illustrate, support, etc. – but this connection is not obvious to all students, and those who have difficulty will not be able to generalize to form the abstract principles. This is supported by more recent (controversial) evidence of such challenges among college students. At higher grades (even college), concrete examples can interfere with learning the abstract principles (Kaminski, Sloutsky, & Heckler, 2008).
Patterns, Relations, and Functions (PRF): Patterns, relations, and functions are used to represent and analyze change in various contexts, make predictions and generalizations, and provide models and explanations for real‐world phenomena.
(K‐4) Elementary School Learning Targets (5‐8) Middle School Learning Targets (9‐12) High School Learning Targets
E.PRF-1 Use concrete, pictorial, and symbolic representations to identify, describe, compare, and model situations that involve change.
M.PRF-1 Describe and compare situations that involve change and use the information to draw conclusions: Model contextual situations using multiple
representations; Calculate rates of change for real-world
situations (constant).
H.PRF-1 Approximate, calculate, model, and interpret change: Use graphical and numerical data resulting
from complex situations; Model complex real-world phenomena to make
predictions and provide explanations.
E.PRF-2 Give examples, interpret, and analyze repeating and growing patterns and functions involving the four basic operations.
M.PRF-2 Give examples, interpret, and analyze a variety of mathematical patterns, relations, and explicit and recursive functions.
H.PRF-2 Use trends and analyze a variety of mathematical patterns, relations, and explicit and recursive functions.
16 © Hess, Karin K., (Ed.) December 2010. Learning Progressions Frameworks Designed for Use with the Common Core State Standards in Mathematics K-12. National Alternate
Assessment Center at the University of Kentucky and the National Center for the Improvement of Educational Assessment, Dover, N.H. (updated- v.3)
Strand 5: Geometry
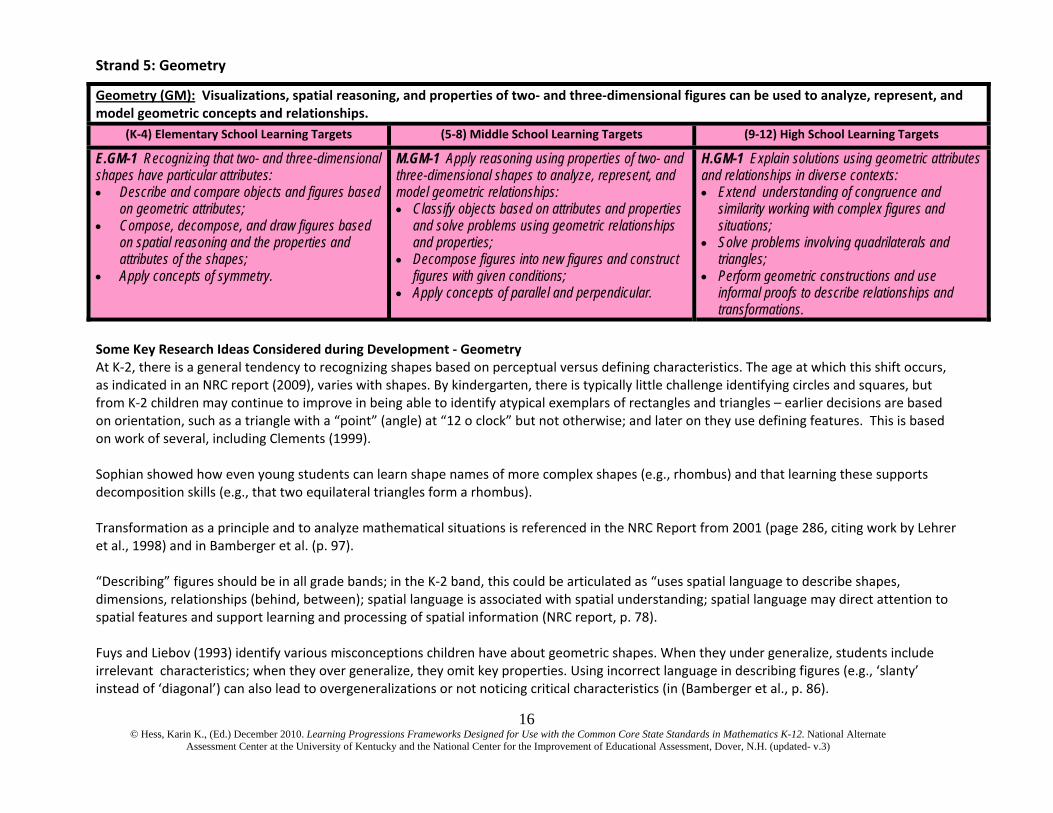
Some Key Research Ideas Considered during Development ‐ Geometry At K‐2, there is a general tendency to recognizing shapes based on perceptual versus defining characteristics. The age at which this shift occurs, as indicated in an NRC report (2009), varies with shapes. By kindergarten, there is typically little challenge identifying circles and squares, but from K‐2 children may continue to improve in being able to identify atypical exemplars of rectangles and triangles – earlier decisions are based on orientation, such as a triangle with a “point” (angle) at “12 o clock” but not otherwise; and later on they use defining features. This is based on work of several, including Clements (1999). Sophian showed how even young students can learn shape names of more complex shapes (e.g., rhombus) and that learning these supports decomposition skills (e.g., that two equilateral triangles form a rhombus). Transformation as a principle and to analyze mathematical situations is referenced in the NRC Report from 2001 (page 286, citing work by Lehrer et al., 1998) and in Bamberger et al. (p. 97). “Describing” figures should be in all grade bands; in the K‐2 band, this could be articulated as “uses spatial language to describe shapes, dimensions, relationships (behind, between); spatial language is associated with spatial understanding; spatial language may direct attention to spatial features and support learning and processing of spatial information (NRC report, p. 78). Fuys and Liebov (1993) identify various misconceptions children have about geometric shapes. When they under generalize, students include irrelevant characteristics; when they over generalize, they omit key properties. Using incorrect language in describing figures (e.g., ‘slanty’ instead of ‘diagonal’) can also lead to overgeneralizations or not noticing critical characteristics (in (Bamberger et al., p. 86).
Geometry (GM): Visualizations, spatial reasoning, and properties of two‐ and three‐dimensional figures can be used to analyze, represent, and model geometric concepts and relationships.
(K‐4) Elementary School Learning Targets (5‐8) Middle School Learning Targets (9‐12) High School Learning Targets
E.GM-1 Recognizing that two- and three-dimensional shapes have particular attributes: Describe and compare objects and figures based
on geometric attributes; Compose, decompose, and draw figures based
on spatial reasoning and the properties and attributes of the shapes;
Apply concepts of symmetry.
M.GM-1 Apply reasoning using properties of two- and three-dimensional shapes to analyze, represent, and model geometric relationships: Classify objects based on attributes and properties
and solve problems using geometric relationships and properties;
Decompose figures into new figures and construct figures with given conditions;
Apply concepts of parallel and perpendicular.
H.GM-1 Explain solutions using geometric attributes and relationships in diverse contexts: Extend understanding of congruence and
similarity working with complex figures and situations;
Solve problems involving quadrilaterals and triangles;
Perform geometric constructions and use informal proofs to describe relationships and transformations.
17 © Hess, Karin K., (Ed.) December 2010. Learning Progressions Frameworks Designed for Use with the Common Core State Standards in Mathematics K-12. National Alternate
Assessment Center at the University of Kentucky and the National Center for the Improvement of Educational Assessment, Dover, N.H. (updated- v.3)
Strand 6: Data Analysis, Probability, and Statistics
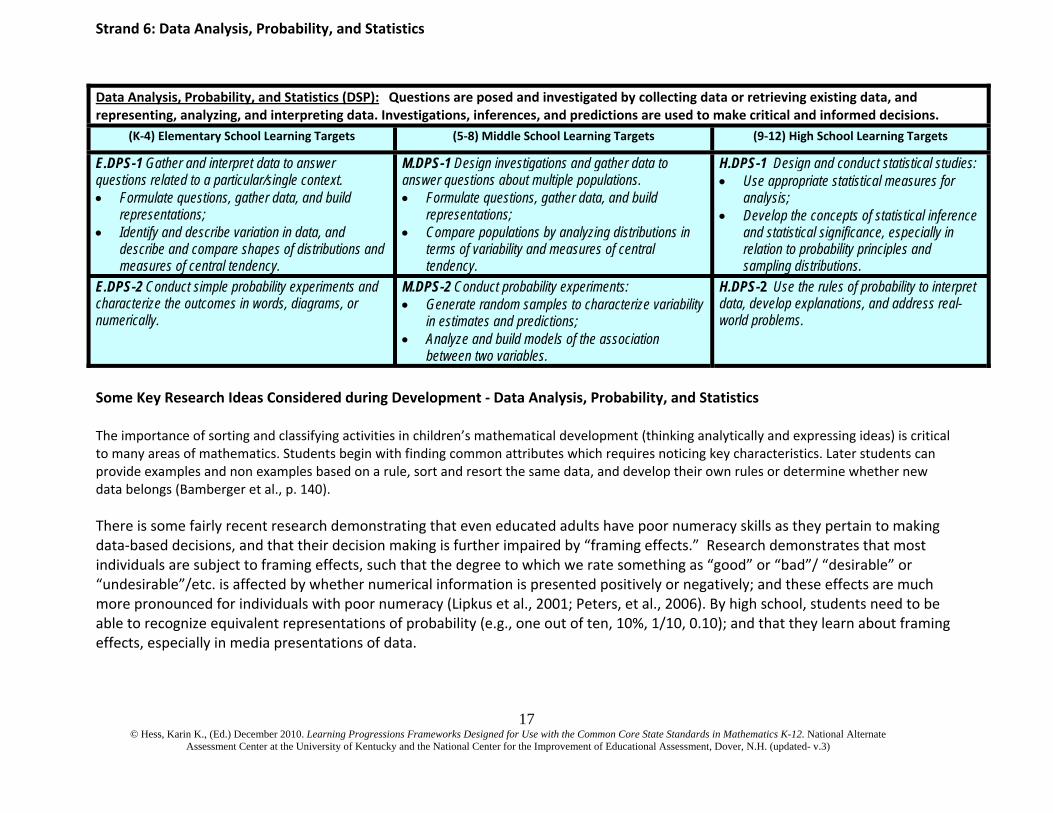
Some Key Research Ideas Considered during Development ‐ Data Analysis, Probability, and Statistics The importance of sorting and classifying activities in children’s mathematical development (thinking analytically and expressing ideas) is critical to many areas of mathematics. Students begin with finding common attributes which requires noticing key characteristics. Later students can provide examples and non examples based on a rule, sort and resort the same data, and develop their own rules or determine whether new data belongs (Bamberger et al., p. 140). There is some fairly recent research demonstrating that even educated adults have poor numeracy skills as they pertain to making data‐based decisions, and that their decision making is further impaired by “framing effects.” Research demonstrates that most individuals are subject to framing effects, such that the degree to which we rate something as “good” or “bad”/ “desirable” or “undesirable”/etc. is affected by whether numerical information is presented positively or negatively; and these effects are much more pronounced for individuals with poor numeracy (Lipkus et al., 2001; Peters, et al., 2006). By high school, students need to be able to recognize equivalent representations of probability (e.g., one out of ten, 10%, 1/10, 0.10); and that they learn about framing effects, especially in media presentations of data.
Data Analysis, Probability, and Statistics (DSP): Questions are posed and investigated by collecting data or retrieving existing data, and representing, analyzing, and interpreting data. Investigations, inferences, and predictions are used to make critical and informed decisions.
(K‐4) Elementary School Learning Targets (5‐8) Middle School Learning Targets (9‐12) High School Learning Targets
E.DPS-1 Gather and interpret data to answer questions related to a particular/single context. Formulate questions, gather data, and build
representations; Identify and describe variation in data, and
describe and compare shapes of distributions and measures of central tendency.
M.DPS-1 Design investigations and gather data to answer questions about multiple populations. Formulate questions, gather data, and build
representations; Compare populations by analyzing distributions in
terms of variability and measures of central tendency.
H.DPS-1 Design and conduct statistical studies: Use appropriate statistical measures for
analysis; Develop the concepts of statistical inference
and statistical significance, especially in relation to probability principles and sampling distributions.
E.DPS-2 Conduct simple probability experiments and characterize the outcomes in words, diagrams, or numerically.
M.DPS-2 Conduct probability experiments: Generate random samples to characterize variability
in estimates and predictions; Analyze and build models of the association
between two variables.
H.DPS-2 Use the rules of probability to interpret data, develop explanations, and address real-world problems.
18 © Hess, Karin K., (Ed.) December 2010. Learning Progressions Frameworks Designed for Use with the Common Core State Standards in Mathematics K-12. National Alternate
Assessment Center at the University of Kentucky and the National Center for the Improvement of Educational Assessment, Dover, N.H. (updated- v.3)
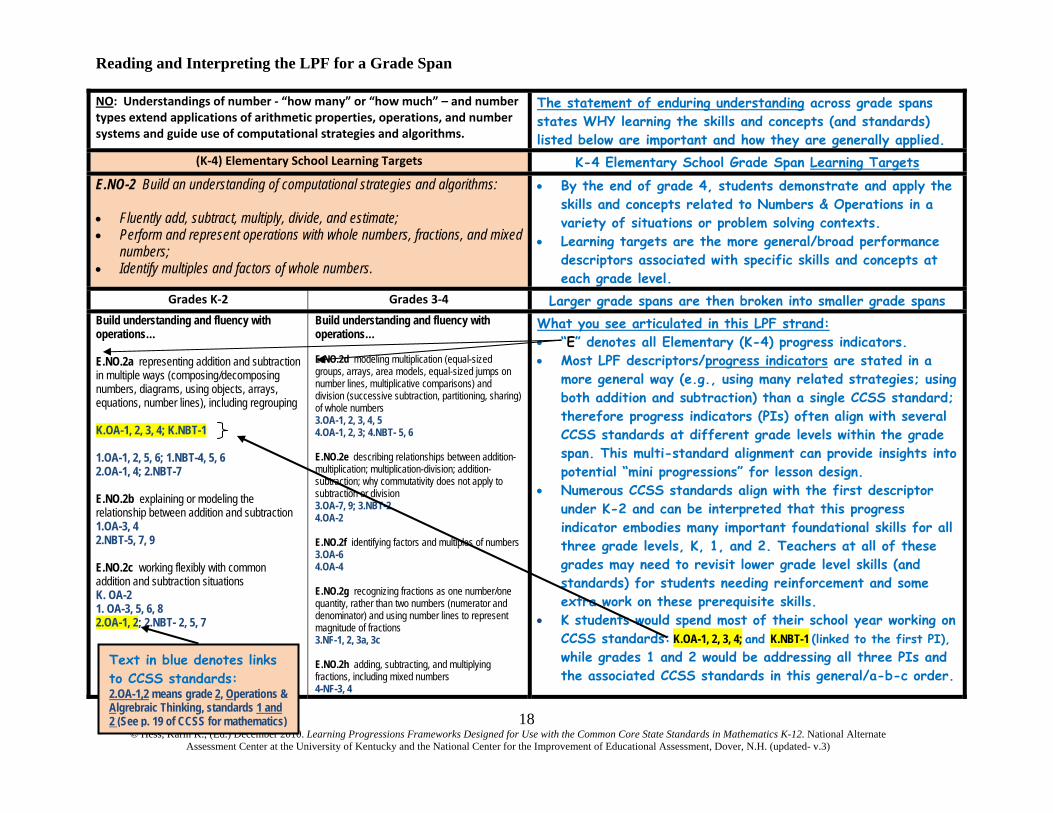
Reading and Interpreting the LPF for a Grade Span NO: Understandings of number ‐ “how many” or “how much” – and number types extend applications of arithmetic properties, operations, and number systems and guide use of computational strategies and algorithms.
The statement of enduring understanding across grade spans states WHY learning the skills and concepts (and standards) listed below are important and how they are generally applied.
(K‐4) Elementary School Learning Targets K-4 Elementary School Grade Span Learning Targets E.NO-2 Build an understanding of computational strategies and algorithms: Fluently add, subtract, multiply, divide, and estimate; Perform and represent operations with whole numbers, fractions, and mixed
numbers; Identify multiples and factors of whole numbers.
By the end of grade 4, students demonstrate and apply the skills and concepts related to Numbers & Operations in a variety of situations or problem solving contexts.
Learning targets are the more general/broad performance descriptors associated with specific skills and concepts at each grade level.
Grades K‐2 Grades 3‐4 Larger grade spans are then broken into smaller grade spans Build understanding and fluency with operations… E.NO.2a representing addition and subtraction in multiple ways (composing/decomposing numbers, diagrams, using objects, arrays, equations, number lines), including regrouping K.OA-1, 2, 3, 4; K.NBT-1 1.OA-1, 2, 5, 6; 1.NBT-4, 5, 6 2.OA-1, 4; 2.NBT-7 E.NO.2b explaining or modeling the relationship between addition and subtraction 1.OA-3, 4 2.NBT-5, 7, 9 E.NO.2c working flexibly with common addition and subtraction situations K. OA-2 1. OA-3, 5, 6, 8 2.OA-1, 2; 2.NBT- 2, 5, 7
Build understanding and fluency with operations… E.NO.2d modeling multiplication (equal-sized groups, arrays, area models, equal-sized jumps on number lines, multiplicative comparisons) and division (successive subtraction, partitioning, sharing) of whole numbers 3.OA-1, 2, 3, 4, 5 4.OA-1, 2, 3; 4.NBT- 5, 6 E.NO.2e describing relationships between addition-multiplication; multiplication-division; addition-subtraction; why commutativity does not apply to subtraction or division 3.OA-7, 9; 3.NBT-2 4.OA-2 E.NO.2f identifying factors and multiples of numbers 3.OA-6 4.OA-4 E.NO.2g recognizing fractions as one number/one quantity, rather than two numbers (numerator and denominator) and using number lines to represent magnitude of fractions 3.NF-1, 2, 3a, 3c E.NO.2h adding, subtracting, and multiplying fractions, including mixed numbers 4-NF-3, 4
What you see articulated in this LPF strand: “E” denotes all Elementary (K-4) progress indicators. Most LPF descriptors/progress indicators are stated in a
more general way (e.g., using many related strategies; using both addition and subtraction) than a single CCSS standard; therefore progress indicators (PIs) often align with several CCSS standards at different grade levels within the grade span. This multi-standard alignment can provide insights into potential “mini progressions” for lesson design.
Numerous CCSS standards align with the first descriptor under K-2 and can be interpreted that this progress indicator embodies many important foundational skills for all three grade levels, K, 1, and 2. Teachers at all of these grades may need to revisit lower grade level skills (and standards) for students needing reinforcement and some extra work on these prerequisite skills.
K students would spend most of their school year working on CCSS standards: K.OA-1, 2, 3, 4; and K.NBT-1 (linked to the first PI), while grades 1 and 2 would be addressing all three PIs and the associated CCSS standards in this general/a-b-c order.
Text in blue denotes links to CCSS standards: 2.OA-1,2 means grade 2, Operations & Algrebraic Thinking, standards 1 and 2 (See p. 19 of CCSS for mathematics)
19 © Hess, Karin K., (Ed.) December 2010. Learning Progressions Frameworks Designed for Use with the Common Core State Standards in Mathematics K-12. National Alternate
Assessment Center at the University of Kentucky and the National Center for the Improvement of Educational Assessment, Dover, N.H. (updated- v.3)
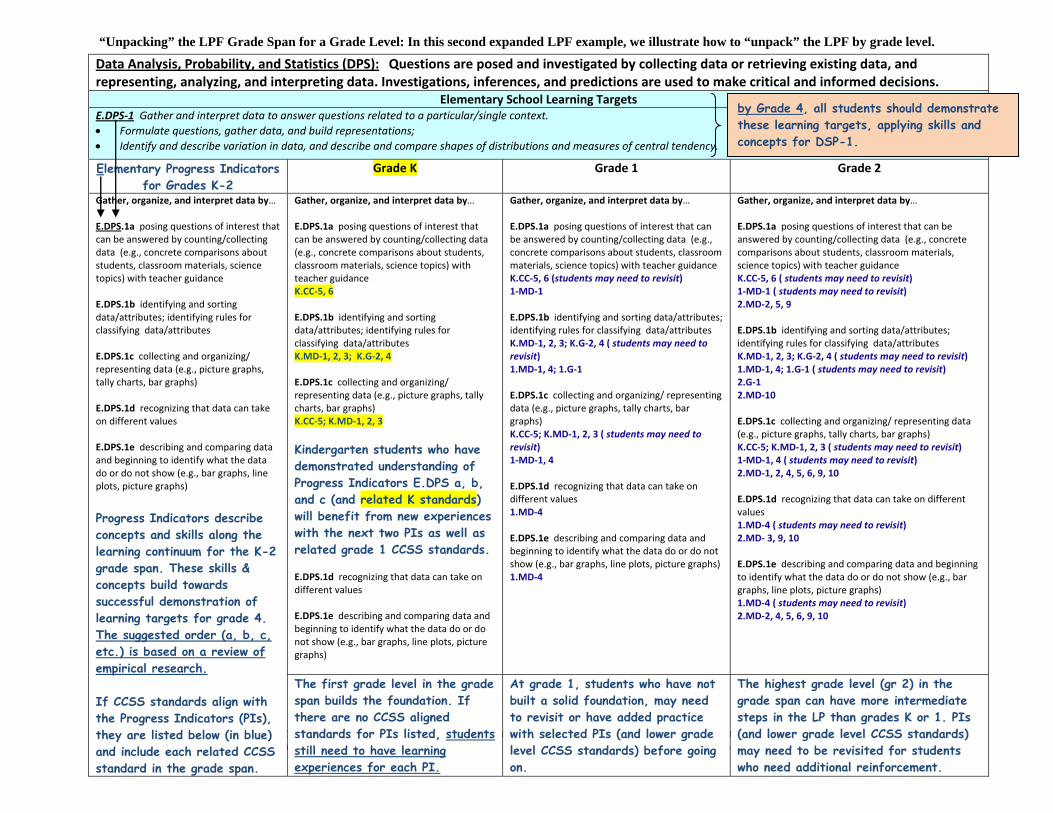
“Unpacking” the LPF Grade Span for a Grade Level: In this second expanded LPF example, we illustrate how to “unpack” the LPF by grade level.
Data Analysis, Probability, and Statistics (DPS): Questions are posed and investigated by collecting data or retrieving existing data, and representing, analyzing, and interpreting data. Investigations, inferences, and predictions are used to make critical and informed decisions.
Elementary School Learning Targets E.DPS‐1 Gather and interpret data to answer questions related to a particular/single context. Formulate questions, gather data, and build representations; Identify and describe variation in data, and describe and compare shapes of distributions and measures of central tendency.
Elementary Progress Indicators for Grades K-2
Grade K Grade 1 Grade 2
Gather, organize, and interpret data by… E.DPS.1a posing questions of interest that can be answered by counting/collecting data (e.g., concrete comparisons about students, classroom materials, science topics) with teacher guidance E.DPS.1b identifying and sorting data/attributes; identifying rules for classifying data/attributes E.DPS.1c collecting and organizing/ representing data (e.g., picture graphs, tally charts, bar graphs) E.DPS.1d recognizing that data can take on different values E.DPS.1e describing and comparing data and beginning to identify what the data do or do not show (e.g., bar graphs, line plots, picture graphs)
Progress Indicators describe concepts and skills along the learning continuum for the K-2 grade span. These skills & concepts build towards successful demonstration of learning targets for grade 4. The suggested order (a, b, c, etc.) is based on a review of empirical research. If CCSS standards align with the Progress Indicators (PIs), they are listed below (in blue) and include each related CCSS standard in the grade span.
Gather, organize, and interpret data by… E.DPS.1a posing questions of interest that can be answered by counting/collecting data (e.g., concrete comparisons about students, classroom materials, science topics) with teacher guidance K.CC‐5, 6 E.DPS.1b identifying and sorting data/attributes; identifying rules for classifying data/attributes K.MD‐1, 2, 3; K.G‐2, 4 E.DPS.1c collecting and organizing/ representing data (e.g., picture graphs, tally charts, bar graphs) K.CC‐5; K.MD‐1, 2, 3
Kindergarten students who have demonstrated understanding of Progress Indicators E.DPS a, b, and c (and related K standards) will benefit from new experiences with the next two PIs as well as related grade 1 CCSS standards. E.DPS.1d recognizing that data can take on different values E.DPS.1e describing and comparing data and beginning to identify what the data do or do not show (e.g., bar graphs, line plots, picture graphs)
Gather, organize, and interpret data by… E.DPS.1a posing questions of interest that can be answered by counting/collecting data (e.g., concrete comparisons about students, classroom materials, science topics) with teacher guidance K.CC‐5, 6 (students may need to revisit) 1‐MD‐1 E.DPS.1b identifying and sorting data/attributes; identifying rules for classifying data/attributes K.MD‐1, 2, 3; K.G‐2, 4 ( students may need to revisit) 1.MD‐1, 4; 1.G‐1 E.DPS.1c collecting and organizing/ representing data (e.g., picture graphs, tally charts, bar graphs) K.CC‐5; K.MD‐1, 2, 3 ( students may need to revisit) 1‐MD‐1, 4 E.DPS.1d recognizing that data can take on different values 1.MD‐4 E.DPS.1e describing and comparing data and beginning to identify what the data do or do not show (e.g., bar graphs, line plots, picture graphs) 1.MD‐4
Gather, organize, and interpret data by… E.DPS.1a posing questions of interest that can be answered by counting/collecting data (e.g., concrete comparisons about students, classroom materials, science topics) with teacher guidance K.CC‐5, 6 ( students may need to revisit) 1‐MD‐1 ( students may need to revisit) 2.MD‐2, 5, 9 E.DPS.1b identifying and sorting data/attributes; identifying rules for classifying data/attributes K.MD‐1, 2, 3; K.G‐2, 4 ( students may need to revisit) 1.MD‐1, 4; 1.G‐1 ( students may need to revisit) 2.G‐1 2.MD‐10 E.DPS.1c collecting and organizing/ representing data (e.g., picture graphs, tally charts, bar graphs) K.CC‐5; K.MD‐1, 2, 3 ( students may need to revisit) 1‐MD‐1, 4 ( students may need to revisit) 2.MD‐1, 2, 4, 5, 6, 9, 10 E.DPS.1d recognizing that data can take on different values 1.MD‐4 ( students may need to revisit) 2.MD‐ 3, 9, 10 E.DPS.1e describing and comparing data and beginning to identify what the data do or do not show (e.g., bar graphs, line plots, picture graphs) 1.MD‐4 ( students may need to revisit) 2.MD‐2, 4, 5, 6, 9, 10
The first grade level in the grade span builds the foundation. If there are no CCSS aligned standards for PIs listed, students still need to have learning experiences for each PI.
At grade 1, students who have not built a solid foundation, may need to revisit or have added practice with selected PIs (and lower grade level CCSS standards) before going on.
The highest grade level (gr 2) in the grade span can have more intermediate steps in the LP than grades K or 1. PIs (and lower grade level CCSS standards) may need to be revisited for students who need additional reinforcement.
by Grade 4, all students should demonstrate these learning targets, applying skills and concepts for DSP-1.
20 © Hess, Karin K., (Ed.) December 2010. Learning Progressions Frameworks Designed for Use with the Common Core State Standards in Mathematics K-12. National Alternate
Assessment Center at the University of Kentucky and the National Center for the Improvement of Educational Assessment, Dover, N.H. (updated- v.3)
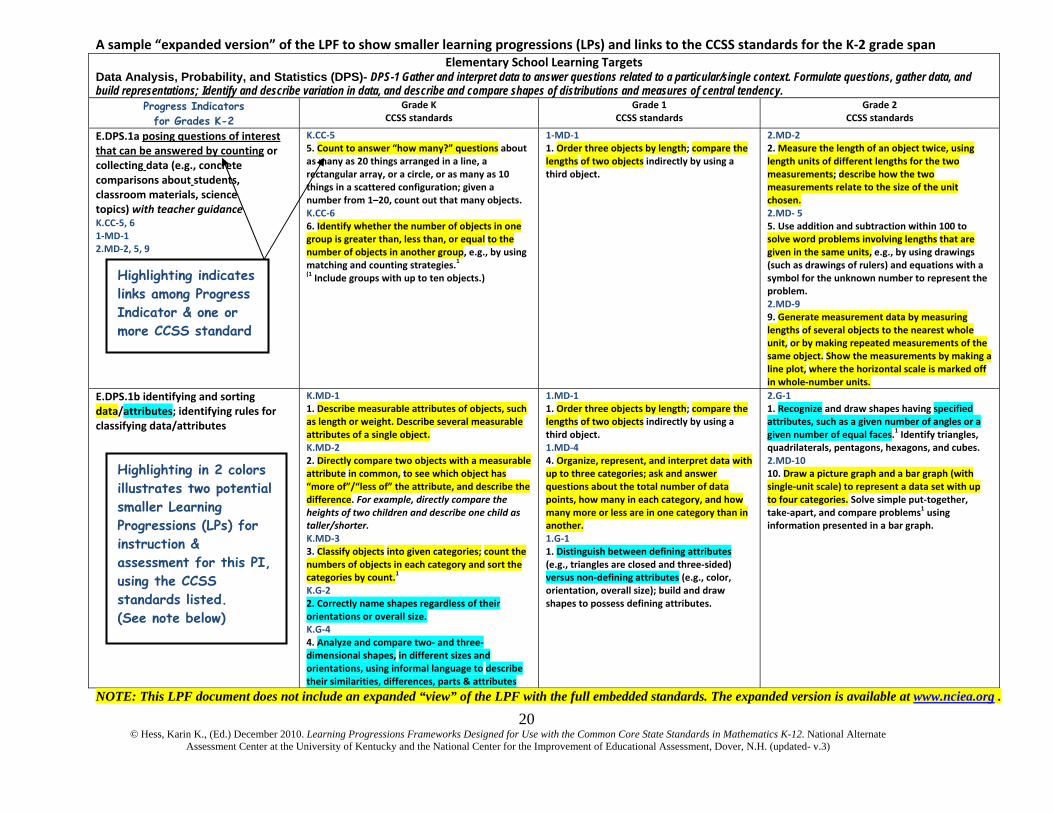
A sample “expanded version” of the LPF to show smaller learning progressions (LPs) and links to the CCSS standards for the K‐2 grade span
Elementary School Learning Targets Data Analysis, Probability, and Statistics (DPS)- DPS-1 Gather and interpret data to answer questions related to a particular/single context. Formulate questions, gather data, and build representations; Identify and describe variation in data, and describe and compare shapes of distributions and measures of central tendency.
Progress Indicators for Grades K-2
Grade KCCSS standards
Grade 1CCSS standards
Grade 2CCSS standards
E.DPS.1a posing questions of interest that can be answered by counting or collecting data (e.g., concrete comparisons about students, classroom materials, science topics) with teacher guidance K.CC‐5, 6 1‐MD‐1 2.MD‐2, 5, 9
K.CC‐55. Count to answer “how many?” questions about as many as 20 things arranged in a line, a rectangular array, or a circle, or as many as 10 things in a scattered configuration; given a number from 1–20, count out that many objects. K.CC‐6 6. Identify whether the number of objects in one group is greater than, less than, or equal to the number of objects in another group, e.g., by using matching and counting strategies.1 (1 Include groups with up to ten objects.)
1‐MD‐11. Order three objects by length; compare the lengths of two objects indirectly by using a third object.
2.MD‐22. Measure the length of an object twice, using length units of different lengths for the two measurements; describe how the two measurements relate to the size of the unit chosen. 2.MD‐ 5 5. Use addition and subtraction within 100 to solve word problems involving lengths that are given in the same units, e.g., by using drawings (such as drawings of rulers) and equations with a symbol for the unknown number to represent the problem. 2.MD‐9 9. Generate measurement data by measuring lengths of several objects to the nearest whole unit, or by making repeated measurements of the same object. Show the measurements by making a line plot, where the horizontal scale is marked off in whole‐number units.
E.DPS.1b identifying and sorting data/attributes; identifying rules for classifying data/attributes
K.MD‐11. Describe measurable attributes of objects, such as length or weight. Describe several measurable attributes of a single object. K.MD‐2 2. Directly compare two objects with a measurable attribute in common, to see which object has “more of”/“less of” the attribute, and describe the difference. For example, directly compare the heights of two children and describe one child as taller/shorter. K.MD‐3 3. Classify objects into given categories; count the numbers of objects in each category and sort the categories by count.1 K.G‐2 2. Correctly name shapes regardless of their orientations or overall size. K.G‐4 4. Analyze and compare two‐ and three‐dimensional shapes, in different sizes and orientations, using informal language to describe their similarities, differences, parts & attributes
1.MD‐11. Order three objects by length; compare the lengths of two objects indirectly by using a third object. 1.MD‐4 4. Organize, represent, and interpret data with up to three categories; ask and answer questions about the total number of data points, how many in each category, and how many more or less are in one category than in another. 1.G‐1 1. Distinguish between defining attributes (e.g., triangles are closed and three‐sided) versus non‐defining attributes (e.g., color, orientation, overall size); build and draw shapes to possess defining attributes.
2.G‐11. Recognize and draw shapes having specified attributes, such as a given number of angles or a given number of equal faces.1 Identify triangles, quadrilaterals, pentagons, hexagons, and cubes. 2.MD‐10 10. Draw a picture graph and a bar graph (with single‐unit scale) to represent a data set with up to four categories. Solve simple put‐together, take‐apart, and compare problems1 using information presented in a bar graph.
NOTE: This LPF document does not include an expanded “view” of the LPF with the full embedded standards. The expanded version is available at www.nciea.org .
Highlighting indicates links among Progress Indicator & one or more CCSS standard
Highlighting in 2 colors illustrates two potential smaller Learning Progressions (LPs) for instruction & assessment for this PI, using the CCSS standards listed. (See note below)
21 © Hess, Karin K., (Ed.) December 2010. Learning Progressions Frameworks Designed for Use with the Common Core State Standards in Mathematics K-12. National Alternate
Assessment Center at the University of Kentucky and the National Center for the Improvement of Educational Assessment, Dover, N.H. (updated- v.3)
Learning Progressions Frameworks for Mathematics K-12
22 © Hess, Karin K., (Ed.) December 2010. Learning Progressions Frameworks Designed for Use with the Common Core State Standards in Mathematics K-12. National Alternate
Assessment Center at the University of Kentucky and the National Center for the Improvement of Educational Assessment, Dover, N.H. (updated- v.3)
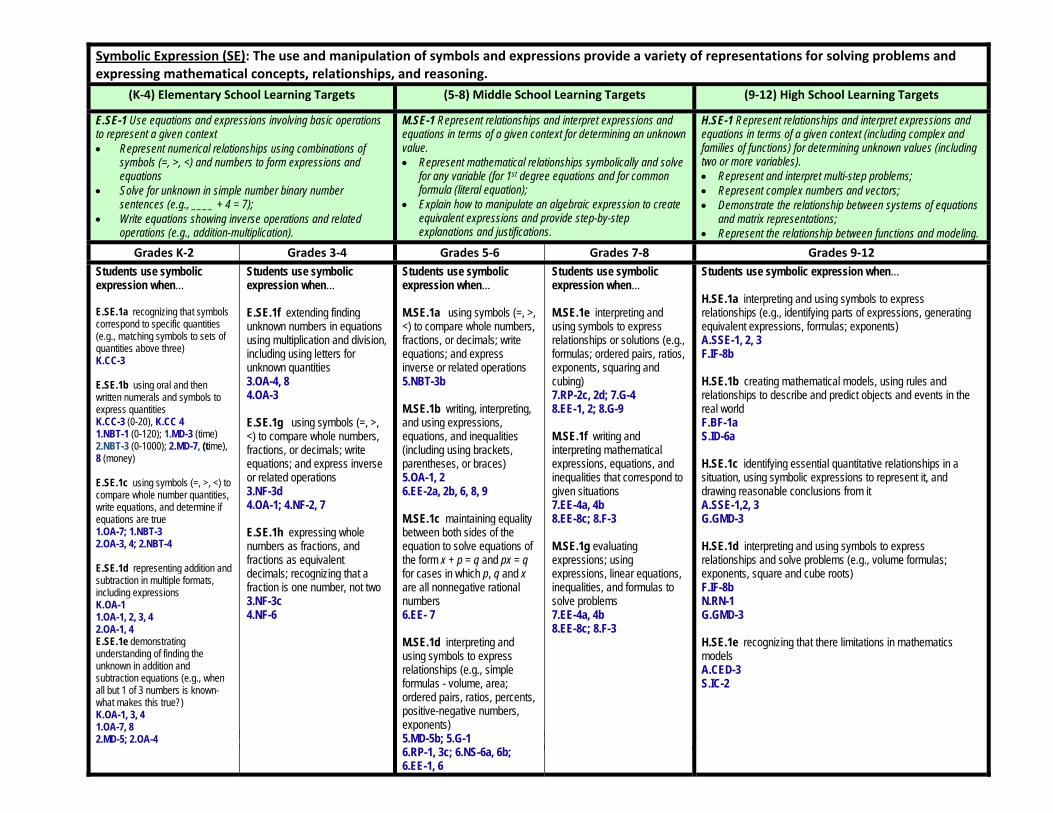
Symbolic Expression (SE): The use and manipulation of symbols and expressions provide a variety of representations for solving problems and expressing mathematical concepts, relationships, and reasoning.
(K‐4) Elementary School Learning Targets (5‐8) Middle School Learning Targets (9‐12) High School Learning Targets
E.SE-1 Use equations and expressions involving basic operations to represent a given context Represent numerical relationships using combinations of
symbols (=, >, <) and numbers to form expressions and equations
Solve for unknown in simple number binary number sentences (e.g., ____ + 4 = 7);
Write equations showing inverse operations and related operations (e.g., addition-multiplication).
M.SE-1 Represent relationships and interpret expressions and equations in terms of a given context for determining an unknown value. Represent mathematical relationships symbolically and solve
for any variable (for 1st degree equations and for common formula (literal equation);
Explain how to manipulate an algebraic expression to create equivalent expressions and provide step-by-step explanations and justifications.
H.SE-1 Represent relationships and interpret expressions and equations in terms of a given context (including complex and families of functions) for determining unknown values (including two or more variables). Represent and interpret multi-step problems; Represent complex numbers and vectors; Demonstrate the relationship between systems of equations
and matrix representations; Represent the relationship between functions and modeling.
Grades K‐2 Grades 3‐4 Grades 5‐6 Grades 7‐8 Grades 9‐12Students use symbolic expression when… E.SE.1a recognizing that symbols correspond to specific quantities (e.g., matching symbols to sets of quantities above three) K.CC-3 E.SE.1b using oral and then written numerals and symbols to express quantities K.CC-3 (0-20), K.CC 4 1.NBT-1 (0-120); 1.MD-3 (time) 2.NBT-3 (0-1000); 2.MD-7, (time), 8 (money) E.SE.1c using symbols (=, >, <) to compare whole number quantities, write equations, and determine if equations are true 1.OA-7; 1.NBT-3 2.OA-3, 4; 2.NBT-4 E.SE.1d representing addition and subtraction in multiple formats, including expressions K.OA-1 1.OA-1, 2, 3, 4 2.OA-1, 4 E.SE.1e demonstrating understanding of finding the unknown in addition and subtraction equations (e.g., when all but 1 of 3 numbers is known- what makes this true?) K.OA-1, 3, 4 1.OA-7, 8 2.MD-5; 2.OA-4
Students use symbolic expression when… E.SE.1f extending finding unknown numbers in equations using multiplication and division, including using letters for unknown quantities 3.OA-4, 8 4.OA-3 E.SE.1g using symbols (=, >, <) to compare whole numbers, fractions, or decimals; write equations; and express inverse or related operations 3.NF-3d 4.OA-1; 4.NF-2, 7 E.SE.1h expressing whole numbers as fractions, and fractions as equivalent decimals; recognizing that a fraction is one number, not two 3.NF-3c 4.NF-6
Students use symbolic expression when… M.SE.1a using symbols (=, >, <) to compare whole numbers, fractions, or decimals; write equations; and express inverse or related operations 5.NBT-3b M.SE.1b writing, interpreting, and using expressions, equations, and inequalities (including using brackets, parentheses, or braces) 5.OA-1, 2 6.EE-2a, 2b, 6, 8, 9 M.SE.1c maintaining equality between both sides of the equation to solve equations of the form x + p = q and px = q for cases in which p, q and x are all nonnegative rational numbers 6.EE- 7 M.SE.1d interpreting and using symbols to express relationships (e.g., simple formulas - volume, area; ordered pairs, ratios, percents, positive-negative numbers, exponents) 5.MD-5b; 5.G-1 6.RP-1, 3c; 6.NS-6a, 6b; 6.EE-1, 6
Students use symbolic expression when… M.SE.1e interpreting and using symbols to express relationships or solutions (e.g., formulas; ordered pairs, ratios, exponents, squaring and cubing) 7.RP-2c, 2d; 7.G-4 8.EE-1, 2; 8.G-9 M.SE.1f writing and interpreting mathematical expressions, equations, and inequalities that correspond to given situations 7.EE-4a, 4b 8.EE-8c; 8.F-3 M.SE.1g evaluating expressions; using expressions, linear equations, inequalities, and formulas to solve problems 7.EE-4a, 4b 8.EE-8c; 8.F-3
Students use symbolic expression when… H.SE.1a interpreting and using symbols to express relationships (e.g., identifying parts of expressions, generating equivalent expressions, formulas; exponents) A.SSE-1, 2, 3 F.IF-8b H.SE.1b creating mathematical models, using rules and relationships to describe and predict objects and events in the real world F.BF-1a S.ID-6a H.SE.1c identifying essential quantitative relationships in a situation, using symbolic expressions to represent it, and drawing reasonable conclusions from it A.SSE-1,2, 3 G.GMD-3 H.SE.1d interpreting and using symbols to express relationships and solve problems (e.g., volume formulas; exponents, square and cube roots) F.IF-8b N.RN-1 G.GMD-3 H.SE.1e recognizing that there limitations in mathematics models A.CED-3 S.IC-2
23 © Hess, Karin K., (Ed.) December 2010. Learning Progressions Frameworks Designed for Use with the Common Core State Standards in Mathematics K-12. National Alternate
Assessment Center at the University of Kentucky and the National Center for the Improvement of Educational Assessment, Dover, N.H. (updated- v.3)
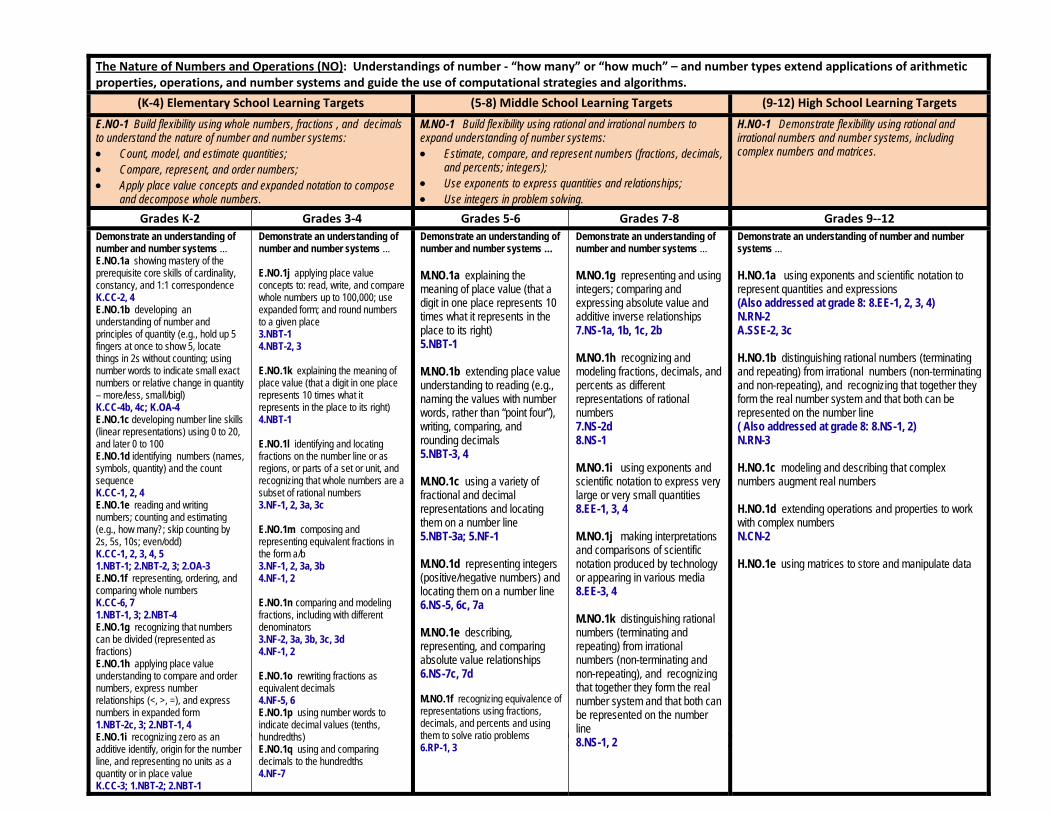
The Nature of Numbers and Operations (NO): Understandings of number ‐ “how many” or “how much” – and number types extend applications of arithmetic properties, operations, and number systems and guide the use of computational strategies and algorithms.
(K‐4) Elementary School Learning Targets (5‐8) Middle School Learning Targets (9‐12) High School Learning Targets
E.NO-1 Build flexibility using whole numbers, fractions , and decimals to understand the nature of number and number systems: Count, model, and estimate quantities; Compare, represent, and order numbers; Apply place value concepts and expanded notation to compose
and decompose whole numbers.
M.NO-1 Build flexibility using rational and irrational numbers to expand understanding of number systems: Estimate, compare, and represent numbers (fractions, decimals,
and percents; integers); Use exponents to express quantities and relationships; Use integers in problem solving.
H.NO-1 Demonstrate flexibility using rational and irrational numbers and number systems, including complex numbers and matrices.
Grades K‐2 Grades 3‐4 Grades 5‐6 Grades 7‐8 Grades 9‐‐12Demonstrate an understanding of number and number systems … E.NO.1a showing mastery of the prerequisite core skills of cardinality, constancy, and 1:1 correspondence K.CC-2, 4 E.NO.1b developing an understanding of number and principles of quantity (e.g., hold up 5 fingers at once to show 5, locate things in 2s without counting; using number words to indicate small exact numbers or relative change in quantity – more/less, small/bigl) K.CC-4b, 4c; K.OA-4 E.NO.1c developing number line skills (linear representations) using 0 to 20, and later 0 to 100 E.NO.1d identifying numbers (names, symbols, quantity) and the count sequence K.CC-1, 2, 4 E.NO.1e reading and writing numbers; counting and estimating (e.g., how many?; skip counting by 2s, 5s, 10s; even/odd) K.CC-1, 2, 3, 4, 5 1.NBT-1; 2.NBT-2, 3; 2.OA-3 E.NO.1f representing, ordering, and comparing whole numbers K.CC-6, 7 1.NBT-1, 3; 2.NBT-4 E.NO.1g recognizing that numbers can be divided (represented as fractions) E.NO.1h applying place value understanding to compare and order numbers, express number relationships (<, >, =), and express numbers in expanded form 1.NBT-2c, 3; 2.NBT-1, 4 E.NO.1i recognizing zero as an additive identify, origin for the number line, and representing no units as a quantity or in place value K.CC-3; 1.NBT-2; 2.NBT-1
Demonstrate an understanding of number and number systems … E.NO.1j applying place value concepts to: read, write, and compare whole numbers up to 100,000; use expanded form; and round numbers to a given place 3.NBT-1 4.NBT-2, 3 E.NO.1k explaining the meaning of place value (that a digit in one place represents 10 times what it represents in the place to its right) 4.NBT-1 E.NO.1l identifying and locating fractions on the number line or as regions, or parts of a set or unit, and recognizing that whole numbers are a subset of rational numbers 3.NF-1, 2, 3a, 3c E.NO.1m composing and representing equivalent fractions in the form a/b 3.NF-1, 2, 3a, 3b 4.NF-1, 2 E.NO.1n comparing and modeling fractions, including with different denominators 3.NF-2, 3a, 3b, 3c, 3d 4.NF-1, 2 E.NO.1o rewriting fractions as equivalent decimals 4.NF-5, 6 E.NO.1p using number words to indicate decimal values (tenths, hundredths) E.NO.1q using and comparing decimals to the hundredths 4.NF-7
Demonstrate an understanding of number and number systems … M.NO.1a explaining the meaning of place value (that a digit in one place represents 10 times what it represents in the place to its right) 5.NBT-1 M.NO.1b extending place value understanding to reading (e.g., naming the values with number words, rather than “point four”), writing, comparing, and rounding decimals 5.NBT-3, 4 M.NO.1c using a variety of fractional and decimal representations and locating them on a number line 5.NBT-3a; 5.NF-1 M.NO.1d representing integers (positive/negative numbers) and locating them on a number line 6.NS-5, 6c, 7a M.NO.1e describing, representing, and comparing absolute value relationships 6.NS-7c, 7d M.NO.1f recognizing equivalence of representations using fractions, decimals, and percents and using them to solve ratio problems 6.RP-1, 3
Demonstrate an understanding of number and number systems … M.NO.1g representing and using integers; comparing and expressing absolute value and additive inverse relationships 7.NS-1a, 1b, 1c, 2b M.NO.1h recognizing and modeling fractions, decimals, and percents as different representations of rational numbers 7.NS-2d 8.NS-1 M.NO.1i using exponents and scientific notation to express very large or very small quantities 8.EE-1, 3, 4 M.NO.1j making interpretations and comparisons of scientific notation produced by technology or appearing in various media 8.EE-3, 4 M.NO.1k distinguishing rational numbers (terminating and repeating) from irrational numbers (non-terminating and non-repeating), and recognizing that together they form the real number system and that both can be represented on the number line 8.NS-1, 2
Demonstrate an understanding of number and number systems … H.NO.1a using exponents and scientific notation to represent quantities and expressions (Also addressed at grade 8: 8.EE-1, 2, 3, 4) N.RN-2 A.SSE-2, 3c H.NO.1b distinguishing rational numbers (terminating and repeating) from irrational numbers (non-terminating and non-repeating), and recognizing that together they form the real number system and that both can be represented on the number line ( Also addressed at grade 8: 8.NS-1, 2) N.RN-3 H.NO.1c modeling and describing that complex numbers augment real numbers H.NO.1d extending operations and properties to work with complex numbers N.CN-2 H.NO.1e using matrices to store and manipulate data
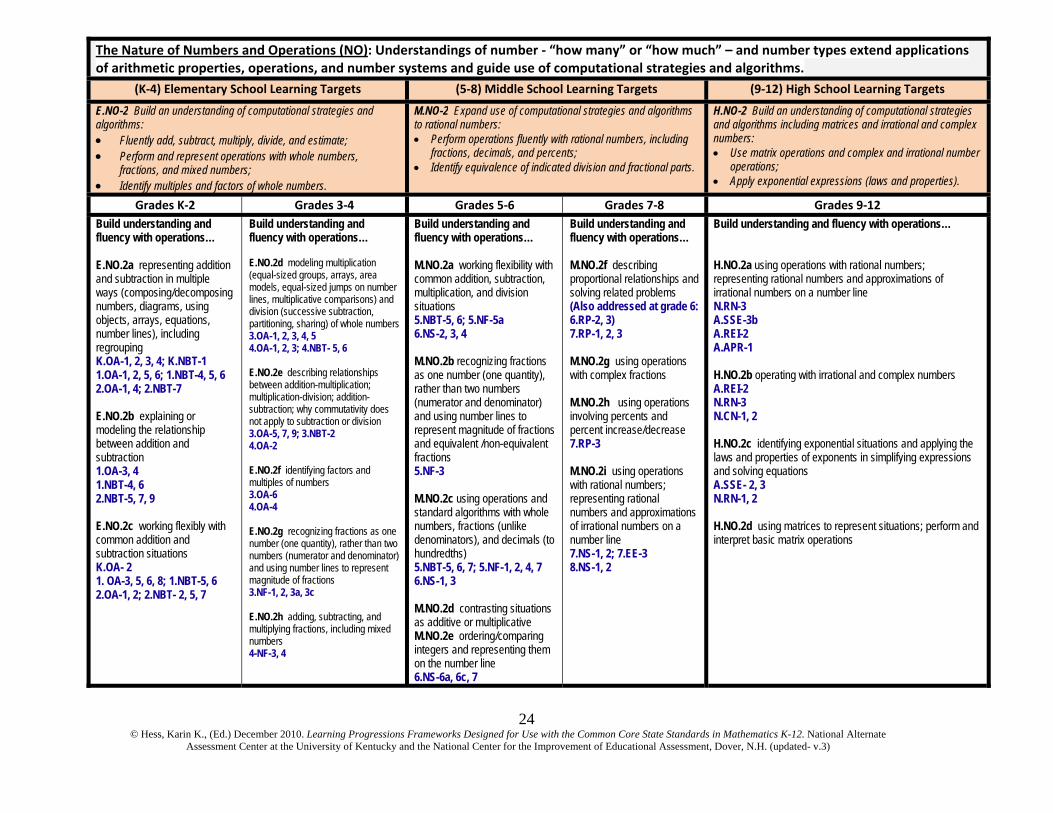
24 © Hess, Karin K., (Ed.) December 2010. Learning Progressions Frameworks Designed for Use with the Common Core State Standards in Mathematics K-12. National Alternate
Assessment Center at the University of Kentucky and the National Center for the Improvement of Educational Assessment, Dover, N.H. (updated- v.3)
The Nature of Numbers and Operations (NO): Understandings of number ‐ “how many” or “how much” – and number types extend applications of arithmetic properties, operations, and number systems and guide use of computational strategies and algorithms.
(K‐4) Elementary School Learning Targets (5‐8) Middle School Learning Targets (9‐12) High School Learning Targets
E.NO-2 Build an understanding of computational strategies and algorithms: Fluently add, subtract, multiply, divide, and estimate; Perform and represent operations with whole numbers,
fractions, and mixed numbers; Identify multiples and factors of whole numbers.
M.NO-2 Expand use of computational strategies and algorithms to rational numbers: Perform operations fluently with rational numbers, including
fractions, decimals, and percents; Identify equivalence of indicated division and fractional parts.
H.NO-2 Build an understanding of computational strategies and algorithms including matrices and irrational and complex numbers: Use matrix operations and complex and irrational number
operations; Apply exponential expressions (laws and properties).
Grades K‐2 Grades 3‐4 Grades 5‐6 Grades 7‐8 Grades 9‐12Build understanding and fluency with operations… E.NO.2a representing addition and subtraction in multiple ways (composing/decomposing numbers, diagrams, using objects, arrays, equations, number lines), including regrouping K.OA-1, 2, 3, 4; K.NBT-1 1.OA-1, 2, 5, 6; 1.NBT-4, 5, 6 2.OA-1, 4; 2.NBT-7 E.NO.2b explaining or modeling the relationship between addition and subtraction 1.OA-3, 4 1.NBT-4, 6 2.NBT-5, 7, 9 E.NO.2c working flexibly with common addition and subtraction situations K.OA- 2 1. OA-3, 5, 6, 8; 1.NBT-5, 6 2.OA-1, 2; 2.NBT- 2, 5, 7
Build understanding and fluency with operations… E.NO.2d modeling multiplication (equal-sized groups, arrays, area models, equal-sized jumps on number lines, multiplicative comparisons) and division (successive subtraction, partitioning, sharing) of whole numbers 3.OA-1, 2, 3, 4, 5 4.OA-1, 2, 3; 4.NBT- 5, 6 E.NO.2e describing relationships between addition-multiplication; multiplication-division; addition-subtraction; why commutativity does not apply to subtraction or division 3.OA-5, 7, 9; 3.NBT-2 4.OA-2 E.NO.2f identifying factors and multiples of numbers 3.OA-6 4.OA-4 E.NO.2g recognizing fractions as one number (one quantity), rather than two numbers (numerator and denominator) and using number lines to represent magnitude of fractions 3.NF-1, 2, 3a, 3c E.NO.2h adding, subtracting, and multiplying fractions, including mixed numbers 4-NF-3, 4
Build understanding and fluency with operations… M.NO.2a working flexibility with common addition, subtraction, multiplication, and division situations 5.NBT-5, 6; 5.NF-5a 6.NS-2, 3, 4 M.NO.2b recognizing fractions as one number (one quantity), rather than two numbers (numerator and denominator) and using number lines to represent magnitude of fractions and equivalent /non-equivalent fractions 5.NF-3 M.NO.2c using operations and standard algorithms with whole numbers, fractions (unlike denominators), and decimals (to hundredths) 5.NBT-5, 6, 7; 5.NF-1, 2, 4, 7 6.NS-1, 3 M.NO.2d contrasting situations as additive or multiplicative M.NO.2e ordering/comparing integers and representing them on the number line 6.NS-6a, 6c, 7
Build understanding and fluency with operations… M.NO.2f describing proportional relationships and solving related problems (Also addressed at grade 6: 6.RP-2, 3) 7.RP-1, 2, 3 M.NO.2g using operations with complex fractions M.NO.2h using operations involving percents and percent increase/decrease 7.RP-3 M.NO.2i using operations with rational numbers; representing rational numbers and approximations of irrational numbers on a number line 7.NS-1, 2; 7.EE-3 8.NS-1, 2
Build understanding and fluency with operations… H.NO.2a using operations with rational numbers; representing rational numbers and approximations of irrational numbers on a number line N.RN-3 A.SSE-3b A.REI-2 A.APR-1 H.NO.2b operating with irrational and complex numbers A.REI-2 N.RN-3 N.CN-1, 2 H.NO.2c identifying exponential situations and applying the laws and properties of exponents in simplifying expressions and solving equations A.SSE- 2, 3 N.RN-1, 2 H.NO.2d using matrices to represent situations; perform and interpret basic matrix operations
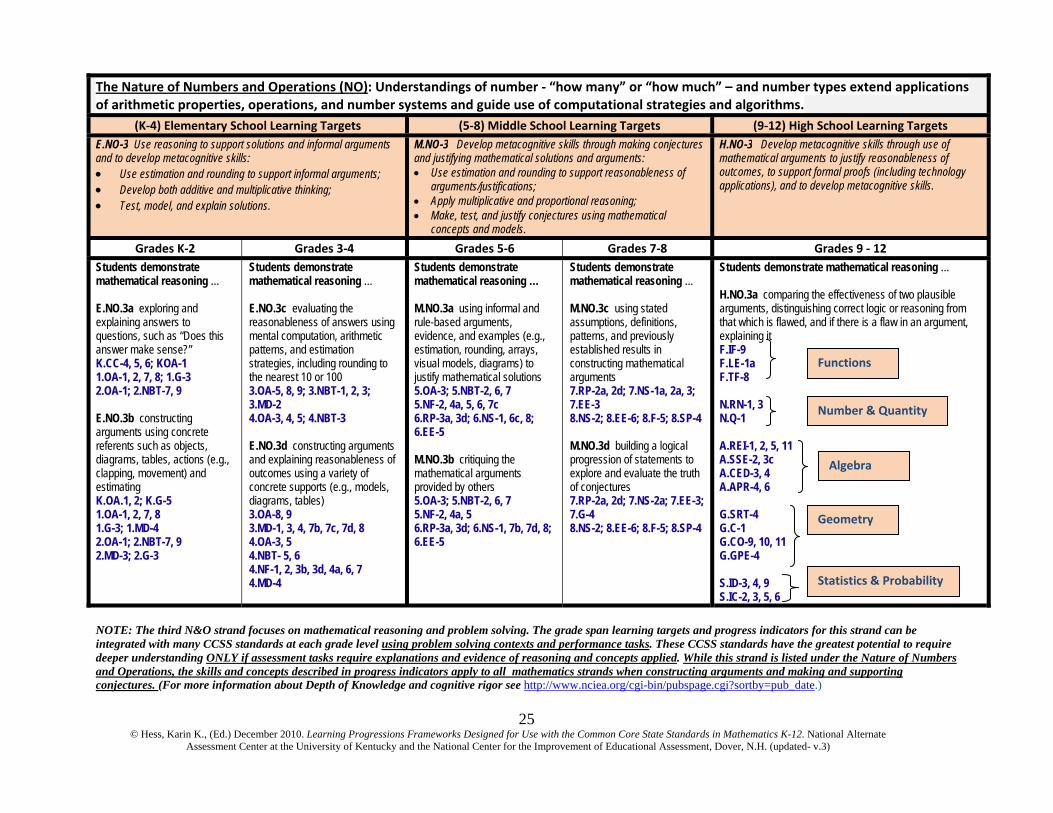
25 © Hess, Karin K., (Ed.) December 2010. Learning Progressions Frameworks Designed for Use with the Common Core State Standards in Mathematics K-12. National Alternate
Assessment Center at the University of Kentucky and the National Center for the Improvement of Educational Assessment, Dover, N.H. (updated- v.3)
The Nature of Numbers and Operations (NO): Understandings of number ‐ “how many” or “how much” – and number types extend applications of arithmetic properties, operations, and number systems and guide use of computational strategies and algorithms.
(K‐4) Elementary School Learning Targets (5‐8) Middle School Learning Targets (9‐12) High School Learning TargetsE.NO-3 Use reasoning to support solutions and informal arguments and to develop metacognitive skills: Use estimation and rounding to support informal arguments; Develop both additive and multiplicative thinking; Test, model, and explain solutions.
M.NO-3 Develop metacognitive skills through making conjectures and justifying mathematical solutions and arguments: Use estimation and rounding to support reasonableness of
arguments/justifications; Apply multiplicative and proportional reasoning; Make, test, and justify conjectures using mathematical
concepts and models.
H.NO-3 Develop metacognitive skills through use of mathematical arguments to justify reasonableness of outcomes, to support formal proofs (including technology applications), and to develop metacognitive skills.
Grades K‐2 Grades 3‐4 Grades 5‐6 Grades 7‐8 Grades 9 ‐ 12Students demonstrate mathematical reasoning … E.NO.3a exploring and explaining answers to questions, such as “Does this answer make sense?” K.CC-4, 5, 6; KOA-1 1.OA-1, 2, 7, 8; 1.G-3 2.OA-1; 2.NBT-7, 9 E.NO.3b constructing arguments using concrete referents such as objects, diagrams, tables, actions (e.g., clapping, movement) and estimating K.OA.1, 2; K.G-5 1.OA-1, 2, 7, 8 1.G-3; 1.MD-4 2.OA-1; 2.NBT-7, 9 2.MD-3; 2.G-3
Students demonstrate mathematical reasoning … E.NO.3c evaluating the reasonableness of answers using mental computation, arithmetic patterns, and estimation strategies, including rounding to the nearest 10 or 100 3.OA-5, 8, 9; 3.NBT-1, 2, 3; 3.MD-2 4.OA-3, 4, 5; 4.NBT-3 E.NO.3d constructing arguments and explaining reasonableness of outcomes using a variety of concrete supports (e.g., models, diagrams, tables) 3.OA-8, 9 3.MD-1, 3, 4, 7b, 7c, 7d, 8 4.OA-3, 5 4.NBT- 5, 6 4.NF-1, 2, 3b, 3d, 4a, 6, 7 4.MD-4
Students demonstrate mathematical reasoning …
M.NO.3a using informal and rule-based arguments, evidence, and examples (e.g., estimation, rounding, arrays, visual models, diagrams) to justify mathematical solutions 5.OA-3; 5.NBT-2, 6, 7 5.NF-2, 4a, 5, 6, 7c 6.RP-3a, 3d; 6.NS-1, 6c, 8; 6.EE-5 M.NO.3b critiquing the mathematical arguments provided by others 5.OA-3; 5.NBT-2, 6, 7 5.NF-2, 4a, 5 6.RP-3a, 3d; 6.NS-1, 7b, 7d, 8; 6.EE-5
Students demonstrate mathematical reasoning …
M.NO.3c using stated assumptions, definitions, patterns, and previously established results in constructing mathematical arguments 7.RP-2a, 2d; 7.NS-1a, 2a, 3; 7.EE-3 8.NS-2; 8.EE-6; 8.F-5; 8.SP-4 M.NO.3d building a logical progression of statements to explore and evaluate the truth of conjectures 7.RP-2a, 2d; 7.NS-2a; 7.EE-3; 7.G-4 8.NS-2; 8.EE-6; 8.F-5; 8.SP-4
Students demonstrate mathematical reasoning … H.NO.3a comparing the effectiveness of two plausible arguments, distinguishing correct logic or reasoning from that which is flawed, and if there is a flaw in an argument, explaining it F.IF-9 F.LE-1a F.TF-8 N.RN-1, 3 N.Q-1 A.REI-1, 2, 5, 11 A.SSE-2, 3c A.CED-3, 4 A.APR-4, 6 G.SRT-4 G.C-1 G.CO-9, 10, 11 G.GPE-4 S.ID-3, 4, 9 S.IC-2, 3, 5, 6
NOTE: The third N&O strand focuses on mathematical reasoning and problem solving. The grade span learning targets and progress indicators for this strand can be integrated with many CCSS standards at each grade level using problem solving contexts and performance tasks. These CCSS standards have the greatest potential to require deeper understanding ONLY if assessment tasks require explanations and evidence of reasoning and concepts applied. While this strand is listed under the Nature of Numbers and Operations, the skills and concepts described in progress indicators apply to all mathematics strands when constructing arguments and making and supporting conjectures. (For more information about Depth of Knowledge and cognitive rigor see http://www.nciea.org/cgi-bin/pubspage.cgi?sortby=pub_date.)
Statistics & Probability
Functions
Number & Quantity
Algebra
Geometry
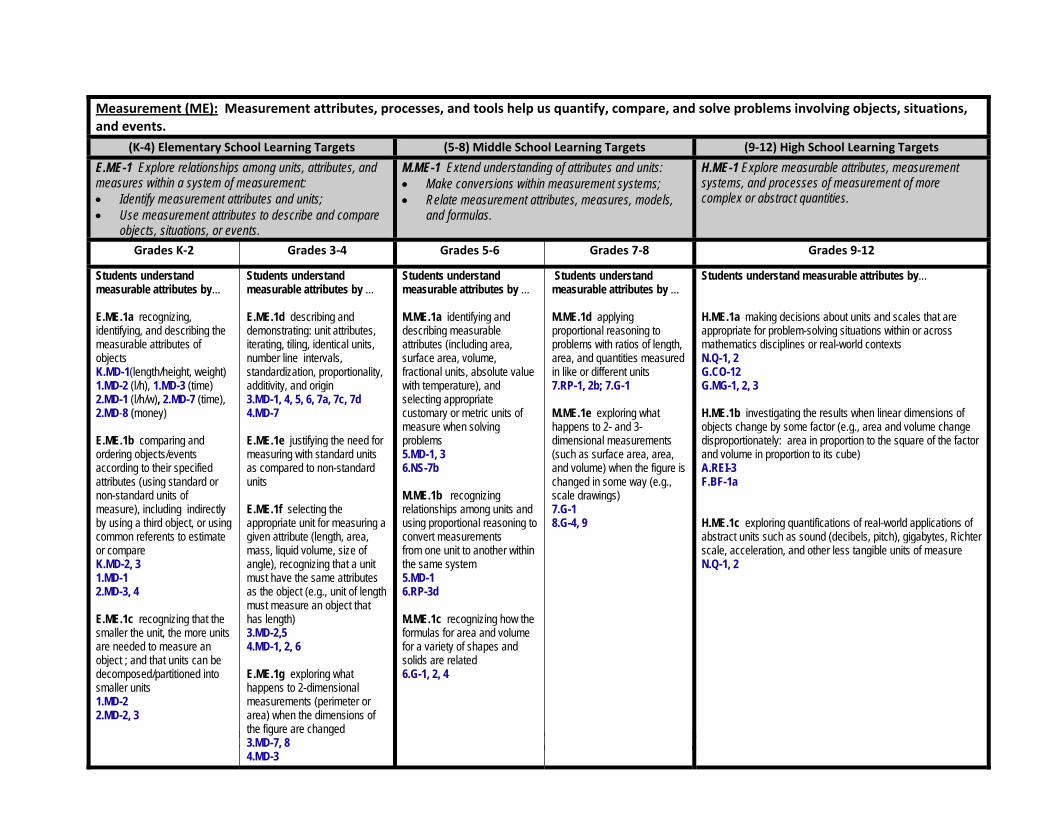
26 © Hess, Karin K., (Ed.) December 2010. Learning Progressions Frameworks Designed for Use with the Common Core State Standards in Mathematics K-12. National Alternate
Assessment Center at the University of Kentucky and the National Center for the Improvement of Educational Assessment, Dover, N.H. (updated- v.3)
Measurement (ME): Measurement attributes, processes, and tools help us quantify, compare, and solve problems involving objects, situations, and events.
(K‐4) Elementary School Learning Targets (5‐8) Middle School Learning Targets (9‐12) High School Learning Targets
E.ME-1 Explore relationships among units, attributes, and measures within a system of measurement: Identify measurement attributes and units; Use measurement attributes to describe and compare
objects, situations, or events.
M.ME-1 Extend understanding of attributes and units: Make conversions within measurement systems; Relate measurement attributes, measures, models,
and formulas.
H.ME-1 Explore measurable attributes, measurement systems, and processes of measurement of more complex or abstract quantities.
Grades K‐2 Grades 3‐4 Grades 5‐6 Grades 7‐8 Grades 9‐12
Students understand measurable attributes by… E.ME.1a recognizing, identifying, and describing the measurable attributes of objects K.MD-1(length/height, weight) 1.MD-2 (l/h), 1.MD-3 (time) 2.MD-1 (l/h/w), 2.MD-7 (time), 2.MD-8 (money) E.ME.1b comparing and ordering objects/events according to their specified attributes (using standard or non-standard units of measure), including indirectly by using a third object, or using common referents to estimate or compare K.MD-2, 3 1.MD-1 2.MD-3, 4 E.ME.1c recognizing that the smaller the unit, the more units are needed to measure an object ; and that units can be decomposed/partitioned into smaller units 1.MD-2 2.MD-2, 3
Students understand measurable attributes by … E.ME.1d describing and demonstrating: unit attributes, iterating, tiling, identical units, number line intervals, standardization, proportionality, additivity, and origin 3.MD-1, 4, 5, 6, 7a, 7c, 7d 4.MD-7 E.ME.1e justifying the need for measuring with standard units as compared to non-standard units E.ME.1f selecting the appropriate unit for measuring a given attribute (length, area, mass, liquid volume, size of angle), recognizing that a unit must have the same attributes as the object (e.g., unit of length must measure an object that has length) 3.MD-2,5 4.MD-1, 2, 6 E.ME.1g exploring what happens to 2-dimensional measurements (perimeter or area) when the dimensions of the figure are changed 3.MD-7, 8 4.MD-3
Students understand measurable attributes by … M.ME.1a identifying and describing measurable attributes (including area, surface area, volume, fractional units, absolute value with temperature), and selecting appropriate customary or metric units of measure when solving problems 5.MD-1, 3 6.NS-7b M.ME.1b recognizing relationships among units and using proportional reasoning to convert measurements from one unit to another within the same system 5.MD-1 6.RP-3d M.ME.1c recognizing how the formulas for area and volume for a variety of shapes and solids are related 6.G-1, 2, 4
Students understand measurable attributes by … M.ME.1d applying proportional reasoning to problems with ratios of length, area, and quantities measured in like or different units 7.RP-1, 2b; 7.G-1 M.ME.1e exploring what happens to 2- and 3-dimensional measurements (such as surface area, area, and volume) when the figure is changed in some way (e.g., scale drawings) 7.G-1 8.G-4, 9
Students understand measurable attributes by… H.ME.1a making decisions about units and scales that are appropriate for problem-solving situations within or across mathematics disciplines or real-world contexts N.Q-1, 2 G.CO-12 G.MG-1, 2, 3 H.ME.1b investigating the results when linear dimensions of objects change by some factor (e.g., area and volume change disproportionately: area in proportion to the square of the factor and volume in proportion to its cube) A.REI-3 F.BF-1a H.ME.1c exploring quantifications of real-world applications of abstract units such as sound (decibels, pitch), gigabytes, Richter scale, acceleration, and other less tangible units of measure N.Q-1, 2
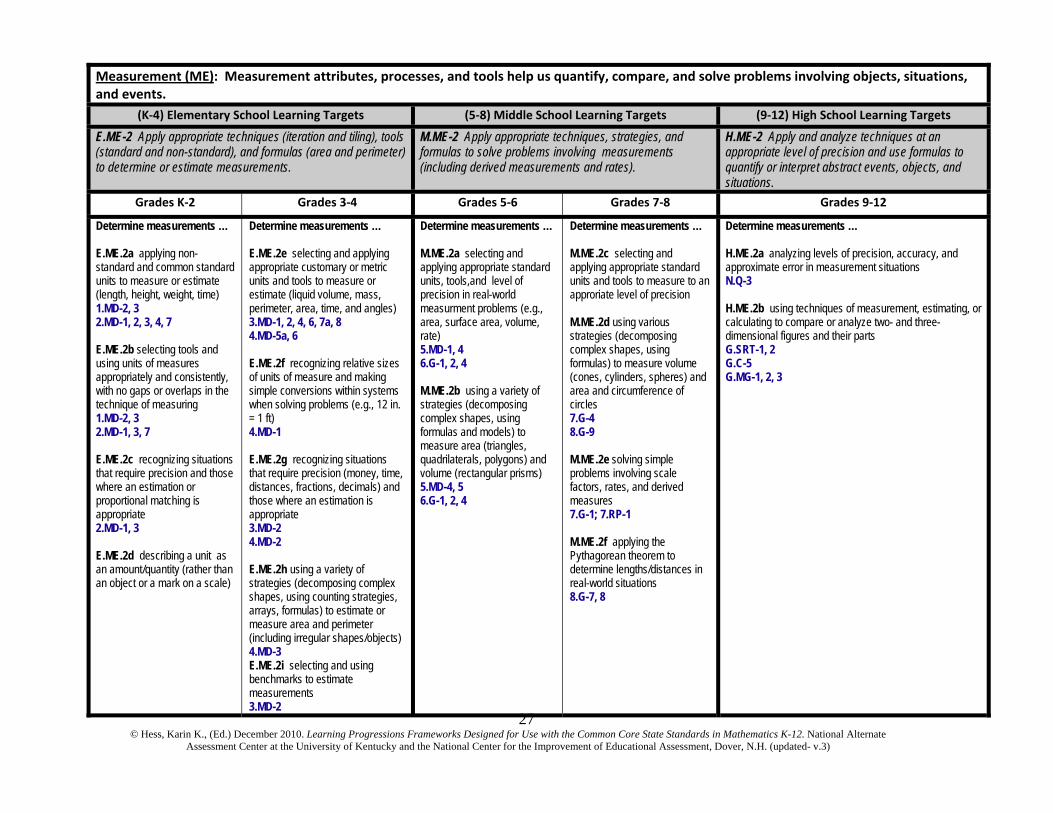
27 © Hess, Karin K., (Ed.) December 2010. Learning Progressions Frameworks Designed for Use with the Common Core State Standards in Mathematics K-12. National Alternate
Assessment Center at the University of Kentucky and the National Center for the Improvement of Educational Assessment, Dover, N.H. (updated- v.3)
Measurement (ME): Measurement attributes, processes, and tools help us quantify, compare, and solve problems involving objects, situations, and events.
(K‐4) Elementary School Learning Targets (5‐8) Middle School Learning Targets (9‐12) High School Learning Targets
E.ME-2 Apply appropriate techniques (iteration and tiling), tools (standard and non-standard), and formulas (area and perimeter) to determine or estimate measurements.
M.ME-2 Apply appropriate techniques, strategies, and formulas to solve problems involving measurements (including derived measurements and rates).
H.ME-2 Apply and analyze techniques at an appropriate level of precision and use formulas to quantify or interpret abstract events, objects, and situations.
Grades K‐2 Grades 3‐4 Grades 5‐6 Grades 7‐8 Grades 9‐12
Determine measurements … E.ME.2a applying non-standard and common standard units to measure or estimate (length, height, weight, time) 1.MD-2, 3 2.MD-1, 2, 3, 4, 7 E.ME.2b selecting tools and using units of measures appropriately and consistently, with no gaps or overlaps in the technique of measuring 1.MD-2, 3 2.MD-1, 3, 7 E.ME.2c recognizing situations that require precision and those where an estimation or proportional matching is appropriate 2.MD-1, 3 E.ME.2d describing a unit as an amount/quantity (rather than an object or a mark on a scale)
Determine measurements … E.ME.2e selecting and applying appropriate customary or metric units and tools to measure or estimate (liquid volume, mass, perimeter, area, time, and angles) 3.MD-1, 2, 4, 6, 7a, 8 4.MD-5a, 6 E.ME.2f recognizing relative sizes of units of measure and making simple conversions within systems when solving problems (e.g., 12 in. = 1 ft) 4.MD-1 E.ME.2g recognizing situations that require precision (money, time, distances, fractions, decimals) and those where an estimation is appropriate 3.MD-2 4.MD-2 E.ME.2h using a variety of strategies (decomposing complex shapes, using counting strategies, arrays, formulas) to estimate or measure area and perimeter (including irregular shapes/objects) 4.MD-3 E.ME.2i selecting and using benchmarks to estimate measurements 3.MD-2
Determine measurements … M.ME.2a selecting and applying appropriate standard units, tools,and level of precision in real-world measurment problems (e.g., area, surface area, volume, rate) 5.MD-1, 4 6.G-1, 2, 4 M.ME.2b using a variety of strategies (decomposing complex shapes, using formulas and models) to measure area (triangles, quadrilaterals, polygons) and volume (rectangular prisms) 5.MD-4, 5 6.G-1, 2, 4
Determine measurements … M.ME.2c selecting and applying appropriate standard units and tools to measure to an approriate level of precision M.ME.2d using various strategies (decomposing complex shapes, using formulas) to measure volume (cones, cylinders, spheres) and area and circumference of circles 7.G-4 8.G-9 M.ME.2e solving simple problems involving scale factors, rates, and derived measures 7.G-1; 7.RP-1 M.ME.2f applying the Pythagorean theorem to determine lengths/distances in real-world situations 8.G-7, 8
Determine measurements … H.ME.2a analyzing levels of precision, accuracy, and approximate error in measurement situations N.Q-3 H.ME.2b using techniques of measurement, estimating, or calculating to compare or analyze two- and three-dimensional figures and their parts G.SRT-1, 2 G.C-5 G.MG-1, 2, 3
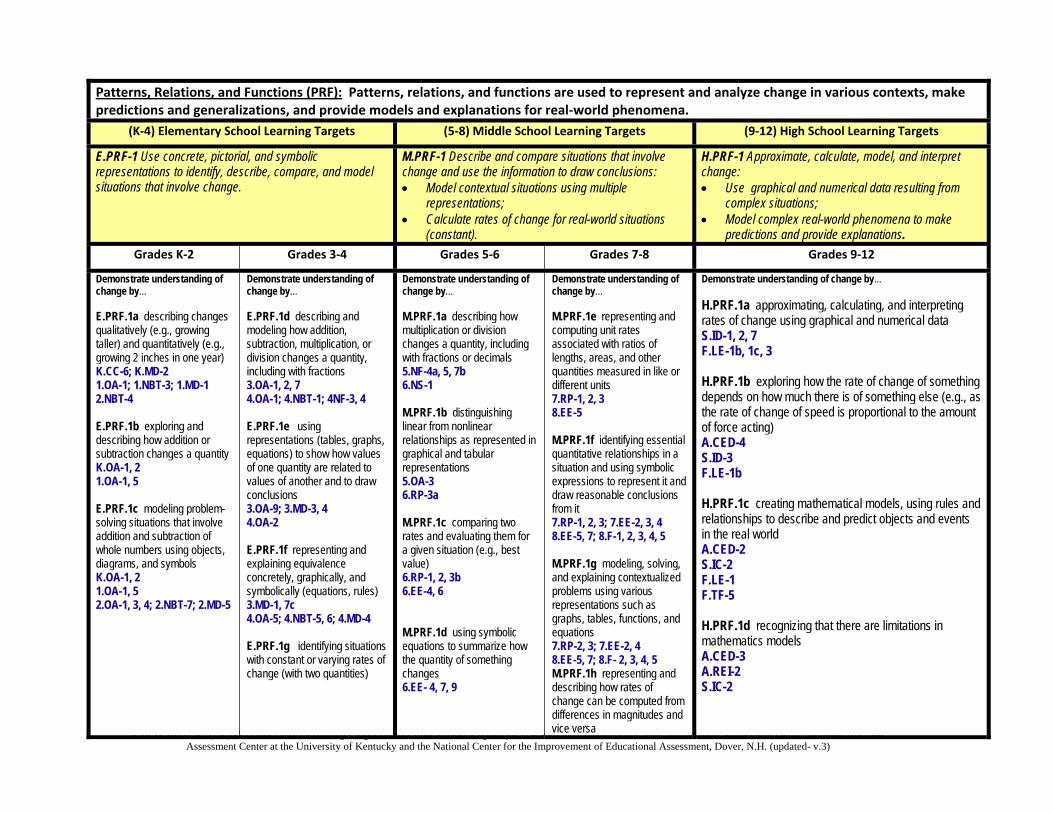
28 © Hess, Karin K., (Ed.) December 2010. Learning Progressions Frameworks Designed for Use with the Common Core State Standards in Mathematics K-12. National Alternate
Assessment Center at the University of Kentucky and the National Center for the Improvement of Educational Assessment, Dover, N.H. (updated- v.3)
Patterns, Relations, and Functions (PRF): Patterns, relations, and functions are used to represent and analyze change in various contexts, make predictions and generalizations, and provide models and explanations for real‐world phenomena.
(K‐4) Elementary School Learning Targets (5‐8) Middle School Learning Targets (9‐12) High School Learning Targets
E.PRF-1 Use concrete, pictorial, and symbolic representations to identify, describe, compare, and model situations that involve change.
M.PRF-1 Describe and compare situations that involve change and use the information to draw conclusions: Model contextual situations using multiple
representations; Calculate rates of change for real-world situations
(constant).
H.PRF-1 Approximate, calculate, model, and interpret change: Use graphical and numerical data resulting from
complex situations; Model complex real-world phenomena to make
predictions and provide explanations. Grades K‐2 Grades 3‐4 Grades 5‐6 Grades 7‐8 Grades 9‐12
Demonstrate understanding of change by… E.PRF.1a describing changes qualitatively (e.g., growing taller) and quantitatively (e.g., growing 2 inches in one year) K.CC-6; K.MD-2 1.OA-1; 1.NBT-3; 1.MD-1 2.NBT-4 E.PRF.1b exploring and describing how addition or subtraction changes a quantity K.OA-1, 2 1.OA-1, 5 E.PRF.1c modeling problem-solving situations that involve addition and subtraction of whole numbers using objects, diagrams, and symbols K.OA-1, 2 1.OA-1, 5 2.OA-1, 3, 4; 2.NBT-7; 2.MD-5
Demonstrate understanding of change by… E.PRF.1d describing and modeling how addition, subtraction, multiplication, or division changes a quantity, including with fractions 3.OA-1, 2, 7 4.OA-1; 4.NBT-1; 4NF-3, 4 E.PRF.1e using representations (tables, graphs, equations) to show how values of one quantity are related to values of another and to draw conclusions 3.OA-9; 3.MD-3, 4 4.OA-2 E.PRF.1f representing and explaining equivalence concretely, graphically, and symbolically (equations, rules) 3.MD-1, 7c 4.OA-5; 4.NBT-5, 6; 4.MD-4 E.PRF.1g identifying situations with constant or varying rates of change (with two quantities)
Demonstrate understanding of change by… M.PRF.1a describing how multiplication or division changes a quantity, including with fractions or decimals 5.NF-4a, 5, 7b 6.NS-1 M.PRF.1b distinguishing linear from nonlinear relationships as represented in graphical and tabular representations 5.OA-3 6.RP-3a M.PRF.1c comparing two rates and evaluating them for a given situation (e.g., best value) 6.RP-1, 2, 3b 6.EE-4, 6 M.PRF.1d using symbolic equations to summarize how the quantity of something changes 6.EE- 4, 7, 9
Demonstrate understanding of change by… M.PRF.1e representing and computing unit rates associated with ratios of lengths, areas, and other quantities measured in like or different units 7.RP-1, 2, 3 8.EE-5 M.PRF.1f identifying essential quantitative relationships in a situation and using symbolic expressions to represent it and draw reasonable conclusions from it 7.RP-1, 2, 3; 7.EE-2, 3, 4 8.EE-5, 7; 8.F-1, 2, 3, 4, 5 M.PRF.1g modeling, solving, and explaining contextualized problems using various representations such as graphs, tables, functions, and equations 7.RP-2, 3; 7.EE-2, 4 8.EE-5, 7; 8.F- 2, 3, 4, 5 M.PRF.1h representing and describing how rates of change can be computed from differences in magnitudes and vice versa
Demonstrate understanding of change by… H.PRF.1a approximating, calculating, and interpreting rates of change using graphical and numerical data S.ID-1, 2, 7 F.LE-1b, 1c, 3 H.PRF.1b exploring how the rate of change of something depends on how much there is of something else (e.g., as the rate of change of speed is proportional to the amount of force acting) A.CED-4 S.ID-3 F.LE-1b H.PRF.1c creating mathematical models, using rules and relationships to describe and predict objects and events in the real world A.CED-2 S.IC-2 F.LE-1 F.TF-5 H.PRF.1d recognizing that there are limitations in mathematics models A.CED-3 A.REI-2 S.IC-2
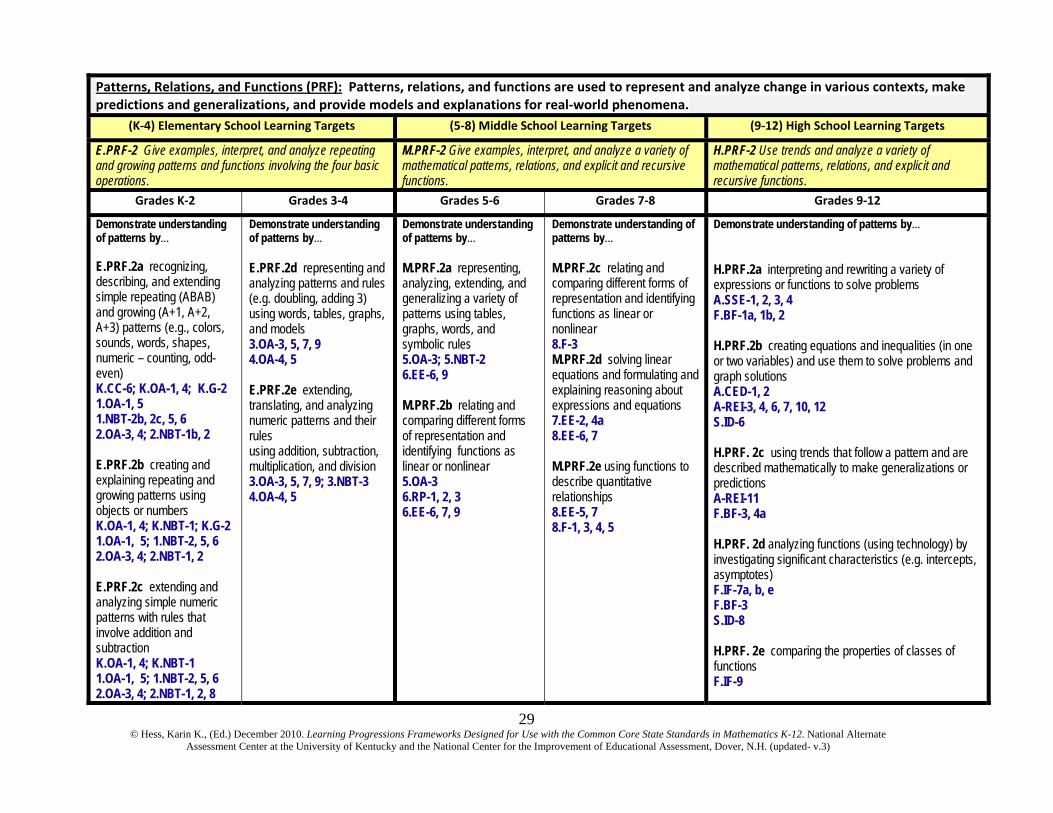
29 © Hess, Karin K., (Ed.) December 2010. Learning Progressions Frameworks Designed for Use with the Common Core State Standards in Mathematics K-12. National Alternate
Assessment Center at the University of Kentucky and the National Center for the Improvement of Educational Assessment, Dover, N.H. (updated- v.3)
Patterns, Relations, and Functions (PRF): Patterns, relations, and functions are used to represent and analyze change in various contexts, make predictions and generalizations, and provide models and explanations for real‐world phenomena.
(K‐4) Elementary School Learning Targets (5‐8) Middle School Learning Targets (9‐12) High School Learning Targets
E.PRF-2 Give examples, interpret, and analyze repeating and growing patterns and functions involving the four basic operations.
M.PRF-2 Give examples, interpret, and analyze a variety of mathematical patterns, relations, and explicit and recursive functions.
H.PRF-2 Use trends and analyze a variety of mathematical patterns, relations, and explicit and recursive functions.
Grades K‐2 Grades 3‐4 Grades 5‐6 Grades 7‐8 Grades 9‐12
Demonstrate understanding of patterns by… E.PRF.2a recognizing, describing, and extending simple repeating (ABAB) and growing (A+1, A+2, A+3) patterns (e.g., colors, sounds, words, shapes, numeric – counting, odd-even) K.CC-6; K.OA-1, 4; K.G-2 1.OA-1, 5 1.NBT-2b, 2c, 5, 6 2.OA-3, 4; 2.NBT-1b, 2 E.PRF.2b creating and explaining repeating and growing patterns using objects or numbers K.OA-1, 4; K.NBT-1; K.G-2 1.OA-1, 5; 1.NBT-2, 5, 6 2.OA-3, 4; 2.NBT-1, 2 E.PRF.2c extending and analyzing simple numeric patterns with rules that involve addition and subtraction K.OA-1, 4; K.NBT-1 1.OA-1, 5; 1.NBT-2, 5, 6 2.OA-3, 4; 2.NBT-1, 2, 8
Demonstrate understanding of patterns by… E.PRF.2d representing and analyzing patterns and rules (e.g. doubling, adding 3) using words, tables, graphs, and models 3.OA-3, 5, 7, 9 4.OA-4, 5 E.PRF.2e extending, translating, and analyzing numeric patterns and their rules using addition, subtraction, multiplication, and division 3.OA-3, 5, 7, 9; 3.NBT-3 4.OA-4, 5
Demonstrate understanding of patterns by… M.PRF.2a representing, analyzing, extending, and generalizing a variety of patterns using tables, graphs, words, and symbolic rules 5.OA-3; 5.NBT-2 6.EE-6, 9 M.PRF.2b relating and comparing different forms of representation and identifying functions as linear or nonlinear 5.OA-3 6.RP-1, 2, 3 6.EE-6, 7, 9
Demonstrate understanding of patterns by… M.PRF.2c relating and comparing different forms of representation and identifying functions as linear or nonlinear 8.F-3 M.PRF.2d solving linear equations and formulating and explaining reasoning about expressions and equations 7.EE-2, 4a 8.EE-6, 7 M.PRF.2e using functions to describe quantitative relationships 8.EE-5, 7 8.F-1, 3, 4, 5
Demonstrate understanding of patterns by… H.PRF.2a interpreting and rewriting a variety of expressions or functions to solve problems A.SSE-1, 2, 3, 4 F.BF-1a, 1b, 2 H.PRF.2b creating equations and inequalities (in one or two variables) and use them to solve problems and graph solutions A.CED-1, 2 A-REI-3, 4, 6, 7, 10, 12 S.ID-6 H.PRF. 2c using trends that follow a pattern and are described mathematically to make generalizations or predictions A-REI-11 F.BF-3, 4a H.PRF. 2d analyzing functions (using technology) by investigating significant characteristics (e.g. intercepts, asymptotes) F.IF-7a, b, e F.BF-3 S.ID-8 H.PRF. 2e comparing the properties of classes of functions F.IF-9
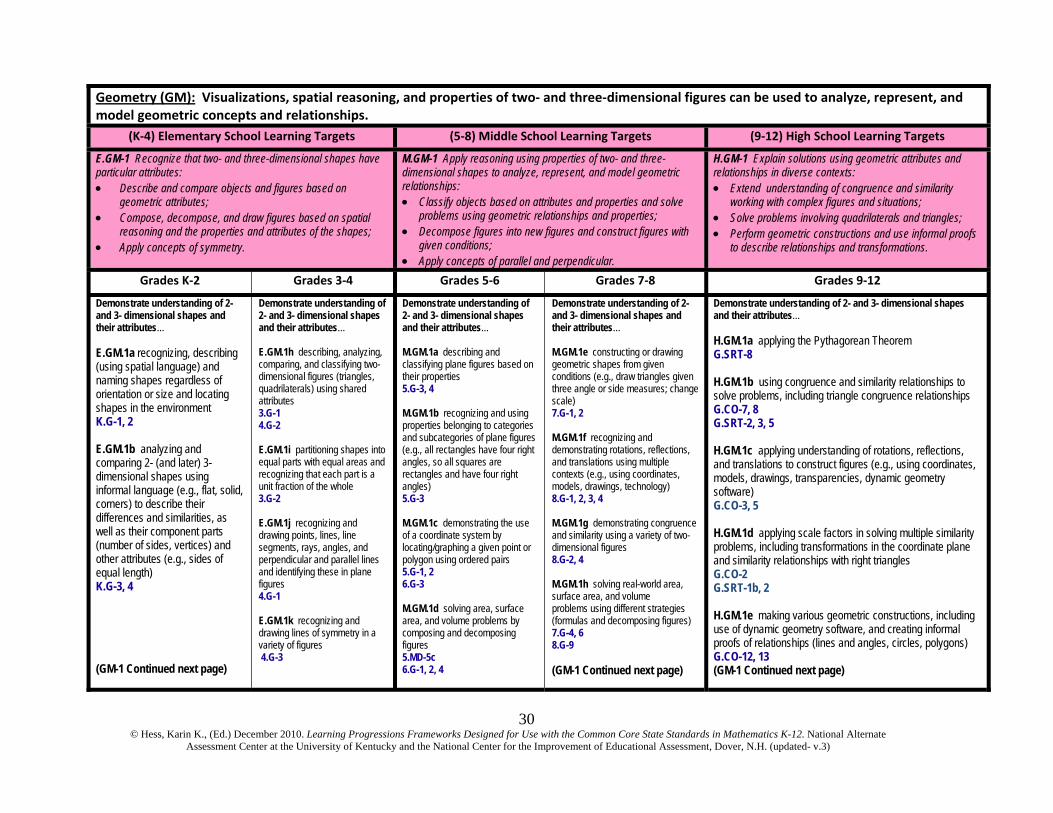
30 © Hess, Karin K., (Ed.) December 2010. Learning Progressions Frameworks Designed for Use with the Common Core State Standards in Mathematics K-12. National Alternate
Assessment Center at the University of Kentucky and the National Center for the Improvement of Educational Assessment, Dover, N.H. (updated- v.3)
Geometry (GM): Visualizations, spatial reasoning, and properties of two‐ and three‐dimensional figures can be used to analyze, represent, and model geometric concepts and relationships.
(K‐4) Elementary School Learning Targets (5‐8) Middle School Learning Targets (9‐12) High School Learning Targets
E.GM-1 Recognize that two- and three-dimensional shapes have particular attributes: Describe and compare objects and figures based on
geometric attributes; Compose, decompose, and draw figures based on spatial
reasoning and the properties and attributes of the shapes; Apply concepts of symmetry.
M.GM-1 Apply reasoning using properties of two- and three-dimensional shapes to analyze, represent, and model geometric relationships: Classify objects based on attributes and properties and solve
problems using geometric relationships and properties; Decompose figures into new figures and construct figures with
given conditions; Apply concepts of parallel and perpendicular.
H.GM-1 Explain solutions using geometric attributes and relationships in diverse contexts: Extend understanding of congruence and similarity
working with complex figures and situations; Solve problems involving quadrilaterals and triangles; Perform geometric constructions and use informal proofs
to describe relationships and transformations.
Grades K‐2 Grades 3‐4 Grades 5‐6 Grades 7‐8 Grades 9‐12
Demonstrate understanding of 2- and 3- dimensional shapes and their attributes… E.GM.1a recognizing, describing (using spatial language) and naming shapes regardless of orientation or size and locating shapes in the environment K.G-1, 2 E.GM.1b analyzing and comparing 2- (and later) 3-dimensional shapes using informal language (e.g., flat, solid, corners) to describe their differences and similarities, as well as their component parts (number of sides, vertices) and other attributes (e.g., sides of equal length) K.G-3, 4 (GM-1 Continued next page)
Demonstrate understanding of 2- and 3- dimensional shapes and their attributes… E.GM.1h describing, analyzing, comparing, and classifying two-dimensional figures (triangles, quadrilaterals) using shared attributes 3.G-1 4.G-2 E.GM.1i partitioning shapes into equal parts with equal areas and recognizing that each part is a unit fraction of the whole 3.G-2 E.GM.1j recognizing and drawing points, lines, line segments, rays, angles, and perpendicular and parallel lines and identifying these in plane figures 4.G-1 E.GM.1k recognizing and drawing lines of symmetry in a variety of figures 4.G-3
Demonstrate understanding of 2- and 3- dimensional shapes and their attributes… M.GM.1a describing and classifying plane figures based on their properties 5.G-3, 4 M.GM.1b recognizing and using properties belonging to categories and subcategories of plane figures (e.g., all rectangles have four right angles, so all squares are rectangles and have four right angles) 5.G-3 M.GM.1c demonstrating the use of a coordinate system by locating/graphing a given point or polygon using ordered pairs 5.G-1, 2 6.G-3 M.GM.1d solving area, surface area, and volume problems by composing and decomposing figures 5.MD-5c 6.G-1, 2, 4
Demonstrate understanding of 2- and 3- dimensional shapes and their attributes… M.GM.1e constructing or drawing geometric shapes from given conditions (e.g., draw triangles given three angle or side measures; change scale) 7.G-1, 2 M.GM.1f recognizing and demonstrating rotations, reflections, and translations using multiple contexts (e.g., using coordinates, models, drawings, technology) 8.G-1, 2, 3, 4 M.GM.1g demonstrating congruence and similarity using a variety of two-dimensional figures 8.G-2, 4 M.GM.1h solving real-world area, surface area, and volume problems using different strategies (formulas and decomposing figures) 7.G-4, 6 8.G-9 (GM-1 Continued next page)
Demonstrate understanding of 2- and 3- dimensional shapes and their attributes… H.GM.1a applying the Pythagorean Theorem G.SRT-8 H.GM.1b using congruence and similarity relationships to solve problems, including triangle congruence relationships G.CO-7, 8 G.SRT-2, 3, 5 H.GM.1c applying understanding of rotations, reflections, and translations to construct figures (e.g., using coordinates, models, drawings, transparencies, dynamic geometry software) G.CO-3, 5 H.GM.1d applying scale factors in solving multiple similarity problems, including transformations in the coordinate plane and similarity relationships with right triangles G.CO-2 G.SRT-1b, 2 H.GM.1e making various geometric constructions, including use of dynamic geometry software, and creating informal proofs of relationships (lines and angles, circles, polygons) G.CO-12, 13 (GM-1 Continued next page)
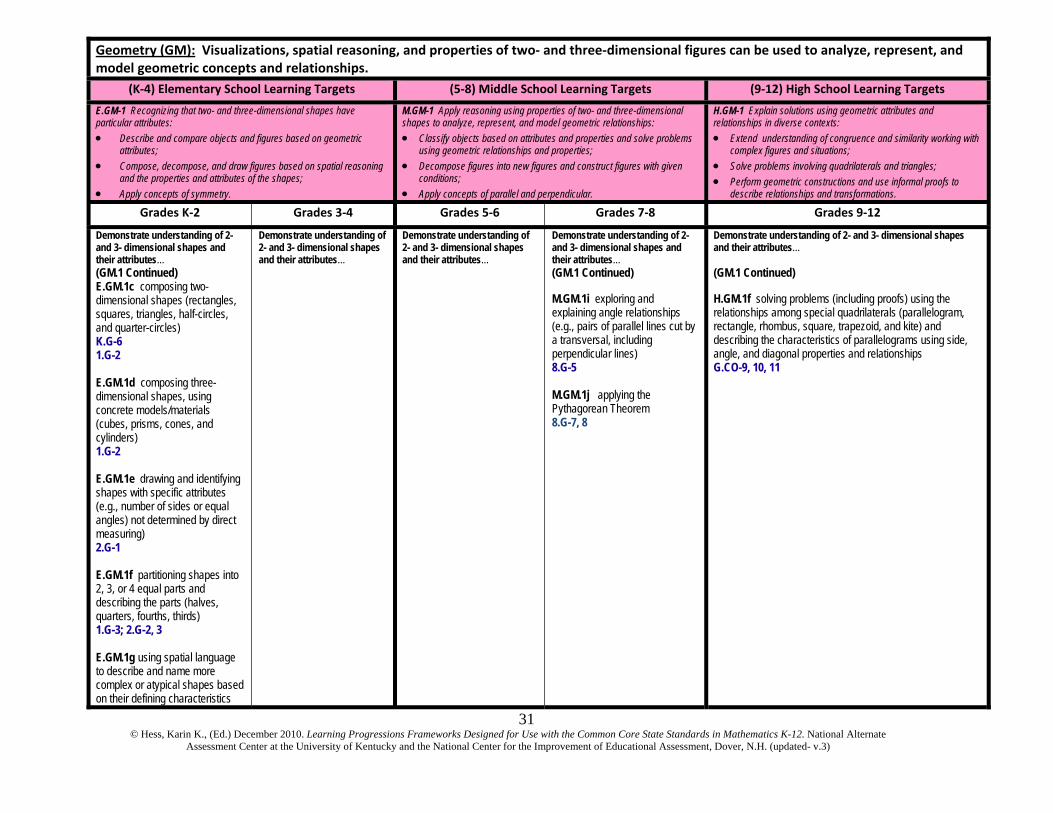
31 © Hess, Karin K., (Ed.) December 2010. Learning Progressions Frameworks Designed for Use with the Common Core State Standards in Mathematics K-12. National Alternate
Assessment Center at the University of Kentucky and the National Center for the Improvement of Educational Assessment, Dover, N.H. (updated- v.3)
Geometry (GM): Visualizations, spatial reasoning, and properties of two‐ and three‐dimensional figures can be used to analyze, represent, and model geometric concepts and relationships.
(K‐4) Elementary School Learning Targets (5‐8) Middle School Learning Targets (9‐12) High School Learning Targets
E.GM-1 Recognizing that two- and three-dimensional shapes have particular attributes: Describe and compare objects and figures based on geometric
attributes; Compose, decompose, and draw figures based on spatial reasoning
and the properties and attributes of the shapes; Apply concepts of symmetry.
M.GM-1 Apply reasoning using properties of two- and three-dimensional shapes to analyze, represent, and model geometric relationships: Classify objects based on attributes and properties and solve problems
using geometric relationships and properties; Decompose figures into new figures and construct figures with given
conditions; Apply concepts of parallel and perpendicular.
H.GM-1 Explain solutions using geometric attributes and relationships in diverse contexts: Extend understanding of congruence and similarity working with
complex figures and situations; Solve problems involving quadrilaterals and triangles; Perform geometric constructions and use informal proofs to
describe relationships and transformations.
Grades K‐2 Grades 3‐4 Grades 5‐6 Grades 7‐8 Grades 9‐12
Demonstrate understanding of 2- and 3- dimensional shapes and their attributes… (GM.1 Continued) E.GM.1c composing two-dimensional shapes (rectangles, squares, triangles, half-circles, and quarter-circles) K.G-6 1.G-2 E.GM.1d composing three-dimensional shapes, using concrete models/materials (cubes, prisms, cones, and cylinders) 1.G-2 E.GM.1e drawing and identifying shapes with specific attributes (e.g., number of sides or equal angles) not determined by direct measuring) 2.G-1 E.GM.1f partitioning shapes into 2, 3, or 4 equal parts and describing the parts (halves, quarters, fourths, thirds) 1.G-3; 2.G-2, 3 E.GM.1g using spatial language to describe and name more complex or atypical shapes based on their defining characteristics
Demonstrate understanding of 2- and 3- dimensional shapes and their attributes…
Demonstrate understanding of 2- and 3- dimensional shapes and their attributes…
Demonstrate understanding of 2- and 3- dimensional shapes and their attributes… (GM.1 Continued) M.GM.1i exploring and explaining angle relationships (e.g., pairs of parallel lines cut by a transversal, including perpendicular lines) 8.G-5 M.GM.1j applying the Pythagorean Theorem 8.G-7, 8
Demonstrate understanding of 2- and 3- dimensional shapes and their attributes… (GM.1 Continued) H.GM.1f solving problems (including proofs) using the relationships among special quadrilaterals (parallelogram, rectangle, rhombus, square, trapezoid, and kite) and describing the characteristics of parallelograms using side, angle, and diagonal properties and relationships G.CO-9, 10, 11
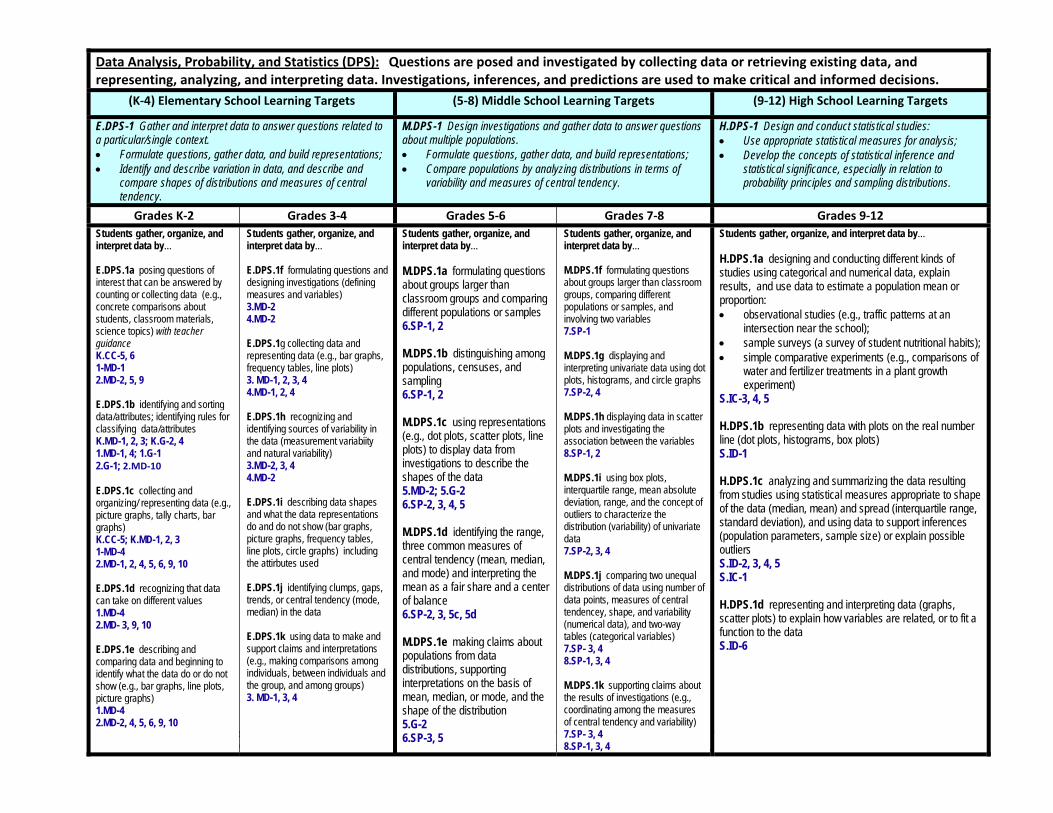
32 © Hess, Karin K., (Ed.) December 2010. Learning Progressions Frameworks Designed for Use with the Common Core State Standards in Mathematics K-12. National Alternate
Assessment Center at the University of Kentucky and the National Center for the Improvement of Educational Assessment, Dover, N.H. (updated- v.3)
Data Analysis, Probability, and Statistics (DPS): Questions are posed and investigated by collecting data or retrieving existing data, and representing, analyzing, and interpreting data. Investigations, inferences, and predictions are used to make critical and informed decisions.
(K‐4) Elementary School Learning Targets (5‐8) Middle School Learning Targets (9‐12) High School Learning Targets
E.DPS-1 Gather and interpret data to answer questions related to a particular/single context. Formulate questions, gather data, and build representations; Identify and describe variation in data, and describe and
compare shapes of distributions and measures of central tendency.
M.DPS-1 Design investigations and gather data to answer questions about multiple populations. Formulate questions, gather data, and build representations; Compare populations by analyzing distributions in terms of
variability and measures of central tendency.
H.DPS-1 Design and conduct statistical studies: Use appropriate statistical measures for analysis; Develop the concepts of statistical inference and
statistical significance, especially in relation to probability principles and sampling distributions.
Grades K‐2 Grades 3‐4 Grades 5‐6 Grades 7‐8 Grades 9‐12Students gather, organize, and interpret data by… E.DPS.1a posing questions of interest that can be answered by counting or collecting data (e.g., concrete comparisons about students, classroom materials, science topics) with teacher guidance K.CC-5, 6 1-MD-1 2.MD-2, 5, 9 E.DPS.1b identifying and sorting data/attributes; identifying rules for classifying data/attributes K.MD-1, 2, 3; K.G-2, 4 1.MD-1, 4; 1.G-1 2.G-1; 2.MD‐10 E.DPS.1c collecting and organizing/ representing data (e.g., picture graphs, tally charts, bar graphs) K.CC-5; K.MD-1, 2, 3 1-MD-4 2.MD-1, 2, 4, 5, 6, 9, 10 E.DPS.1d recognizing that data can take on different values 1.MD-4 2.MD- 3, 9, 10 E.DPS.1e describing and comparing data and beginning to identify what the data do or do not show (e.g., bar graphs, line plots, picture graphs) 1.MD-4 2.MD-2, 4, 5, 6, 9, 10
Students gather, organize, and interpret data by… E.DPS.1f formulating questions and designing investigations (defining measures and variables) 3.MD-2 4.MD-2 E.DPS.1g collecting data and representing data (e.g., bar graphs, frequency tables, line plots) 3. MD-1, 2, 3, 4 4.MD-1, 2, 4 E.DPS.1h recognizing and identifying sources of variability in the data (measurement variabiity and natural variability) 3.MD-2, 3, 4 4.MD-2 E.DPS.1i describing data shapes and what the data representations do and do not show (bar graphs, picture graphs, frequency tables, line plots, circle graphs) including the attirbutes used E.DPS.1j identifying clumps, gaps, trends, or central tendency (mode, median) in the data E.DPS.1k using data to make and support claims and interpretations (e.g., making comparisons among individuals, between individuals and the group, and among groups) 3. MD-1, 3, 4
Students gather, organize, and interpret data by… M.DPS.1a formulating questions about groups larger than classroom groups and comparing different populations or samples 6.SP-1, 2 M.DPS.1b distinguishing among populations, censuses, and sampling 6.SP-1, 2 M.DPS.1c using representations (e.g., dot plots, scatter plots, line plots) to display data from investigations to describe the shapes of the data 5.MD-2; 5.G-2 6.SP-2, 3, 4, 5 M.DPS.1d identifying the range, three common measures of central tendency (mean, median, and mode) and interpreting the mean as a fair share and a center of balance 6.SP-2, 3, 5c, 5d M.DPS.1e making claims about populations from data distributions, supporting interpretations on the basis of mean, median, or mode, and the shape of the distribution 5.G-2 6.SP-3, 5
Students gather, organize, and interpret data by… M.DPS.1f formulating questions about groups larger than classroom groups, comparing different populations or samples, and involving two variables 7.SP-1 M.DPS.1g displaying and interpreting univariate data using dot plots, histograms, and circle graphs 7.SP-2, 4 M.DPS.1h displaying data in scatter plots and investigating the association between the variables 8.SP-1, 2 M.DPS.1i using box plots, interquartile range, mean absolute deviation, range, and the concept of outliers to characterize the distribution (variability) of univariate data 7.SP-2, 3, 4 M.DPS.1j comparing two unequal distributions of data using number of data points, measures of central tendencey, shape, and variability (numerical data), and two-way tables (categorical variables) 7.SP- 3, 4 8.SP-1, 3, 4 M.DPS.1k supporting claims about the results of investigations (e.g., coordinating among the measures of central tendency and variability) 7.SP- 3, 4 8.SP-1, 3, 4
Students gather, organize, and interpret data by… H.DPS.1a designing and conducting different kinds of studies using categorical and numerical data, explain results, and use data to estimate a population mean or proportion: observational studies (e.g., traffic patterns at an
intersection near the school); sample surveys (a survey of student nutritional habits); simple comparative experiments (e.g., comparisons of
water and fertilizer treatments in a plant growth experiment)
S.IC-3, 4, 5 H.DPS.1b representing data with plots on the real number line (dot plots, histograms, box plots) S.ID-1 H.DPS.1c analyzing and summarizing the data resulting from studies using statistical measures appropriate to shape of the data (median, mean) and spread (interquartile range, standard deviation), and using data to support inferences (population parameters, sample size) or explain possible outliers S.ID-2, 3, 4, 5 S.IC-1 H.DPS.1d representing and interpreting data (graphs, scatter plots) to explain how variables are related, or to fit a function to the data S.ID-6
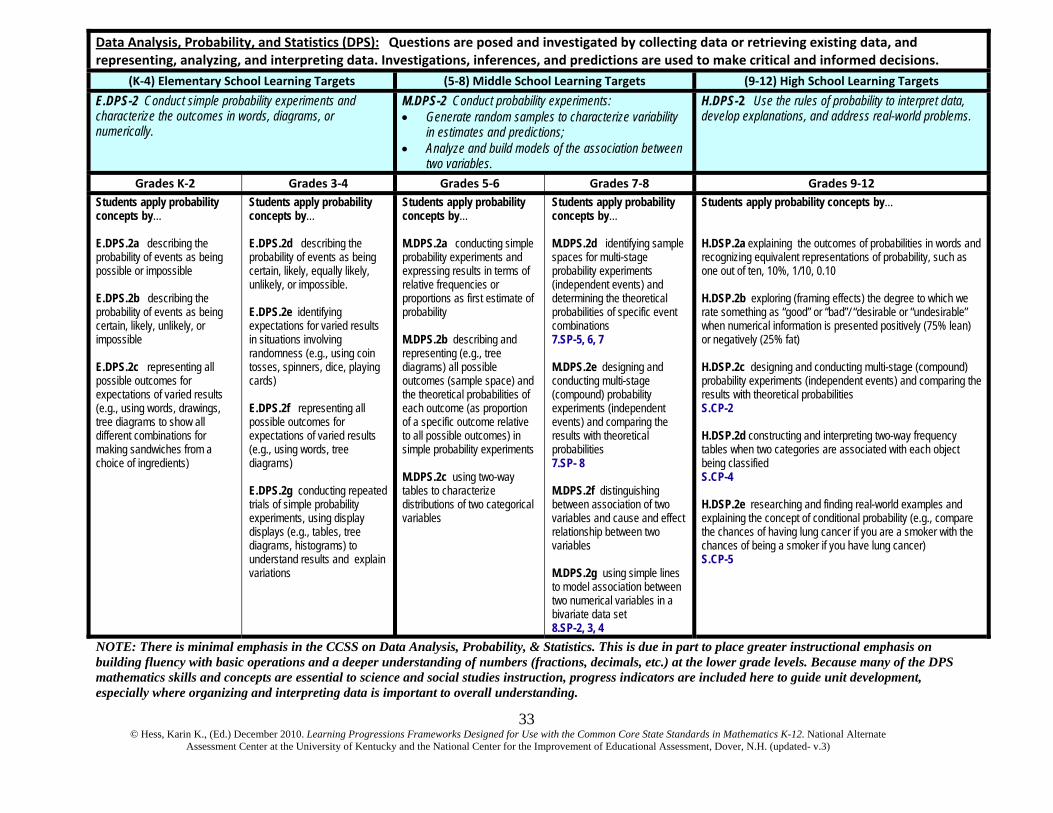
33 © Hess, Karin K., (Ed.) December 2010. Learning Progressions Frameworks Designed for Use with the Common Core State Standards in Mathematics K-12. National Alternate
Assessment Center at the University of Kentucky and the National Center for the Improvement of Educational Assessment, Dover, N.H. (updated- v.3)
NOTE: There is minimal emphasis in the CCSS on Data Analysis, Probability, & Statistics. This is due in part to place greater instructional emphasis on building fluency with basic operations and a deeper understanding of numbers (fractions, decimals, etc.) at the lower grade levels. Because many of the DPS mathematics skills and concepts are essential to science and social studies instruction, progress indicators are included here to guide unit development, especially where organizing and interpreting data is important to overall understanding.
Data Analysis, Probability, and Statistics (DPS): Questions are posed and investigated by collecting data or retrieving existing data, and representing, analyzing, and interpreting data. Investigations, inferences, and predictions are used to make critical and informed decisions.
(K‐4) Elementary School Learning Targets (5‐8) Middle School Learning Targets (9‐12) High School Learning Targets
E.DPS-2 Conduct simple probability experiments and characterize the outcomes in words, diagrams, or numerically.
M.DPS-2 Conduct probability experiments: Generate random samples to characterize variability
in estimates and predictions; Analyze and build models of the association between
two variables.
H.DPS-2 Use the rules of probability to interpret data, develop explanations, and address real-world problems.
Grades K‐2 Grades 3‐4 Grades 5‐6 Grades 7‐8 Grades 9‐12Students apply probability concepts by… E.DPS.2a describing the probability of events as being possible or impossible E.DPS.2b describing the probability of events as being certain, likely, unlikely, or impossible E.DPS.2c representing all possible outcomes for expectations of varied results (e.g., using words, drawings, tree diagrams to show all different combinations for making sandwiches from a choice of ingredients)
Students apply probability concepts by… E.DPS.2d describing the probability of events as being certain, likely, equally likely, unlikely, or impossible. E.DPS.2e identifying expectations for varied results in situations involving randomness (e.g., using coin tosses, spinners, dice, playing cards) E.DPS.2f representing all possible outcomes for expectations of varied results (e.g., using words, tree diagrams) E.DPS.2g conducting repeated trials of simple probability experiments, using display displays (e.g., tables, tree diagrams, histograms) to understand results and explain variations
Students apply probability concepts by… M.DPS.2a conducting simple probability experiments and expressing results in terms of relative frequencies or proportions as first estimate of probability M.DPS.2b describing and representing (e.g., tree diagrams) all possible outcomes (sample space) and the theoretical probabilities of each outcome (as proportion of a specific outcome relative to all possible outcomes) in simple probability experiments M.DPS.2c using two-way tables to characterize distributions of two categorical variables
Students apply probability concepts by… M.DPS.2d identifying sample spaces for multi-stage probability experiments (independent events) and determining the theoretical probabilities of specific event combinations 7.SP-5, 6, 7 M.DPS.2e designing and conducting multi-stage (compound) probability experiments (independent events) and comparing the results with theoretical probabilities 7.SP- 8 M.DPS.2f distinguishing between association of two variables and cause and effect relationship between two variables M.DPS.2g using simple lines to model association between two numerical variables in a bivariate data set 8.SP-2, 3, 4
Students apply probability concepts by… H.DSP.2a explaining the outcomes of probabilities in words and recognizing equivalent representations of probability, such as one out of ten, 10%, 1/10, 0.10 H.DSP.2b exploring (framing effects) the degree to which we rate something as “good” or “bad”/ “desirable or “undesirable” when numerical information is presented positively (75% lean) or negatively (25% fat) H.DSP.2c designing and conducting multi-stage (compound) probability experiments (independent events) and comparing the results with theoretical probabilities S.CP-2 H.DSP.2d constructing and interpreting two-way frequency tables when two categories are associated with each object being classified S.CP-4 H.DSP.2e researching and finding real-world examples and explaining the concept of conditional probability (e.g., compare the chances of having lung cancer if you are a smoker with the chances of being a smoker if you have lung cancer) S.CP-5
34 © Hess, Karin K., (Ed.) December 2010. Learning Progressions Frameworks Designed for Use with the Common Core State Standards in Mathematics K-12. National Alternate
Assessment Center at the University of Kentucky and the National Center for the Improvement of Educational Assessment, Dover, N.H. (updated- v.3)
References/Research Consulted During the Learning Progressions Framework Development
AAAS. (2001, 2007). Atlas of science literacy (Vols. I and II). Washington, DC: American Association for the Advancement of Science and the National
Science Teachers Association. Bamberger, H. J., Oberdorf, C., & Schultz-Ferrel, K. (2010). Math misconceptions: From misunderstanding to deep understanding. Portsmouth, N. H.:
Heinemann. Baxter, J. A. (2008). Writing in mathematics: Alternative form of discourse for academically low-achieving students. Perspectives on Language and Literacy,
34 (2), 37-40. Berch, D. & Mazzocco, M. M. M. (Eds) (2007). Why is math so hard for some children? The nature and origins of mathematical learning difficulties and
disabilities. Baltimore, MD: Paul Brookes Publishing Co. Clements, D., Swaminathan, S., Hannibal, M., & Sarama, J. (1999). Young children’s concept of shape. Journal for Research on Mathematics Education, 30,
192-212. Clements, D. H. & Sarama, J. (Eds.) (2004). Engaging young children in mathematics – Standards for early childhood mathematics education. Mahwah, NJ:
Lawrence Erlbaum. Clements, D. H. & Sarama, J. (2009). Learning trajectories in early mathematics – sequences of acquisition and teaching. Encyclopedia of language and literacy
development (pp. 1-7). London, ON: Canadian Language and Literacy Research Network. Retrieved July 31, 2010 from http://literacyencyclopedia.ca/index.php?fa=items.show&topicId=270.
Confrey, J. (February 5-6, 2007).“Tracing the evolution of mathematics content standards in the United States: Looking back and projecting forward.” K12 Mathematics Curriculum Standards conference proceedings.
Council of Chief State School Officers & National Governors’ Association. (June, 2010). Common core state standards for mathematics. Common core state standards initiative. Retrieved [on line] June 2010: http://www.corestandards.org/the-standards/mathematics
Cramer, K. and Henry, A. (2002). “Using manipulative models to build number sense for addition of fractions.” National Council of Teachers of Mathematics 2002 Yearbook: Making Sense of Fractions, Ratios, and Proportions (pp. 41-48). Reston, VA: National Council of Teachers of Mathematics.
Department of Education and Training, Western Australia. Beverly, MA: STEPS Professional Development: First Steps in Mathematics: Chance and Data (2007) First Steps in Mathematics: Space (2007) First Steps in Mathematics: Measurement, Volume 1 (2005) & Volume 2 (2007) First Steps in Mathematics: Number, Volumes 1 & 2 (2007)
De Smedt, B., Verschaffel, L., & Ghesquière, P. (2009). The predictive value of numerical magnitude comparison for individual differences in mathematics achievement. Journal of Experimental Child Psychology, 103, 469-479. doi10.1016/j.jecp.2009.01.010
Duschl, R., Schweingruber, H., and Shouse, A. (Eds.) Board on Science Education, Center for Education, & Division of Behavioral and Social Sciences and Education. (2007). Taking science to school: Learning and teaching science in grades K-8. Washington, D.C.: The National Academies Press.
Fennell, F., Bamberger, H. J., Rowen, T., Sammons, K., & Suarez, A. (2000). Connect to standards 2000: Making the standards work at grade 2. Chicago: Creative Publications.
Geary, D. C., Bailey, D., & Hoard, M.K. (2009). Predicting mathematical achievement and mathematical learning disability with a simple screening tool. Journal of Psychoeducational Assessment, 27, 265-279.
Geary, D. Hoard, M. K., Nugent, L, Byrd-Craven, J. (2008). Development of number line representations in children with mathematical learning disability. Developmental Neuropsychology, 33 (3), 277-299.
Girelli, L, Lucangeli D, Butterworth B, (2000). The development of automaticity in accessing number magnitude. Journal of Experimental Child Psychology, 76(2):104-122.
35 © Hess, Karin K., (Ed.) December 2010. Learning Progressions Frameworks Designed for Use with the Common Core State Standards in Mathematics K-12. National Alternate
Assessment Center at the University of Kentucky and the National Center for the Improvement of Educational Assessment, Dover, N.H. (updated- v.3)
Hess, K. (February, 2010). Using learning progressions to monitor progress across grades: A science inquiry learning profile for PreK-4. In Science & Children,
47 (6), 57-61. Hess, K. (2009). A science inquiry learning profile for PreK-4.Available [on line] http://www.nciea.org/publications/ScienceProfile_KH08.pdf. Hess, K. (2008). “Developing and using learning progressions as a schema for measuring progress.” [online] available:
http://www.nciea.org/publications/CCSSO2_KH08.pdf. Hess, K. Burdge, M., & Clayton, J. (2011). Challenges to developing alternate assessments. In M. Russell (Ed.), Assessing students in the margins: Challenges,
strategies, and techniques (pp. 171-213). Charlotte, NC: Information Age Publishing. Huang, Y. T., Spelke, E., & Snedekar, J. (2010). When is four far more than three? Children’s generalization of newly acquired number words. Psychological
Science, 21 (4), 600-606. Institute of Education Sciences (IES). (2010). Developing effective fractions instruction for Kindergarten through 8th grade. Retrieved [on line] September 2010:
http://ies.ed.gov/ncee/wwc/pdf/practiceguides/fractions_pg_093010.pdf ) Jordan, N. & Hanich, L. (2003). Characteristics of children with moderate mathematical deficiencies: A longitudinal perspective. Learning Disabilities Research
& Practice, 18(4), 213-221. Jordan, N. C., Kaplan, D., Ramieneni, C., & Locunial, M. N. (2009). Early math matters: Kindergarten number competence and later mathematics outcomes.
Developmental Psychology (Vol. 45, No. 3. 850-867). Kaminski, J. A., Sloutsky V. M., & Heckler A. F. (2008). Learning theory. The advantage of abstract examples in learning math. Science. 320, 454-455. Locuniak, M.N. & Jordan, N.C. (2008). Using kindergarten number sense to predict calculation fluency in second grade. Journal of Learning Disabilities, 41(5),
451-459. Lehrer, R., Jacobson, C., Kemeny, V. & Strom, D. (1999). Building on children’s intuitions to develop mathematical understanding of space. In Fennema &
Romberg (Eds), Classrooms that promote understanding, pp 63-87. Leinwand, S. (2009). Accessible mathematics: 10 instructional shifts that raise student achievement. Portsmouth, N. H.: Heinemann. Lipkus, I. M., Samsa, G. & Rimer. B.K. (2001). General performance on a numeracy scale among highly educated samples. Medical Decision Making (21) p37-44. Ma, L. (1999). Knowing and teaching elementary mathematics: Teachers’ understanding of fundamental mathematics. Mahwah, NJ: Lawrence Erlbaum. Masters, G. & Forster, M. (1996). Progress maps. (Part of the Assessment Resource Kit) Melbourne, Australia: The Australian Council for Educational
Research, Ltd. 1-58. Mazzocco, M. M. M. & Devlin, K.T. (2008). Parts and ‘holes’: Gaps in rational number sense in children with vs. without mathematical learning disability.
Developmental Science. 11:681-691. Mazzocco, M. M. M., Feigenson, L., & Halbera, J. (2010) Impaired acuity of the approximate number system underlies mathematical learning disability. Child
Development (in press). Murphy, M. M. & Mazzocco M. M. M. (2008). Mathematics learning disability in girls with fragile X or Turner syndrome during late elementary school.
Journal of Learning Disabilities. 41:29-46. National Council of Teachers of Mathematics. (2000). Principles and standards for school mathematics. Reston, VA: National Council of Teachers of
Mathematics. National Council of Teachers of Mathematics. (2006). Curriculum focal points for prekindergarten through grade 8 mathematics: A quest for coherence. Reston,
VA: National Council of Teachers of Mathematics. National Mathematics Advisory Panel. Foundations for success: The final report of the national mathematics advisory panel. U.S. Department of Education:
Washington, DC, 2008. National Research Council (2001). Kilpatrick, Swaford, & Findell (Eds). Adding it up: Helping children learn mathematics. Washington, D.C. National
Academies Press. National Research Council (2009). Mathematics learning in early childhood: Paths toward excellence and equity. Cross, C. T., Woods, T. A., & Schweingruber,
H. (Eds). Committee on Early Childhood Mathematics, Washington, D.C. National Academies Press. National Research Council. (2005). How students learn: Mathematics in the classroom. Washington, D.C. National Academies Press.

36 © Hess, Karin K., (Ed.) December 2010. Learning Progressions Frameworks Designed for Use with the Common Core State Standards in Mathematics K-12. National Alternate
Assessment Center at the University of Kentucky and the National Center for the Improvement of Educational Assessment, Dover, N.H. (updated- v.3)
National Research Council. (2001). Knowing what students know: The science and design of educational assessment. Committee on the Foundations of
Assessment. J. Pelligrino, N. Chudowsky, & R. Glaser (Eds.), Board on Testing and Assessment, Center for Education, Division of Behavioral and Social Sciences and Education. Washington, DC: National Academy Press.
National Research Council. (July 12-August 2, 2010). A framework for science education: Preliminary public draft. Washington, DC: National Academy Press. New Zealand Department of Education (2007). The number framework. Retrieved [on line] October, 2008:
http://www.nzmaths.co.nz/numeracy/2007numPDFs/NumBk1.pdf Peters, E., Vastfjall, D, Slovie, P., Mertz, C.K., Mazzocco, K., Dickert, S. (2006). Numeracy and decision making. Psychological Science.17(5). 407-413. Petit, M., Laird, R., & Marsden, E. (2010). A focus on fractions: Bringing research to the classroom. NY, NY: Routledge Press. Ramini , G. B., & Siegler, R. (2008). Promoting broad and stable improvements in low-income children’s numerical knowledge through playing number board
games. Child Development, 79 (2), 375–394. Rose, C., Minton, L., Arline, C. (2007). Uncovering student thinking in mathematics. Thousand Oaks, CA: Corwin Press. Sarama, J. & Clements, D.H. (2009). Early childhood mathematics: Education research learning trajectories for young children; Routledge. Siegler, R. (2009). Improving the numerical understanding of children from low income families, Child Development Perspectives, 3 (2), 118-124. Siegler, R., Carpenter, T., Fennell, F., Geary, D., Lewis, J., Okamoto, Y., Thompson, L., & Wray, J. (2010). Developing effective fractions instruction for
kindergarten through 8th grade: A practice guide (NCEE #2010-4039). Washington, DC: National Center for Education Evaluation and Regional Assistance, Institute of Education Sciences, U.S. Department of Education. Retrieved from whatworks.ed.gov/ publications/practiceguides. http://ies.ed.gov/ncee/wwc/pdf/practiceguides/fractions_pg_093010.pdf
Sophian, C. (2004). Mathematics for the future: Developing a Head Start curriculum to support mathematics learning. Early Childhood Education Quarterly, 19, 59-81.
State of Victoria, Department of Education and Early Childhood Development. Victoria, Australia [online] available: Mathematics Learning Progression: http://www.education.vic.gov.au/studentlearning/teachingresources/maths/mathscontinuum/default.htm
Thompson, C. A, & Siegler, R. (2010). Linear numerical-magnitude representations aid children’s memory for numbers, Psychological Science, 21 (9), 1275-1281.
Uttal, D. H., Scudder, K. V., & DeLoache, J. S. (1997). Manipulatives as symbols: A new perspective on the use of concrete objects to teach mathematics. Journal of Applied Developmental Psychology, 18, 37-54.
Wilson, M. & Bertenthal, M. (Eds.). (2005). Systems for state science assessment. Board on Testing and Assessment, Center for Education, National Research Council of the National Academies. Washington, DC: National Academies Press.
Wiggins, G. & McTighe, J. (2005). Understanding by design. Alexandria, VA: Association for Supervision and Curriculum Development.


![Unit3 progressions[1]](https://img.pdfslide.net/doc/110x75/55895f08d8b42a6d718b45a1/unit3-progressions1.jpg)