Embed Size (px)
Citation preview
Learning to Resize Image
Qi Wang, Yuan Yuan∗
Center for OPTical IMagery Analysis and Learning (OPTIMAL), State Key Laboratoryof Transient Optics and Photonics, Xi’an Institute of Optics and Precision Mechanics,
Chinese Academy of Sciences, Xi’an 710119, Shaanxi, PR China
Abstract
Content-aware image resizing has been a promising theme in the communitiesof image processing and computer vision. To the best of our knowledge, mostexisting methods for image resizing are unsupervised. These unsupervisedmethods may either fail to protect the interesting regions or cause distortionof the image structure. This paper presents a novel learning based methodfor seam carving by incorporating the learned boundary of the importantcontent. Specifically, a novel boundary model of the region of interest (ROI)is learned on a set of training images at first. Then the boundary of aninput image is utilized as a key prior in performing seam carving to obtainthe target image. The proposed method for image resizing can generatemuch less seams cutting through the ROI compared with previous effortstoward the same goal. Thus, the desirable regions can be preserved in thetarget image and the structural consistency of the input image is naturallymaintained. Experiments on two publicly available data sets demonstratethe effectiveness of the proposed method.
Keywords: image processing, machine learning, image resizing, seamcarving, boundary, saliency
1. Introduction
With the rapid development of multimedia technology, numerous digitalimages are frequently used in people’s daily life. To better share and exchange
∗Corresponding author.Email addresses: [email protected] (Qi Wang), [email protected] (Yuan Yuan)
Preprint submitted to Neurocomputing December 3, 2013
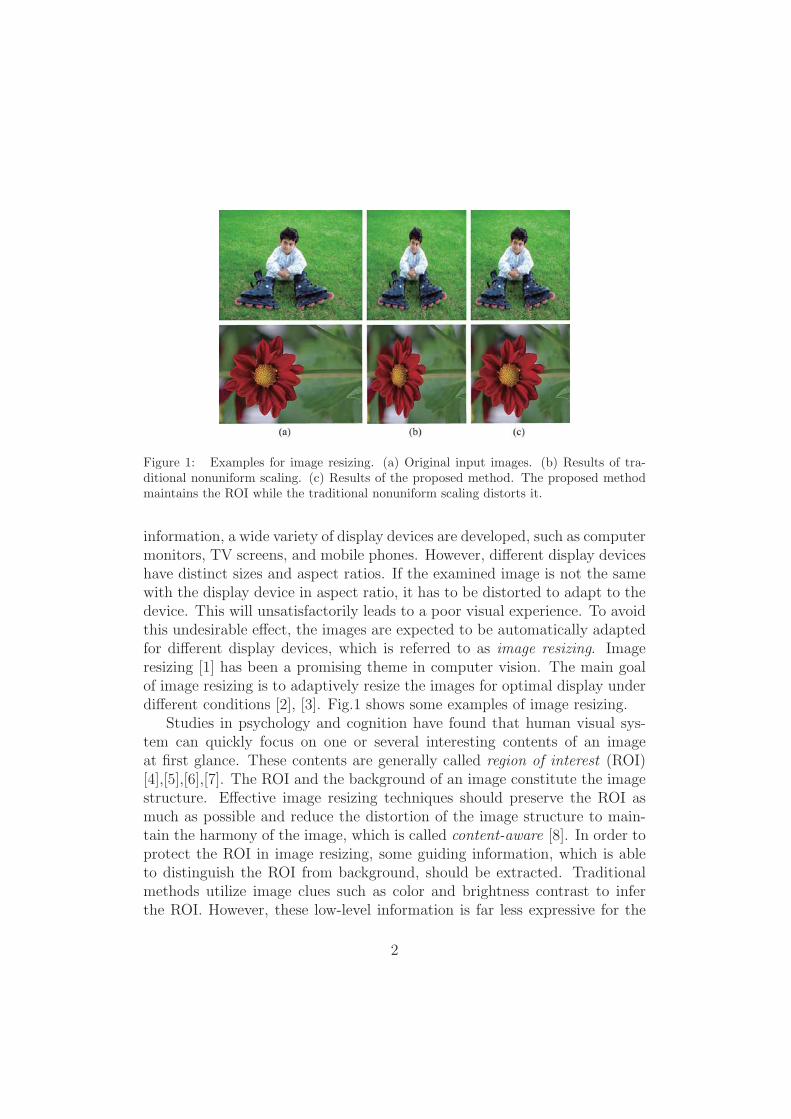
Figure 1: Examples for image resizing. (a) Original input images. (b) Results of tra-ditional nonuniform scaling. (c) Results of the proposed method. The proposed methodmaintains the ROI while the traditional nonuniform scaling distorts it.
information, a wide variety of display devices are developed, such as computermonitors, TV screens, and mobile phones. However, different display deviceshave distinct sizes and aspect ratios. If the examined image is not the samewith the display device in aspect ratio, it has to be distorted to adapt to thedevice. This will unsatisfactorily leads to a poor visual experience. To avoidthis undesirable effect, the images are expected to be automatically adaptedfor different display devices, which is referred to as image resizing. Imageresizing [1] has been a promising theme in computer vision. The main goalof image resizing is to adaptively resize the images for optimal display underdifferent conditions [2], [3]. Fig.1 shows some examples of image resizing.
Studies in psychology and cognition have found that human visual sys-tem can quickly focus on one or several interesting contents of an imageat first glance. These contents are generally called region of interest (ROI)[4],[5],[6],[7]. The ROI and the background of an image constitute the imagestructure. Effective image resizing techniques should preserve the ROI asmuch as possible and reduce the distortion of the image structure to main-tain the harmony of the image, which is called content-aware [8]. In order toprotect the ROI in image resizing, some guiding information, which is ableto distinguish the ROI from background, should be extracted. Traditionalmethods utilize image clues such as color and brightness contrast to inferthe ROI. However, these low-level information is far less expressive for the
2
ROI. The resulting resized images are usually distorted. In order to improvethis situation, a novel method based on machine learning is developed byincorporating a high-level boundary feature of the ROI as prior information.Fig.1 shows two typical examples of the proposed method compared withtraditional nonuniform scaling. Naturally, in the two images, the boy andthe flower usually attract people’s eyes at first glance. The proposed methodcan well protect these two objects, while the traditional nonuniform scalingcauses distortion of them.
The main contribution of this paper is a novel framework for image re-sizing by adopting supervised learning of high-level image information. Webelieve the incorporation of learned high-level clue is the key point to great-ly improve the performance of seam carving. For this purpose, boundaryis firstly taken as an example to illustrate the effectiveness of the proposedmethod.
The rest of the paper is organized as follows. Section 2 briefly reviews therelated work. Section 3 presents the proposed resizing method incorporatedwith detected boundary information. To verify the effectiveness and robust-ness of the proposed method, the experimental results are shown in Section4. Discussion is presented in Section 5 and conclusion is made in Section 6.
2. Related work
Traditional straightforward methods for image resizing, such as scalingand cropping, cannot generate satisfactory results. This is because they onlyconsider the constraint of display space, but ignore the image content. To bespecific, scaling may lead to distortions and produce artifacts when the as-pect ratio of the image changes, while cropping may remove interesting areasin the result owing to an unjustified criterion. To overcome these limitation-s, a number of content-aware image resizing methods have been developedto preserve the ROI and avoid distortion when modifying the image’s sizeand aspect ratio. According to the mechanism and the used methodolo-gy, these methods can be roughly classified into four categories. They arebased on content-aware cropping, segmentation, warping, and seam carving,respectively.
Content-aware cropping methods [9], [10], [11], [12] are important im-provements of the original cropping method. There are two main steps forthis kind of methods, detecting the salient portions and cropping them by
3
fixed windows. However, these methods can only be applied to specific im-ages (containing human faces or other priorly defined objects) instead ofnatural images, which limits their applicability. Segmentation based methods[9], [13], [14], [15] present a way to address the image resizing problem withsegmentation techniques. The ROI is segmented from an image at first. Thenthe background is resized to the desired size. In the end, the segmented ROIis inpainted to the renewal background. Nevertheless, these methods relyon accurate segmentation of ROI. The inaccurate segmentation may lead todistortions of ROI. Warping-based methods [16], [17], [18], [19] seek to find awarping function mapping the original image grid to the target image. Thelocal distortions of important areas are constrained to be as small as possible,while unimportant regions are allowed to distort more. However, this type ofmethods strongly depend on the definition of the warping function, as well asthe corresponding parameter selection, which is often difficult to be satisfiedin practice because different images have distinct warping requirement. Seamcarving based methods try to obtain satisfactory resizing result by removingseams of minimal importance. A seam is defined as a path of 8-connectedpixels that contains only one pixel per row or column in Avidan and Shamir[20]. The image resizing problem is actually an energy optimization problemand the dynamic programming is utilized to gracefully remove unimportan-t (low energy) seams in the image. After that, an improved seam carvingmethod is developed in the work of Rubinstein et al. [21] by replacing theprevious dynamic programming technique with graph cuts. Alternatively,an importance diffusion scheme is introduced by Cho et al. [22], aiming atemphasizing the pixels adjacent to the removed seams since the seams alsocontained context information. Although the existing seam carving basedmethods can have good performance in some cases, they may also produceseams cutting through important areas, which causes distortion and createsserious artifacts.
Though many methods have been developed to get an improved resizingresult, the critical point remains unchanged, which is how to find the objectsthat should be maintained in the resizing process. Traditional attempts tryto utilize low-level clues. However, these information has limited ability toguide the determination of important objects. Based on this consideration,saliency based clues [23], [24], [25], [26], which exhibit certain kind of high-level semantic meaning and indicate human attention, are favored recently.These clues can infer the probable salient regions and protect them fromdistortion. In this paper, the proposed method also employs the high-level
4
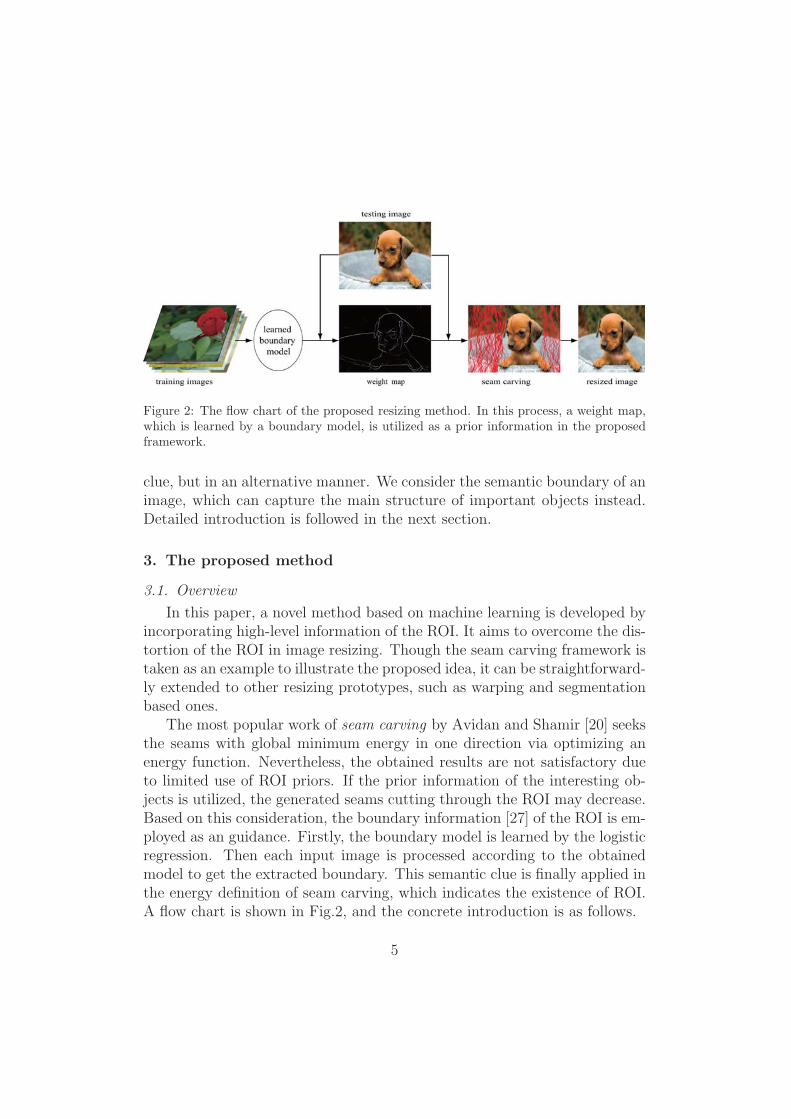
Figure 2: The flow chart of the proposed resizing method. In this process, a weight map,which is learned by a boundary model, is utilized as a prior information in the proposedframework.
clue, but in an alternative manner. We consider the semantic boundary of animage, which can capture the main structure of important objects instead.Detailed introduction is followed in the next section.
3. The proposed method
3.1. Overview
In this paper, a novel method based on machine learning is developed byincorporating high-level information of the ROI. It aims to overcome the dis-tortion of the ROI in image resizing. Though the seam carving framework istaken as an example to illustrate the proposed idea, it can be straightforward-ly extended to other resizing prototypes, such as warping and segmentationbased ones.
The most popular work of seam carving by Avidan and Shamir [20] seeksthe seams with global minimum energy in one direction via optimizing anenergy function. Nevertheless, the obtained results are not satisfactory dueto limited use of ROI priors. If the prior information of the interesting ob-jects is utilized, the generated seams cutting through the ROI may decrease.Based on this consideration, the boundary information [27] of the ROI is em-ployed as an guidance. Firstly, the boundary model is learned by the logisticregression. Then each input image is processed according to the obtainedmodel to get the extracted boundary. This semantic clue is finally applied inthe energy definition of seam carving, which indicates the existence of ROI.A flow chart is shown in Fig.2, and the concrete introduction is as follows.
5
Boundary learning. Boundary is different from traditionally known edge.An edge is most often defined as an abrupt change in some low-level imagefeatures such as brightness or color, while a boundary is a contour of high-level information that represents a change in pixel ownership from one objector surface to another. Given training images with labeled ground truth, aboundary model is learned by classical logistic regression with selected imagefeatures. The employed features are brightness, color, and texture.
Image resizing. For an input image, features are firstly extracted. Thenthe learned boundary model is employed to extract boundaries of interestingareas. After that, a weight map is calculated according to the obtainedboundary and the seams are carved by an energy minimization procedure.
3.2. Boundary learning
This section introduces the soft classification model employed in theboundary learning process. Since judging whether a pixel is a part of aboundary is actually a classification problem, a classification model is re-quired to learn a combinational rule of various image features from the train-ing data. According to [28], logistic regression model can be more easilyimplemented and has faster convergence rate than support vector machines,classification trees, density estimation, and hierarchical mixtures of experts[29]. Consequently, logistic regression is adopted for its superiority in thispaper.
In fact, logistic regression model is one of the most widely used classifiers.In statistics, it is a part of statistical models called generalized linear mod-els [30], [31]. An explanation of logistic regression begins with the logisticfunction, which is defined as:
f(X) =eX
eX + 1=
1
1 + e−X, (1)
where the variable X represents some set of independent variables, whilef(X) represents the probability of a particular output, ranging from 0 to1. The input X sometimes is the linear combination of several independentvariables. It is usually defined as:
X = α0 + α1x1 + α2x2 + α3x3 + · · ·αkxk, (2)
where xi is the independent variable.To learn these coefficients, the ground truth labeling of a pixel being on
the boundary or not is required. Then the vector of coefficients (α1, · · · , αn)
6
is learned by maximizing the likelihood with Newton-Raphson. In our ap-plication, the independent variables represent the distinct features extractedfrom images. When the relationship of those features is learned, it is usedin the model to get a predicted value for every pixel in the test images.The predicted value ranges from 0 to 1, indicating the possibility of beinga boundary. The higher the predicted value is, the more probable the pixelis in the boundary. In the following, we will explain the feature vector Xemployed in the model in detail.
3.3. Image features
With the logistic regression model discussed above, the boundary of animage can be extracted based on the image features. Brightness, color, andtexture are the most effective ones, which are used in this paper to get acontent-aware boundary. With these low-level features, a top-down priorcan be obtained. The parameters for describing these features are chosenwith respect to training data. After obtaining the image features, featurevectors are formed to train and test the classifier constructed by a logisticregression model.
3.3.1. Brightness and color
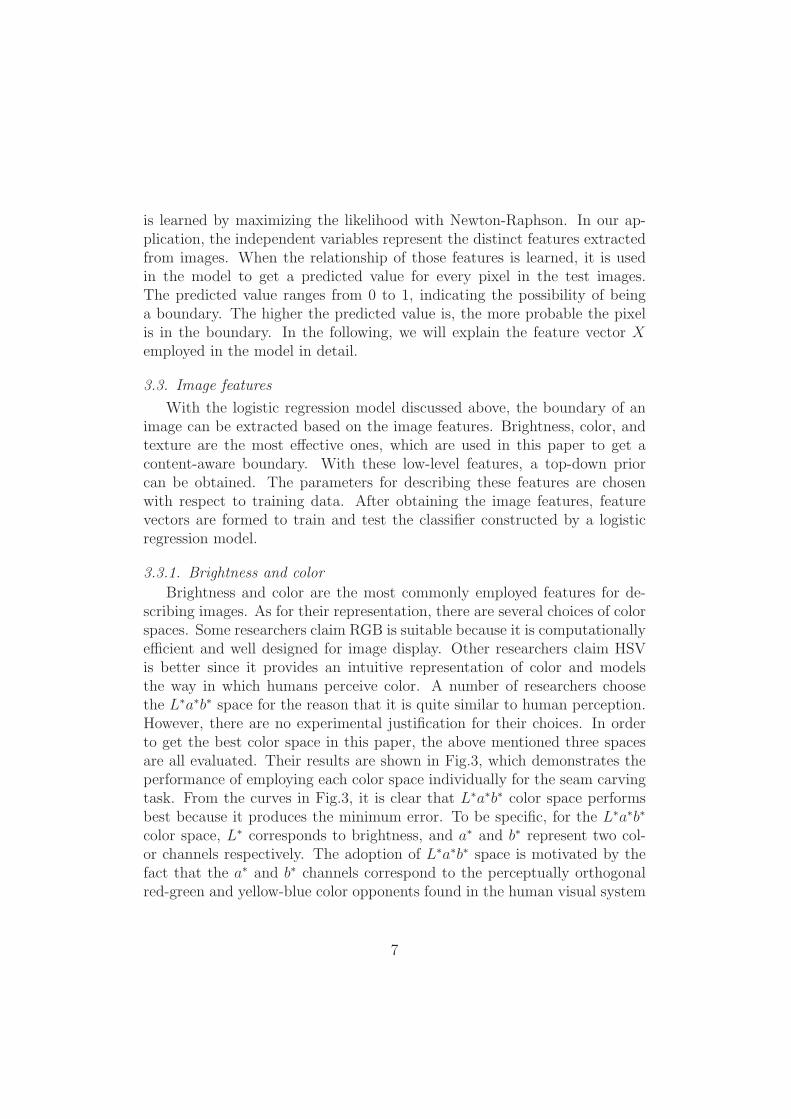
Brightness and color are the most commonly employed features for de-scribing images. As for their representation, there are several choices of colorspaces. Some researchers claim RGB is suitable because it is computationallyefficient and well designed for image display. Other researchers claim HSVis better since it provides an intuitive representation of color and modelsthe way in which humans perceive color. A number of researchers choosethe L∗a∗b∗ space for the reason that it is quite similar to human perception.However, there are no experimental justification for their choices. In orderto get the best color space in this paper, the above mentioned three spacesare all evaluated. Their results are shown in Fig.3, which demonstrates theperformance of employing each color space individually for the seam carvingtask. From the curves in Fig.3, it is clear that L∗a∗b∗ color space performsbest because it produces the minimum error. To be specific, for the L∗a∗b∗
color space, L∗ corresponds to brightness, and a∗ and b∗ represent two col-or channels respectively. The adoption of L∗a∗b∗ space is motivated by thefact that the a∗ and b∗ channels correspond to the perceptually orthogonalred-green and yellow-blue color opponents found in the human visual system
7
(see Palmer [32]). In the proposed method, L∗a∗b∗ is selected, and each im-age is converted into L∗a∗b∗ color space to compute brightness and two colorgradients.
0 <5% <10% <20% <30% <100%200
250
300
350
400
450
500
Error Rate
The
num
ber
of
imag
es
HSV
RGB
L*a*b*
Figure 3: A quantitative comparison of HSV, RGB, and L∗a∗b∗ color spaces. The L∗a∗b∗
achieves the lowest error rate in image resizing compared with the others.
3.3.2. Texture
Texture feature is another type of clue to express image content. Typical-ly, texture extraction involves computationally intensive expression for eachpixel [33]. One of the most widely used way to describe texture is to projectthe image intensity to a basis function set. Since each function in the basisfunction set is in a different frequency domain, the projection is referred to asspectral decomposition [34]. Then the image texture can be represented bythose basis functions. The coefficients projected onto those basis functionscorrespond to the energy of the texture in a specific scale and orientation.
One typical form for the basis function set is a series of filters, whichis often called a filter bank. Approaches in various literatures have beenproposed to convolve images with a bank of linear spatial filters with respectto different orientations and spatial frequencies [35], [34], [36]. In this paper,the oriented filter bank is based on a Gaussian derivative and its Hilberttransform. The use of the Hilbert transform instead of a first derivative
8
0 1 2 3 4 5 6 7 8 9 10 11 12 13 14 15 16 17 18 19 20 21 22 23 24
0.094
0.095
0.096
0.097
0.098
Err
or
Rate
Dimension(PCA)16 32 48 64 80 96 112 128
0
0.094
0.095
0.096
0.097
0.098
Err
or
Rate
Cluster number(PCA)
0 1 2 3 4 5 6 7 8 9 10 11 12 13 14 15 16 17 18 19 20 21 22 23 24
0.094
0.095
0.096
0.097
0.098
Err
or
Rate
Dimension(LPP)
16 32 48 64 80 96 112 1280
0.094
0.095
0.096
0.097
0.098
Err
or
Rat
e
Cluster number(LPP)
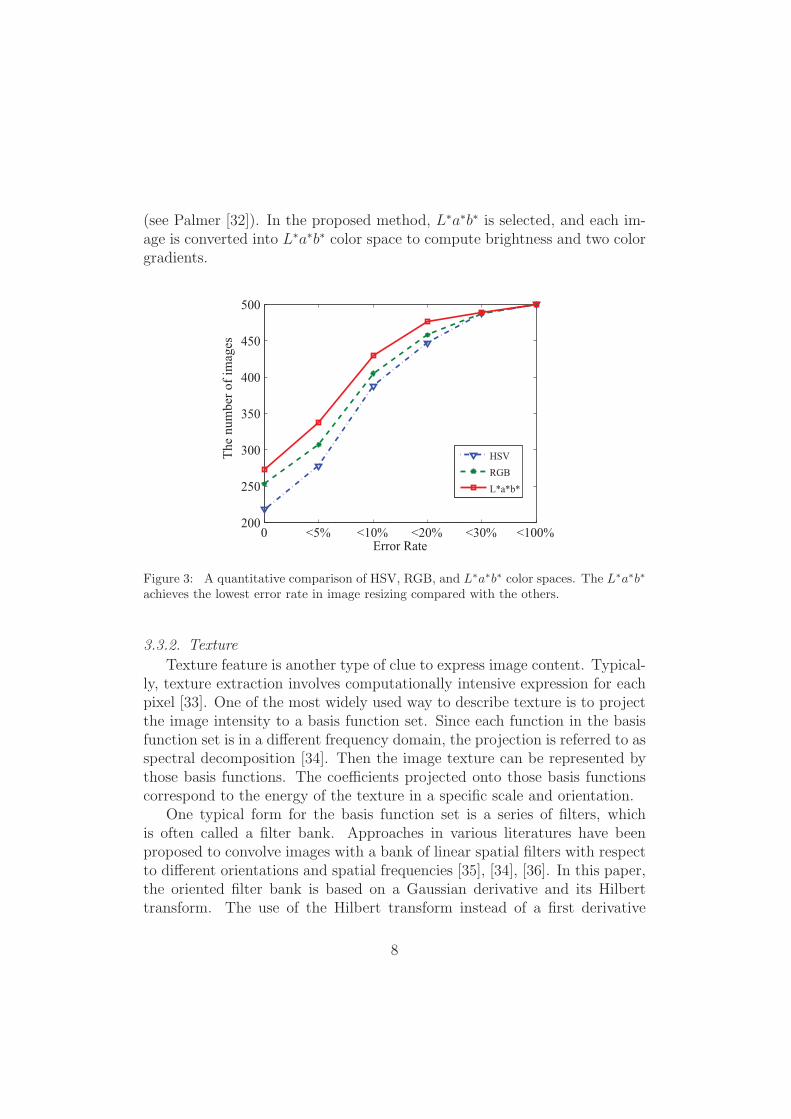
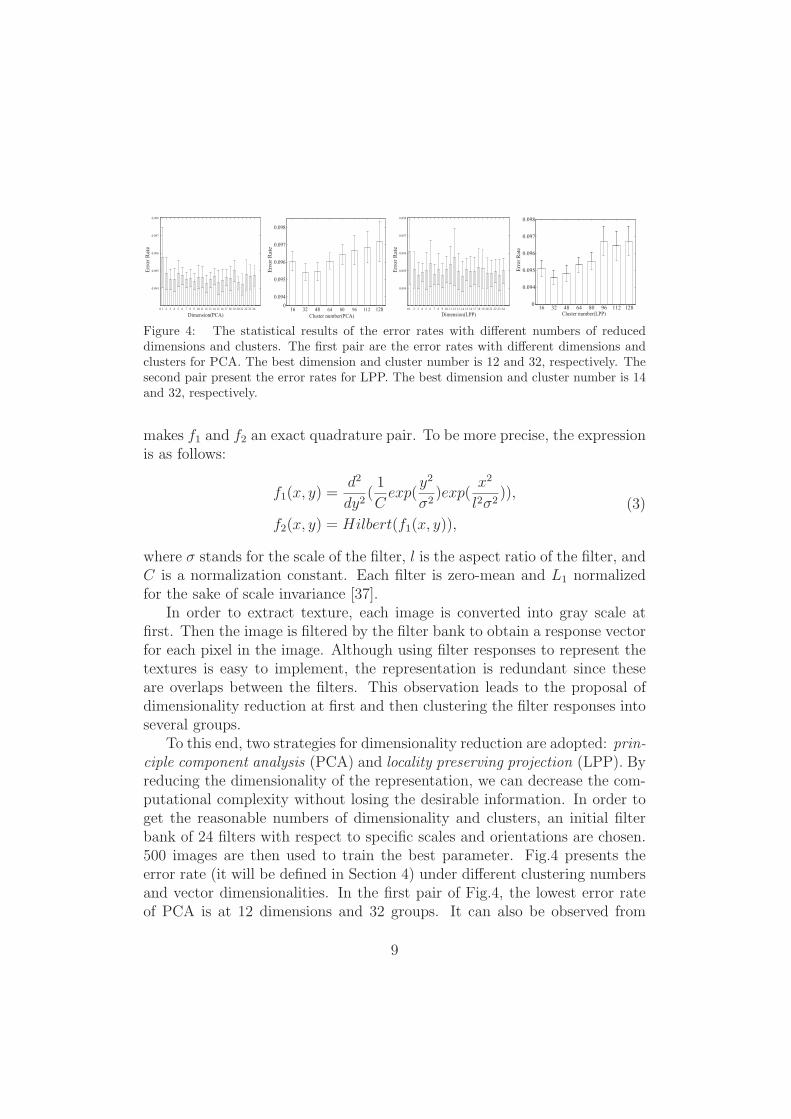
Figure 4: The statistical results of the error rates with different numbers of reduceddimensions and clusters. The first pair are the error rates with different dimensions andclusters for PCA. The best dimension and cluster number is 12 and 32, respectively. Thesecond pair present the error rates for LPP. The best dimension and cluster number is 14and 32, respectively.
makes f1 and f2 an exact quadrature pair. To be more precise, the expressionis as follows:
f1(x, y) =d2
dy2(1
Cexp(
y2
σ2)exp(
x2
l2σ2)),
f2(x, y) = Hilbert(f1(x, y)),
(3)
where σ stands for the scale of the filter, l is the aspect ratio of the filter, andC is a normalization constant. Each filter is zero-mean and L1 normalizedfor the sake of scale invariance [37].
In order to extract texture, each image is converted into gray scale atfirst. Then the image is filtered by the filter bank to obtain a response vectorfor each pixel in the image. Although using filter responses to represent thetextures is easy to implement, the representation is redundant since theseare overlaps between the filters. This observation leads to the proposal ofdimensionality reduction at first and then clustering the filter responses intoseveral groups.
To this end, two strategies for dimensionality reduction are adopted: prin-ciple component analysis (PCA) and locality preserving projection (LPP). Byreducing the dimensionality of the representation, we can decrease the com-putational complexity without losing the desirable information. In order toget the reasonable numbers of dimensionality and clusters, an initial filterbank of 24 filters with respect to specific scales and orientations are chosen.500 images are then used to train the best parameter. Fig.4 presents theerror rate (it will be defined in Section 4) under different clustering numbersand vector dimensionalities. In the first pair of Fig.4, the lowest error rateof PCA is at 12 dimensions and 32 groups. It can also be observed from
9
the second pair that the lowest error rate of LPP is at 14 dimensions and 32groups. As a result, the best number of cluster is 32 in both Euclidean spaceand manifold space. However, the best dimensions for PCA and LPP aredifferent. The experimental results also show that the error rates by the twodifferent dimension reduction methods are similar. Consequently, the linearspace is preferred in the proposed method.
3.4. The resizing methodology
The general resizing procedure employs gradients as the indication of ROIto be preserved. The involved energy definition is usually as follows
eg(x, y) = | ∂∂x
I(x, y)|+ | ∂∂y
I(x, y)|, (4)
where eg(x, y) represents the energy value at (x, y), and I is the gray scaleof the image. Greater value means larger possibility of being an importantobject. But this low-level clue is not capable enough to serve as guidance,which leads to distortions and serious artifacts. In the proposed method, Iis the boundary map extracted from the original image. Assume that theimage width needs to be reduced. The cost of removing a seam is definedas E(s) =
∑ni=1 e(si), where si is the ith pixel in a vertical seam, and n
is the number of pixels in vertical direction. If a seam passes through theboundary, the energy function will become larger. The optimal seam s∗ canbe obtained by minimizing this energy function:
s∗ = argminsE(s) = argmin
s
n∑
i=1
e(si). (5)
4. Experiments
In this section, several experiments are conducted to evaluate the per-formance of the proposed method for image resizing. Firstly, the employeddata sets are introduced. Then the evaluation metrics are established to geta quantitative measure. In the end, the experimental results are analyzed indetail.
10
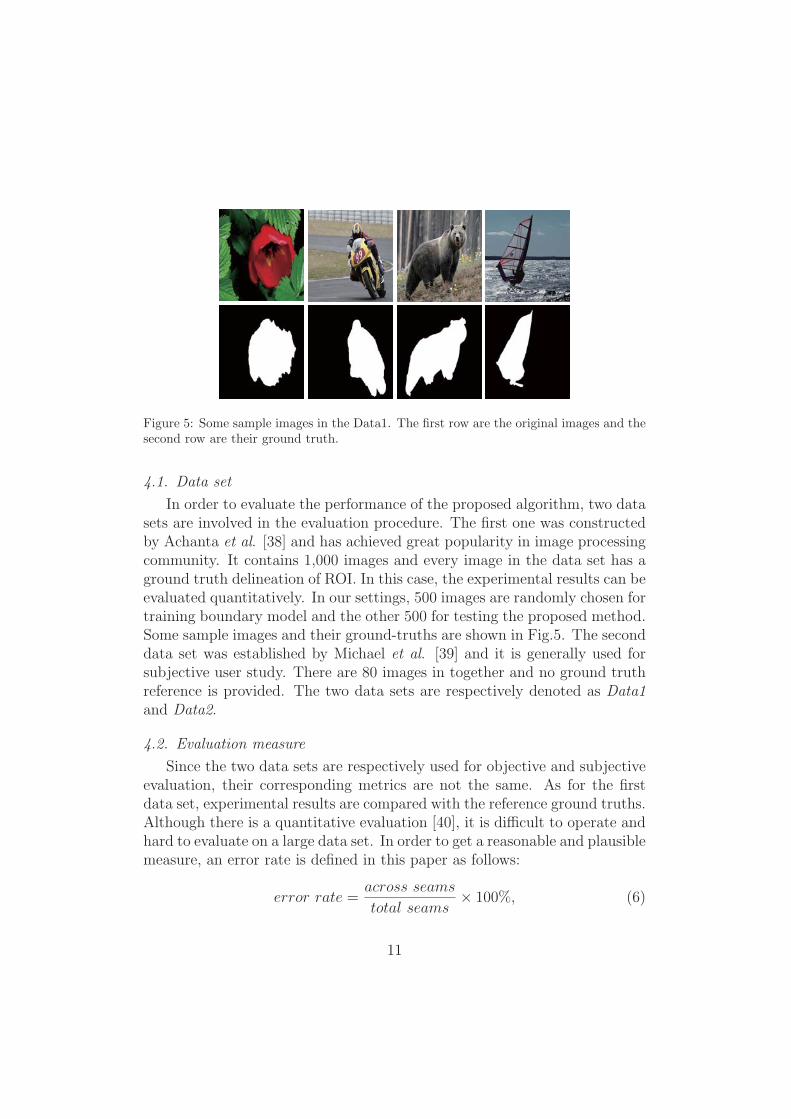
Figure 5: Some sample images in the Data1. The first row are the original images and thesecond row are their ground truth.
4.1. Data set
In order to evaluate the performance of the proposed algorithm, two datasets are involved in the evaluation procedure. The first one was constructedby Achanta et al. [38] and has achieved great popularity in image processingcommunity. It contains 1,000 images and every image in the data set has aground truth delineation of ROI. In this case, the experimental results can beevaluated quantitatively. In our settings, 500 images are randomly chosen fortraining boundary model and the other 500 for testing the proposed method.Some sample images and their ground-truths are shown in Fig.5. The seconddata set was established by Michael et al. [39] and it is generally used forsubjective user study. There are 80 images in together and no ground truthreference is provided. The two data sets are respectively denoted as Data1and Data2.
4.2. Evaluation measure
Since the two data sets are respectively used for objective and subjectiveevaluation, their corresponding metrics are not the same. As for the firstdata set, experimental results are compared with the reference ground truths.Although there is a quantitative evaluation [40], it is difficult to operate andhard to evaluate on a large data set. In order to get a reasonable and plausiblemeasure, an error rate is defined in this paper as follows:
error rate =across seams
total seams× 100%, (6)
11
where across seams stand for the number of seam pixels cutting through theground truth salient objects, and total seams represent the total number ofpixels in the removed or added seams. This index is useful for most of images,and can provide a fast and relatively precise evaluation.
As for the second data set, the experimental results are firstly judgedby 15 participants, each of which gives every result a score to indicate thegoodness of the resizing result. The score ranges from 1 to 5 with higherscores mean better resizing results. Then the consistence among the partic-ipants’ evaluations are justified using one form of the Intraclass CorrelationCoefficient psychological model [41], [42]. To be specific, the ICC(3, k) isemployed for the task. It measures the consistency of the k participants’mean ratings and is defined as
ICC(3, k) =bms− ems
ems, (7)
where bms represents mean square of the ratings between targets, ems meanstotal error mean square, and k(= 15) is the number of participants. Thevalues of ICC range from 0 to 1, where 0 implies no consistency and 1complete consistency.
4.3. Results on Data1
In this part, experimental results on Data1 are shown and compared withtraditional seam carving method of Avidan and Shamir [20]. All the imagesare resized horizontally to 75% width of the original size. Fig.6 demonstratessome examples of the resized images generated by the two methods. It canbe seen that in the proposed method, the seams which cut through the ROI,are much fewer than those produced by [20]. Compared with the traditionalmethod, the proposed method can preserve the ROI better. Furthermore,the images obtained by the proposed method can better blend into the back-ground and highlight the ROI. The reason for the success of the proposedmethod is mainly that the learned boundary can effectively indicate the ROIwhen removing seams. Though the traditional seam carving is also content-aware based method, it uses low-level image clues that can hardly reflect theROI information. With a higher-level prior of the boundary, the proposedmethod is superior in maintaining the ROI compared to the traditional seamcarving method.
In order to evaluate the method quantitatively, Fig.7 shows a statisti-cal result of the proposed method compared to that of the traditional one.
12
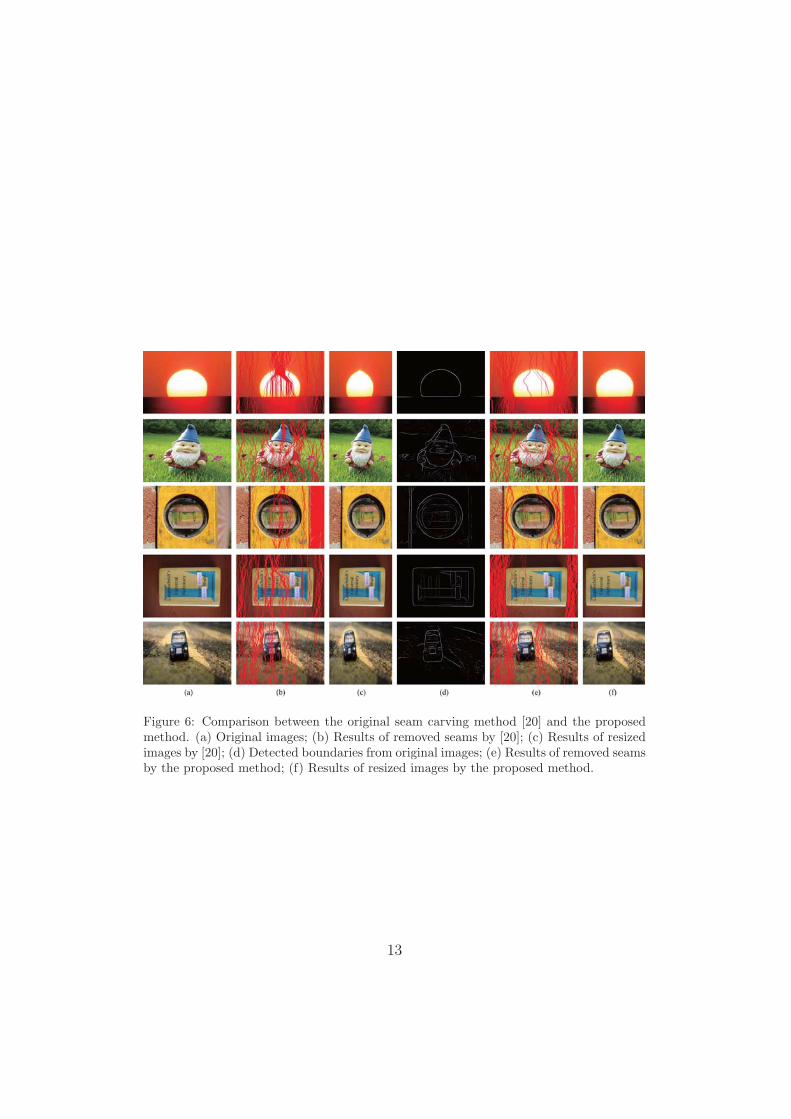
Figure 6: Comparison between the original seam carving method [20] and the proposedmethod. (a) Original images; (b) Results of removed seams by [20]; (c) Results of resizedimages by [20]; (d) Detected boundaries from original images; (e) Results of removed seamsby the proposed method; (f) Results of resized images by the proposed method.
13
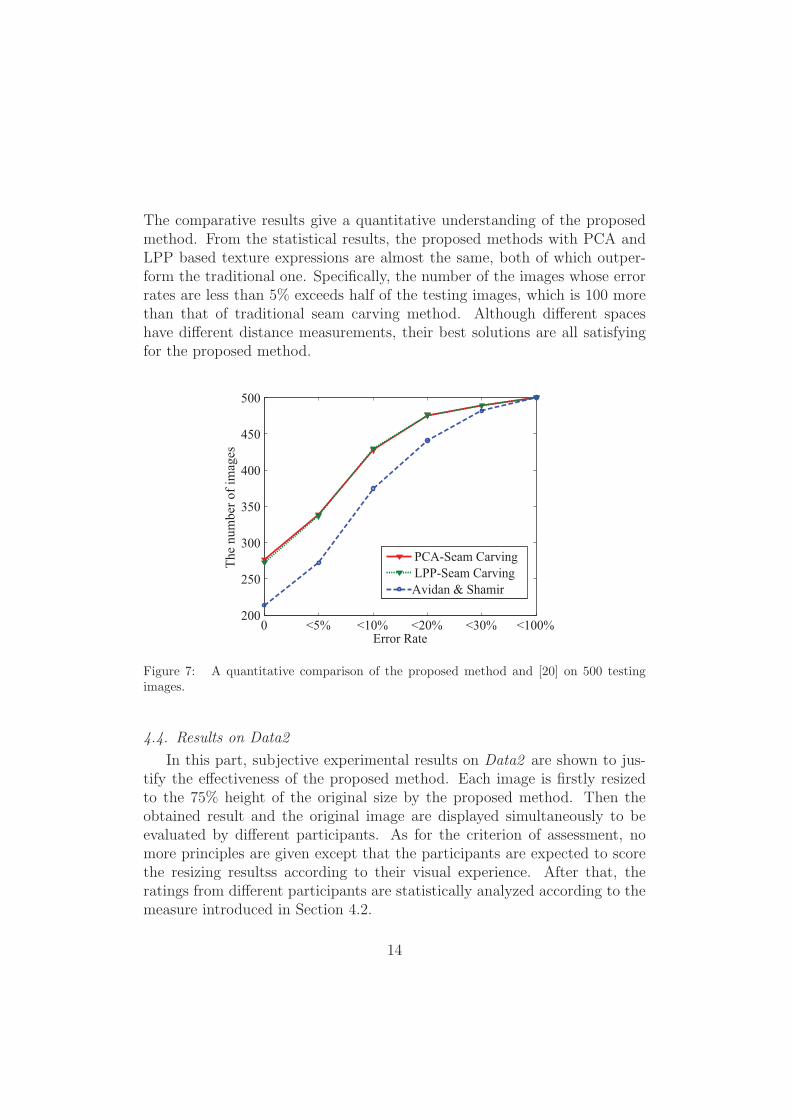
The comparative results give a quantitative understanding of the proposedmethod. From the statistical results, the proposed methods with PCA andLPP based texture expressions are almost the same, both of which outper-form the traditional one. Specifically, the number of the images whose errorrates are less than 5% exceeds half of the testing images, which is 100 morethan that of traditional seam carving method. Although different spaceshave different distance measurements, their best solutions are all satisfyingfor the proposed method.
0 <5% <10% <20% <30% <100%200
250
300
350
400
450
500
Error Rate
The
num
ber
of
imag
es
PCA-Seam Carving
LPP-Seam Carving
Avidan & Shamir
Figure 7: A quantitative comparison of the proposed method and [20] on 500 testingimages.
4.4. Results on Data2
In this part, subjective experimental results on Data2 are shown to jus-tify the effectiveness of the proposed method. Each image is firstly resizedto the 75% height of the original size by the proposed method. Then theobtained result and the original image are displayed simultaneously to beevaluated by different participants. As for the criterion of assessment, nomore principles are given except that the participants are expected to scorethe resizing resultss according to their visual experience. After that, theratings from different participants are statistically analyzed according to themeasure introduced in Section 4.2.
14
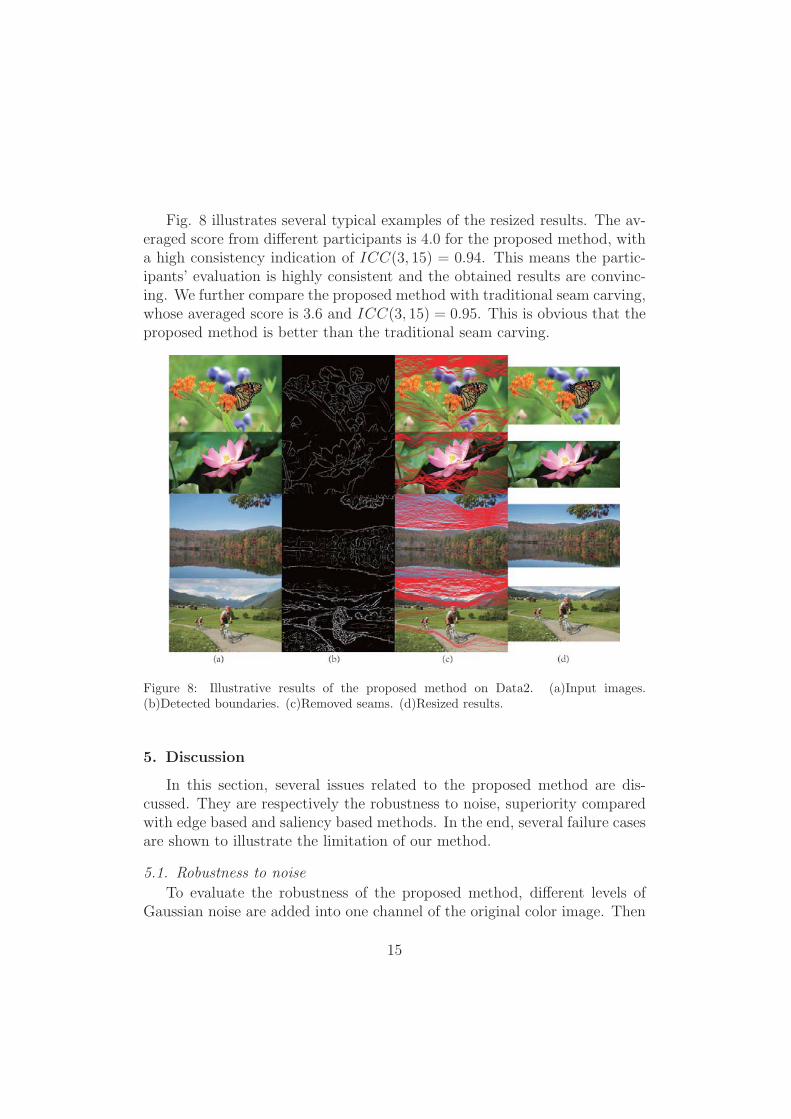
Fig. 8 illustrates several typical examples of the resized results. The av-eraged score from different participants is 4.0 for the proposed method, witha high consistency indication of ICC(3, 15) = 0.94. This means the partic-ipants’ evaluation is highly consistent and the obtained results are convinc-ing. We further compare the proposed method with traditional seam carving,whose averaged score is 3.6 and ICC(3, 15) = 0.95. This is obvious that theproposed method is better than the traditional seam carving.
Figure 8: Illustrative results of the proposed method on Data2. (a)Input images.(b)Detected boundaries. (c)Removed seams. (d)Resized results.
5. Discussion
In this section, several issues related to the proposed method are dis-cussed. They are respectively the robustness to noise, superiority comparedwith edge based and saliency based methods. In the end, several failure casesare shown to illustrate the limitation of our method.
5.1. Robustness to noise
To evaluate the robustness of the proposed method, different levels ofGaussian noise are added into one channel of the original color image. Then
15
the proposed method is applied to evaluate the resized results. The Gaussiannoises are set as 20db, 40db, 60db, 80db and 100db, respectively. Fig.9 showsthe resized results by the proposed method on the fire balloon image withdifferent levels of Gaussian noise. Recall that the resizing results using PCAand LPP are almost the same. Thus we only present the results by usingPCA. It can be easily found that there are only a few seams cutting throughthe ROI despite the influence of noise. The interesting regions in the resizedimages are all well preserved when the noise increases from 0db to 100db.The main reason for this phenomenon is that the prior information is utilizedas a weight map, which is a global information of the ROI with little influenceunder noise. This can guide the seams to bypass the ROI.
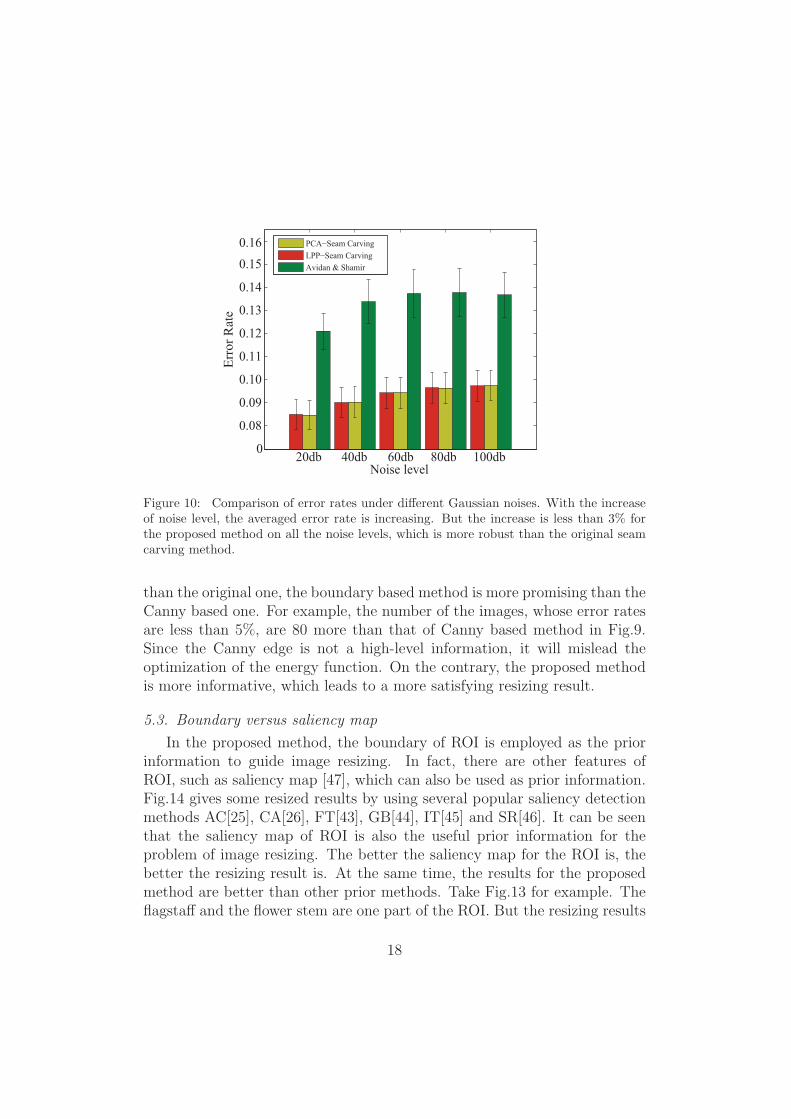
Furthermore, in order to give an accurate evaluation of the proposedmethod, the quantitative results compared with the traditional seam carv-ing method are also presented in Fig.10. Although the error rates increaseas the noise increases, the proposed method performs better than the tradi-tional seam carving. Specifically, when the noise level increases from 0db to100db, the increase of error rates is less than 3% using either PCA or LPP.This further demonstrates the robustness and effectiveness of the proposedmethod.
5.2. Boundary versus edge
In this part, the proposed boundary based method and the classical Can-ny edge based method are compared as different means of energy definition.Note that Canny detection is not a learning based method. In fact, Can-ny edges can also be interpreted as a low-level feature which indicates thechanges of pixel intensities. Fig.11 shows some typical results generated bythe proposed method and Canny based method. Similarly with previous dis-cussion, the proposed method only demonstrates PCA based results. It canbe easily observed that the proposed method achieves better performancecompared to the Canny based method. Much fewer seams cut through theROI and the the main objects are generally well preserved. But some of theresults produced by Canny based method are severely distorted, especiallythe girl image in the third row.
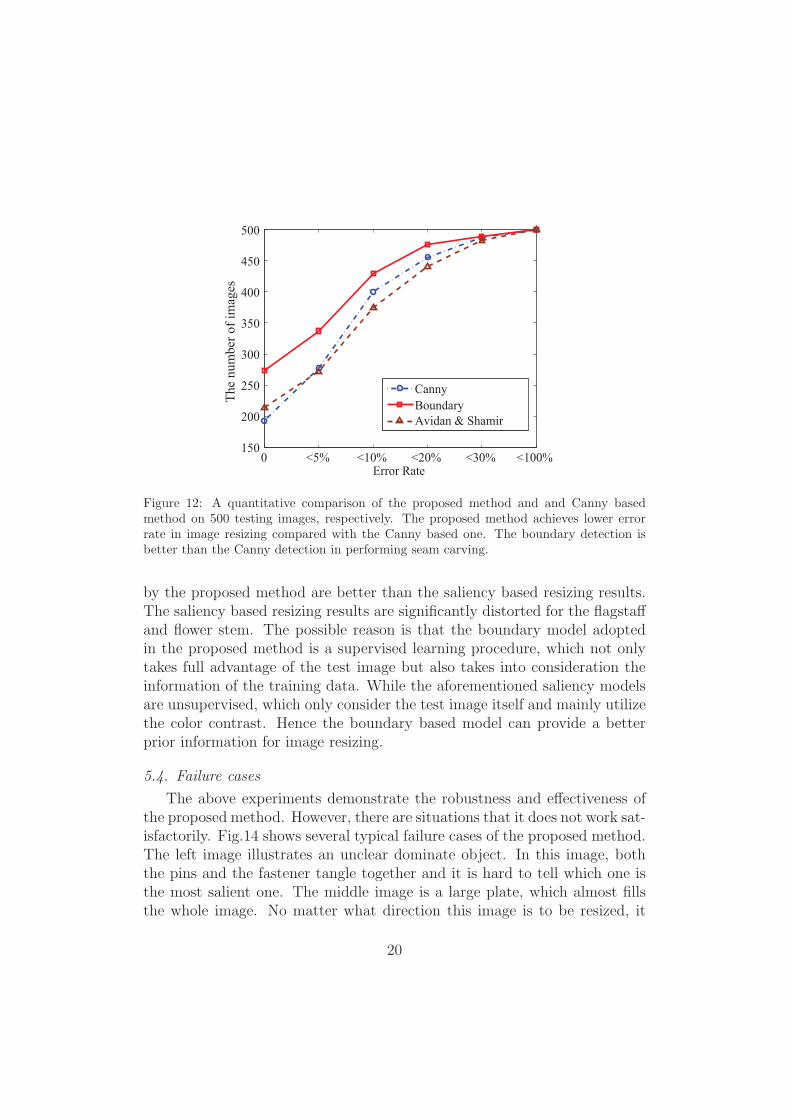
To further illustrate the effectiveness of the proposed method, statisticalresults of the two methods are presented in Fig.12. It can be found thatboth of the prior based methods can achieve better performance than theoriginal seam carving method. It means that boundary or edge is a usefulprior for image resizing. Though both the prior based methods are better
16
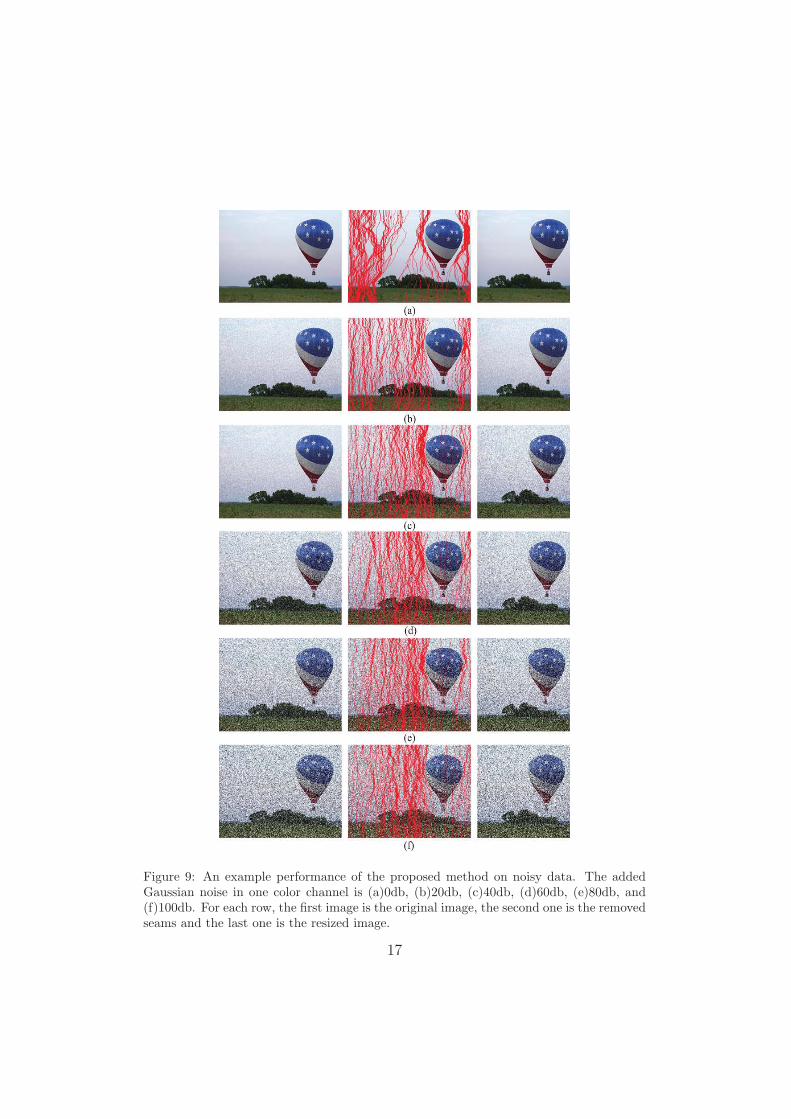
Figure 9: An example performance of the proposed method on noisy data. The addedGaussian noise in one color channel is (a)0db, (b)20db, (c)40db, (d)60db, (e)80db, and(f)100db. For each row, the first image is the original image, the second one is the removedseams and the last one is the resized image.
17
20db 40db 60db 80db 100db0
0.08
0.09
0.10
0.11
0.12
0.13
0.14
0.15
0.16
Noise level
Err
or
Rat
e
PCA−Seam Carving
LPP−Seam Carving
Avidan & Shamir
Figure 10: Comparison of error rates under different Gaussian noises. With the increaseof noise level, the averaged error rate is increasing. But the increase is less than 3% forthe proposed method on all the noise levels, which is more robust than the original seamcarving method.
than the original one, the boundary based method is more promising than theCanny based one. For example, the number of the images, whose error ratesare less than 5%, are 80 more than that of Canny based method in Fig.9.Since the Canny edge is not a high-level information, it will mislead theoptimization of the energy function. On the contrary, the proposed methodis more informative, which leads to a more satisfying resizing result.
5.3. Boundary versus saliency map
In the proposed method, the boundary of ROI is employed as the priorinformation to guide image resizing. In fact, there are other features ofROI, such as saliency map [47], which can also be used as prior information.Fig.14 gives some resized results by using several popular saliency detectionmethods AC[25], CA[26], FT[43], GB[44], IT[45] and SR[46]. It can be seenthat the saliency map of ROI is also the useful prior information for theproblem of image resizing. The better the saliency map for the ROI is, thebetter the resizing result is. At the same time, the results for the proposedmethod are better than other prior methods. Take Fig.13 for example. Theflagstaff and the flower stem are one part of the ROI. But the resizing results
18
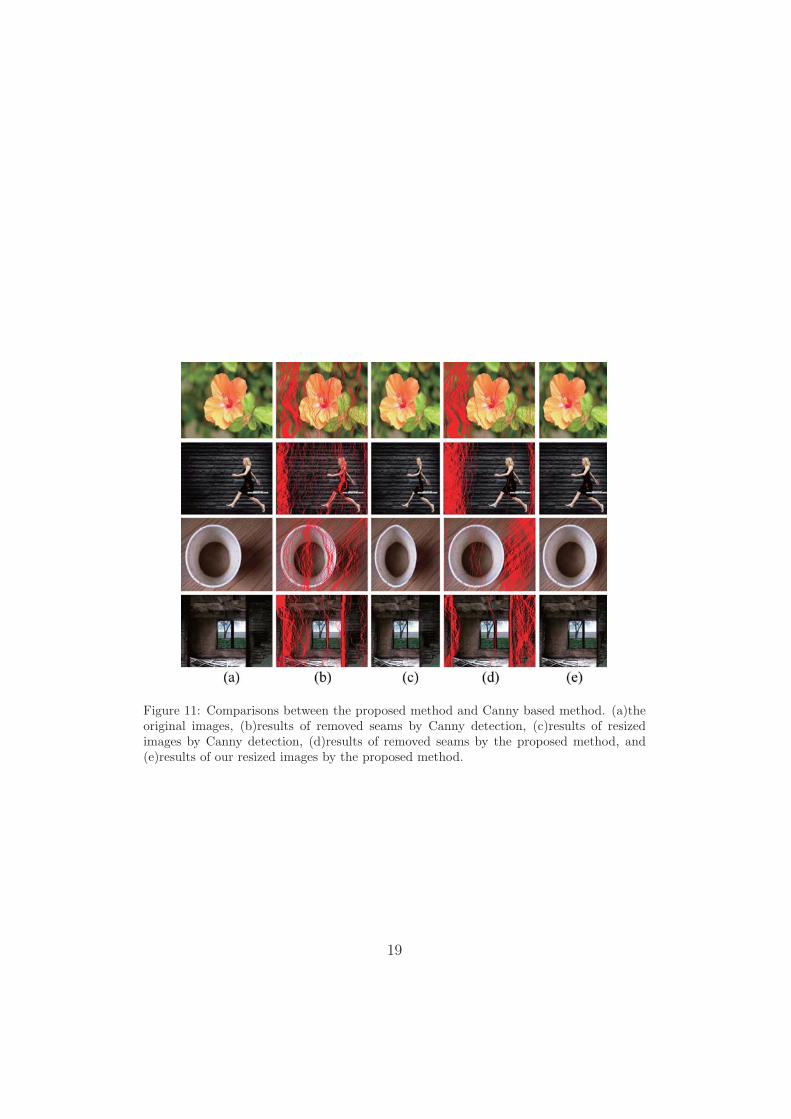
Figure 11: Comparisons between the proposed method and Canny based method. (a)theoriginal images, (b)results of removed seams by Canny detection, (c)results of resizedimages by Canny detection, (d)results of removed seams by the proposed method, and(e)results of our resized images by the proposed method.
19
0 <5% <10% <20% <30% <100%150
200
250
300
350
400
450
500
Error Rate
The
num
ber
of
imag
es
Canny
Boundary
Avidan & Shamir
Figure 12: A quantitative comparison of the proposed method and and Canny basedmethod on 500 testing images, respectively. The proposed method achieves lower errorrate in image resizing compared with the Canny based one. The boundary detection isbetter than the Canny detection in performing seam carving.
by the proposed method are better than the saliency based resizing results.The saliency based resizing results are significantly distorted for the flagstaffand flower stem. The possible reason is that the boundary model adoptedin the proposed method is a supervised learning procedure, which not onlytakes full advantage of the test image but also takes into consideration theinformation of the training data. While the aforementioned saliency modelsare unsupervised, which only consider the test image itself and mainly utilizethe color contrast. Hence the boundary based model can provide a betterprior information for image resizing.
5.4. Failure cases
The above experiments demonstrate the robustness and effectiveness ofthe proposed method. However, there are situations that it does not work sat-isfactorily. Fig.14 shows several typical failure cases of the proposed method.The left image illustrates an unclear dominate object. In this image, boththe pins and the fastener tangle together and it is hard to tell which one isthe most salient one. The middle image is a large plate, which almost fillsthe whole image. No matter what direction this image is to be resized, it
20
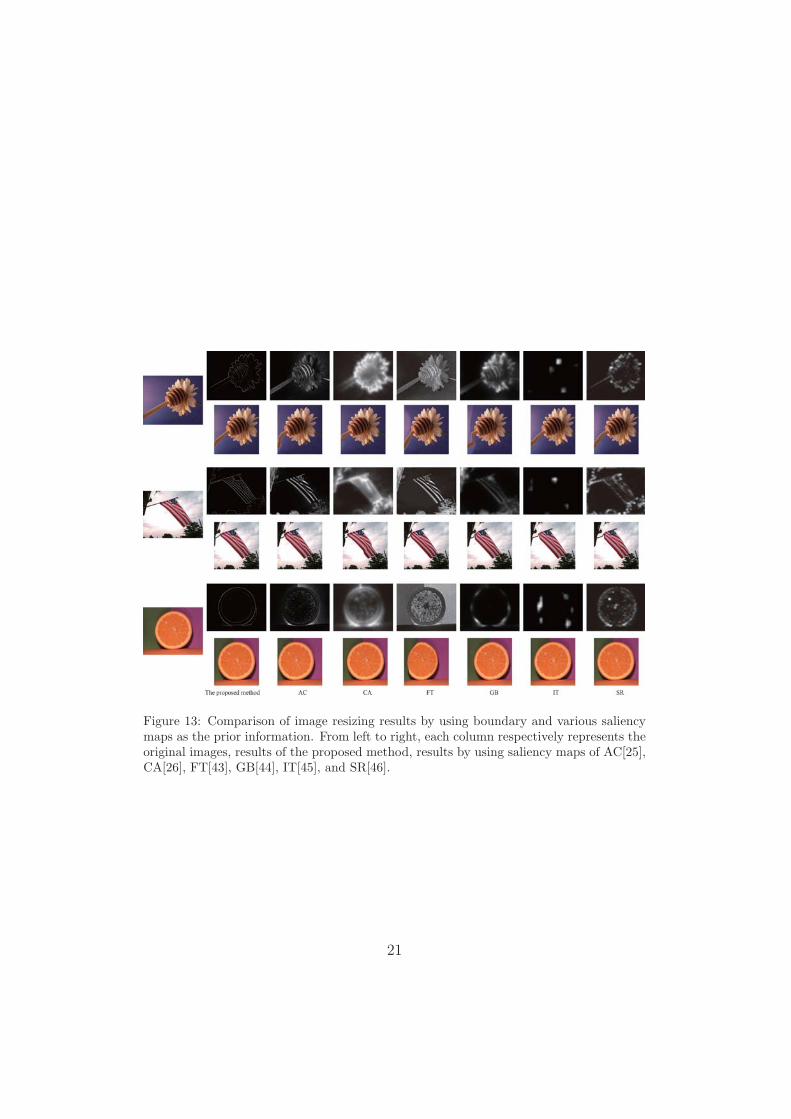
Figure 13: Comparison of image resizing results by using boundary and various saliencymaps as the prior information. From left to right, each column respectively represents theoriginal images, results of the proposed method, results by using saliency maps of AC[25],CA[26], FT[43], GB[44], IT[45], and SR[46].
21
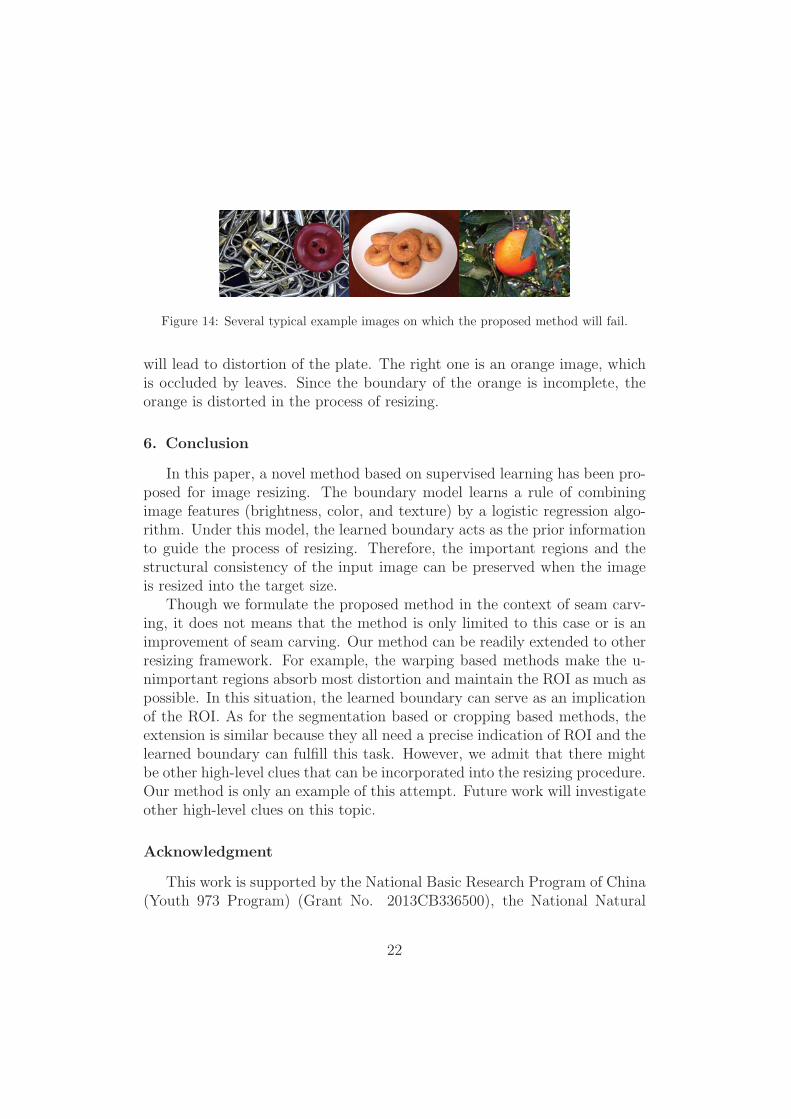
Figure 14: Several typical example images on which the proposed method will fail.
will lead to distortion of the plate. The right one is an orange image, whichis occluded by leaves. Since the boundary of the orange is incomplete, theorange is distorted in the process of resizing.
6. Conclusion
In this paper, a novel method based on supervised learning has been pro-posed for image resizing. The boundary model learns a rule of combiningimage features (brightness, color, and texture) by a logistic regression algo-rithm. Under this model, the learned boundary acts as the prior informationto guide the process of resizing. Therefore, the important regions and thestructural consistency of the input image can be preserved when the imageis resized into the target size.
Though we formulate the proposed method in the context of seam carv-ing, it does not means that the method is only limited to this case or is animprovement of seam carving. Our method can be readily extended to otherresizing framework. For example, the warping based methods make the u-nimportant regions absorb most distortion and maintain the ROI as much aspossible. In this situation, the learned boundary can serve as an implicationof the ROI. As for the segmentation based or cropping based methods, theextension is similar because they all need a precise indication of ROI and thelearned boundary can fulfill this task. However, we admit that there mightbe other high-level clues that can be incorporated into the resizing procedure.Our method is only an example of this attempt. Future work will investigateother high-level clues on this topic.
Acknowledgment
This work is supported by the National Basic Research Program of China(Youth 973 Program) (Grant No. 2013CB336500), the National Natural
22
Science Foundation of China (Grant No. 61172143, 61379094 and 61105012),and the Natural Science Foundation Research Project of Shaanxi Province(Grant No. 2012JM8024).
References
1. Vaquero, D., Turk, M., Pulli, K., Tico, M., Gelfand, N.. A surveyof image retargeting techniques. In: Proc. SPIE 7798, Applications ofDigital Image Processing XXXIII. SPIE; 2010, .
2. Ren, T., Liu, Y., Wu, G.. Image retargeting based on global energyoptimization. In: IEEE International Conference on Multimedia andExpo. 2009, p. 406–409.
3. Wang, S., Lai, S.. Fast structure-preserving image retargeting. In:IEEE International Conference on Acoustics, Speech and Signal Pro-cessing. 2009, p. 1049–1052.
4. Maybank, S.. A probabilistic definition of salient regions for imagematching. Neurocomputing 2013;120:4–14.
5. Ban, S.W., Jang, Y.M., Lee, M.. Affective saliency map consideringpsychological distance. Neurocomputing 2011;74(11):1916–1925.
6. Temporal spectral residual for fast salient motion detection. Neurocom-puting 2012;86:24–32.
7. Wang, Q., Zhu, G., Yuan, Y.. Multi-spectral dataset and its applica-tion in saliency detection. Computer Vision and Image Understanding2013;117(12):1748–1754.
8. Chen, L., Xie, X., Fan, X., Ma, W., Zhang, H., Zhou, H.. Avisual attention model for adapting images on small displays. ACMTransactions on Multimedia Systems 2003;9:353–364.
9. Ma, M., Guo, K.. Automatic image cropping for mobile device withbuilt-in camera. In: IEEE Consumer Communications and NetworkingConference. 2004, p. 710–711.
10. Suh, B., Ling, H., Bederson, B., Jacobs, W.. Automatic thumbnailcropping and its effectiveness. ACM; 2003, p. 95–104.
23
11. Amrutha, S., Shylaja, S., Natarajan, S., Balasubramanya, N.. Asmart automatic thumbnail cropping based on attention driven regoin-s of interest extraction. In: International Conference on InteractionScaences. ACM; 2009, p. 957–962.
12. Ciocca, G., Cusano, C., Gasparini, F., Schettini, R.. Self-adaptiveimage cropping for small diaplays. IEEE Transactions on ConsumerElectronics 2007;53(4):1622–1627.
13. Setlur, V., Takagi, S., Rasker, R., Gleicher, M., Gooch, B.. Au-tomic image retargeting. In: International Conference on Mobile andUbiquitous Multimedia. ACM; 2005, p. 59–68.
14. Liu, H., Jiang, S., Huang, Q., Xu, C., Gao, W.. Region-basedvisual attention analysis with its application in image browsing on smalldisplays. In: International Conference on Multimedia. ACM; 2007, p.305–308.
15. Hasan, M., Kim, C.. An automatic image browsing technique for smalldisplay users. In: International Conference on Advanced Communica-tion Technology. 2009, p. 2044–2049.
16. Liu, F., Gleicher, M.. Automatic image retargeting with fisheye-viewwarping. In: ACM symposium on User interface software and technol-ogy. 2005, p. 153–162.
17. Wang, Y., Tai, C., Sorkine, O., Lee, T.. Optimized scale-and-stretchfor image resizing. ACM Transactions on Graphics 2008;27(5).
18. Zhang, G., Cheng, M., Hu, M., Martin, R.. A shape-preserving ap-proach to image resizing. Computer Graphics Forum 2010;28(7):1897–1906.
19. Jin, Y., Liu, L., Wu, Q.. Nonhomogeneous scaling optimization forrealtime image resizing. The Visual Computer 2010;26(6-8):769–778.
20. Avidan, S., Shamir, A.. Seam carving for content-aware image resizing.ACM Transactions on Graphics 2007;26(3).
21. Rubinstein, M., Shamir, A., Avidan, S.. Improved seam carving forvideo retargeting. ACM Transactions on Graphics 2008;27(3):1–9.
24
22. Cho, S., Choi, H., Matsushita, Y., Lee, S.. Image retargeting usingimportance diffusion. In: International Conference on Image Processing.2009, p. 977–980.
23. Wang, Q., Yuan, Y., Yan, P., Li, X.. Saliency detection by multiple-instance learning. IEEE Transactions on Cybernetics 2013;43(2):660–672.
24. Wang, Q., Yuan, Y., Yan, P.. Visual saliency by selective contrast.IEEE Transactions on Circuits and Systems for Video Technology 2013;23(7):1150–1155.
25. Achanta, R., Estrada, F.J., Wils, P., Susstrunk, S.. Salient regiondetection and segmentation. Computer Vision Systems 2008;:66–75.
26. Goferman, S., Zelnik-Manor, L., Tal, A.. Context-aware saliency detec-tion. In: IEEE Conference on Computer Vision and Pattern recognition.2010, p. 2376–2383.
27. Kokkinos, I., Deriche, R., Faugeras, O., Maragos, P.. Computationalanalysis and learning for a biologically motivated model of boundarydetection. Neurocomputing 2008;71(10C12):1798–1812.
28. Martin, D., Fowlkes, C., Malik, J.. Learning to detect natural imageboundaries using local brightness, color and texture cues. IEEE Trans-actions Pattern Analysis and Machine Intelligence 2004;26(5):530–549.
29. Jordan, M.I., Jacobs, R.A.. Hierarchical mixtures of experts and theem algorithm. Neural Computation 1994;6:214–1994.
30. Friedman, J., Hastie, T., R.Tibshirani, . Additive logistic regression:a statistical view of boosting. Annals of Statistics 2000;28:377–386.
31. Schapire, R.E., Singer, Y.. Improved boosting algorithms usingconfidence-rated predictions. Machine Learning 1999;37(3):297–336.
32. Palmer, S.. Vision Science. Massachusetts Institute of TechnologyPress; 1999.
33. Zhang, H., Fritts, J.E., Goldman, S.A.. A fast texture feature ex-traction method for region-based image segmentation. In: 16th Annual
25
Symposium on Image and Video Communication and Processing ; vol.5685. 2005, .
34. Malik, J., Belongie, S., Leung, T., Shi, J.. Contour and textureanalysis for image segmentation. International Journal of ComputerVision 2001;43(1):7–27.
35. Srinivasu, P., Avadhani, P.S., Satapathy, S.C., Pradeep, T.. A mod-ified kolmogorov-smirnov correlation based filter algorithm for featureselection. Advances in Intelligent and Soft Computing 2012;132:819–826.
36. Ahonen, T., Pietikainen, M.. Image description using joint distributionof filterbank responses. Pattern Recognition Letters 2009;30(4):368–376.
37. Perona, P., Malik, J.. Detecting and localizing edges composed of steps,peaks and roofs. In: International Conference on Computer Vision.1990, p. 52–57.
38. Achanta, R., Susstrunk, S.. Saliency detection for content-aware imageresizing. In: International Conference on Image Processing. 2009, p.1005–1008.
39. Rubinstein, M., Gutierrez, D., Sorkine, O., Shamir, A.. A compara-tive study of image retargeting. ACM Transactions on Graphics (ProcSIGGRAPH Asia) 2010;29(5):160:1–160:10.
40. Ren, T., Wu, G.. Automatic image retargeting evaluation based on userperception. In: International Conference on Image Processing. 2010, p.1569–1572.
41. Shrout, P.E., Fleiss, J.L.. Intraclass correlation: Uses in assessing raterreliability. Psychology Bulletin 1979;86(2):420–428.
42. Wang, Q., Wang, Z.. A subjective method for image segmentationevaluation. In: ACCV (3). Springer; 2009, p. 53–64.
43. Achanta, R., Hemami, S., Estrada, F., Susstrunk, S.. Frequency-tunedsalient region detection. In: IEEE Conference on Computer Vision andPattern Recognition. 2009, p. 1597–1604.
26
44. Han, J., Ngan, K.N., Li, M., Zhang, H.. Unsupervised extraction ofvisual attention objects in color images. IEEE Transactions on Circuitsand Systems for Video Technology 2006;16(1):141–145.
45. Itti, L., Koch, C., Niebur, E.. A model of saliency-based visual atten-tion for rapid scene analysis. IEEE Transactions on Pattern Analysisand Machine Intelligence 1998;21(11):1254–1259.
46. Hou, X., Zhang, L.. Saliency detection: A spectral residual approach.In: IEEE Conference on Computer Vision and Pattern Recognition.2007, p. 2044–2049.
47. Wang, Q., Yan, P., Yuan, Y., Li, X.. Multi-spectral saliency detection.Pattern Recognition Letters 2013;34(1):34–41.
Qi Wang received the B.E. degree in automation and Ph.D. degree in pat-tern recognition and intelligent system from the University of Science andTechnology of China, Hefei, China, in 2005 and 2010 respectively. He iscurrently an associate professor with the Center for Optical Imagery Anal-ysis and Learning, State Key Laboratory of Transient Optics and Photon-ics, Xi’an Institute of Optics and Precision Mechanics, Chinese Academy ofSciences, Xi’an, China. His research interests include computer vision andpattern recognition.
Yuan Yuan is a full professor with the Chinese Academy of Sciences (CAS),China. Her major research interests include Visual Information Processingand Image/Video Content Analysis. She has published over a hundred pa-pers, including about 70 in reputable journals, like IEEE transactions andPattern Recognition, as well as conferences papers in CVPR, BMVC, ICIP,ICASSP, etc.
27