Embed Size (px)
Citation preview
1990
Under five mortality rate, per 1,000 live births3
Global Immunisation rate %
4
Low-incomeeconomies
(LICs)
Number of countries (2000)
Lower-middleincome
economies(LMICs)
Upper-middleincome
economies(UMICs)
High-incomeeconomies
2000 2005 2010 2014
7370
7885 86
9085
75
62
51
43
63
31
54 53
38
5653
78Number of countries (2016)
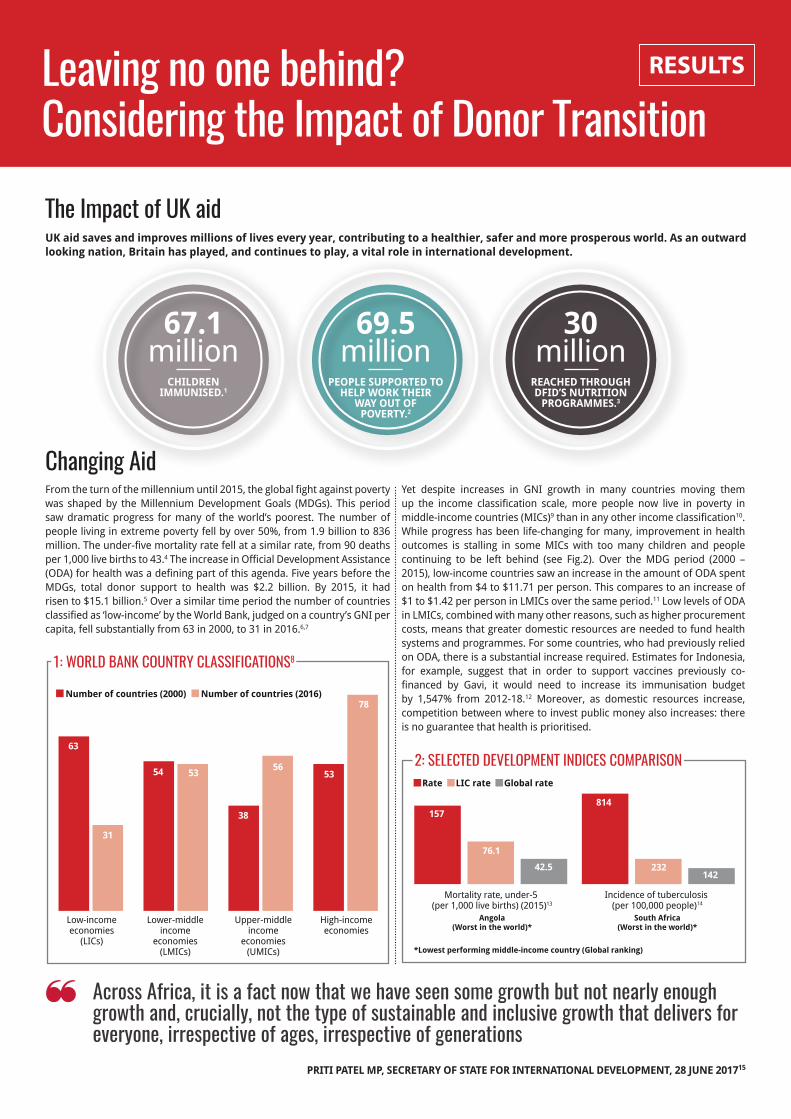
1: World Bank Country ClassifiCations8
leaving no one behind?Considering the impact of donor transition
RESULTSthe power to end poverty
the impact of uk aid
From the turn of the millennium until 2015, the global fight against poverty was shaped by the Millennium Development Goals (MDGs). This period saw dramatic progress for many of the world’s poorest. The number of people living in extreme poverty fell by over 50%, from 1.9 billion to 836 million. The under-five mortality rate fell at a similar rate, from 90 deaths per 1,000 live births to 43.4 The increase in Official Development Assistance (ODA) for health was a defining part of this agenda. Five years before the MDGs, total donor support to health was $2.2 billion. By 2015, it had risen to $15.1 billion.5 Over a similar time period the number of countries classified as ‘low-income’ by the World Bank, judged on a country’s GNI per capita, fell substantially from 63 in 2000, to 31 in 2016.6,7
Changing aid
UK aid saves and improves millions of lives every year, contributing to a healthier, safer and more prosperous world. As an outward looking nation, Britain has played, and continues to play, a vital role in international development.
Yet despite increases in GNI growth in many countries moving them up the income classification scale, more people now live in poverty in middle-income countries (MICs)9 than in any other income classification10. While progress has been life-changing for many, improvement in health outcomes is stalling in some MICs with too many children and people continuing to be left behind (see Fig.2). Over the MDG period (2000 – 2015), low-income countries saw an increase in the amount of ODA spent on health from $4 to $11.71 per person. This compares to an increase of $1 to $1.42 per person in LMICs over the same period.11 Low levels of ODA in LMICs, combined with many other reasons, such as higher procurement costs, means that greater domestic resources are needed to fund health systems and programmes. For some countries, who had previously relied on ODA, there is a substantial increase required. Estimates for Indonesia, for example, suggest that in order to support vaccines previously co-financed by Gavi, it would need to increase its immunisation budget by 1,547% from 2012-18.12 Moreover, as domestic resources increase, competition between where to invest public money also increases: there is no guarantee that health is prioritised.
across africa, it is a fact now that we have seen some growth but not nearly enough growth and, crucially, not the type of sustainable and inclusive growth that delivers for everyone, irrespective of ages, irrespective of generations
PrITI PATEL MP, SECrETAry oF STATE For INTErNATIoNAL DEvELoPMENT, 28 JUNE 201715
67.1 million
ChILDrEN IMMUNISED.1
69.5 million
PEoPLE SUPPorTED To hELP worK ThEIr
wAy oUT oF PovErTy.2
30 million
rEAChED ThroUGh DFID’S NUTrITIoN
ProGrAMMES.3
1990
Under five mortality rate, per 1,000 live births3
Global Immunisation rate %
4
Mortality rate, under-5 (per 1,000 live births) (2015)13
Angola(Worst in the world)*
Rate
Incidence of tuberculosis (per 100,000 people)16
South Africa(Worst in the world)*
2000 2005 2010 2014
7370
7885 86
9085
75
62
51
43
157
76.1
42.5
814
232142
834
LIC rate Global rate
*Lowest performing middle-income country (Global ranking)
14
2: seleCted development indiCes Comparison
case stUdy: niGeria
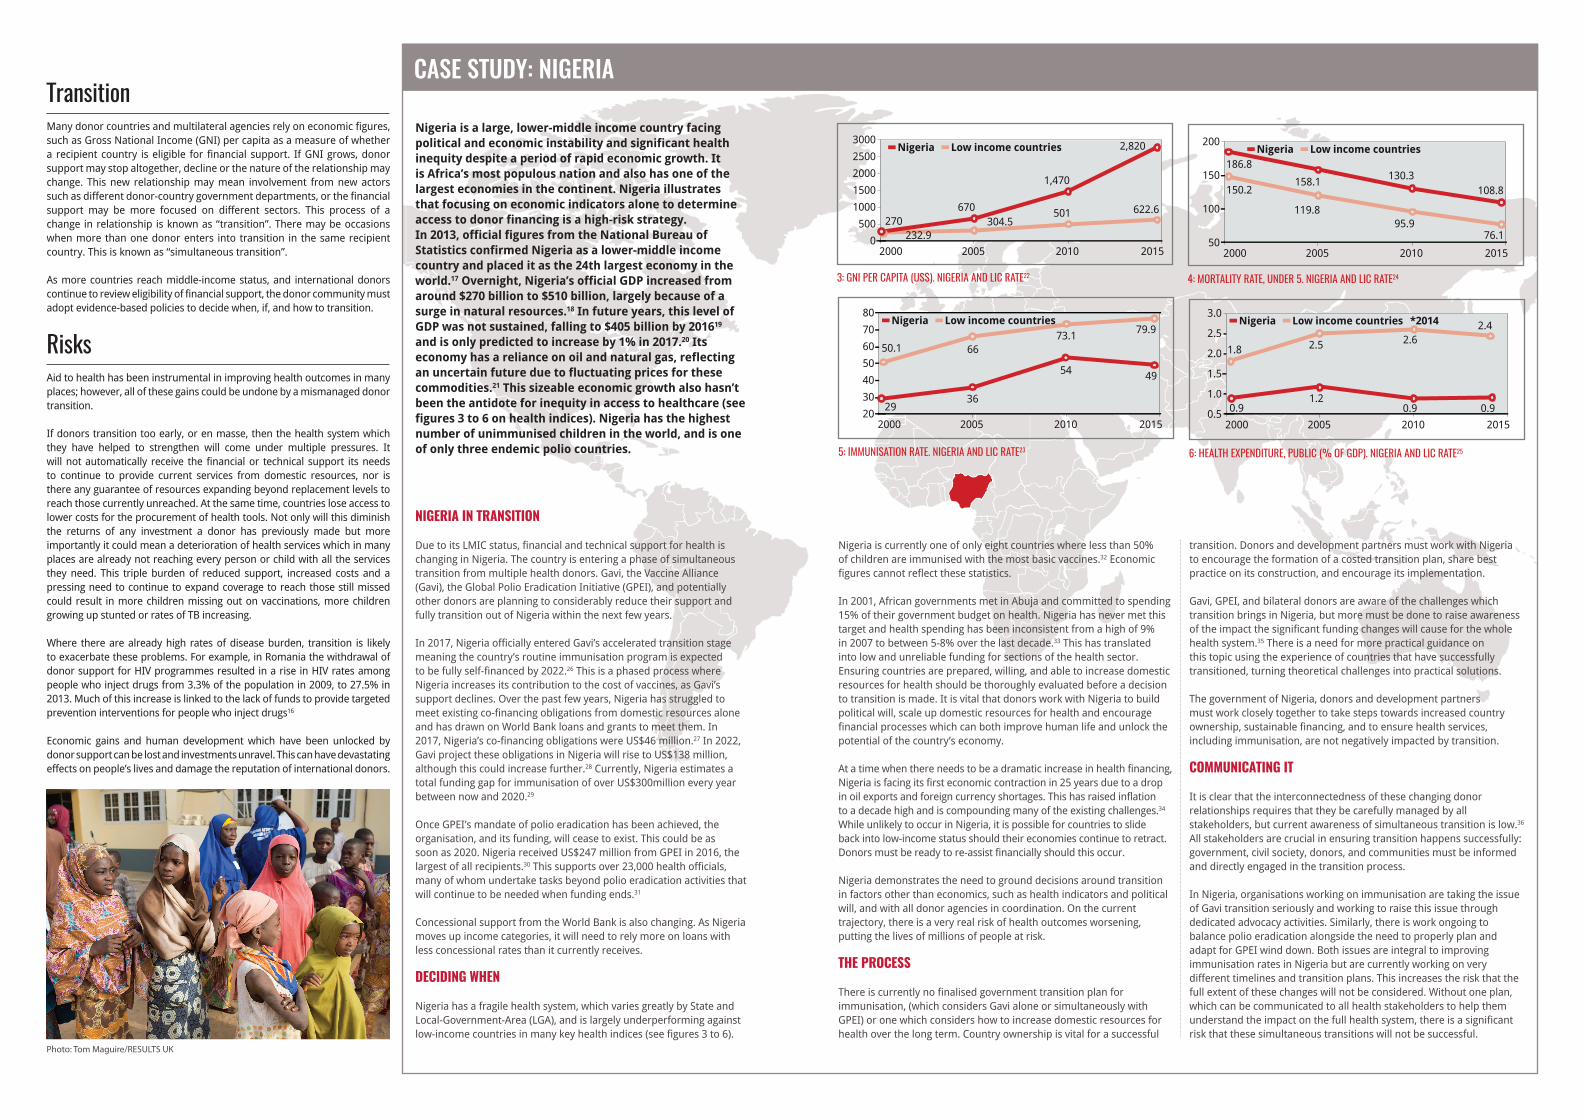
nigeria is a large, lower-middle income country facing political and economic instability and significant health inequity despite a period of rapid economic growth. it is Africa’s most populous nation and also has one of the largest economies in the continent. nigeria illustrates that focusing on economic indicators alone to determine access to donor financing is a high-risk strategy. in 2013, official figures from the national Bureau of Statistics confirmed nigeria as a lower-middle income country and placed it as the 24th largest economy in the world.17 overnight, nigeria’s official GDP increased from around $270 billion to $510 billion, largely because of a surge in natural resources.18 in future years, this level of GDP was not sustained, falling to $405 billion by 201619 and is only predicted to increase by 1% in 2017.20 its economy has a reliance on oil and natural gas, reflecting an uncertain future due to fluctuating prices for these commodities.21 this sizeable economic growth also hasn’t been the antidote for inequity in access to healthcare (see figures 3 to 6 on health indices). nigeria has the highest number of unimmunised children in the world, and is one of only three endemic polio countries.
transitionMany donor countries and multilateral agencies rely on economic figures, such as Gross National Income (GNI) per capita as a measure of whether a recipient country is eligible for financial support. If GNI grows, donor support may stop altogether, decline or the nature of the relationship may change. This new relationship may mean involvement from new actors such as different donor-country government departments, or the financial support may be more focused on different sectors. This process of a change in relationship is known as “transition”. There may be occasions when more than one donor enters into transition in the same recipient country. This is known as “simultaneous transition”.
As more countries reach middle-income status, and international donors continue to review eligibility of financial support, the donor community must adopt evidence-based policies to decide when, if, and how to transition.
risksAid to health has been instrumental in improving health outcomes in many places; however, all of these gains could be undone by a mismanaged donor transition.
If donors transition too early, or en masse, then the health system which they have helped to strengthen will come under multiple pressures. It will not automatically receive the financial or technical support its needs to continue to provide current services from domestic resources, nor is there any guarantee of resources expanding beyond replacement levels to reach those currently unreached. At the same time, countries lose access to lower costs for the procurement of health tools. Not only will this diminish the returns of any investment a donor has previously made but more importantly it could mean a deterioration of health services which in many places are already not reaching every person or child with all the services they need. This triple burden of reduced support, increased costs and a pressing need to continue to expand coverage to reach those still missed could result in more children missing out on vaccinations, more children growing up stunted or rates of TB increasing.
Where there are already high rates of disease burden, transition is likely to exacerbate these problems. For example, in Romania the withdrawal of donor support for HIV programmes resulted in a rise in HIV rates among people who inject drugs from 3.3% of the population in 2009, to 27.5% in 2013. Much of this increase is linked to the lack of funds to provide targeted prevention interventions for people who inject drugs16
Economic gains and human development which have been unlocked by donor support can be lost and investments unravel. This can have devastating effects on people’s lives and damage the reputation of international donors.
Nigeria is currently one of only eight countries where less than 50% of children are immunised with the most basic vaccines.32 Economic figures cannot reflect these statistics.
In 2001, African governments met in Abuja and committed to spending 15% of their government budget on health. Nigeria has never met this target and health spending has been inconsistent from a high of 9% in 2007 to between 5-8% over the last decade.33 This has translated into low and unreliable funding for sections of the health sector. Ensuring countries are prepared, willing, and able to increase domestic resources for health should be thoroughly evaluated before a decision to transition is made. It is vital that donors work with Nigeria to build political will, scale up domestic resources for health and encourage financial processes which can both improve human life and unlock the potential of the country’s economy.
At a time when there needs to be a dramatic increase in health financing, Nigeria is facing its first economic contraction in 25 years due to a drop in oil exports and foreign currency shortages. This has raised inflation to a decade high and is compounding many of the existing challenges.34 While unlikely to occur in Nigeria, it is possible for countries to slide back into low-income status should their economies continue to retract. Donors must be ready to re-assist financially should this occur.
Nigeria demonstrates the need to ground decisions around transition in factors other than economics, such as health indicators and political will, and with all donor agencies in coordination. On the current trajectory, there is a very real risk of health outcomes worsening, putting the lives of millions of people at risk.
The Process
There is currently no finalised government transition plan for immunisation, (which considers Gavi alone or simultaneously with GPEI) or one which considers how to increase domestic resources for health over the long term. Country ownership is vital for a successful
transition. Donors and development partners must work with Nigeria to encourage the formation of a costed transition plan, share best practice on its construction, and encourage its implementation.
Gavi, GPEI, and bilateral donors are aware of the challenges which transition brings in Nigeria, but more must be done to raise awareness of the impact the significant funding changes will cause for the whole health system.35 There is a need for more practical guidance on this topic using the experience of countries that have successfully transitioned, turning theoretical challenges into practical solutions.
The government of Nigeria, donors and development partners must work closely together to take steps towards increased country ownership, sustainable financing, and to ensure health services, including immunisation, are not negatively impacted by transition.
communicaTing iT
It is clear that the interconnectedness of these changing donor relationships requires that they be carefully managed by all stakeholders, but current awareness of simultaneous transition is low.36
All stakeholders are crucial in ensuring transition happens successfully: government, civil society, donors, and communities must be informed and directly engaged in the transition process.
In Nigeria, organisations working on immunisation are taking the issue of Gavi transition seriously and working to raise this issue through dedicated advocacy activities. Similarly, there is work ongoing to balance polio eradication alongside the need to properly plan and adapt for GPEI wind down. Both issues are integral to improving immunisation rates in Nigeria but are currently working on very different timelines and transition plans. This increases the risk that the full extent of these changes will not be considered. Without one plan, which can be communicated to all health stakeholders to help them understand the impact on the full health system, there is a significant risk that these simultaneous transitions will not be successful.
nigeria in TransiTion
Due to its LMIC status, financial and technical support for health is changing in Nigeria. The country is entering a phase of simultaneous transition from multiple health donors. Gavi, the Vaccine Alliance (Gavi), the Global Polio Eradication Initiative (GPEI), and potentially other donors are planning to considerably reduce their support and fully transition out of Nigeria within the next few years.
In 2017, Nigeria officially entered Gavi’s accelerated transition stage meaning the country’s routine immunisation program is expected to be fully self-financed by 2022.26 This is a phased process where Nigeria increases its contribution to the cost of vaccines, as Gavi’s support declines. Over the past few years, Nigeria has struggled to meet existing co-financing obligations from domestic resources alone and has drawn on World Bank loans and grants to meet them. In 2017, Nigeria’s co-financing obligations were US$46 million.27 In 2022, Gavi project these obligations in Nigeria will rise to US$138 million, although this could increase further.28 Currently, Nigeria estimates a total funding gap for immunisation of over US$300million every year between now and 2020.29
Once GPEI’s mandate of polio eradication has been achieved, the organisation, and its funding, will cease to exist. This could be as soon as 2020. Nigeria received US$247 million from GPEI in 2016, the largest of all recipients.30 This supports over 23,000 health officials, many of whom undertake tasks beyond polio eradication activities that will continue to be needed when funding ends.31
Concessional support from the World Bank is also changing. As Nigeria moves up income categories, it will need to rely more on loans with less concessional rates than it currently receives.
DeciDing when
Nigeria has a fragile health system, which varies greatly by State and Local-Government-Area (LGA), and is largely underperforming against low-income countries in many key health indices (see figures 3 to 6).
1990
Under five mortality rate, per 1,000 live births3
Global Immunisation rate %
4
2000 2005
270
2010 2015
Nigeria
2000 2005 2010 2014
7370
7885 86
9085
75
62
51
43
0
500
1000
1500
2000
2500
3000Low income countries
304.5232.9
501670
1,470
622.6
2,820
3: Gni per Capita (us$). niGeria and liC rate22
1990
Under five mortality rate, per 1,000 live births3
Global Immunisation rate %
4
2000 2005
50.1
2010 2015
Nigeria
2000 2005 2010 2014
7370
7885 86
9085
75
62
51
43
20
30
40
50
60
70
80Low income countries
3629
6673.1
49
79.9
54
5: immunisation rate. niGeria and liC rate23
1990
Under five mortality rate, per 1,000 live births3
Global Immunisation rate %
4
2000 2005
186.8
2010 2015
Nigeria
2000 2005 2010 2014
7370
7885 86
9085
75
62
51
43
50
100
150
200Low income countries
119.8
150.2
95.9
158.1 130.3
76.1
108.8
4: mortality rate, under 5. niGeria and liC rate24
1990
Under five mortality rate, per 1,000 live births3
Global Immunisation rate %
4
2000 2005
1.8
2010 2015
Nigeria
2000 2005 2010 2014
7370
7885 86
9085
75
62
51
43
0.5
1.0
1.5
2.0
2.5
3.0Low income countries *2014
1.20.9 0.9
2.5 2.6
0.9
2.4
6: HealtH expenditure, puBliC (% of Gdp). niGeria and liC rate25
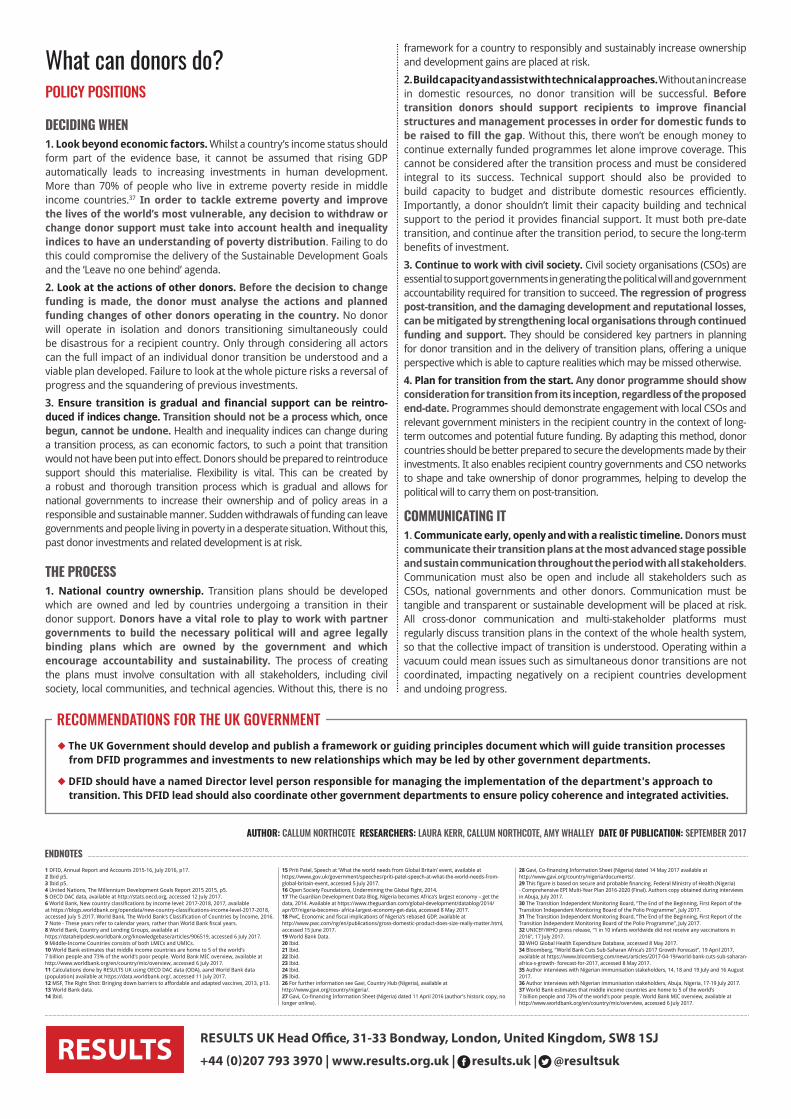
Photo: Tom Maguire/RESULTS UK
recommendations for the UK Government
What can donors do? Policy Positions DeciDing when 1. Look beyond economic factors. Whilst a country’s income status should form part of the evidence base, it cannot be assumed that rising GDP automatically leads to increasing investments in human development. More than 70% of people who live in extreme poverty reside in middle income countries.37 In order to tackle extreme poverty and improve the lives of the world’s most vulnerable, any decision to withdraw or change donor support must take into account health and inequality indices to have an understanding of poverty distribution. Failing to do this could compromise the delivery of the Sustainable Development Goals and the ‘Leave no one behind’ agenda.
2. Look at the actions of other donors. Before the decision to change funding is made, the donor must analyse the actions and planned funding changes of other donors operating in the country. No donor will operate in isolation and donors transitioning simultaneously could be disastrous for a recipient country. Only through considering all actors can the full impact of an individual donor transition be understood and a viable plan developed. Failure to look at the whole picture risks a reversal of progress and the squandering of previous investments.
3. Ensure transition is gradual and financial support can be reintro-duced if indices change. Transition should not be a process which, once begun, cannot be undone. Health and inequality indices can change during a transition process, as can economic factors, to such a point that transition would not have been put into effect. Donors should be prepared to reintroduce support should this materialise. Flexibility is vital. This can be created by a robust and thorough transition process which is gradual and allows for national governments to increase their ownership and of policy areas in a responsible and sustainable manner. Sudden withdrawals of funding can leave governments and people living in poverty in a desperate situation. Without this, past donor investments and related development is at risk.
The Process 1. National country ownership. Transition plans should be developed which are owned and led by countries undergoing a transition in their donor support. Donors have a vital role to play to work with partner governments to build the necessary political will and agree legally binding plans which are owned by the government and which encourage accountability and sustainability. The process of creating the plans must involve consultation with all stakeholders, including civil society, local communities, and technical agencies. Without this, there is no
framework for a country to responsibly and sustainably increase ownership and development gains are placed at risk.
2. Build capacity and assist with technical approaches. Without an increase in domestic resources, no donor transition will be successful. Before transition donors should support recipients to improve financial structures and management processes in order for domestic funds to be raised to fill the gap. Without this, there won’t be enough money to continue externally funded programmes let alone improve coverage. This cannot be considered after the transition process and must be considered integral to its success. Technical support should also be provided to build capacity to budget and distribute domestic resources efficiently. Importantly, a donor shouldn’t limit their capacity building and technical support to the period it provides financial support. It must both pre-date transition, and continue after the transition period, to secure the long-term benefits of investment.
3. Continue to work with civil society. Civil society organisations (CSOs) are essential to support governments in generating the political will and government accountability required for transition to succeed. The regression of progress post-transition, and the damaging development and reputational losses, can be mitigated by strengthening local organisations through continued funding and support. They should be considered key partners in planning for donor transition and in the delivery of transition plans, offering a unique perspective which is able to capture realities which may be missed otherwise.
4. Plan for transition from the start. Any donor programme should show consideration for transition from its inception, regardless of the proposed end-date. Programmes should demonstrate engagement with local CSOs and relevant government ministers in the recipient country in the context of long-term outcomes and potential future funding. By adapting this method, donor countries should be better prepared to secure the developments made by their investments. It also enables recipient country governments and CSO networks to shape and take ownership of donor programmes, helping to develop the political will to carry them on post-transition.
communicaTing iT
1. Communicate early, openly and with a realistic timeline. Donors must communicate their transition plans at the most advanced stage possible and sustain communication throughout the period with all stakeholders. Communication must also be open and include all stakeholders such as CSOs, national governments and other donors. Communication must be tangible and transparent or sustainable development will be placed at risk. All cross-donor communication and multi-stakeholder platforms must regularly discuss transition plans in the context of the whole health system, so that the collective impact of transition is understood. Operating within a vacuum could mean issues such as simultaneous donor transitions are not coordinated, impacting negatively on a recipient countries development and undoing progress.
◆ The UK Government should develop and publish a framework or guiding principles document which will guide transition processes from DFID programmes and investments to new relationships which may be led by other government departments.
◆ DFID should have a named Director level person responsible for managing the implementation of the department's approach to transition. This DFID lead should also coordinate other government departments to ensure policy coherence and integrated activities.
1 DFID, Annual Report and Accounts 2015- 16, July 2016, p17. 2 Ibid p5. 3 Ibid p5. 4 United Nations, The Millennium Development Goals Report 2015 2015, p5. 5 OECD DAC data, available at http://stats.oecd.org, accessed 12 July 2017. 6 World Bank, New country classifications by income level: 2017- 2018, 2017, available at https://blogs.worldbank.org/opendata/new- country- classifications- income- level- 2017- 2018, accessed July 5 2017. World Bank, The World Bank’s Classification of Countries by Income, 2016. 7 Note - These years refer to calendar years, rather than World Bank fiscal years. 8 World Bank, Country and Lending Groups, available at https://datahelpdesk.worldbank.org/knowledgebase/articles/906519, accessed 6 July 2017. 9 Middle- Income Countries consists of both LMICs and UMICs. 10 World Bank estimates that middle income countries are home to 5 of the world’s 7 billion people and 73% of the world’s poor people. World Bank MIC overview, available at http://www.worldbank.org/en/country/mic/overview, accessed 6 July 2017. 11 Calculations done by RESULTS UK using OECD DAC data (ODA), aand World Bank data (population) available at https://data.worldbank.org/, accessed 11 July 2017. 12 MSF, The Right Shot: Bringing down barriers to affordable and adapted vaccines, 2013, p13. 13 World Bank data. 14 Ibid.
15 Priti Patel, Speech at ‘What the world needs from Global Britain’ event, available at https://www.gov.uk/government/speeches/priti- patel- speech- at- what- the- world- needs- from- global- britain- event, accessed 5 July 2017. 16 Open Society Foundations, Undermining the Global Fight, 2014. 17 The Guardian Development Data Blog, Nigeria becomes Africa’s largest economy – get the data, 2014. Available at https://www.theguardian.com/global- development/datablog/2014/apr/07/nigeria- becomes- africa- largest- economy- get- data, accessed 8 May 2017. 18 PwC, Economic and fiscal implications of Nigeria’s rebased GDP, available at http://www.pwc.com/ng/en/publications/gross- domestic- product- does- size- really- matter.html, accessed 15 June 2017. 19 World Bank Data. 20 Ibid. 21 Ibid. 22 Ibid. 23 Ibid. 24 Ibid. 25 Ibid. 26 For further information see Gavi, Country Hub (Nigeria), available at http://www.gavi.org/country/nigeria/. 27 Gavi, Co- financing Information Sheet (Nigeria) dated 11 April 2016 (author’s historic copy, no longer online).
28 Gavi, Co- financing Information Sheet (Nigeria) dated 14 May 2017 available at http://www.gavi.org/country/nigeria/documents/. 29 This figure is based on secure and probable financing. Federal Ministry of Health (Nigeria) - Comprehensive EPI Multi- Year Plan 2016- 2020 (Final). Authors copy obtained during interviews in Abuja, July 2017. 30 The Transition Independent Monitoring Board, “The End of the Beginning, First Report of the Transition Independent Monitoring Board of the Polio Programme”, July 2017. 31 The Transition Independent Monitoring Board, “The End of the Beginning, First Report of the Transition Independent Monitoring Board of the Polio Programme”, July 2017. 32 UNICEF/WHO press release, “1 in 10 infants worldwide did not receive any vaccinations in 2016”, 17 July 2017. 33 WHO Global Health Expenditure Database, accessed 8 May 2017. 34 Bloomberg, “World Bank Cuts Sub- Saharan Africa’s 2017 Growth Forecast”, 19 April 2017, available at https://www.bloomberg.com/news/articles/2017- 04- 19/world- bank- cuts- sub- saharan- africa- s- growth- forecast- for- 2017, accessed 8 May 2017. 35 Author interviews with Nigerian immunisation stakeholders, 14, 18 and 19 July and 16 August 2017. 36 Author interviews with Nigerian immunisation stakeholders, Abuja, Nigeria, 17- 19 July 2017. 37 World Bank estimates that middle income countries are home to 5 of the world’s 7 billion people and 73% of the world’s poor people. World Bank MIC overview, available at http://www.worldbank.org/en/country/mic/overview, accessed 6 July 2017.
RESULTS UK Head Office, 31-33 Bondway, London, United Kingdom, SW8 1SJ
+44 (0)207 793 3970 | www.results.org.uk | results.uk | @resultsukRESULTSthe power to end poverty
enDnoTes
auThor: callUm northcote researchers: laUra Kerr, callUm northcote, amy Whalley DaTe of PublicaTion: sePtemBer 2017