Embed Size (px)
Citation preview
||www.ifu.ethz.ch/ESD
Coupling Scenario Analysis and MFA
Case Studies: Future metal demand and availability
11.04.2017Stefanie Hellweg 1
Lecture:
Prospective Environmental Assessments
||www.ifu.ethz.ch/ESD 11.04.2017 2Prospective Environmental Assessment: Coupling Scenario Analysis and MFA
Learning goal
1. Getting to know examples of prospective
assessments with a combined scenario analysis and
dynamic material flow analysis
2. Understanding for the case of electricity generation,
how the methods of the lecture can be applied to
• assess whether technology growth could be
limited by future resource limitations
• assess the consequences of technology use on
future metal availability
||www.ifu.ethz.ch/ESD 11.04.2017 3
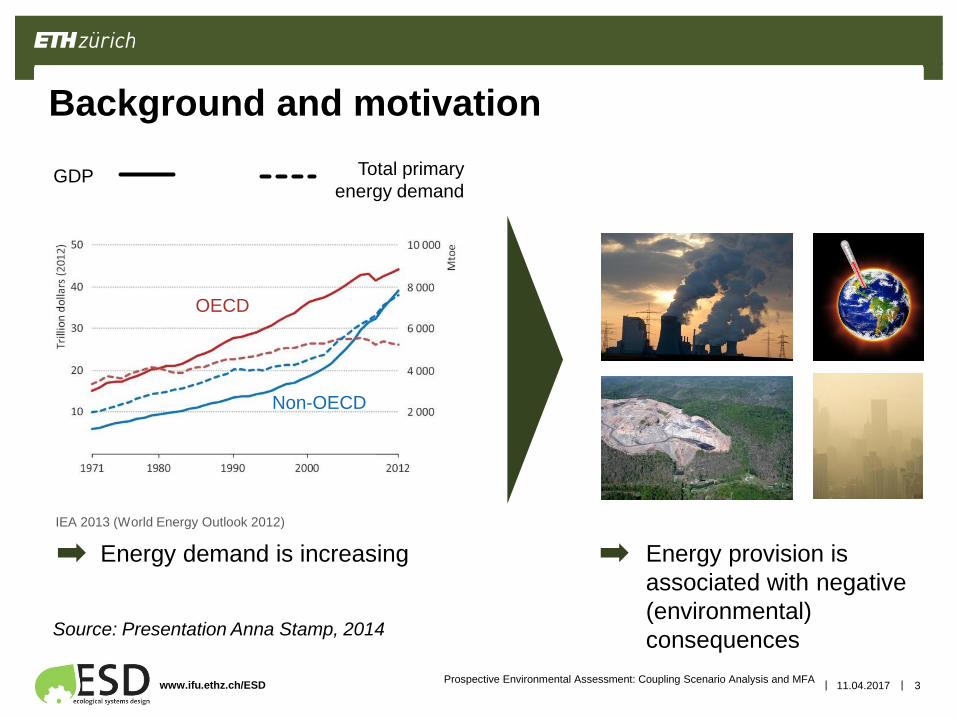
Background and motivation
IEA 2013 (World Energy Outlook 2012)
Energy demand is increasing Energy provision is
associated with negative
(environmental)
consequences
GDP Total primary
energy demand
Source: Presentation Anna Stamp, 2014
Prospective Environmental Assessment: Coupling Scenario Analysis and MFA
OECD
Non-OECD
||www.ifu.ethz.ch/ESD 11.04.2017 4
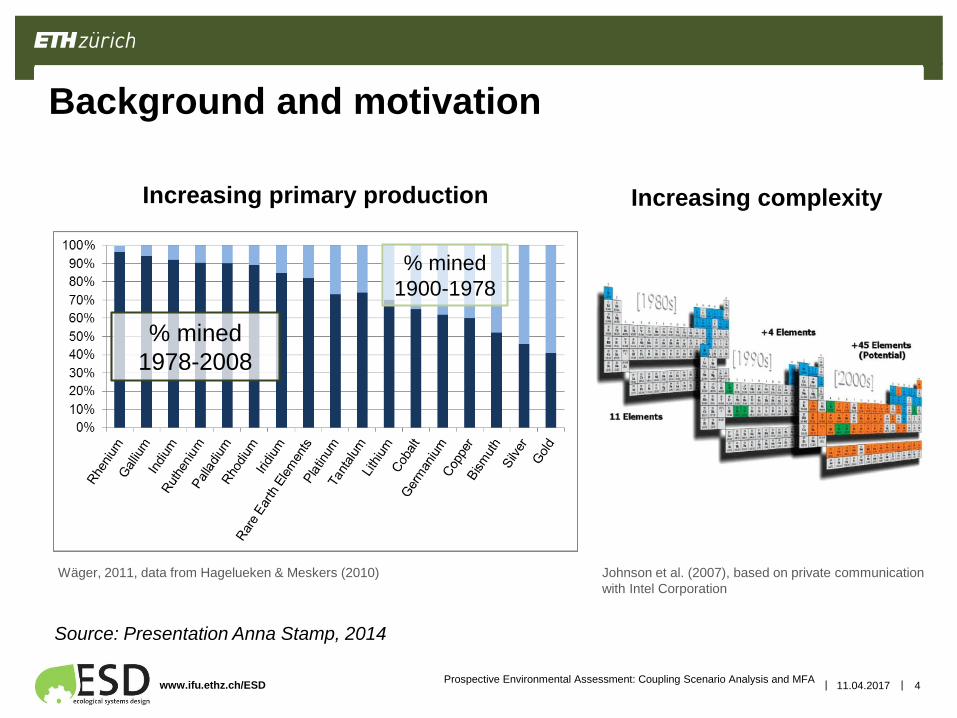
Background and motivation
Wäger, 2011, data from Hagelueken & Meskers (2010)
% mined
1978-2008
% mined
1900-1978
Johnson et al. (2007), based on private communication
with Intel Corporation
Increasing primary production Increasing complexity
Source: Presentation Anna Stamp, 2014
Prospective Environmental Assessment: Coupling Scenario Analysis and MFA
||www.ifu.ethz.ch/ESD 11.04.2017 5
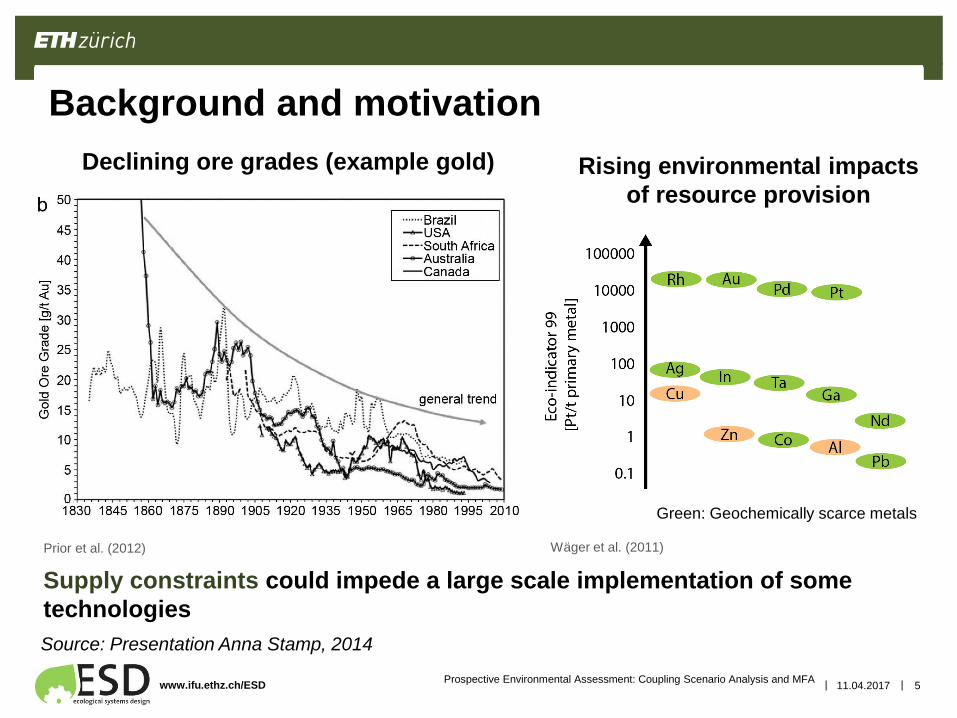
Background and motivation
Prior et al. (2012) Wäger et al. (2011)
Rising environmental impacts
of resource provision
Green: Geochemically scarce metals
Supply constraints could impede a large scale implementation of some
technologies
Source: Presentation Anna Stamp, 2014
Declining ore grades (example gold)
Prospective Environmental Assessment: Coupling Scenario Analysis and MFA
||www.ifu.ethz.ch/ESD 11.04.2017 6
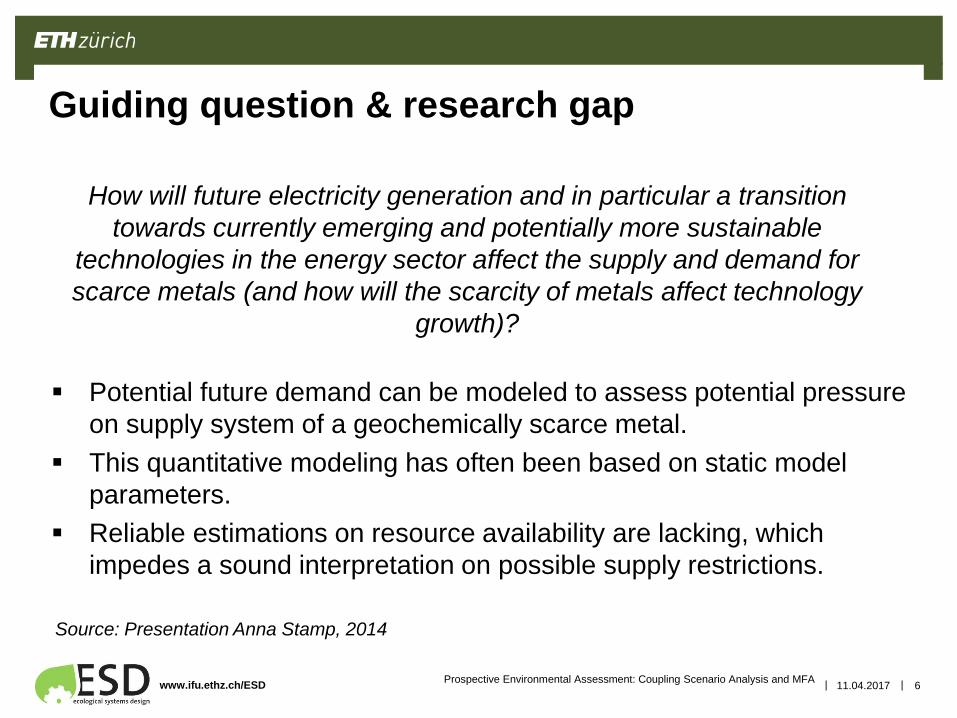
Guiding question & research gap
Potential future demand can be modeled to assess potential pressure
on supply system of a geochemically scarce metal.
This quantitative modeling has often been based on static model
parameters.
Reliable estimations on resource availability are lacking, which
impedes a sound interpretation on possible supply restrictions.
How will future electricity generation and in particular a transition
towards currently emerging and potentially more sustainable
technologies in the energy sector affect the supply and demand for
scarce metals (and how will the scarcity of metals affect technology
growth)?
Source: Presentation Anna Stamp, 2014
Prospective Environmental Assessment: Coupling Scenario Analysis and MFA
||www.ifu.ethz.ch/ESD 11.04.2017 7
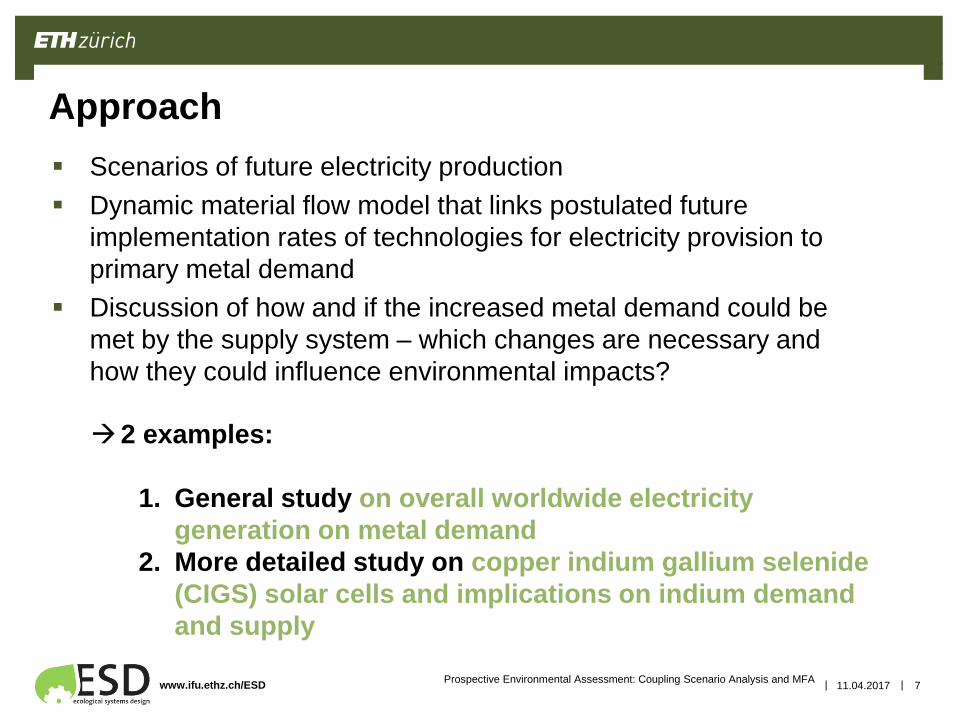
Approach
Scenarios of future electricity production
Dynamic material flow model that links postulated future
implementation rates of technologies for electricity provision to
primary metal demand
Discussion of how and if the increased metal demand could be
met by the supply system – which changes are necessary and
how they could influence environmental impacts?
2 examples:
1. General study on overall worldwide electricity
generation on metal demand
2. More detailed study on copper indium gallium selenide
(CIGS) solar cells and implications on indium demand
and supply
Prospective Environmental Assessment: Coupling Scenario Analysis and MFA
||www.ifu.ethz.ch/ESD 11.04.2017 8
Example 1: «Dynamic analysis of the global
metals flows and stocks in electricity
generation technologies»
A. Elshkaki & T. E. Graedel. 2013. Journal of Clearner Production 59:
260-273.
Prospective Environmental Assessment: Coupling Scenario Analysis and MFA
||www.ifu.ethz.ch/ESD 11.04.2017 9
Scenarios (2050)
GEO-3 scenarios from UNEP (Global Environmental Outlook)
«Market first scenario»
• Market-driven developments
• Business as usual
• For renewables: only existing policies are taken into account
«Policy first scenario»
• Strong governmental actions to reach social and environmental goals
• Renewables: takes into account existing policies and assumes successful
implementation of targets
Source: Elshkaki & Graedel 2013
Prospective Environmental Assessment: Coupling Scenario Analysis and MFA
||www.ifu.ethz.ch/ESD 11.04.2017 10
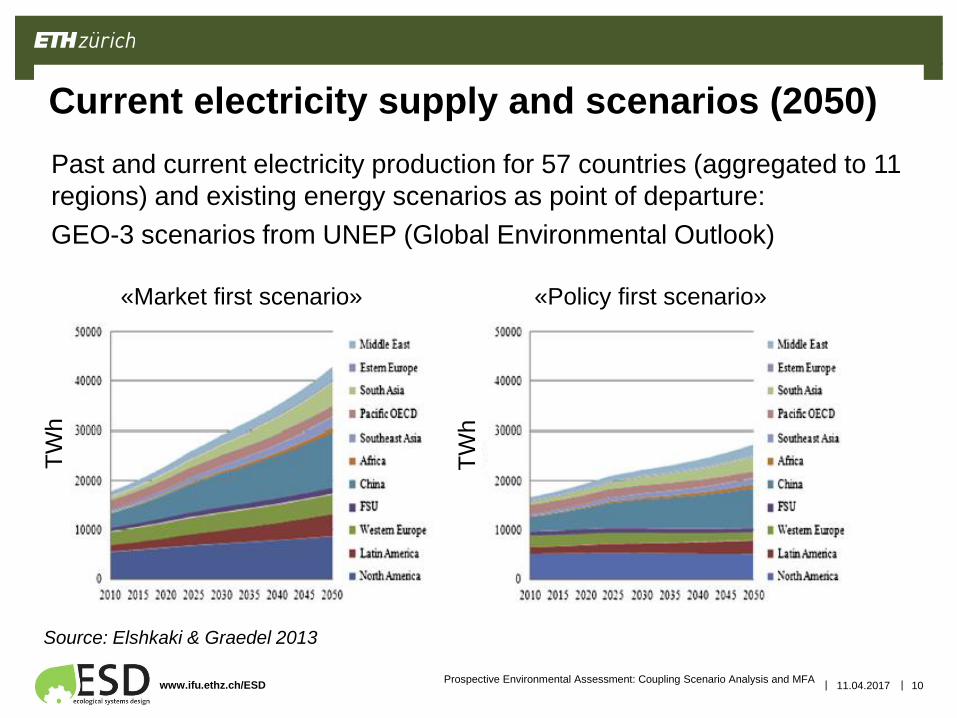
Current electricity supply and scenarios (2050)
Past and current electricity production for 57 countries (aggregated to 11
regions) and existing energy scenarios as point of departure:
GEO-3 scenarios from UNEP (Global Environmental Outlook)
Source: Elshkaki & Graedel 2013
«Market first scenario» «Policy first scenario»
TW
h
TW
h
Prospective Environmental Assessment: Coupling Scenario Analysis and MFA
||www.ifu.ethz.ch/ESD 11.04.2017 11
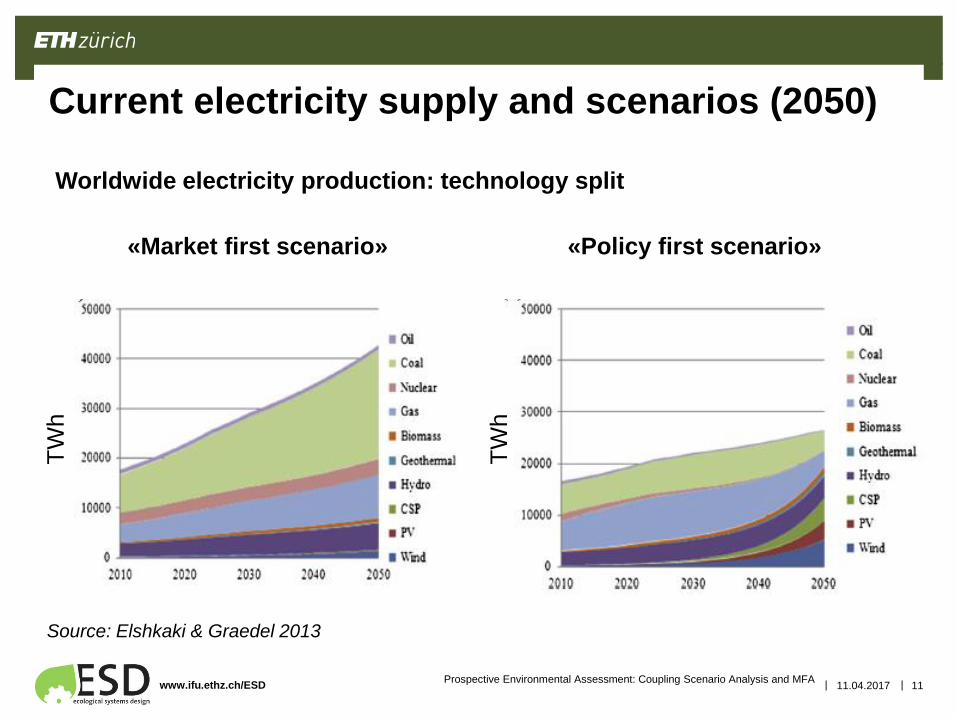
Current electricity supply and scenarios (2050)
Source: Elshkaki & Graedel 2013
«Market first scenario» «Policy first scenario»
TW
h
TW
h
Worldwide electricity production: technology split
Prospective Environmental Assessment: Coupling Scenario Analysis and MFA
||www.ifu.ethz.ch/ESD 11.04.2017 12
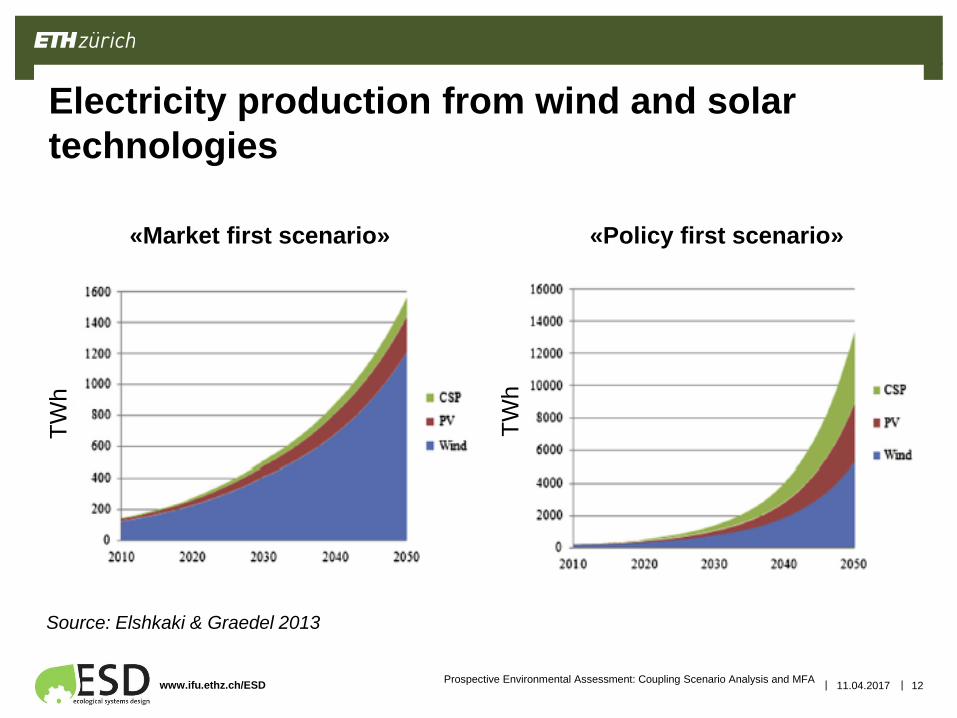
Electricity production from wind and solar
technologies
Source: Elshkaki & Graedel 2013
«Market first scenario» «Policy first scenario»
TW
h
TW
h
Prospective Environmental Assessment: Coupling Scenario Analysis and MFA
||www.ifu.ethz.ch/ESD 11.04.2017 13
Assumptions for modeling electricity generation
technologies
• Wind: market share of offshore wind farms grow from currently 2% to 50%
in 2050
• PV: equal market shares of multi and singlechristalline silicon technologies
assumed; market share of thin film increases and the three technologies
have equal shares (amorphous silicon, CdTe, CIGS)
• Concentrated solar power: power tower and parabolic trough technology
• Hydropower: run-of-river and reservoir
• Geothermal: hydrothermal and enhanced geothermal systems
• Biomass: Cogeneration heat and electricity plant
• Nuclear: pressurized water reactor and boiling water reactor
• Coal, gas, oil: «average» power plant (no distinction between
technologies)
More technological detail for renewables
Source: Elshkaki & Graedel 2013
Prospective Environmental Assessment: Coupling Scenario Analysis and MFA
||www.ifu.ethz.ch/ESD 11.04.2017 14
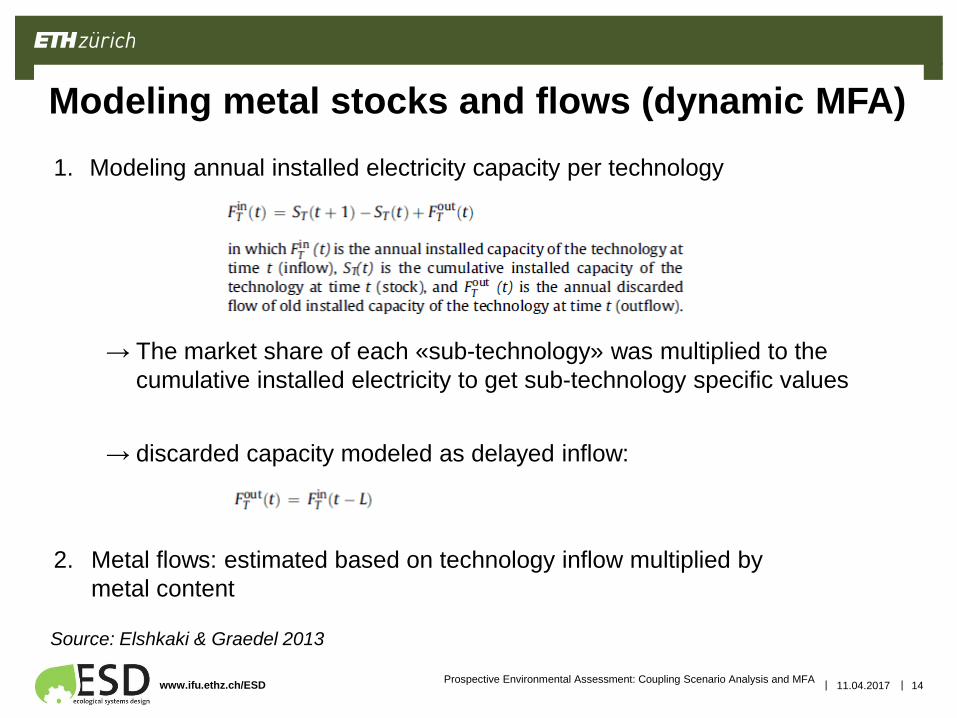
Modeling metal stocks and flows (dynamic MFA)
Source: Elshkaki & Graedel 2013
1. Modeling annual installed electricity capacity per technology
→ The market share of each «sub-technology» was multiplied to the
cumulative installed electricity to get sub-technology specific values
→ discarded capacity modeled as delayed inflow:
2. Metal flows: estimated based on technology inflow multiplied by
metal content
Prospective Environmental Assessment: Coupling Scenario Analysis and MFA
||www.ifu.ethz.ch/ESD 11.04.2017 15
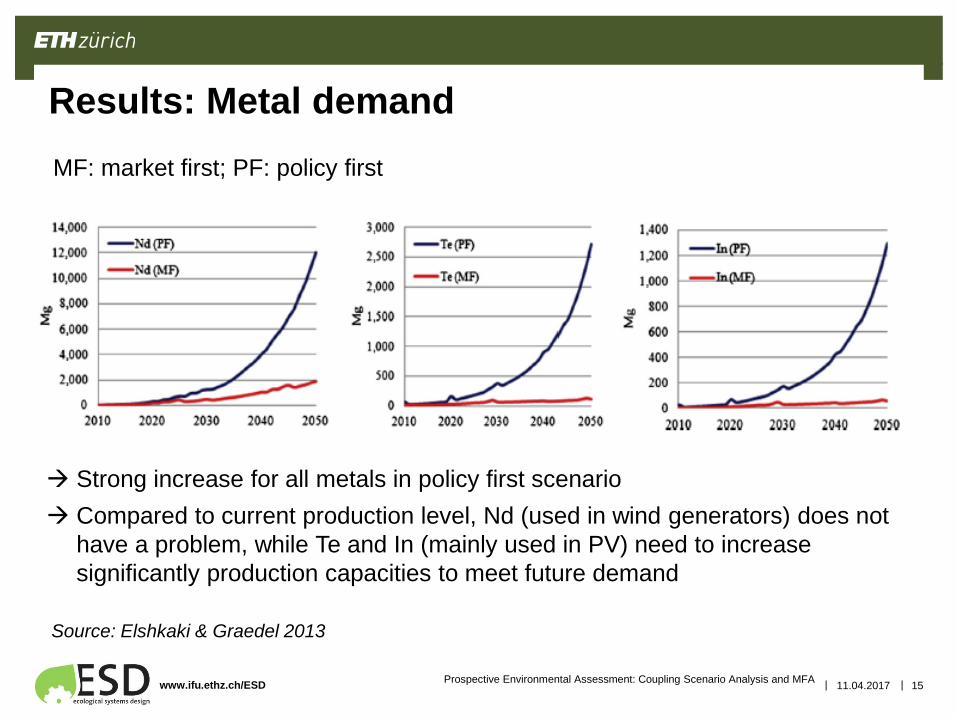
Results: Metal demand
Source: Elshkaki & Graedel 2013
MF: market first; PF: policy first
Strong increase for all metals in policy first scenario
Compared to current production level, Nd (used in wind generators) does not
have a problem, while Te and In (mainly used in PV) need to increase
significantly production capacities to meet future demand
Prospective Environmental Assessment: Coupling Scenario Analysis and MFA
||www.ifu.ethz.ch/ESD 11.04.2017 16
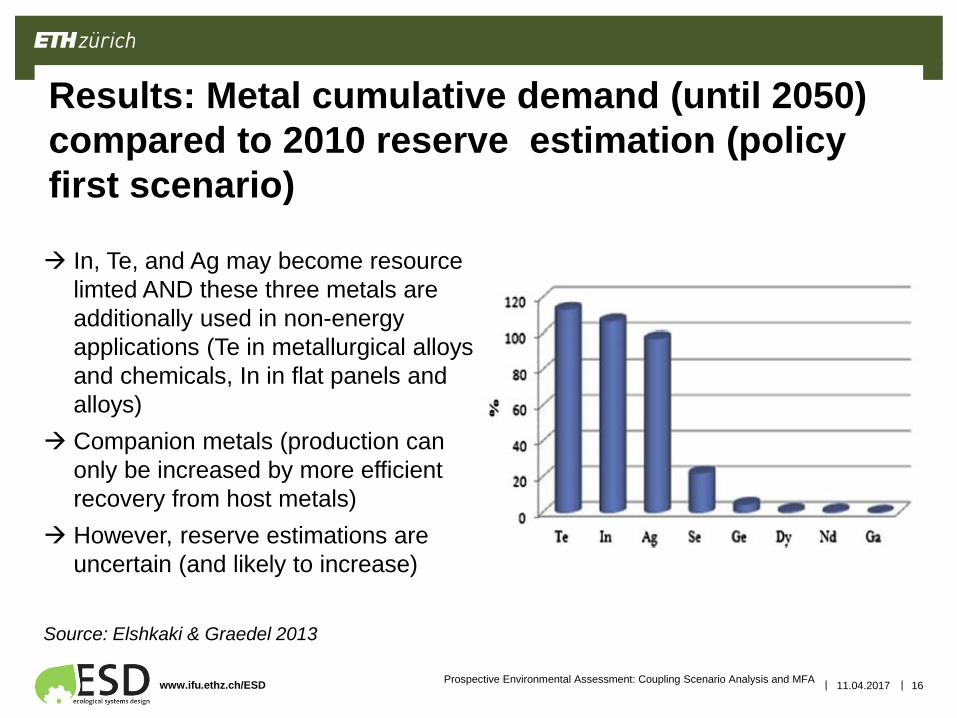
Results: Metal cumulative demand (until 2050)
compared to 2010 reserve estimation (policy
first scenario)
Source: Elshkaki & Graedel 2013
In, Te, and Ag may become resource
limted AND these three metals are
additionally used in non-energy
applications (Te in metallurgical alloys
and chemicals, In in flat panels and
alloys)
Companion metals (production can
only be increased by more efficient
recovery from host metals)
However, reserve estimations are
uncertain (and likely to increase)
Prospective Environmental Assessment: Coupling Scenario Analysis and MFA
||www.ifu.ethz.ch/ESD 11.04.2017 17
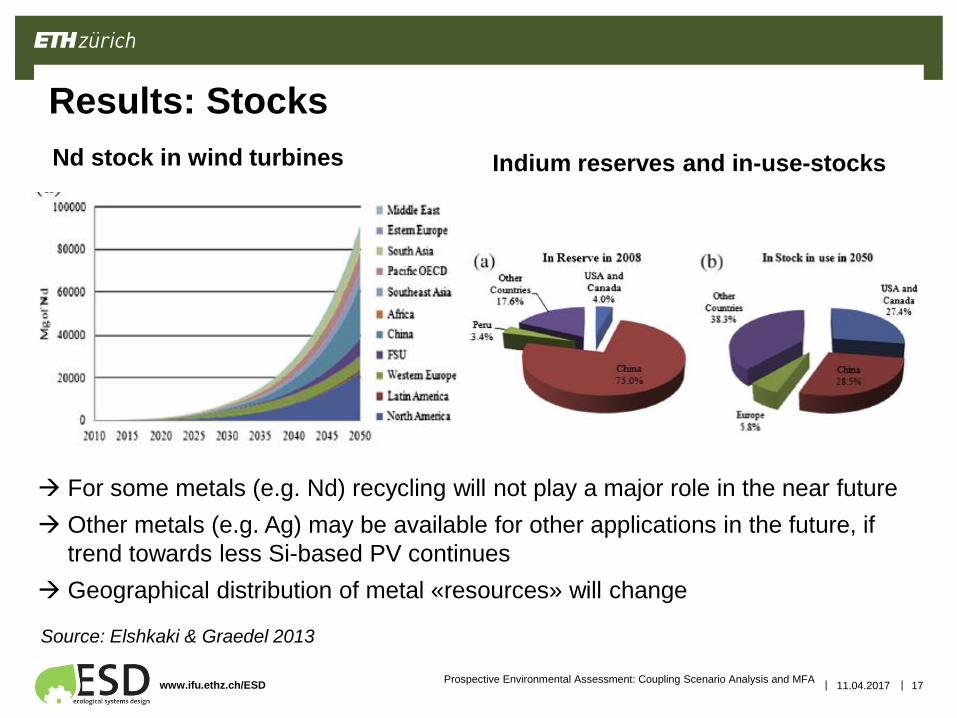
Results: Stocks
Source: Elshkaki & Graedel 2013
For some metals (e.g. Nd) recycling will not play a major role in the near future
Other metals (e.g. Ag) may be available for other applications in the future, if
trend towards less Si-based PV continues
Geographical distribution of metal «resources» will change
Nd stock in wind turbines Indium reserves and in-use-stocks
Prospective Environmental Assessment: Coupling Scenario Analysis and MFA
||www.ifu.ethz.ch/ESD 11.04.2017 18
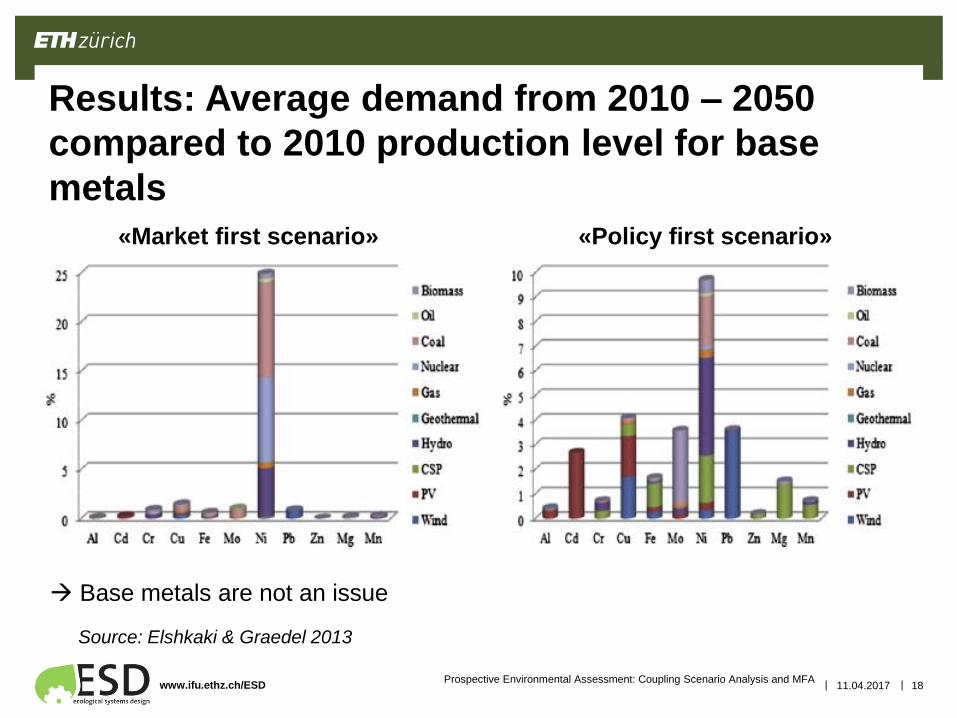
Results: Average demand from 2010 – 2050
compared to 2010 production level for base
metals
Source: Elshkaki & Graedel 2013
Base metals are not an issue
«Market first scenario» «Policy first scenario»
Prospective Environmental Assessment: Coupling Scenario Analysis and MFA
||www.ifu.ethz.ch/ESD 11.04.2017 19
Conclusions
Base metals (Al, Cu, Cr, Ni, Pb, Fe) are not a problem
Metal resources will be relocated geographically (from
locations with natural reserves to countries with large in-
use stocks)
No metal supply problems for wind power technology
Potential metal availability issues for (all) PV
technologies:
Silver for silicon based technologies
Tellurium for cadmium telluride technology
Indium for CIGS
Germanium for amorphous silicon
Source: Elshkaki & Graedel 2013
Prospective Environmental Assessment: Coupling Scenario Analysis and MFA
||www.ifu.ethz.ch/ESD 11.04.2017 20
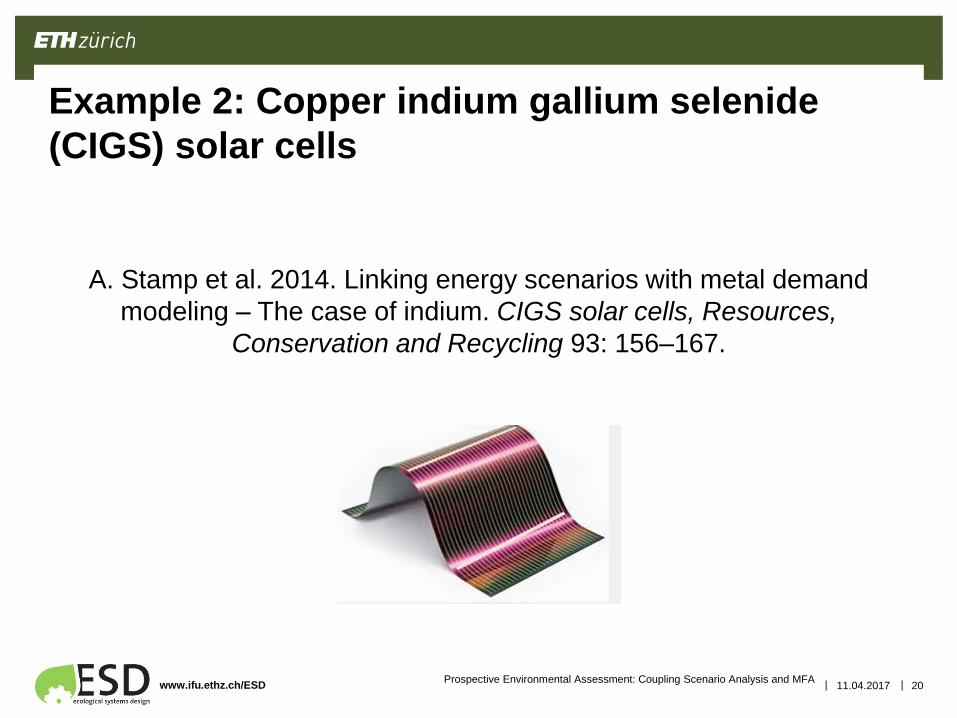
Example 2: Copper indium gallium selenide
(CIGS) solar cells
A. Stamp et al. 2014. Linking energy scenarios with metal demand
modeling – The case of indium. CIGS solar cells, Resources,
Conservation and Recycling 93: 156–167.
Prospective Environmental Assessment: Coupling Scenario Analysis and MFA
||www.ifu.ethz.ch/ESD 11.04.2017 21
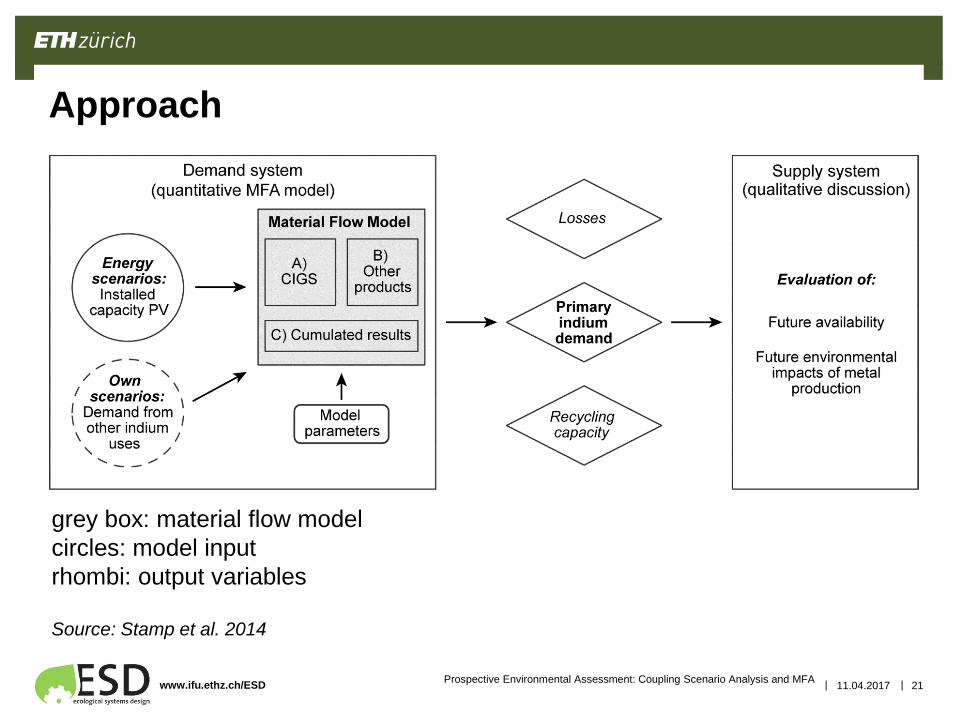
Approach
grey box: material flow model
circles: model input
rhombi: output variables
Source: Stamp et al. 2014
Prospective Environmental Assessment: Coupling Scenario Analysis and MFA
||www.ifu.ethz.ch/ESD 11.04.2017 22
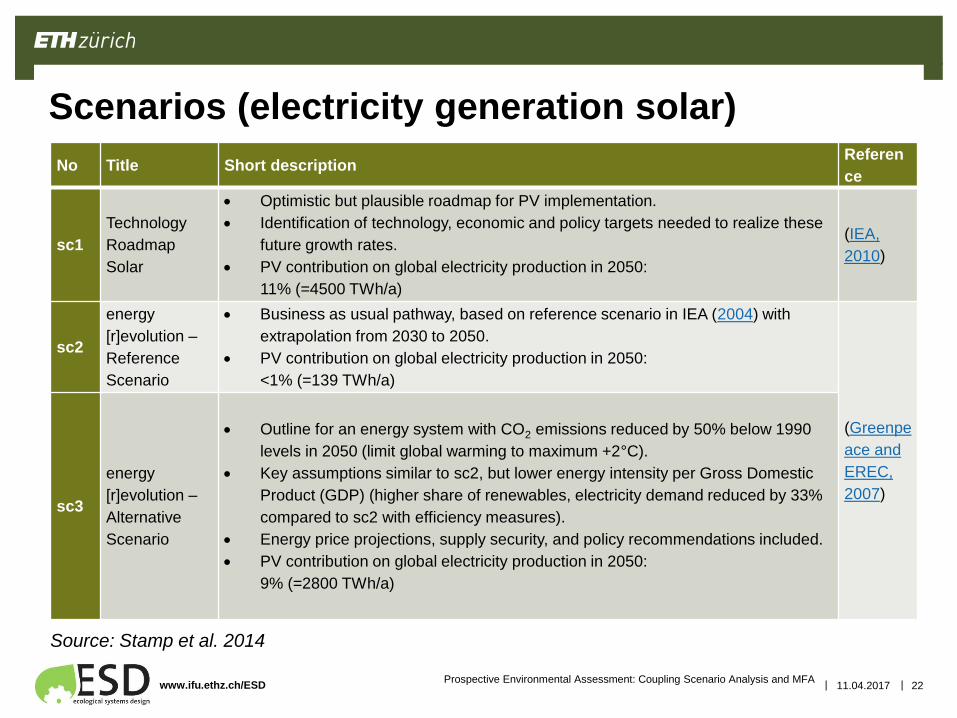
Scenarios (electricity generation solar)
No Title Short descriptionReferen
ce
sc1
Technology
Roadmap
Solar
Optimistic but plausible roadmap for PV implementation.
Identification of technology, economic and policy targets needed to realize these
future growth rates.
PV contribution on global electricity production in 2050:
11% (=4500 TWh/a)
(IEA,
2010)
sc2
energy
[r]evolution –
Reference
Scenario
Business as usual pathway, based on reference scenario in IEA (2004) with
extrapolation from 2030 to 2050.
PV contribution on global electricity production in 2050:
<1% (=139 TWh/a)
(Greenpe
ace and
EREC,
2007)sc3
energy
[r]evolution –
Alternative
Scenario
Outline for an energy system with CO2 emissions reduced by 50% below 1990
levels in 2050 (limit global warming to maximum +2°C).
Key assumptions similar to sc2, but lower energy intensity per Gross Domestic
Product (GDP) (higher share of renewables, electricity demand reduced by 33%
compared to sc2 with efficiency measures).
Energy price projections, supply security, and policy recommendations included.
PV contribution on global electricity production in 2050:
9% (=2800 TWh/a)
Source: Stamp et al. 2014
Prospective Environmental Assessment: Coupling Scenario Analysis and MFA
||www.ifu.ethz.ch/ESD 11.04.2017 23
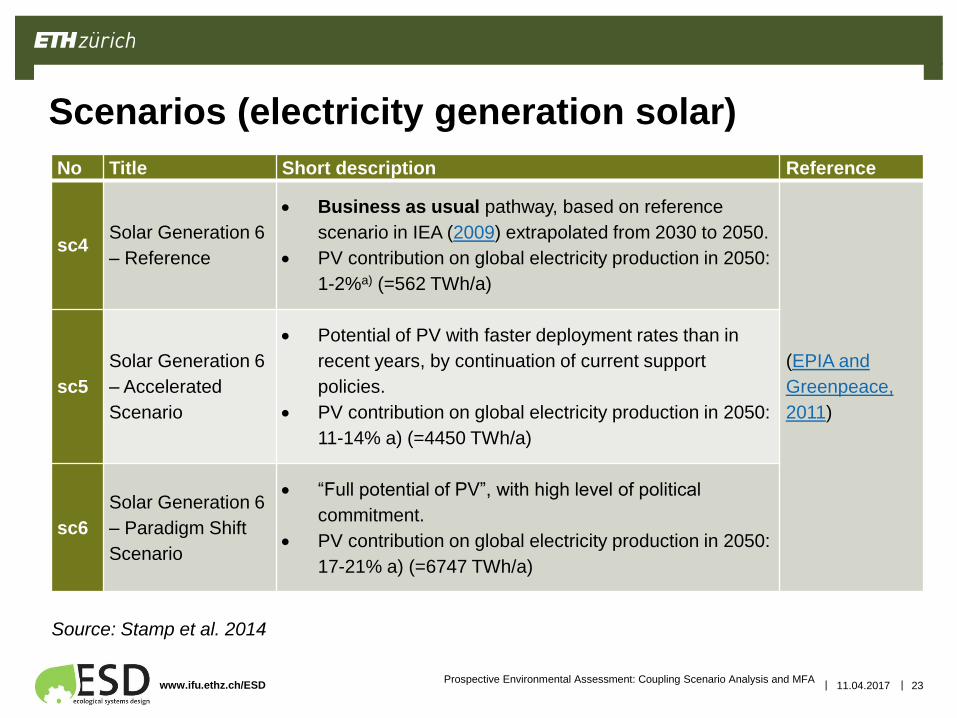
Scenarios (electricity generation solar)
No Title Short description Reference
sc4Solar Generation 6
– Reference
Business as usual pathway, based on reference
scenario in IEA (2009) extrapolated from 2030 to 2050.
PV contribution on global electricity production in 2050:
1-2%a) (=562 TWh/a)
(EPIA and
Greenpeace,
2011)
sc5
Solar Generation 6
– Accelerated
Scenario
Potential of PV with faster deployment rates than in
recent years, by continuation of current support
policies.
PV contribution on global electricity production in 2050:
11-14% a) (=4450 TWh/a)
sc6
Solar Generation 6
– Paradigm Shift
Scenario
“Full potential of PV”, with high level of political
commitment.
PV contribution on global electricity production in 2050:
17-21% a) (=6747 TWh/a)
Prospective Environmental Assessment: Coupling Scenario Analysis and MFA
Source: Stamp et al. 2014
||www.ifu.ethz.ch/ESD 11.04.2017 24
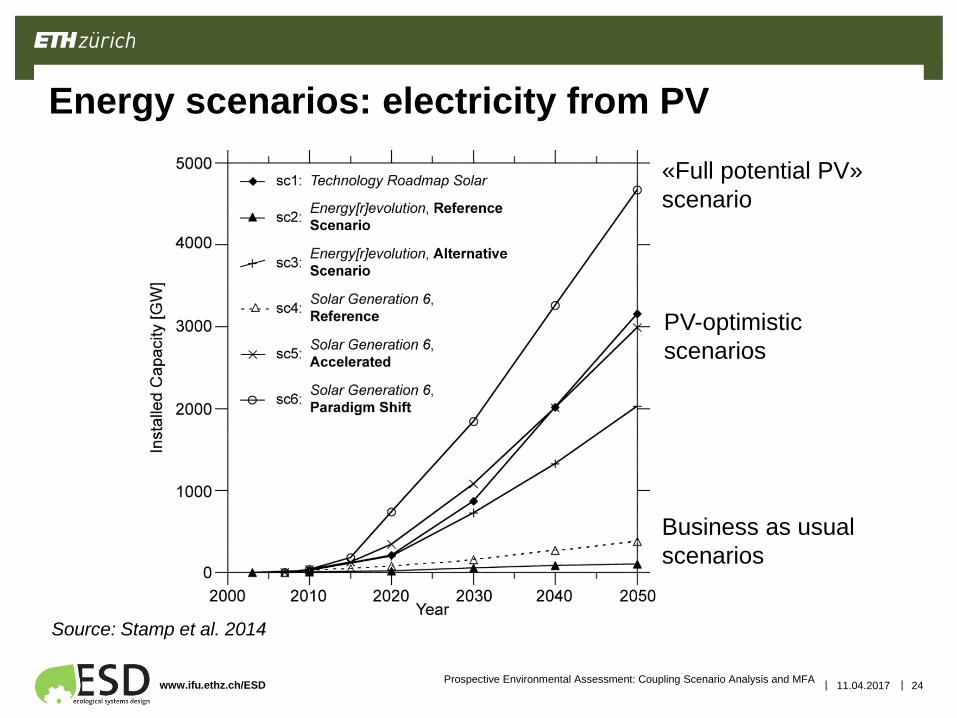
Energy scenarios: electricity from PV
Business as usual
scenarios
«Full potential PV»
scenario
PV-optimistic
scenarios
Prospective Environmental Assessment: Coupling Scenario Analysis and MFA
Source: Stamp et al. 2014
||www.ifu.ethz.ch/ESD 11.04.2017 25
Scenarios for Indium use in non-energy
applications
• Estimation of growth rates (high, medium and low
scenario)
• Example: annual growth rates in coatings currently +13%;
substitutions are being explored for coatings, so «high»
growth was assumed to be equal to 4% (economic
growth) according to US Department of Energy; medium
2%, low 1%
Prospective Environmental Assessment: Coupling Scenario Analysis and MFA
Source: Stamp et al. 2014
||www.ifu.ethz.ch/ESD 11.04.2017 26
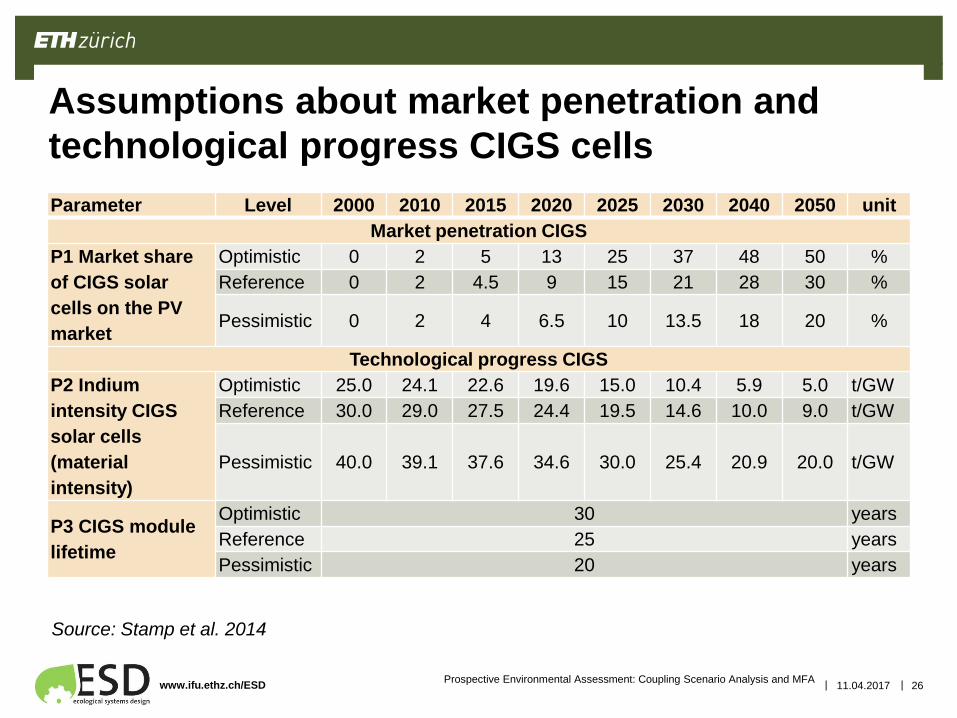
Assumptions about market penetration and
technological progress CIGS cells
Parameter Level 2000 2010 2015 2020 2025 2030 2040 2050 unit
Market penetration CIGS
P1 Market share
of CIGS solar
cells on the PV
market
Optimistic 0 2 5 13 25 37 48 50 %
Reference 0 2 4.5 9 15 21 28 30 %
Pessimistic 0 2 4 6.5 10 13.5 18 20 %
Technological progress CIGS
P2 Indium
intensity CIGS
solar cells
(material
intensity)
Optimistic 25.0 24.1 22.6 19.6 15.0 10.4 5.9 5.0 t/GW
Reference 30.0 29.0 27.5 24.4 19.5 14.6 10.0 9.0 t/GW
Pessimistic 40.0 39.1 37.6 34.6 30.0 25.4 20.9 20.0 t/GW
P3 CIGS module
lifetime
Optimistic 30 years
Reference 25 years
Pessimistic 20 years
Prospective Environmental Assessment: Coupling Scenario Analysis and MFA
Source: Stamp et al. 2014
||www.ifu.ethz.ch/ESD 11.04.2017 27
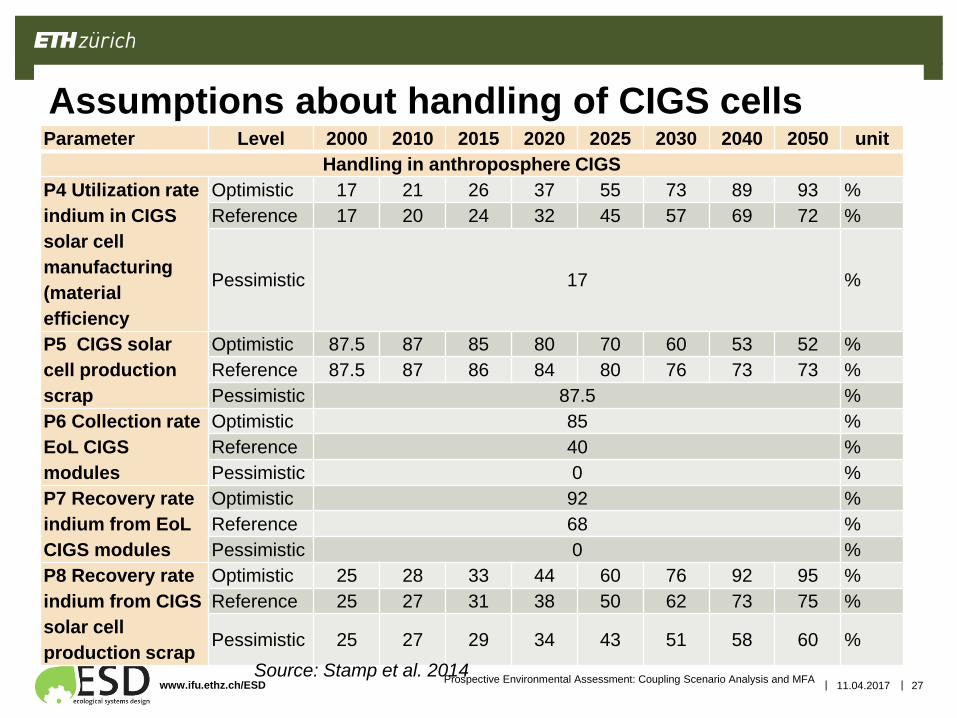
Assumptions about handling of CIGS cellsParameter Level 2000 2010 2015 2020 2025 2030 2040 2050 unit
Handling in anthroposphere CIGS
P4 Utilization rate
indium in CIGS
solar cell
manufacturing
(material
efficiency
Optimistic 17 21 26 37 55 73 89 93 %
Reference 17 20 24 32 45 57 69 72 %
Pessimistic 17 %
P5 CIGS solar
cell production
scrap
Optimistic 87.5 87 85 80 70 60 53 52 %
Reference 87.5 87 86 84 80 76 73 73 %
Pessimistic 87.5 %
P6 Collection rate
EoL CIGS
modules
Optimistic 85 %
Reference 40 %
Pessimistic 0 %
P7 Recovery rate
indium from EoL
CIGS modules
Optimistic 92 %
Reference 68 %
Pessimistic 0 %
P8 Recovery rate
indium from CIGS
solar cell
production scrap
Optimistic 25 28 33 44 60 76 92 95 %
Reference 25 27 31 38 50 62 73 75 %
Pessimistic 25 27 29 34 43 51 58 60 %
Prospective Environmental Assessment: Coupling Scenario Analysis and MFASource: Stamp et al. 2014
||www.ifu.ethz.ch/ESD 11.04.2017 28
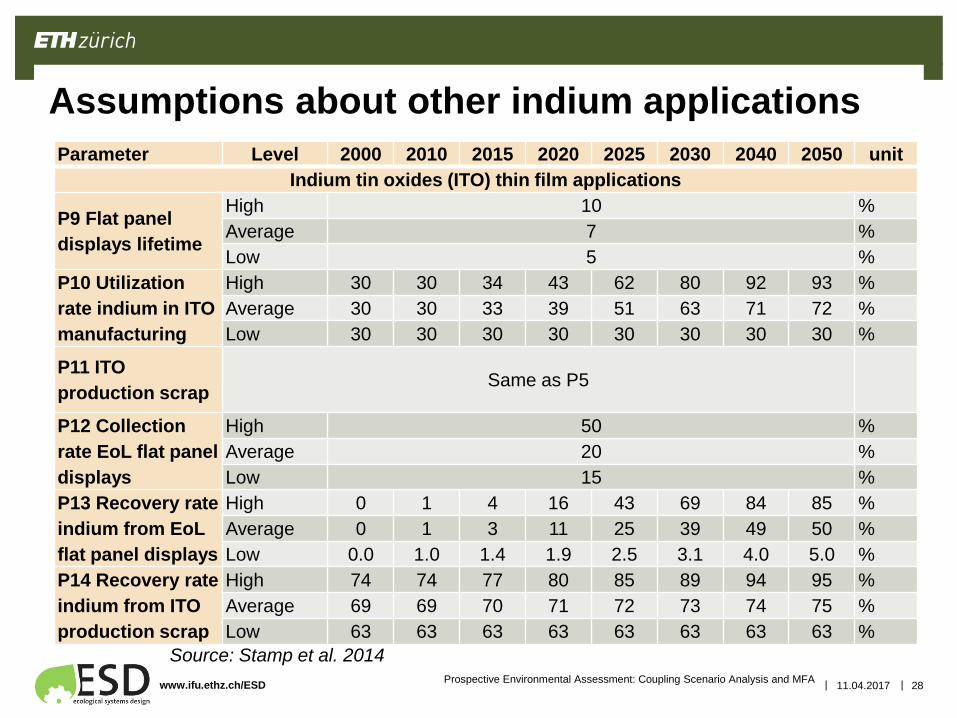
Assumptions about other indium applications
Parameter Level 2000 2010 2015 2020 2025 2030 2040 2050 unit
Indium tin oxides (ITO) thin film applications
P9 Flat panel
displays lifetime
High 10 %
Average 7 %
Low 5 %
P10 Utilization
rate indium in ITO
manufacturing
High 30 30 34 43 62 80 92 93 %
Average 30 30 33 39 51 63 71 72 %
Low 30 30 30 30 30 30 30 30 %
P11 ITO
production scrapSame as P5
P12 Collection
rate EoL flat panel
displays
High 50 %
Average 20 %
Low 15 %
P13 Recovery rate
indium from EoL
flat panel displays
High 0 1 4 16 43 69 84 85 %
Average 0 1 3 11 25 39 49 50 %
Low 0.0 1.0 1.4 1.9 2.5 3.1 4.0 5.0 %
P14 Recovery rate
indium from ITO
production scrap
High 74 74 77 80 85 89 94 95 %
Average 69 69 70 71 72 73 74 75 %
Low 63 63 63 63 63 63 63 63 %
Source: Stamp et al. 2014Prospective Environmental Assessment: Coupling Scenario Analysis and MFA
||www.ifu.ethz.ch/ESD 11.04.2017 29
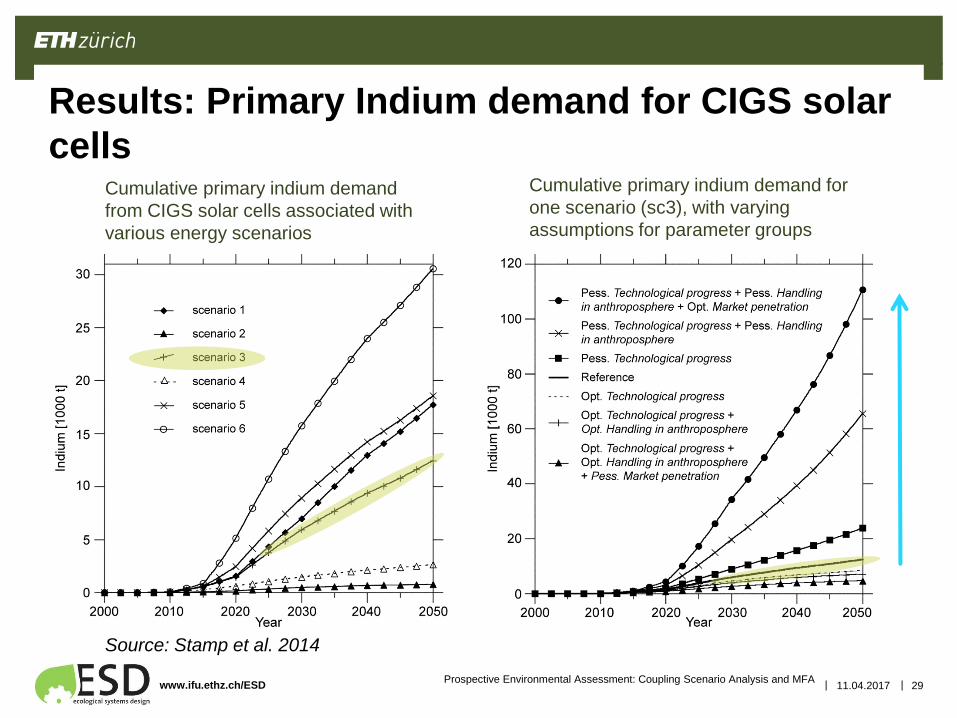
Results: Primary Indium demand for CIGS solar
cellsCumulative primary indium demand
from CIGS solar cells associated with
various energy scenarios
Cumulative primary indium demand for
one scenario (sc3), with varying
assumptions for parameter groups
Source: Stamp et al. 2014
Prospective Environmental Assessment: Coupling Scenario Analysis and MFA
||www.ifu.ethz.ch/ESD 11.04.2017 30
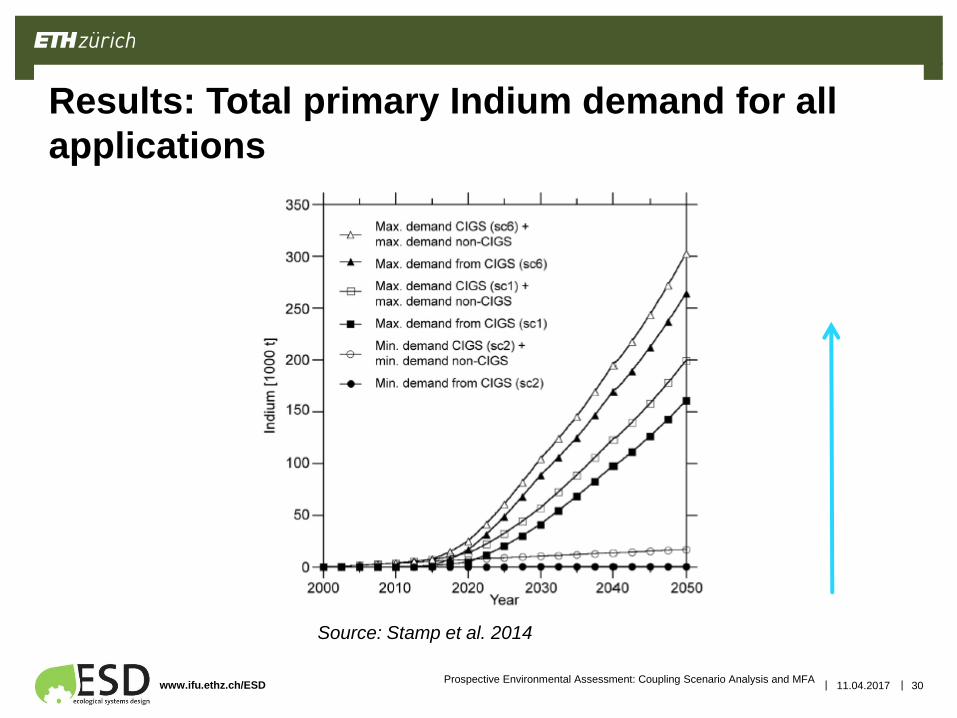
Results: Total primary Indium demand for all
applications
Source: Stamp et al. 2014
Prospective Environmental Assessment: Coupling Scenario Analysis and MFA
||www.ifu.ethz.ch/ESD 11.04.2017 31
Measures to adjust indium supply to increased
demand
1. Improve extraction efficiency
2. Increase production of carrier metal zinc
3. Mine indium with other carrier metals
4. Access historic resources
Source: Stamp et al. 2014
Prospective Environmental Assessment: Coupling Scenario Analysis and MFA
||www.ifu.ethz.ch/ESD
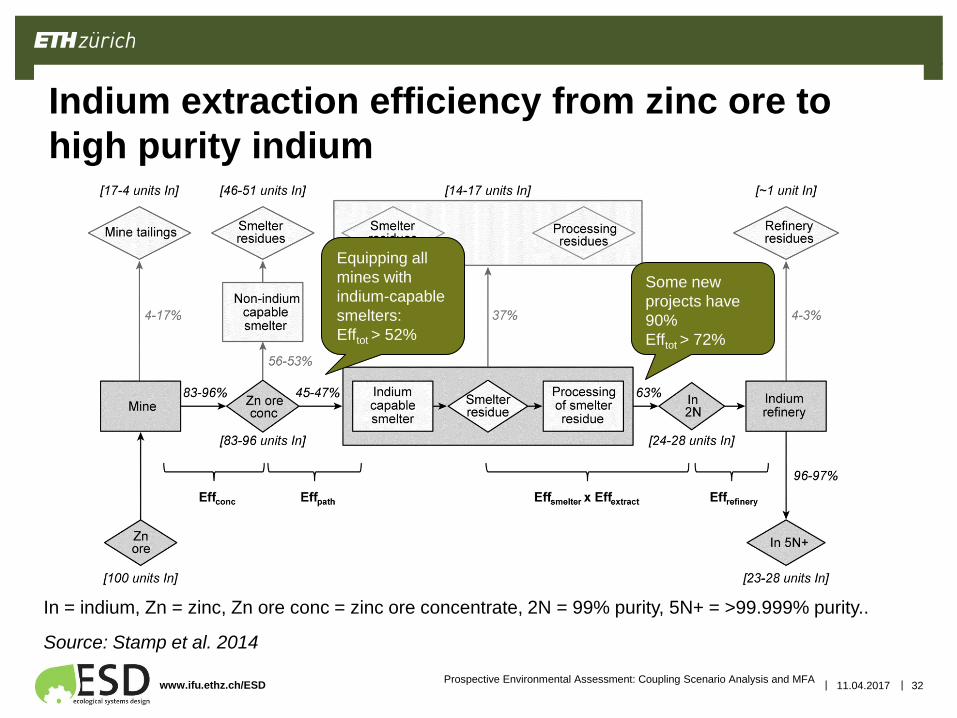
Equipping all
mines with
indium-capable
smelters:
Efftot > 52%
Some new
projects have
90%
Efftot > 72%
11.04.2017 32
Indium extraction efficiency from zinc ore to
high purity indium
In = indium, Zn = zinc, Zn ore conc = zinc ore concentrate, 2N = 99% purity, 5N+ = >99.999% purity..
Source: Stamp et al. 2014
Prospective Environmental Assessment: Coupling Scenario Analysis and MFA
||www.ifu.ethz.ch/ESD 11.04.2017 33
Increase production of carrier metal zinc
Annual zinc production: 12 Mio t in 2010
On average, zinc production has increased 3.5% per year
since 1900 (linked to construction and automotive industry,
particularly for galvanization)
Sufficient for lower bound estimation of Indium demand
For upper bound estimation: annual increase of 12 – 24 %
necessary (scenario 1 and 6)
Source: Stamp et al. 2014
Prospective Environmental Assessment: Coupling Scenario Analysis and MFA
||www.ifu.ethz.ch/ESD 11.04.2017 34
Mine indium with other carrier metals & access
historic resources
Indium also occurs in copper, lead and tin minerals
Indium Corporation identified 15,000 t of indium as
residue reserves
Usability of residue reserves depends on pollution level
Source: Stamp et al. 2014
Prospective Environmental Assessment: Coupling Scenario Analysis and MFA
||www.ifu.ethz.ch/ESD 11.04.2017 35
Conclusions
The same amount of primary indium “invested” can sustain
considerably higher installed capacities of CIGS solar cells
Prerequisites: higher efforts in reducing indium demand in the technology
and in keeping the indium in the anthropogenic cycle
Possible changes in the supply system to react to increasing
demand: e.g. increasing the extraction efficiency of indium as a
by-product of zinc production in order to decrease dependency
on future zinc demand development.
Some optimism regarding securing the indium supply for an
increased CIGS solar cell implementation in the medium term,
although higher prices might result.
Study cannot be generalized to other metals.
Source: Stamp et al. 2014
Prospective Environmental Assessment: Coupling Scenario Analysis and MFA
||www.ifu.ethz.ch/ESD 11.04.2017 36
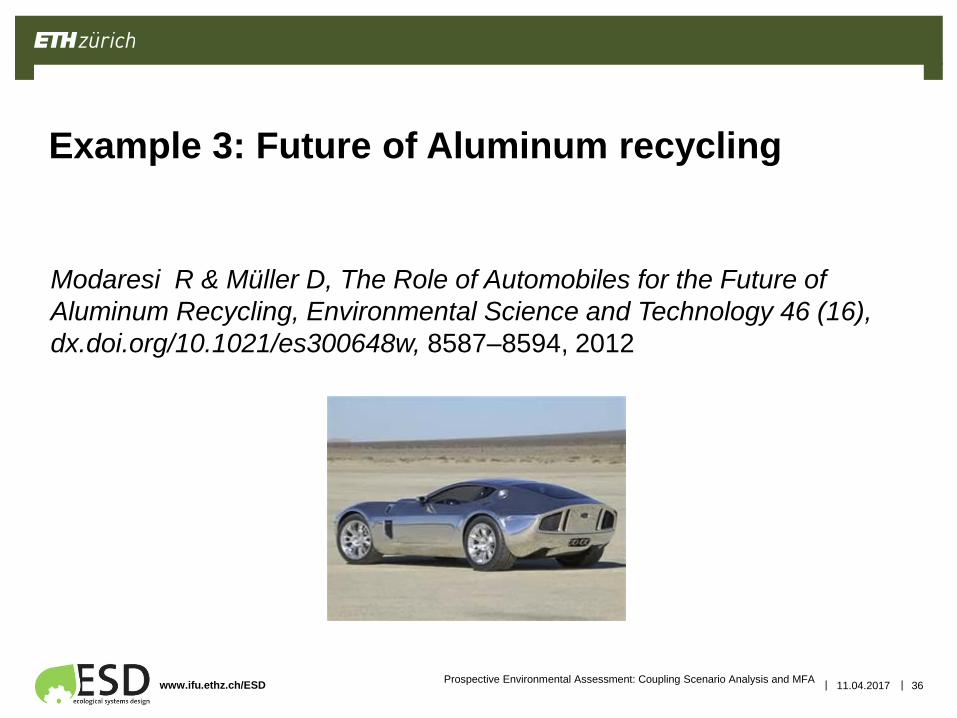
Example 3: Future of Aluminum recycling
Modaresi R & Müller D, The Role of Automobiles for the Future of
Aluminum Recycling, Environmental Science and Technology 46 (16),
dx.doi.org/10.1021/es300648w, 8587–8594, 2012
Prospective Environmental Assessment: Coupling Scenario Analysis and MFA
||www.ifu.ethz.ch/ESD
1-2 Folien zur Studie von Müller: dynamic. MFA
und Qualität Alu Schrott
Modaresi R & Müller D, The Role of Automobiles for the Future of
Aluminum Recycling, Environmental Science and Technology 46 (16),
dx.doi.org/10.1021/es300648w, 8587–8594, 2012
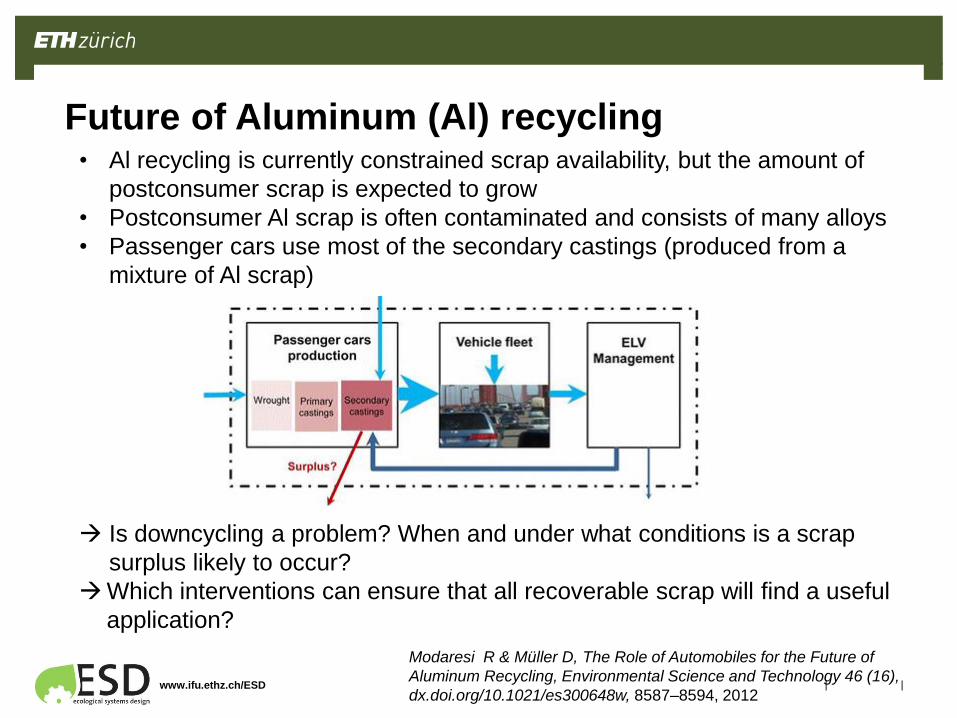
Future of Aluminum (Al) recycling• Al recycling is currently constrained scrap availability, but the amount of
postconsumer scrap is expected to grow
• Postconsumer Al scrap is often contaminated and consists of many alloys
• Passenger cars use most of the secondary castings (produced from a
mixture of Al scrap)
Is downcycling a problem? When and under what conditions is a scrap
surplus likely to occur?
Which interventions can ensure that all recoverable scrap will find a useful
application?
||www.ifu.ethz.ch/ESD
Modaresi R & Müller D, The Role of Automobiles for the Future of
Aluminum Recycling, Environmental Science and Technology 46
(16), dx.doi.org/10.1021/es300648w, 8587–8594, 2012
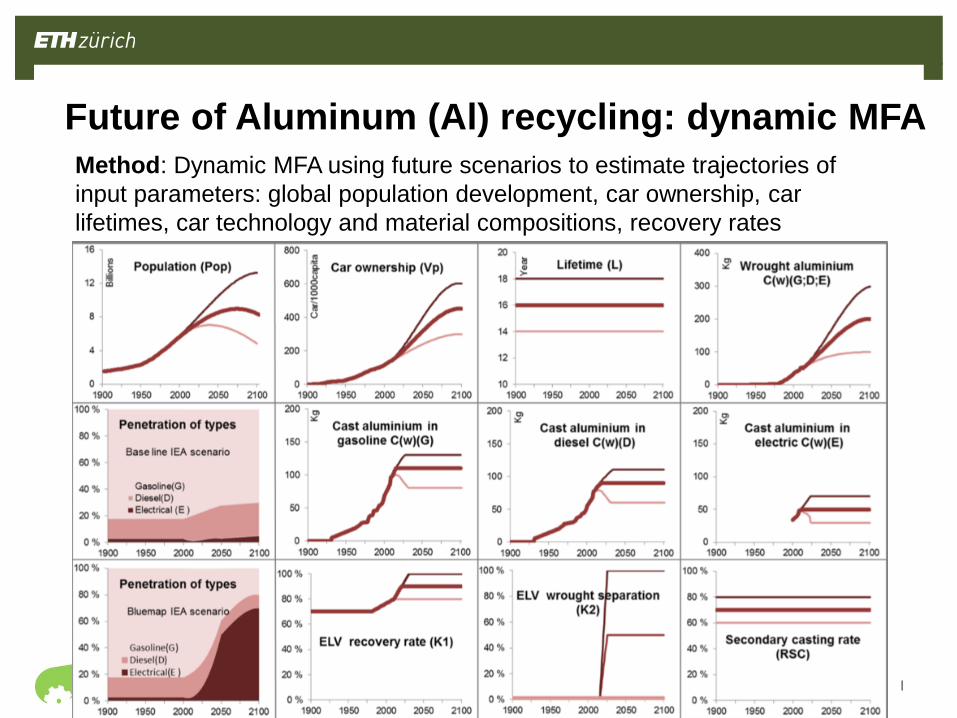
Future of Aluminum (Al) recycling: dynamic MFA
Method: Dynamic MFA using future scenarios to estimate trajectories of
input parameters: global population development, car ownership, car
lifetimes, car technology and material compositions, recovery rates
||www.ifu.ethz.ch/ESD
Modaresi R & Müller D, The Role of Automobiles for the Future of
Aluminum Recycling, Environmental Science and Technology 46
(16), dx.doi.org/10.1021/es300648w, 8587–8594, 2012
Future of Aluminum (Al) recycling: dynamic MFA
Results:
• Current practice of downgrading and dilution will lead to a
scrap excess already in this decade.
• By 2050, the annual scrap excess from passenger cars
may reach 0.4−2 kg per capita (10−54% of the primary
aluminum production in 2006).
• This corresponds to a loss of annual energy saving
potential of 45−240 TWh/yr and a loss in greenhouse
gas saving potential of 4−19 kg per capita and year.
||www.ifu.ethz.ch/ESD
Modaresi R & Müller D, The Role of Automobiles for the Future of
Aluminum Recycling, Environmental Science and Technology 46
(16), dx.doi.org/10.1021/es300648w, 8587–8594, 2012
Future of Aluminum (Al) recycling: interventions
Most effective counter-measures:
• Improve sorting into castings, wrought aluminum, and different alloy
families
• Design for disassembly and design for recycling: reduction of the number
of alloys (however, effect would come with delay of product lifetime)
• Effective strategies need to include an immediate and rapid penetration
||www.ifu.ethz.ch/ESD 11.04.2017 41Prospective Environmental Assessment: Coupling Scenario Analysis and MFA
Learning goal
1. Getting to know examples of prospective
assessments with a combined scenario analysis and
dynamic material flow analysis
2. Understanding for the case of electricity generation,
how the methods of the lecture can be applied to
Further examples?
||www.ifu.ethz.ch/ESD 11.04.2017 42
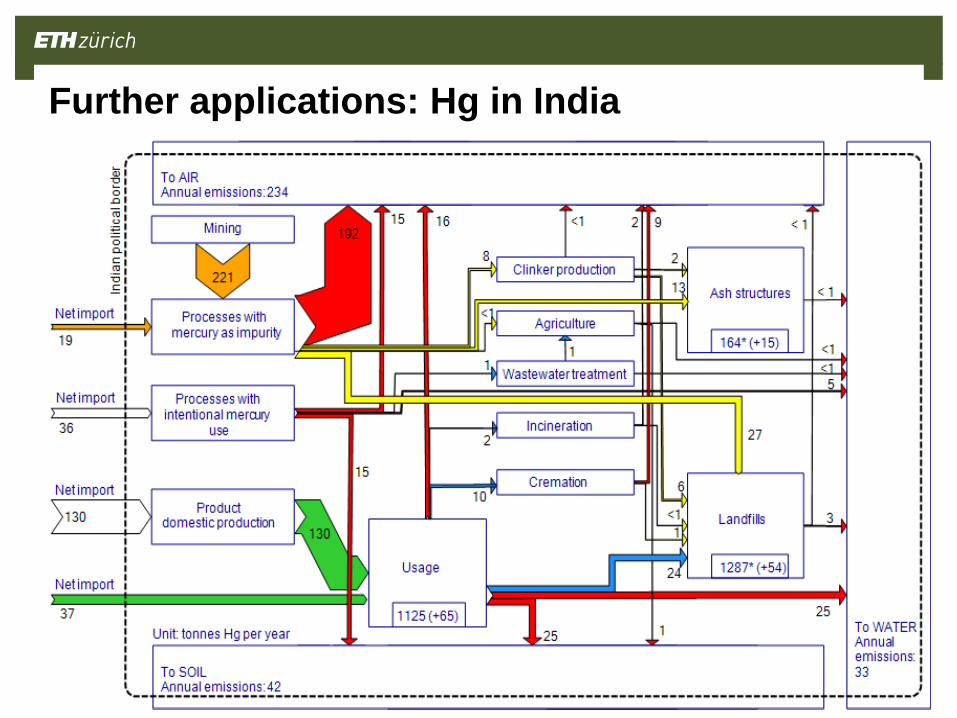
Further applications: Hg in India
||www.ifu.ethz.ch/ESD 11.04.2017 43
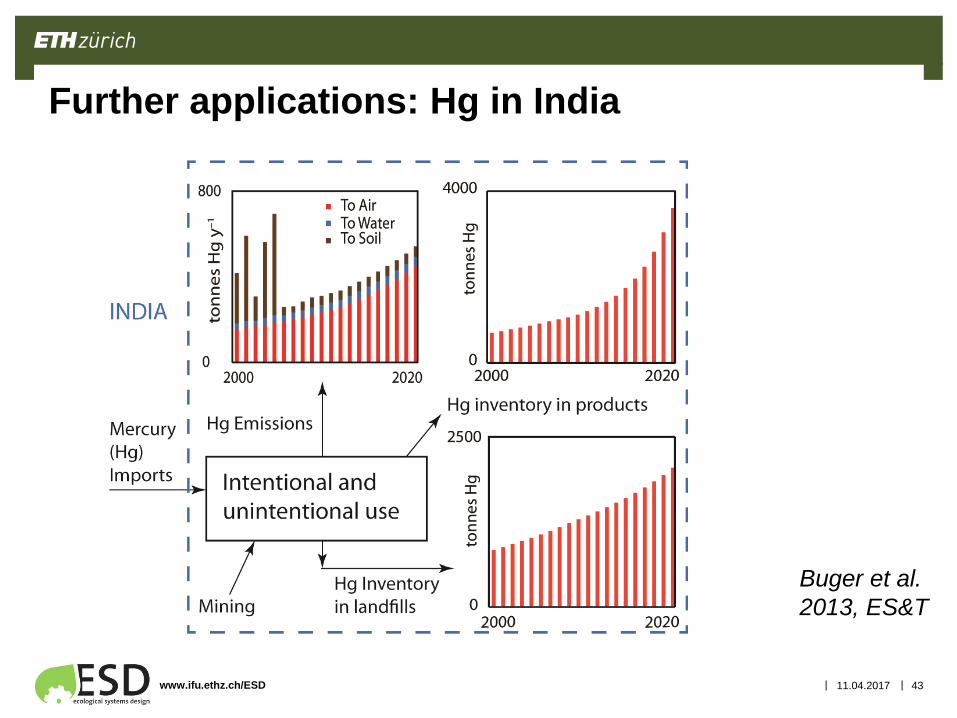
Further applications: Hg in India
Buger et al.
2013, ES&T