Embed Size (px)
Citation preview
Transportation
Metro January 2014
Leeds NGT Leeds Transport Model Update
Prepared by: ............................................................. Checked by: ........................................................................ Masood Hashmi – Senior Consultant Stuart Dalgleish Andrew Currall – Senior Consultant Associate Director Christopher Cuckson – Senior Consultant Approved by: ............................................................. Paul Hanson Technical Director
Leeds NGT
Leeds Transport Model Update
Rev No Comments Checked by Approved by
Date
7 Final Version SD PH 23/01/14
6 Second draft for External Comment SD 16/01/14
5 Initial Draft for External Circulation SD PH 6/12/13
4 Response to Internal comments SD 5/12/13
3 Draft for Internal Review 13/10/13
2 Partial Draft 27/9/13
1 Structure 30/7/13
5th Floor, 2 City Walk, Leeds, LS11 9AR Telephone: 0113 391 6800 Website: http://www.aecom.com Job No 60274233 Reference M011 Date Created January 2014 This document has been prepared by AECOM Limited for the sole use of our client (the “Client”) and in accordance with generally accepted consultancy principles, the budget for fees and the terms of reference agreed between AECOM Limited and the Client. Any information provided by third parties and referred to herein has not been checked or verified by AECOM Limited, unless otherwise expressly stated in the document. No third party may rely upon this document without the prior and express written agreement of AECOM Limited. c:\users\dalgleishs\appdata\local\microsoft\windows\temporary internet files\content.outlook\ukvkagbd\leeds ngt ltm update v7.docx
1 Introduction ....................................................................................................................................................................... 4 1.1 Introduction ............................................................................................................................................................ 4 1.2 Background ........................................................................................................................................................... 4 1.3 Summary of Update Work ..................................................................................................................................... 5 1.4 Structure of Report ................................................................................................................................................ 5
2 Highway Model .................................................................................................................................................................. 7 2.1 Introduction ............................................................................................................................................................ 7 2.2 Additional Data ...................................................................................................................................................... 7 2.3 Changes Made ...................................................................................................................................................... 7 2.4 Validation along NGT Corridor ............................................................................................................................... 8 2.5 Conclusions ......................................................................................................................................................... 19
3 Public Transport Model .................................................................................................................................................. 21 3.1 Introduction .......................................................................................................................................................... 21 3.2 Changes Made .................................................................................................................................................... 21 3.3 Impact on Validation ............................................................................................................................................ 22 3.4 Conclusions ......................................................................................................................................................... 25
4 Parking Model .................................................................................................................................................................. 28 4.1 Introduction .......................................................................................................................................................... 28 4.2 The Parking Model............................................................................................................................................... 28 4.3 Additional Data Collection .................................................................................................................................... 35 4.4 Changes Made .................................................................................................................................................... 40 4.5 Impact on Calibration and Validation ................................................................................................................... 40 4.6 Conclusions ......................................................................................................................................................... 48
5 Base Year model Integration .......................................................................................................................................... 50 5.1 Introduction .......................................................................................................................................................... 50 5.2 Updated Realism Tests ....................................................................................................................................... 50 5.3 Conclusions ......................................................................................................................................................... 51
6 Summary and Conclusions ............................................................................................................................................ 53 6.1 Summary ............................................................................................................................................................. 53 6.2 Highway Assignment Model ................................................................................................................................ 53 6.3 Public Transport Assignment Model .................................................................................................................... 53 6.4 Parking Model ...................................................................................................................................................... 53 6.5 General Changes................................................................................................................................................. 53 6.6 Impact of Update ................................................................................................................................................. 53
Appendix A – Highway Model Validation Results ...................................................................................................................... 55 A.1 Impact of Matrix Estimation ................................................................................................................................. 55 A.2 Validation ............................................................................................................................................................. 61
Appendix B – Park and Ride Survey ........................................................................................................................................... 70 Table 1: NGT Corridor Individual Count Summary Version3 ......................................................................................................8 Table 2: NGT Corridor Journey Time Route Validation Version3 ............................................................................................. 11 Table 3 – Comparison of AM counts and model flows .............................................................................................................. 23 Table 4 – Comparison of IP counts and model flows ................................................................................................................ 24 Table 5 – Comparison of PM counts and modelled flows ......................................................................................................... 25 Table 6: Interchange Levels in 2008 Base Year ......................................................................................................................... 25 Table 7: Escort Proportions ......................................................................................................................................................... 33 Table 8: Adjustment Factors ....................................................................................................................................................... 37 Table 9: Modelled Capacities ....................................................................................................................................................... 37 Table 10: Vehicle Entries and Exits by Hour, King Lane ........................................................................................................... 38
Table of Contents
Table 11: Vehicle Entries and Exits by Hour, Garforth .............................................................................................................. 38 Table 12: Vehicle Entries and Exits by Hour, New Pudsey ....................................................................................................... 39 Table 13: Percentages of travellers with different travel purposes by park-and-ride site ..................................................... 39 Table 14: Average distance (km) travelled by car to park-and-ride site .................................................................................. 39 Table 15: Park and ride site ASCs, One-Way Trip ...................................................................................................................... 40 Table 16: Public Transport and Highway Costs From Park-and-Ride Sites, Minutes ............................................................. 41 Table 17: Park-and-Ride Entries, Modelled versus Observed .................................................................................................. 41 Table 18: Park-and-Ride Exits, Modelled versus Observed ...................................................................................................... 41 Table 19: Average distance (km) travelled by car to park-and-ride site .................................................................................. 42 Table 20: Vehicle Kilometre Fuel Cost Elasticities (10% increase in fuel cost) - Matrix Level, Internal Area ....................... 50 Table 21: Trip Fare Elasticities (10% increase in public transport fares), Internal Area ........................................................ 50 Table 22: Matrix Zonal IJ cell value comparison ........................................................................................................................ 55 Table 23: Matrix Zonal Trip Ends ................................................................................................................................................. 57 Table 24: Trip Length Distribution Comparison......................................................................................................................... 59 Table 25: Sector to Sector Comparison ...................................................................................................................................... 60 Table 26: Acceptability Criteria for Short Screenlines .............................................................................................................. 61 Table 27: Screenline Performance, Cars (Replaces Table 99) .................................................................................................. 62 Table 28: Screenline Performance, All Vehicles (Replaces Table 100) .................................................................................... 62 Table 29: Individual RSI Site Vehicle Flow Tests (Replaces Table 101) ................................................................................... 63 Table 30: Individual Calibration Site Vehicle Flow Tests (Replaces Table 102) ...................................................................... 64 Table 31: Individual Validation Site Vehicle Flow Tests (Replaces Table 103) ....................................................................... 65 Table 32: Turning Counts within WebTAG Link Criteria ........................................................................................................... 66 Table 33: Journey Time Comparison Latest Model (Replaces Table 116) ............................................................................... 67 Table 34: P&R Survey Sites ......................................................................................................................................................... 70 Table 35: P&R Parking Spaces .................................................................................................................................................... 70 Table 36: Garforth P&R Survey Count Summary ....................................................................................................................... 72 Table 37: New Pudsey P&R Survey Count Summary ................................................................................................................ 73 Table 38: King Lane P&R Survey Count Summary .................................................................................................................... 74 Table 39: Interviews ...................................................................................................................................................................... 74 Table 40: Parking Location .......................................................................................................................................................... 75 Table 41: Average Car Occupancy .............................................................................................................................................. 75 Table 42: Journey Destination ..................................................................................................................................................... 75 Table 43: Garforth Estimated Total Vehicle Activity for Leeds City Centre Passengers ........................................................ 76 Table 44: New Pudsey Estimated Total Vehicle Activity for Leeds City Centre Passengers ................................................. 76 Table 45: Journey Purpose .......................................................................................................................................................... 76 Table 46: Alternative to P&R %.................................................................................................................................................... 76 Table 47: Reason for Using P&R Percentages ........................................................................................................................... 77 Table 48: Garforth Arrival to Expected Return Time ................................................................................................................. 78 Table 49: New Pudsey Arrival to Expected Return Time ........................................................................................................... 78 Table 50: King Lane Arrival to Expected Return Time .............................................................................................................. 79 Table 51: Average Distance Travelled to Park and Ride for Leeds City Centre Bound Passengers ..................................... 79 Table 52: Questionnaire ............................................................................................................................................................... 81 Figure 1 – Flows and Journey Times 0700 (Version 3) 12 Figure 2 – Flows and Journey Times 0800 (Version 3) .............................................................................................................. 13 Figure 3 – Flows and Journey Times 0900 (Version 3) .............................................................................................................. 14 Figure 4 – Flows and Journey Times Inter-Peak (Version 3) .................................................................................................... 15 Figure 5 – Flows and Journey Times 1600 (Version 3) .............................................................................................................. 16 Figure 6 – Flows and Journey Times 1700 (Version 3) .............................................................................................................. 17 Figure 7 – Flows and Journey Times 1800 (Version 3) .............................................................................................................. 18 Figure 8: Choice Model Structure ............................................................................................................................................... 28 Figure 9: Search Time Function .................................................................................................................................................. 31 Figure 10: Leeds Model Parking Area (red) and Ring Zones (green) ....................................................................................... 33 Figure 11: ASCs in the interpeak (other periods similar), One-Way Trip ................................................................................. 43 Figure 12: Modelled versus Observed Vehicle Entries – Leeds ............................................................................................... 45 Figure 13: Modelled versus Observed Interpeak Occupancies – Leeds .................................................................................. 47


Introduction

AECOM Leeds NGT 4
Capabilities on project:
Transportation
1.1 Introduction
The Leeds Transport Model (LTM) was developed by AECOM during 2008 – 2010 as a WebTAG compliant transport demand
and supply model.
This model covers the Leeds area and was used to assess the New Generation Transport (NGT) scheme as part of the March
2012 re-submission of the scheme to DfT.
The purpose of report is to document the changes made to LTM since March 2012 re-submission. A number of updates have
been made to the model to further improve its ability to predict the benefits and impacts of the NGT scheme and to better reflect
base year highway conditions.
1.2 Background
LTM was developed in 2008/10 from a series of travel surveys in 2008. Following the completion of the model a number of
reports were prepared which describe the model and the level of calibration and validation achieved by the various components
of the model. A separate report sets out in more detail the calibration and validation of the supply models in the area around the
NGT scheme. These reports need to be read in conjunction to this report. These reports can be grouped by category:
Data collection
Leeds Transport Model - Report of Surveys - January 2010
Model Development, Structure and Validation
Leeds Transport Model – Demand Model Report – July 2011
Leeds Transport Model – Highway Assignment Model Development and Validation Report – September 2011
Leeds Public Transport Model LMVR – August 2011
Forecasting
Leeds Transport Model – Forecasting Methodology and Core Scenario Results – March 2012
Use of Model for Forecasting NGT Demand
New Generation Transport - Model Validation Report – March 2012
The LTM was developed with the purpose that it would support a Transport Innovation Fund bid. However, this funding stream
was withdrawn prior to the model being competed. The model was also intended to support major scheme business case
development as well as assessment of policy and the impact of planning policy. Clearly, there are many potential uses of a model
of this nature but it is not always an effective use of resources to develop the model to a high standard of validation across the
entire model area. General models of this nature may need some localised calibration to make them fit for the purpose of
assessing a particular scheme or policy.
Assessment of the Leeds NGT scheme has been and continues to be one of the principal uses of the LTM. During development
of the NGT business case as part of the March 2012 re-submission to DfT a number of aspects of the LTM were identified, which
if developed further, would improve the model’s ability to represent the impacts of the scheme. Since the DfT’s re-approval of
NGT, a number of upgrades to LTM have been undertaken in order that the modelled public transport and highway impacts used
as inputs in the preparation of the Transport and Works Order and Transport Assessment are suitably robust.
1 Introduction

AECOM Leeds NGT 5
Capabilities on project:
Transportation
1.3 Summary of Update Work
A number of improvements have been made to the LTM since March 2012. The main purpose of these updates was to improve
the capability of the model to assess the economic and operational impacts of the NGT scheme and to improve the validation of
the model over the whole of Leeds and the City Centre in particular.
These updates can be categorised by the sub model within LTM.
1.3.1.1 Highway Assignment Model
improvement in calibration and validation through use of additional traffic count and journey time data
1.3.1.2 Public Transport Assignment Model
Revised approach to the way that interchange is modelled
Revised walk network in the City Centre
Introduction of a new sub-mode choice model so that the choice between NGT and existing public transport is done
explicitly rather than as a route choice
1.3.1.3 Parking Model
New park and ride data collected at existing park and ride sites to improve calibration of the park and ride element of the
parking model
1.3.1.4 General Changes
The changes listed above all involved some refinement of the base year models. Also at the time this work was being undertaken
an updated set of values of time were released in WebTAG. These are in a 2010 price base and this are in line with other
changes in the appraisal guidance and TUBA. The opportunity was therefore taken to update the entire LTM from having a 2002
price base to having a 2010 one.
Values of time and vehicle operating costs have also been updated to bring them in line with WebTAG Unit 3.5.6 (August 2012).
All the changes made to the model have been implemented in line with guidance in the relevant WebTAG units which were
current at the start of 2013.
1.4 Structure of Report
This report has 4 following sections:
Section 2 describes the changes made to the highway model
Section 3 explains the changes made to the public transport model
Section 4 sets out the additional data that was collected to update the parking model
Section 5 describes how the base year model is then put together and the results of the realism checks that have been
undertaken.

Highway Model
AECOM Leeds NGT 7
Capabilities on project:
Transportation
2.1 Introduction
Work was undertaken to improve the calibration of the LTM Highway element of the model. This chapter discuses the changes made to the model and goes on to describe the validation of the model following these changes. The performance of the model within the NGT corridor is of particular interest and this is set out at the end of the chapter. The remainder of this chapter is split into the following sections:
Additional Data;
Summary of changes made; and
Validation along the NGT corridor.
2.2 Additional Data
Only limited count data for the M621 was made available at the time of the V2 model development and much of this came from
manual counts. Another data request was made to the Highways Agency as part of the update to V3 and this yielded more data
including automatic traffic counts for most sections of this road. This new data provided a more comprehensive and consistent
picture of flows on this road and was therefore used to improve the calibration of the model in this area.
In addition some turning count data that had been collected across Leeds during 2008 was also made available for the V3
update. These counts were at strategic junctions including many junctions on the outer and inner ring roads. These are all
manual turning counts that have been undertaken on one day only. These turning flows have been combined to link level so that
they are compared against modelled flows on the same basis as all other counts in the model. An additional validation check of
the turning counts has been made.
2.3 Changes Made
Over the past year the highway element of LTM has been used to test the NGT scheme as well as various development and
other transport initiatives. During this time a number of improvements to the coding of the highway network have been identified
and implemented.
Following these changes the highway demand matrices were then re-estimated. This used the original prior matrices which were
developed for the first version of the model. The original counts and mini screenlines were also used along with some of the new
counts forming new mini screenlines or extending existing ones. These screenlines were defined using the same standards for
data quality etc as used in the original model development.
No structural changes were made to the model formulation and the demonstration that the model was developed in compliance
with WebTAG 3.19 is set out in the version 2 Report (Leeds Transport Model – Highway Assignment Model Development and
Validation Report – September 2011). Tables from the updated model calibration, superseding those from version 2, are set out
in Appendix A. These demonstrate similar standards of validation across the modelled area although on balance the additional
refinement has resulted in a slight improvement. We therefore conclude that the model remains suitable for testing highway
strategies but not isolated local interventions at individual junctions subject to verification of the model performance in the area
affected.
The following section discusses the review of the model performance in the NGT corridor.
2 Highway Model
AECOM Leeds NGT 8
Capabilities on project:
Transportation
2.4 Validation along NGT Corridor
This section reports the validation of the Version 3 highway model flows along the NGT corridor. This analysis is structured into a number of comparisons followed by conclusions which are set out at the end of the chapter.
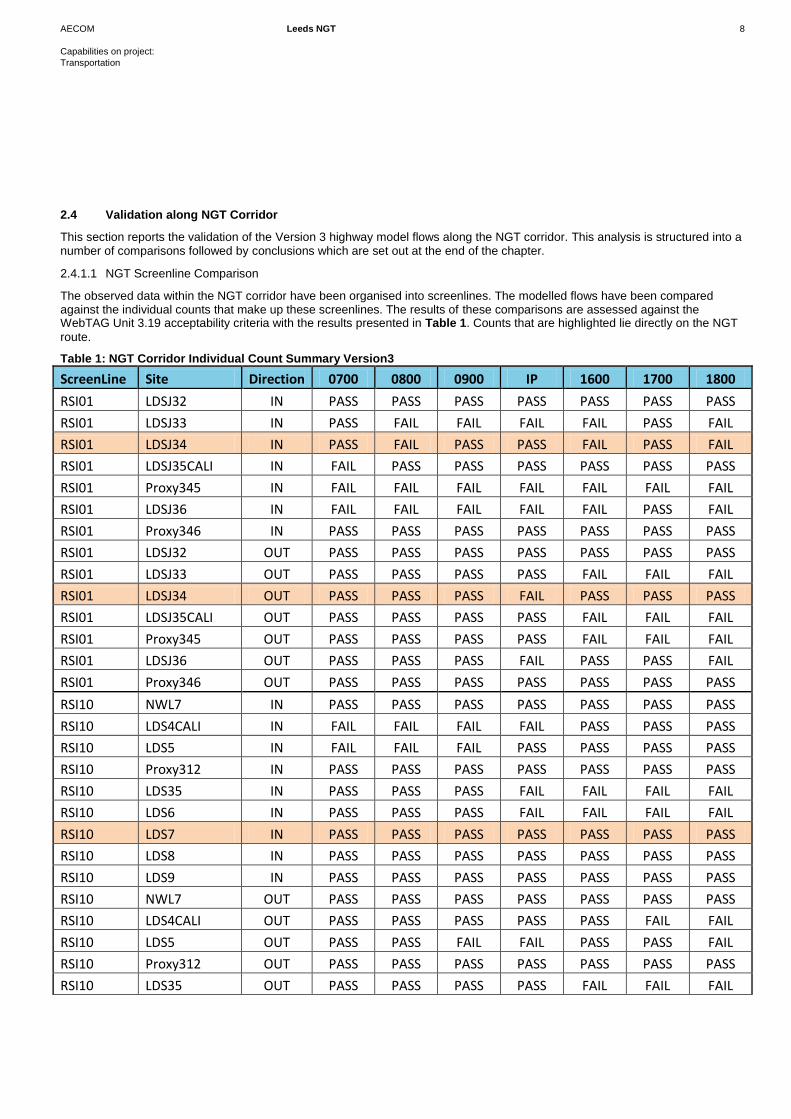
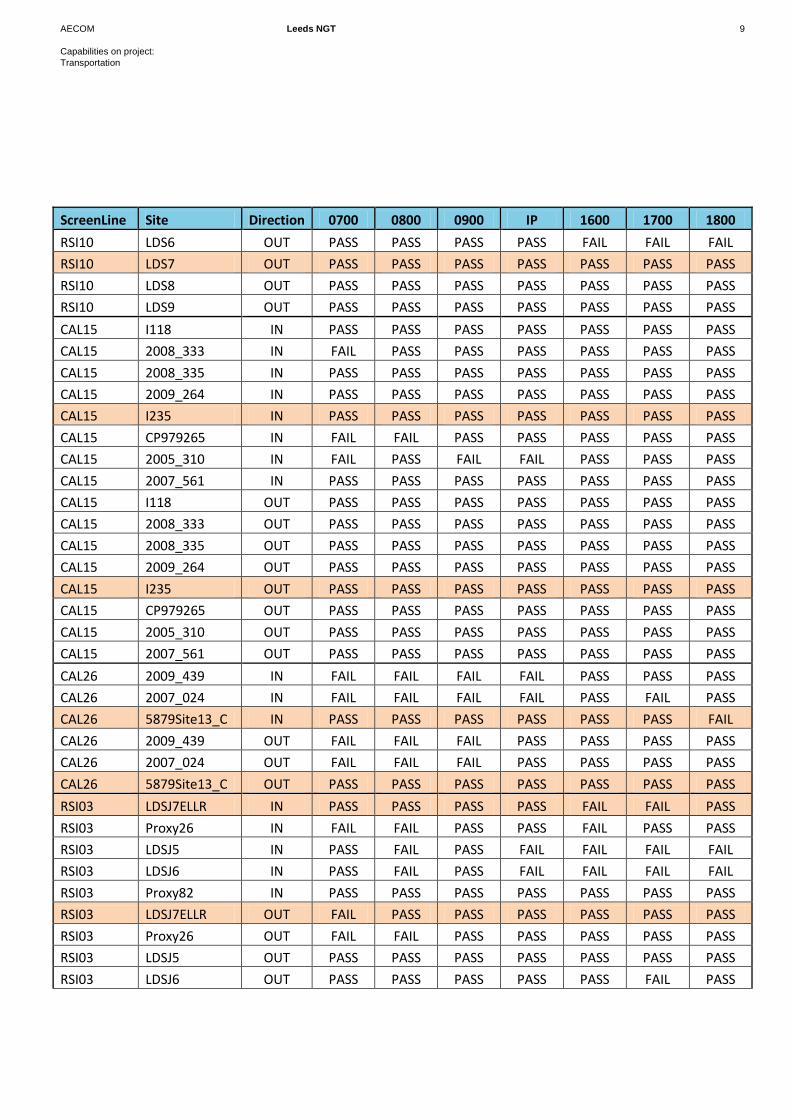
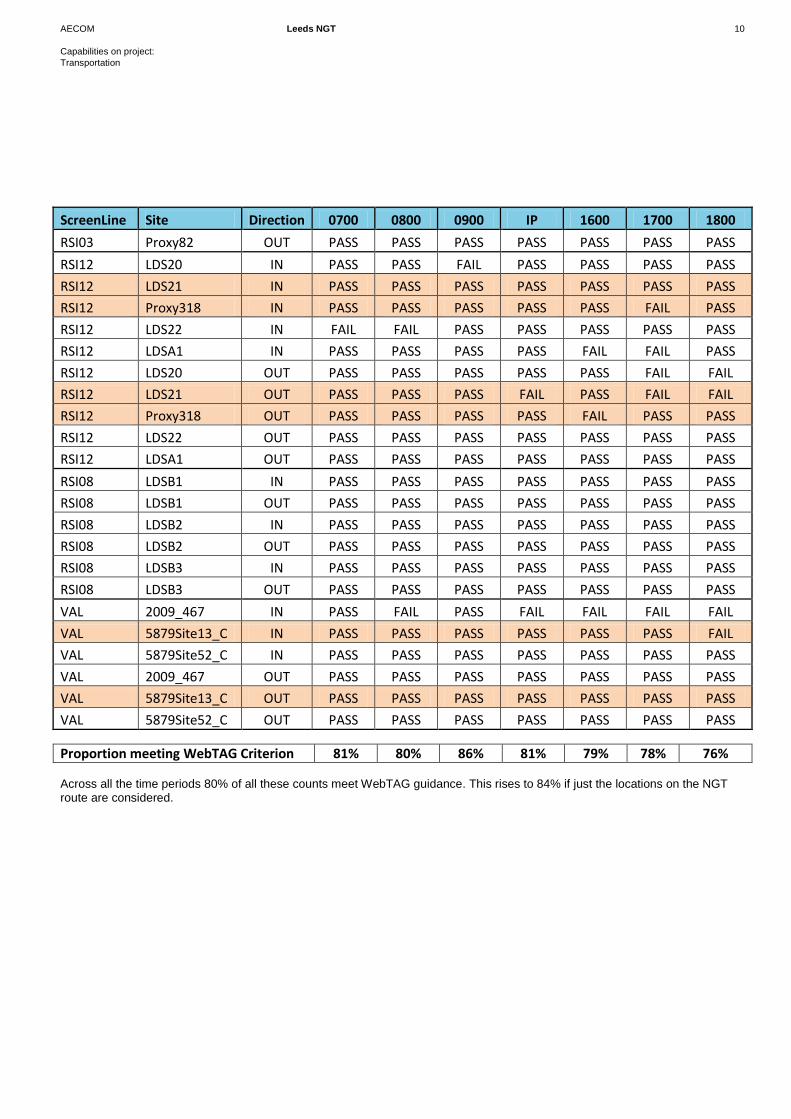
2.4.1.1 NGT Screenline Comparison
The observed data within the NGT corridor have been organised into screenlines. The modelled flows have been compared against the individual counts that make up these screenlines. The results of these comparisons are assessed against the WebTAG Unit 3.19 acceptability criteria with the results presented in Table 1. Counts that are highlighted lie directly on the NGT
route.
Table 1: NGT Corridor Individual Count Summary Version3
ScreenLine Site Direction 0700 0800 0900 IP 1600 1700 1800
RSI01 LDSJ32 IN PASS PASS PASS PASS PASS PASS PASS
RSI01 LDSJ33 IN PASS FAIL FAIL FAIL FAIL PASS FAIL
RSI01 LDSJ34 IN PASS FAIL PASS PASS FAIL PASS FAIL
RSI01 LDSJ35CALI IN FAIL PASS PASS PASS PASS PASS PASS
RSI01 Proxy345 IN FAIL FAIL FAIL FAIL FAIL FAIL FAIL
RSI01 LDSJ36 IN FAIL FAIL FAIL FAIL FAIL PASS FAIL
RSI01 Proxy346 IN PASS PASS PASS PASS PASS PASS PASS
RSI01 LDSJ32 OUT PASS PASS PASS PASS PASS PASS PASS
RSI01 LDSJ33 OUT PASS PASS PASS PASS FAIL FAIL FAIL
RSI01 LDSJ34 OUT PASS PASS PASS FAIL PASS PASS PASS
RSI01 LDSJ35CALI OUT PASS PASS PASS PASS FAIL FAIL FAIL
RSI01 Proxy345 OUT PASS PASS PASS PASS FAIL FAIL FAIL
RSI01 LDSJ36 OUT PASS PASS PASS FAIL PASS PASS FAIL
RSI01 Proxy346 OUT PASS PASS PASS PASS PASS PASS PASS
RSI10 NWL7 IN PASS PASS PASS PASS PASS PASS PASS
RSI10 LDS4CALI IN FAIL FAIL FAIL FAIL PASS PASS PASS
RSI10 LDS5 IN FAIL FAIL FAIL PASS PASS PASS PASS
RSI10 Proxy312 IN PASS PASS PASS PASS PASS PASS PASS
RSI10 LDS35 IN PASS PASS PASS FAIL FAIL FAIL FAIL
RSI10 LDS6 IN PASS PASS PASS FAIL FAIL FAIL FAIL
RSI10 LDS7 IN PASS PASS PASS PASS PASS PASS PASS
RSI10 LDS8 IN PASS PASS PASS PASS PASS PASS PASS
RSI10 LDS9 IN PASS PASS PASS PASS PASS PASS PASS
RSI10 NWL7 OUT PASS PASS PASS PASS PASS PASS PASS
RSI10 LDS4CALI OUT PASS PASS PASS PASS PASS FAIL FAIL
RSI10 LDS5 OUT PASS PASS FAIL FAIL PASS PASS FAIL
RSI10 Proxy312 OUT PASS PASS PASS PASS PASS PASS PASS
RSI10 LDS35 OUT PASS PASS PASS PASS FAIL FAIL FAIL
AECOM Leeds NGT 9
Capabilities on project:
Transportation
ScreenLine Site Direction 0700 0800 0900 IP 1600 1700 1800
RSI10 LDS6 OUT PASS PASS PASS PASS FAIL FAIL FAIL
RSI10 LDS7 OUT PASS PASS PASS PASS PASS PASS PASS
RSI10 LDS8 OUT PASS PASS PASS PASS PASS PASS PASS
RSI10 LDS9 OUT PASS PASS PASS PASS PASS PASS PASS
CAL15 I118 IN PASS PASS PASS PASS PASS PASS PASS
CAL15 2008_333 IN FAIL PASS PASS PASS PASS PASS PASS
CAL15 2008_335 IN PASS PASS PASS PASS PASS PASS PASS
CAL15 2009_264 IN PASS PASS PASS PASS PASS PASS PASS
CAL15 I235 IN PASS PASS PASS PASS PASS PASS PASS
CAL15 CP979265 IN FAIL FAIL PASS PASS PASS PASS PASS
CAL15 2005_310 IN FAIL PASS FAIL FAIL PASS PASS PASS
CAL15 2007_561 IN PASS PASS PASS PASS PASS PASS PASS
CAL15 I118 OUT PASS PASS PASS PASS PASS PASS PASS
CAL15 2008_333 OUT PASS PASS PASS PASS PASS PASS PASS
CAL15 2008_335 OUT PASS PASS PASS PASS PASS PASS PASS
CAL15 2009_264 OUT PASS PASS PASS PASS PASS PASS PASS
CAL15 I235 OUT PASS PASS PASS PASS PASS PASS PASS
CAL15 CP979265 OUT PASS PASS PASS PASS PASS PASS PASS
CAL15 2005_310 OUT PASS PASS PASS PASS PASS PASS PASS
CAL15 2007_561 OUT PASS PASS PASS PASS PASS PASS PASS
CAL26 2009_439 IN FAIL FAIL FAIL FAIL PASS PASS PASS
CAL26 2007_024 IN FAIL FAIL FAIL FAIL PASS FAIL PASS
CAL26 5879Site13_C IN PASS PASS PASS PASS PASS PASS FAIL
CAL26 2009_439 OUT FAIL FAIL FAIL PASS PASS PASS PASS
CAL26 2007_024 OUT FAIL FAIL FAIL PASS PASS PASS PASS
CAL26 5879Site13_C OUT PASS PASS PASS PASS PASS PASS PASS
RSI03 LDSJ7ELLR IN PASS PASS PASS PASS FAIL FAIL PASS
RSI03 Proxy26 IN FAIL FAIL PASS PASS FAIL PASS PASS
RSI03 LDSJ5 IN PASS FAIL PASS FAIL FAIL FAIL FAIL
RSI03 LDSJ6 IN PASS FAIL PASS FAIL FAIL FAIL FAIL
RSI03 Proxy82 IN PASS PASS PASS PASS PASS PASS PASS
RSI03 LDSJ7ELLR OUT FAIL PASS PASS PASS PASS PASS PASS
RSI03 Proxy26 OUT FAIL FAIL PASS PASS PASS PASS PASS
RSI03 LDSJ5 OUT PASS PASS PASS PASS PASS PASS PASS
RSI03 LDSJ6 OUT PASS PASS PASS PASS PASS FAIL PASS
AECOM Leeds NGT 10
Capabilities on project:
Transportation
ScreenLine Site Direction 0700 0800 0900 IP 1600 1700 1800
RSI03 Proxy82 OUT PASS PASS PASS PASS PASS PASS PASS
RSI12 LDS20 IN PASS PASS FAIL PASS PASS PASS PASS
RSI12 LDS21 IN PASS PASS PASS PASS PASS PASS PASS
RSI12 Proxy318 IN PASS PASS PASS PASS PASS FAIL PASS
RSI12 LDS22 IN FAIL FAIL PASS PASS PASS PASS PASS
RSI12 LDSA1 IN PASS PASS PASS PASS FAIL FAIL PASS
RSI12 LDS20 OUT PASS PASS PASS PASS PASS FAIL FAIL
RSI12 LDS21 OUT PASS PASS PASS FAIL PASS FAIL FAIL
RSI12 Proxy318 OUT PASS PASS PASS PASS FAIL PASS PASS
RSI12 LDS22 OUT PASS PASS PASS PASS PASS PASS PASS
RSI12 LDSA1 OUT PASS PASS PASS PASS PASS PASS PASS
RSI08 LDSB1 IN PASS PASS PASS PASS PASS PASS PASS
RSI08 LDSB1 OUT PASS PASS PASS PASS PASS PASS PASS
RSI08 LDSB2 IN PASS PASS PASS PASS PASS PASS PASS
RSI08 LDSB2 OUT PASS PASS PASS PASS PASS PASS PASS
RSI08 LDSB3 IN PASS PASS PASS PASS PASS PASS PASS
RSI08 LDSB3 OUT PASS PASS PASS PASS PASS PASS PASS
VAL 2009_467 IN PASS FAIL PASS FAIL FAIL FAIL FAIL
VAL 5879Site13_C IN PASS PASS PASS PASS PASS PASS FAIL
VAL 5879Site52_C IN PASS PASS PASS PASS PASS PASS PASS
VAL 2009_467 OUT PASS PASS PASS PASS PASS PASS PASS
VAL 5879Site13_C OUT PASS PASS PASS PASS PASS PASS PASS
VAL 5879Site52_C OUT PASS PASS PASS PASS PASS PASS PASS
Proportion meeting WebTAG Criterion 81% 80% 86% 81% 79% 78% 76%
Across all the time periods 80% of all these counts meet WebTAG guidance. This rises to 84% if just the locations on the NGT route are considered.
AECOM Leeds NGT 11
Capabilities on project:
Transportation
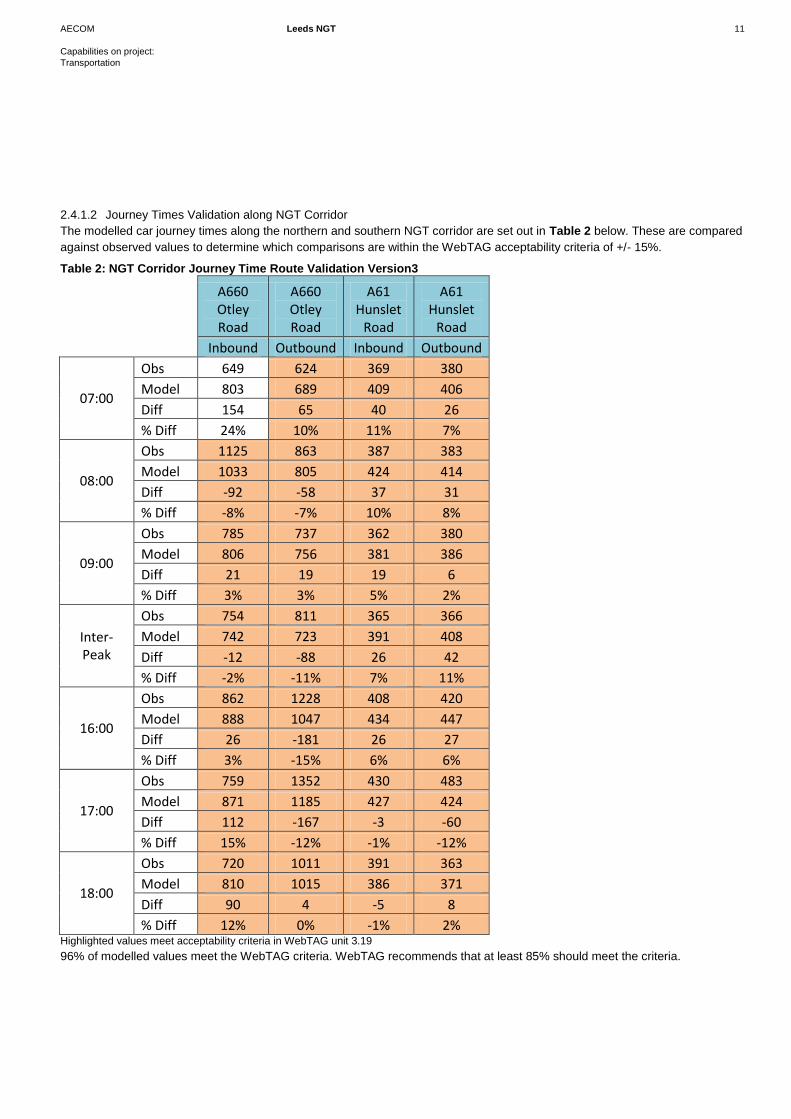
2.4.1.2 Journey Times Validation along NGT Corridor
The modelled car journey times along the northern and southern NGT corridor are set out in Table 2 below. These are compared
against observed values to determine which comparisons are within the WebTAG acceptability criteria of +/- 15%.
Table 2: NGT Corridor Journey Time Route Validation Version3
A660 Otley Road
A660 Otley Road
A61 Hunslet
Road
A61 Hunslet
Road
Inbound Outbound Inbound Outbound
07:00
Obs 649 624 369 380
Model 803 689 409 406
Diff 154 65 40 26
% Diff 24% 10% 11% 7%
08:00
Obs 1125 863 387 383
Model 1033 805 424 414
Diff -92 -58 37 31
% Diff -8% -7% 10% 8%
09:00
Obs 785 737 362 380
Model 806 756 381 386
Diff 21 19 19 6
% Diff 3% 3% 5% 2%
Inter-Peak
Obs 754 811 365 366
Model 742 723 391 408
Diff -12 -88 26 42
% Diff -2% -11% 7% 11%
16:00
Obs 862 1228 408 420
Model 888 1047 434 447
Diff 26 -181 26 27
% Diff 3% -15% 6% 6%
17:00
Obs 759 1352 430 483
Model 871 1185 427 424
Diff 112 -167 -3 -60
% Diff 15% -12% -1% -12%
18:00
Obs 720 1011 391 363
Model 810 1015 386 371
Diff 90 4 -5 8
% Diff 12% 0% -1% 2% Highlighted values meet acceptability criteria in WebTAG unit 3.19
96% of modelled values meet the WebTAG criteria. WebTAG recommends that at least 85% should meet the criteria.
AECOM Leeds NGT 12
Capabilities on project:
Transportation
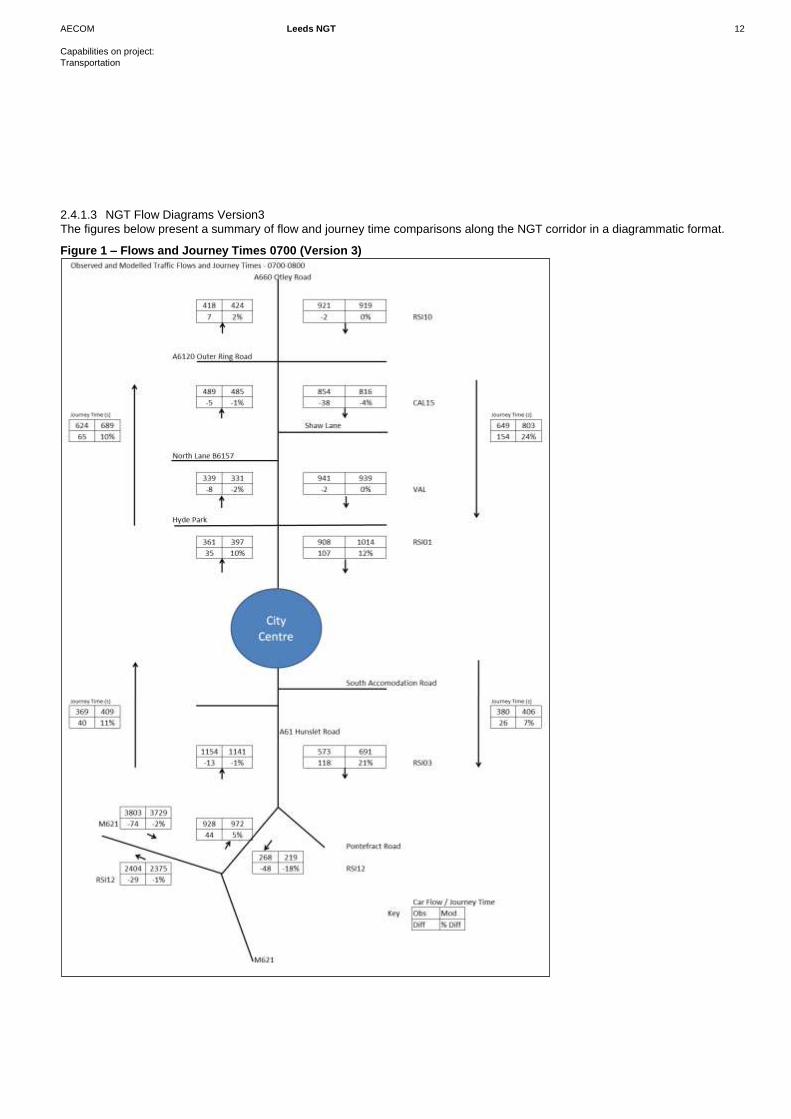
2.4.1.3 NGT Flow Diagrams Version3
The figures below present a summary of flow and journey time comparisons along the NGT corridor in a diagrammatic format.
Figure 1 – Flows and Journey Times 0700 (Version 3)

AECOM Leeds NGT 13
Capabilities on project:
Transportation
Figure 2 – Flows and Journey Times 0800 (Version 3)
AECOM Leeds NGT 14
Capabilities on project:
Transportation
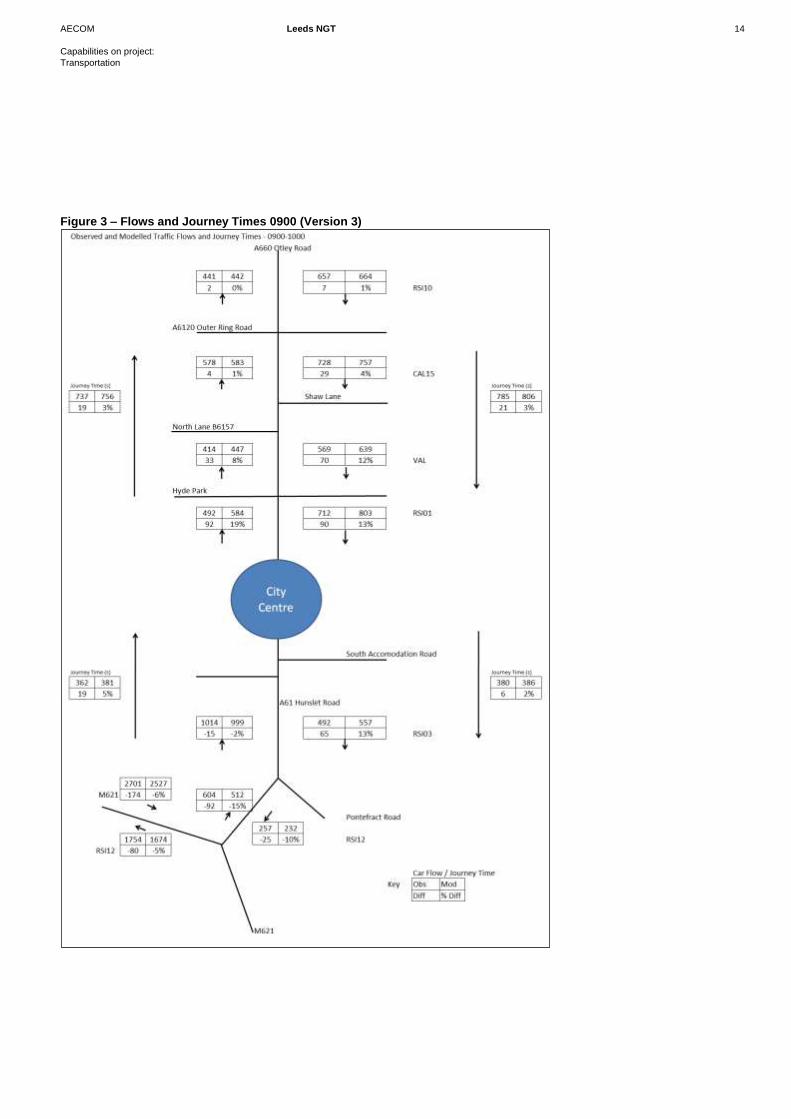
Figure 3 – Flows and Journey Times 0900 (Version 3)

AECOM Leeds NGT 15
Capabilities on project:
Transportation
Figure 4 – Flows and Journey Times Inter-Peak (Version 3)

AECOM Leeds NGT 16
Capabilities on project:
Transportation
Figure 5 – Flows and Journey Times 1600 (Version 3)
AECOM Leeds NGT 17
Capabilities on project:
Transportation
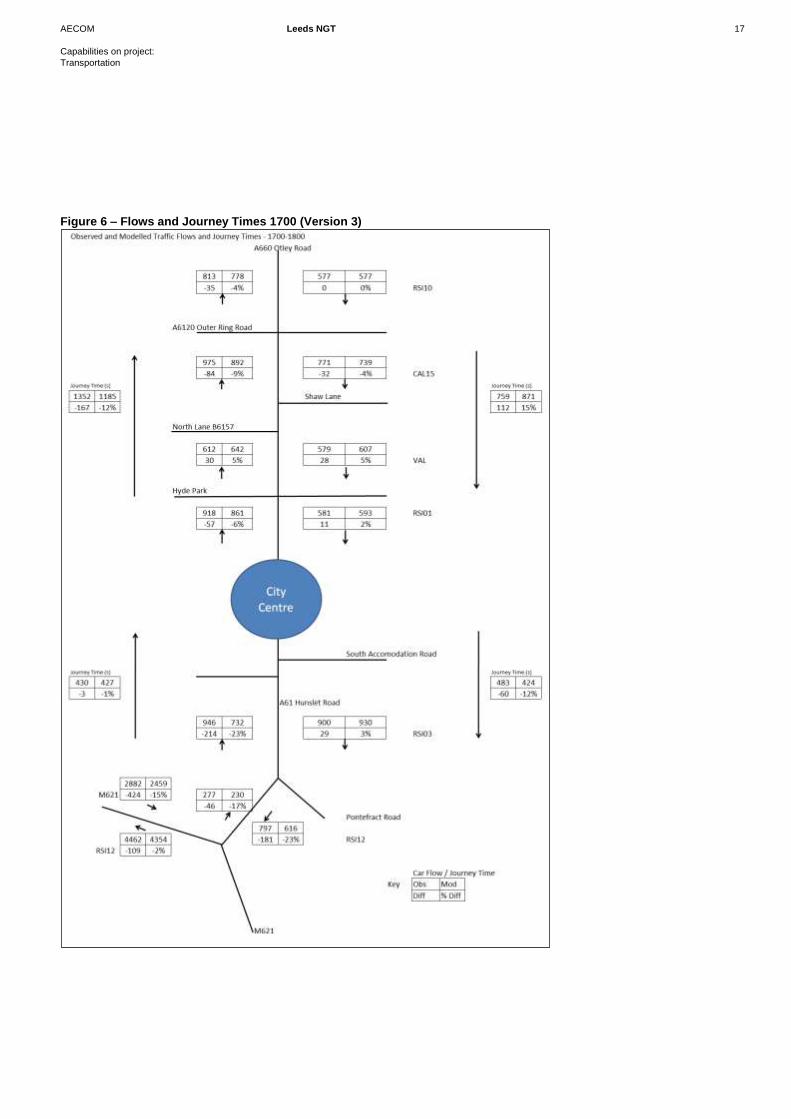
Figure 6 – Flows and Journey Times 1700 (Version 3)

AECOM Leeds NGT 18
Capabilities on project:
Transportation
Figure 7 – Flows and Journey Times 1800 (Version 3)

AECOM Leeds NGT 19
Capabilities on project:
Transportation
2.5 Conclusions
The review of the model performance of the highway model along the NGT corridor demonstrates close alignment with WebTAG
acceptability guidelines (for 85% of observations being within the difference criterion). While the journey time comparisons
demonstrate that the guideline is exceeded the flow comparisons indicate slightly greater variation between modelled flows and
counts. These comparisons indicate a generally good reproduction of flows and travel conditions along and adjacent to the
corridor.
The model outputs for the NGT business case (benefits) are particularly dependent on journey times and the model
demonstrates a high standard of performance in this regard. Nevertheless, as with most strategic highway models, there are
some differences between modelled flows and counts at individual junctions and there is therefore a need for care in using
detailed local outputs. To ensure their suitability; the detailed model flow forecasts should be supplemented with more local data
and models for the purpose of junction design.

Public Transport Model
AECOM Leeds NGT 21
Capabilities on project:
Transportation
3.1 Introduction
A number of changes have been made to the public transport model within LTM between Version 2 and Version 3. The main aim
of these changes was to improve the ability of LTM to forecast the usage and benefits of NGT responding to comments made by
DfT at the re-submission stage.
Work undertaken in discussion with the DfT when preparing the NGT re-submission business case included consideration of how
NGT was represented in the public transport assignment model. At the time of the submission it was recognised that the
forecasts had a larger number of transfer passengers than anticipated and also passenger numbers northbound in the PM peak
which were larger than anticipated. The testing undertaken at the time of the re-submission indicated that the business case was
not materially sensitive to the detailed modelling assumptions that led to these two outcomes. Nevertheless, work has been
undertaken to revise the modelling approach to address these two issues.
The northbound PM peak flow has been addressed through revisions to the forecasting assumptions by the explicit estimation of
NGT run times. This is explained in the Leeds Transport Model Forecasting and NGT Central Case report (October 2013).
This chapter first explains the updates made to the assignment model to respond to the comments and then presents the
updated model validation.
3.2 Changes Made
After careful analysis of the factors influencing the forecast level and pattern of interchange, we made three distinct changes to
the public transport model:
- first we increased the detail with which the walk network within central Leeds was represented, it provides a more
accurate representation of the choice of whether to walk or to transfer between public transport services on arrival at a
stop or station; this was implemented by adding an explicit representation of roads and pedestrianised walkways within
the city centre;
- secondly, recognising that a single parameter was being used both to represent how demand chooses which bus stop
board and alight at and to represent mode choice between NGT and bus, we refined the assignment method to use
distinct parameters better to represent the differences between these distinct types of choice; this was implemented
through by adding a logit based choice model1 to represent the choice between new distinct services, such as NGT, and
the existing modes; and
- finally, we refined the assignment parameters reflecting the refined use with the revised assignment method.
The parameters applied in the model were as follows
- a scale parameter of -0.2 (/minute) was used for the choice of boarding and alighting stop; this is the default value
specified by Citilabs for the CUBE software platform;
- a scale parameter of -0.08 (/minute) was used for the choice between NGT and other modes; this was the value
calibrated in research undertaken to understand likely perceptions of NGT;
- transfer penalties were set to be equivalent to10 minutes2; this is the upper end of the range indicated in WebTAG
3.10.2 (Para 1.10.10)
1 The approach is introduced in WebTAG 3.11.2 para 7.7
2 This refers to the overall transfer penalty, combining a boarding penalty, quality factor and transfer penalty which
are separately represented in the model.
3 Public Transport Model

AECOM Leeds NGT 22
Capabilities on project:
Transportation
3.3 Impact on Validation
Following the changes made to the base year model it was necessary to re-calibrate the public transport network. This was done
by redefining centroid connectors as a result of reviewing the location of housing and buildings within zones relative to access to
bus stops and train stations. No further adjustments to the demand matrix were necessary.
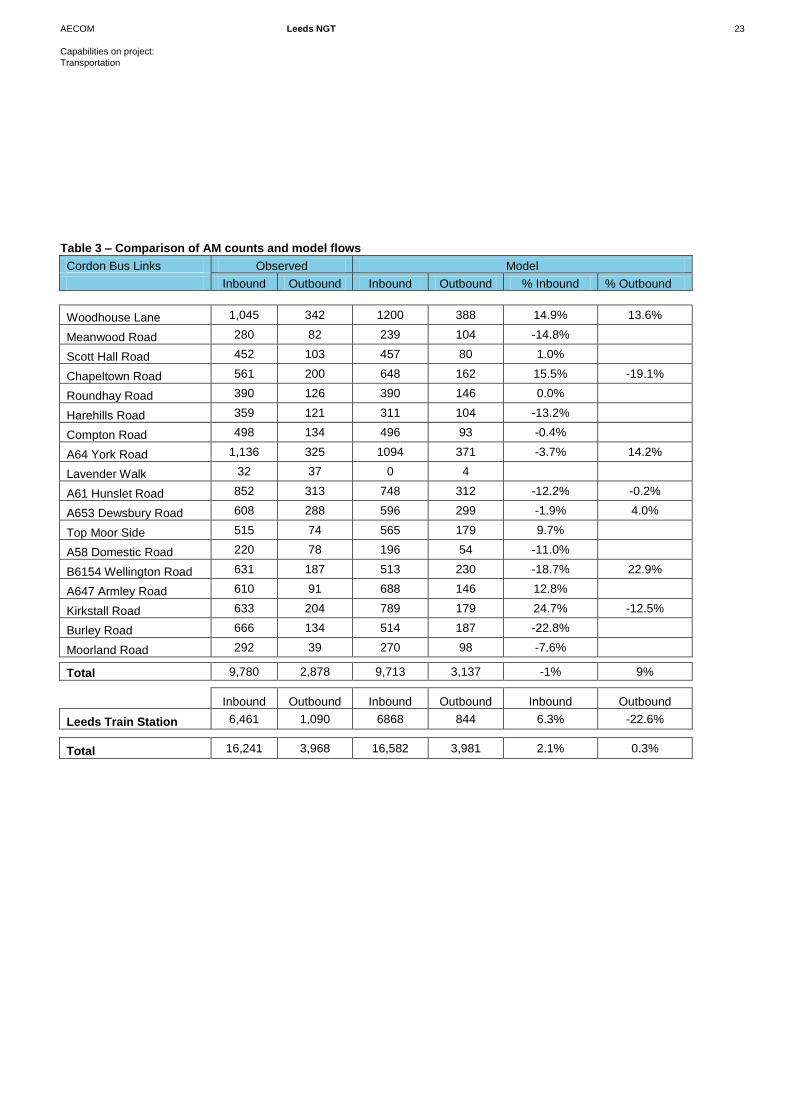
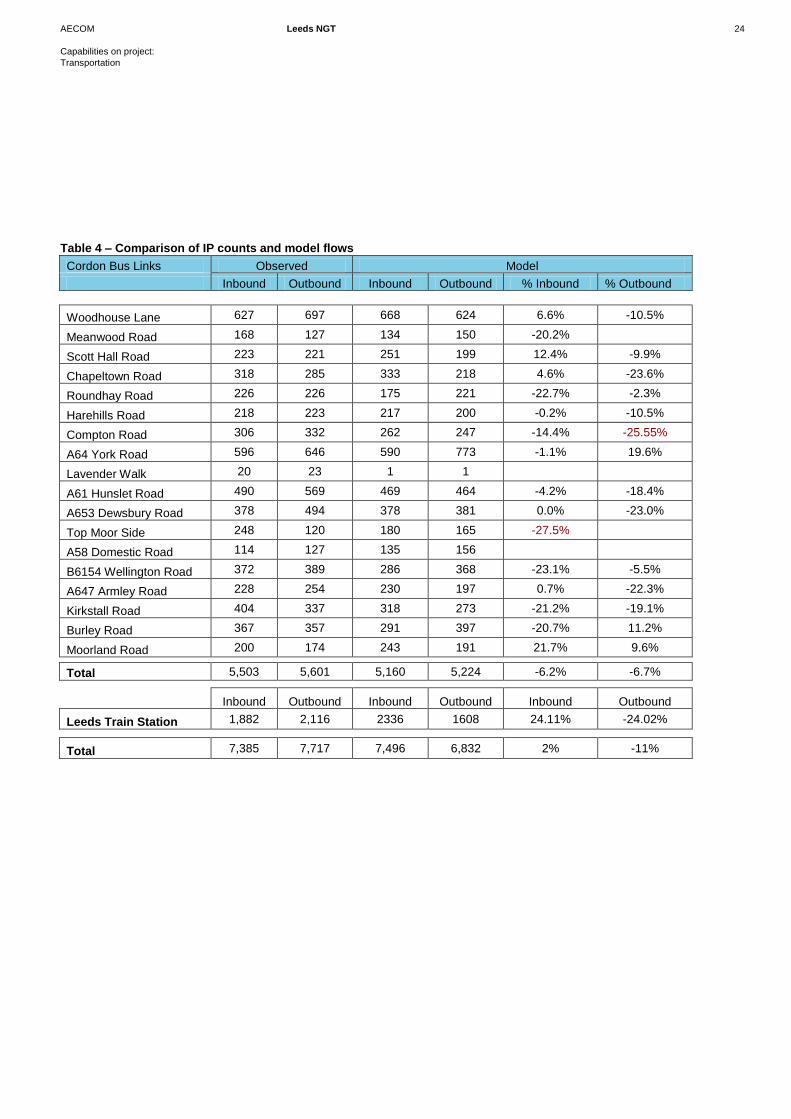
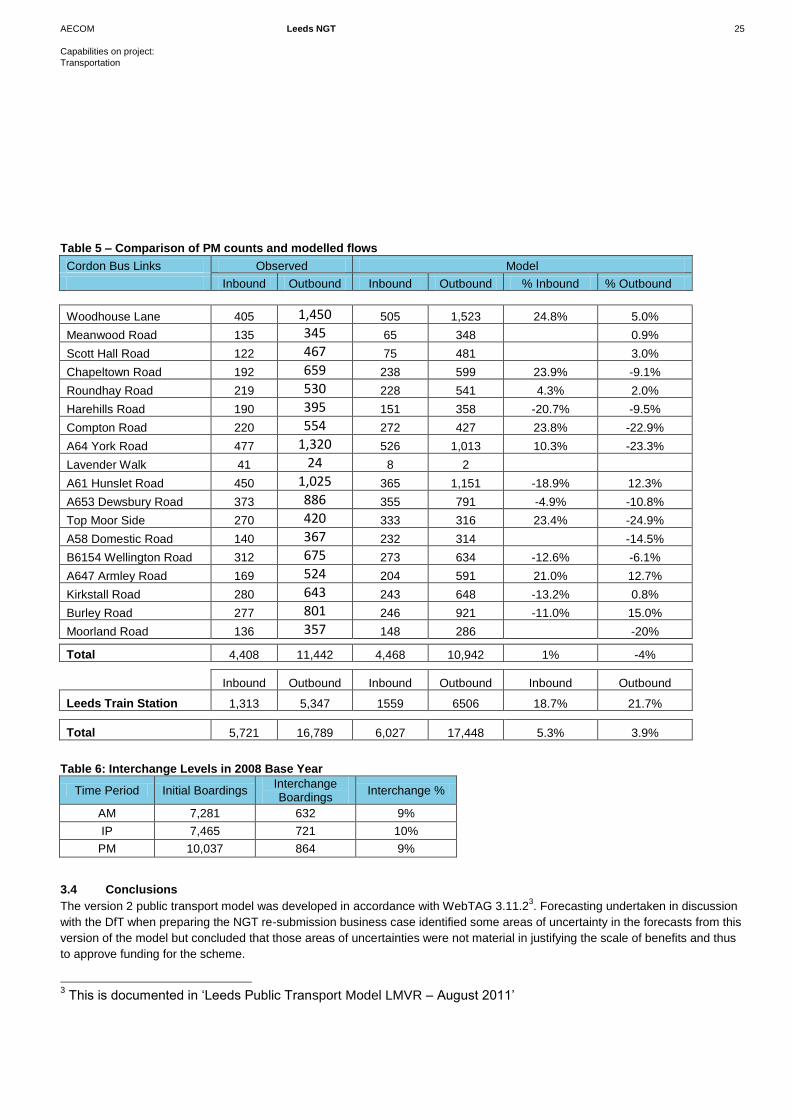
WebTAG 3.11.2 sets out a criterion for testing the performance of public transport model. For corridors where flows exceed 150
passengers, the test is that modelled flows should be within +/-25% of counts. The results in Table 3 show that the passenger
flows in all the corridors in the AM period are within this +/- 25%. In the IP period (Table 4) all the corridors with the exception of
Compton Road Outbound (25.6%) and Top Moor Side inbound (27.5%) are within +/- 25% of the survey counts. The results in
Table 5 show that all corridors in the PM period are within +/- 25% of survey counts. These tables demonstrate a satisfactory
reproduction of the independent counts.
3.3.1.1 Impact on Interchange
This is not a test specified in WebTAG, but has been included to test enhancements made in the model development. There are
therefore no formal requirements set out in guidance. The level of bus to bus interchange in the model following the various
changes and updates is set out in Table 6. This is calculated as the number of trips making a bus to bus interchange as a
proportion of initial bus boardings. The modelled proportion of transfers ranges between 9 and 10% and demonstrates
consistency with the 11% observed value.
AECOM Leeds NGT 23
Capabilities on project:
Transportation
Table 3 – Comparison of AM counts and model flows
Cordon Bus Links Observed Model
Inbound Outbound Inbound Outbound % Inbound % Outbound
Woodhouse Lane 1,045 342 1200 388 14.9% 13.6%
Meanwood Road 280 82 239 104 -14.8%
Scott Hall Road 452 103 457 80 1.0%
Chapeltown Road 561 200 648 162 15.5% -19.1%
Roundhay Road 390 126 390 146 0.0%
Harehills Road 359 121 311 104 -13.2%
Compton Road 498 134 496 93 -0.4%
A64 York Road 1,136 325 1094 371 -3.7% 14.2%
Lavender Walk 32 37 0 4
A61 Hunslet Road 852 313 748 312 -12.2% -0.2%
A653 Dewsbury Road 608 288 596 299 -1.9% 4.0%
Top Moor Side 515 74 565 179 9.7%
A58 Domestic Road 220 78 196 54 -11.0%
B6154 Wellington Road 631 187 513 230 -18.7% 22.9%
A647 Armley Road 610 91 688 146 12.8%
Kirkstall Road 633 204 789 179 24.7% -12.5%
Burley Road 666 134 514 187 -22.8%
Moorland Road 292 39 270 98 -7.6%
Total 9,780 2,878 9,713 3,137 -1% 9%
Inbound Outbound Inbound Outbound Inbound Outbound
Leeds Train Station 6,461 1,090 6868 844 6.3% -22.6%
Total 16,241 3,968 16,582 3,981 2.1% 0.3%
AECOM Leeds NGT 24
Capabilities on project:
Transportation
Table 4 – Comparison of IP counts and model flows
Cordon Bus Links Observed Model
Inbound Outbound Inbound Outbound % Inbound % Outbound
Woodhouse Lane 627 697 668 624 6.6% -10.5%
Meanwood Road 168 127 134 150 -20.2%
Scott Hall Road 223 221 251 199 12.4% -9.9%
Chapeltown Road 318 285 333 218 4.6% -23.6%
Roundhay Road 226 226 175 221 -22.7% -2.3%
Harehills Road 218 223 217 200 -0.2% -10.5%
Compton Road 306 332 262 247 -14.4% -25.55%
A64 York Road 596 646 590 773 -1.1% 19.6%
Lavender Walk 20 23 1 1
A61 Hunslet Road 490 569 469 464 -4.2% -18.4%
A653 Dewsbury Road 378 494 378 381 0.0% -23.0%
Top Moor Side 248 120 180 165 -27.5%
A58 Domestic Road 114 127 135 156
B6154 Wellington Road 372 389 286 368 -23.1% -5.5%
A647 Armley Road 228 254 230 197 0.7% -22.3%
Kirkstall Road 404 337 318 273 -21.2% -19.1%
Burley Road 367 357 291 397 -20.7% 11.2%
Moorland Road 200 174 243 191 21.7% 9.6%
Total 5,503 5,601 5,160 5,224 -6.2% -6.7%
Inbound Outbound Inbound Outbound Inbound Outbound
Leeds Train Station 1,882 2,116 2336 1608 24.11% -24.02%
Total 7,385 7,717 7,496 6,832 2% -11%
AECOM Leeds NGT 25
Capabilities on project:
Transportation
Table 5 – Comparison of PM counts and modelled flows
Cordon Bus Links Observed Model
Inbound Outbound Inbound Outbound % Inbound % Outbound
Woodhouse Lane 405 1,450 505 1,523 24.8% 5.0%
Meanwood Road 135 345 65 348 0.9%
Scott Hall Road 122 467 75 481 3.0%
Chapeltown Road 192 659 238 599 23.9% -9.1%
Roundhay Road 219 530 228 541 4.3% 2.0%
Harehills Road 190 395 151 358 -20.7% -9.5%
Compton Road 220 554 272 427 23.8% -22.9%
A64 York Road 477 1,320 526 1,013 10.3% -23.3%
Lavender Walk 41 24 8 2
A61 Hunslet Road 450 1,025 365 1,151 -18.9% 12.3%
A653 Dewsbury Road 373 886 355 791 -4.9% -10.8%
Top Moor Side 270 420 333 316 23.4% -24.9%
A58 Domestic Road 140 367 232 314 -14.5%
B6154 Wellington Road 312 675 273 634 -12.6% -6.1%
A647 Armley Road 169 524 204 591 21.0% 12.7%
Kirkstall Road 280 643 243 648 -13.2% 0.8%
Burley Road 277 801 246 921 -11.0% 15.0%
Moorland Road 136 357 148 286 -20%
Total 4,408 11,442 4,468 10,942 1% -4%
Inbound Outbound Inbound Outbound Inbound Outbound
Leeds Train Station 1,313 5,347 1559 6506 18.7% 21.7%
Total 5,721 16,789 6,027 17,448 5.3% 3.9%
Table 6: Interchange Levels in 2008 Base Year
Time Period Initial Boardings Interchange Boardings
Interchange %
AM 7,281 632 9%
IP 7,465 721 10%
PM 10,037 864 9%
3.4 Conclusions
The version 2 public transport model was developed in accordance with WebTAG 3.11.23. Forecasting undertaken in discussion
with the DfT when preparing the NGT re-submission business case identified some areas of uncertainty in the forecasts from this
version of the model but concluded that those areas of uncertainties were not material in justifying the scale of benefits and thus
to approve funding for the scheme.
3 This is documented in ‘Leeds Public Transport Model LMVR – August 2011’

AECOM Leeds NGT 26
Capabilities on project:
Transportation
Responding to questions raised in the DfT review, increased sophistication has been added to the version 3 public transport
model. This chapter has demonstrated that these changes have been implemented in accordance with WebTAG 3.11.2 and that
the model validation has been demonstrated to be consistent with the standards set out in guidance. It is therefore considered to
be suitable, as part of the wider LTM, to assess the benefits of the NGT scheme.

Parking Model
AECOM Leeds NGT 28
Capabilities on project:
Transportation
4.1 Introduction
The previous documentation relating to the Parking Model within LTM provided at the re-submission of the NGT business case in
March 2012 only provided a summary of how the Parking Model operates. Some additional detail is provided below.
As part of this update of LTM to Version 3, the representation of park-and-ride was improved in the model through the collection
of observed data at the three existing park-and-ride sites of King Lane (bus), Garforth (railway station) and New Pudsey (railway
station).
This document discusses the new data and presents the updated calibration results from the parking models.
4.2 The Parking Model
In order to understand the parking model and how it operates it is useful to set it in the context of the entire LTM.
LDM is a hierarchical logit model, and thus contains a number of different modules that deal with different aspects of traveller
choice. The choices are implemented in increasing order of sensitivity; this structure is necessary to ensure that higher-level
choices do not have an inconsistent effect on lower-level ones, and is in accordance with guidance in WebTAG Unit 3.10.3,
Section 1.9.
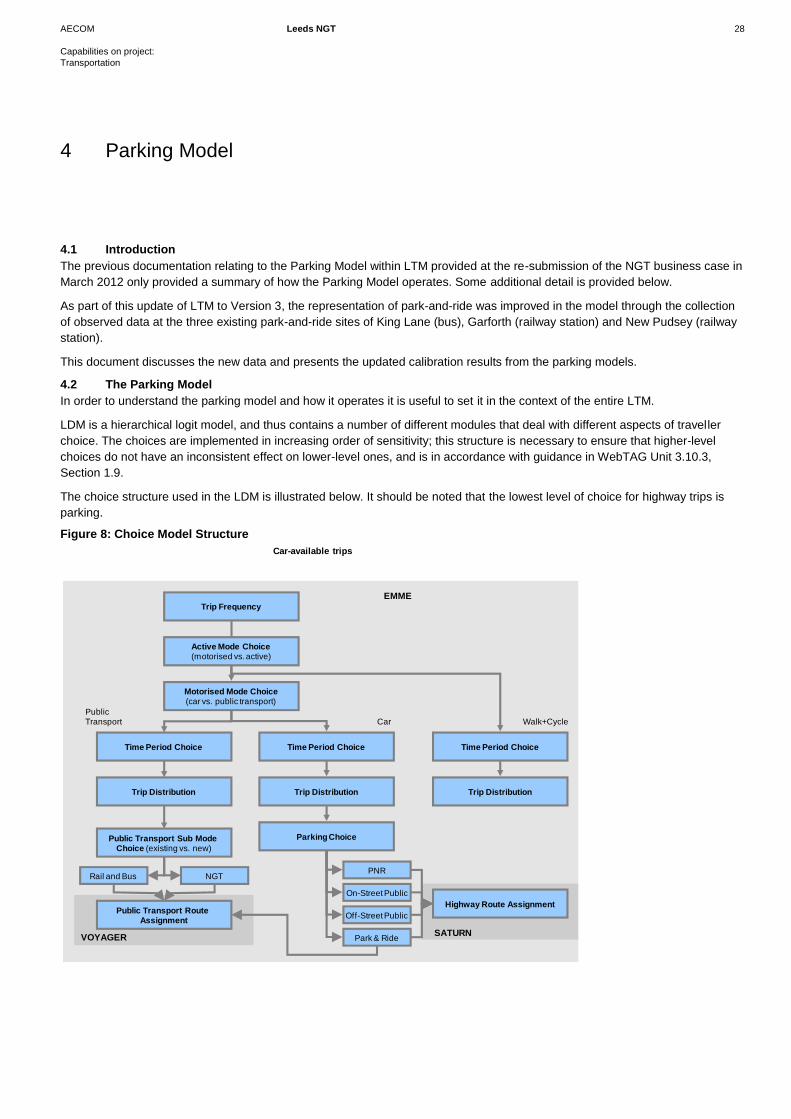
The choice structure used in the LDM is illustrated below. It should be noted that the lowest level of choice for highway trips is
parking.
Figure 8: Choice Model Structure
Motorised Mode Choice(car vs. public transport)
Trip Frequency
Car-available trips
Parking Choice
PublicTransport Car
Time Period Choice
Trip Distribution
PNR
Trip Distribution
Public Transport Sub Mode Choice (existing vs. new)
On-Street Public
Off-Street Public
Rail and Bus
VOYAGER
EMME
Time Period Choice
NGT
Active Mode Choice(motorised vs. active)
Time Period Choice
Walk+Cycle
Trip Distribution
Park & Ride
Public Transport Route Assignment
Highway Route Assignment
SATURN
4 Parking Model

AECOM Leeds NGT 29
Capabilities on project:
Transportation
Most of the choice models operate on the entire matrices, including external-external trips and all intra-zonal demand. The
parking model, however, is applied only to demand attracted to the centre of Leeds where parking constraints might materially
influence travel choices.
4.2.1.1 Generalised Cost Formulation
LDM responds to changes in generalised cost. This is a representation of all the costs to the traveller associated with travel,
including all of the following:
travel time;
fuel and other vehicle operating costs;
public transport fares;
tolls and congestion charges;
parking charges;
search time for parking spaces;
access/egress time to/from parking space and actual destination (walking);
waiting time for public transport services;
inconvenience associated with interchanging between public transport services;
inconvenience associated with travel on crowded public transport services; and
access/egress time to/from public transport services (including walking and motorised modes);
The expressions used to derive generalised costs for highway, active-mode and public transport trips are shown below. Note that
for mixed-mode (that is, park-and-ride) trips, a weighted sum of the relevant highway and public transport costs is used (highway
is weighted more highly to calibrate the size of the catchment area), that is, the highway cost to the park-and-ride site (including
parking search time) is added to the bus/rail cost from the site to destination.
at
af
TOF
st
tt
O *V
MMM
HighwayGenCost
atActiveGenCost
V
M
PTGenCost
T
CP
at
af
wt
wf
ht
tt
)(*82.0)(*71.1)( pkipipkPT
GenCostHighway
GenCostR&P
GenCost
where:
FM
monetary cost of fuel;
OM
monetary non-fuel vehicle operating cost;
TM
monetary value of all tolls and charges, inc. parking charges and public transport fares;

AECOM Leeds NGT 30
Capabilities on project:
Transportation
tt
travel time (timetabled in-vehicle time for public transport);
st
search time for a parking space;
af
weighting for active mode legs of mixed mode trips, assumed to be 1.8 currently;
at
walk time, derived approximately, from shortest path assignment of walk trips on the highway network with an
assumed fixed average walk speed;
ht
change in bus time due to forecast changes in traffic congestion;
wf
weighting for waiting time for public transport trips, assumed to be 2 currently;
wt
waiting time for public transport services;
CP
discomfort associated with travel on crowded public transport services;
V value of time, pence per minute; and
O vehicle occupancy.
Where demand is represented in tours (for all home-based person travel), the costs used are tour-costs, i.e. the total cost for
both legs of a tour, with cost data taken from the appropriate time periods.
The component cost (time, distance, fare, toll) matrices are derived from the LTM supply models.
The public transport model assigns concessionary and non-concessionary demand as separate segments. As this segmentation
is not present in the demand model, static proportions to split the demand model demand, by purpose, for public transport
assignment, are used. This is discussed more fully in the public transport model report.
A simplified EMME highway assignment model, based upon the full Saturn model, is used to provide costs to the demand model.
This has identical topology and link speed/flow relationships to the Saturn model, but uses simplified junction modelling, based
upon assignment of reference demand upon the Saturn networks to obtain an estimate of the delay/flow curves associated with
each turning movement.
There is no validated active modes (walk and cycle) network model: but a network derived from the highway network using fixed
speeds has been prepared to estimate active mode travel time. The interpeak highway network is used to derive active mode
costs, and to estimate cost changes by origin-destination movement in response to interventions.
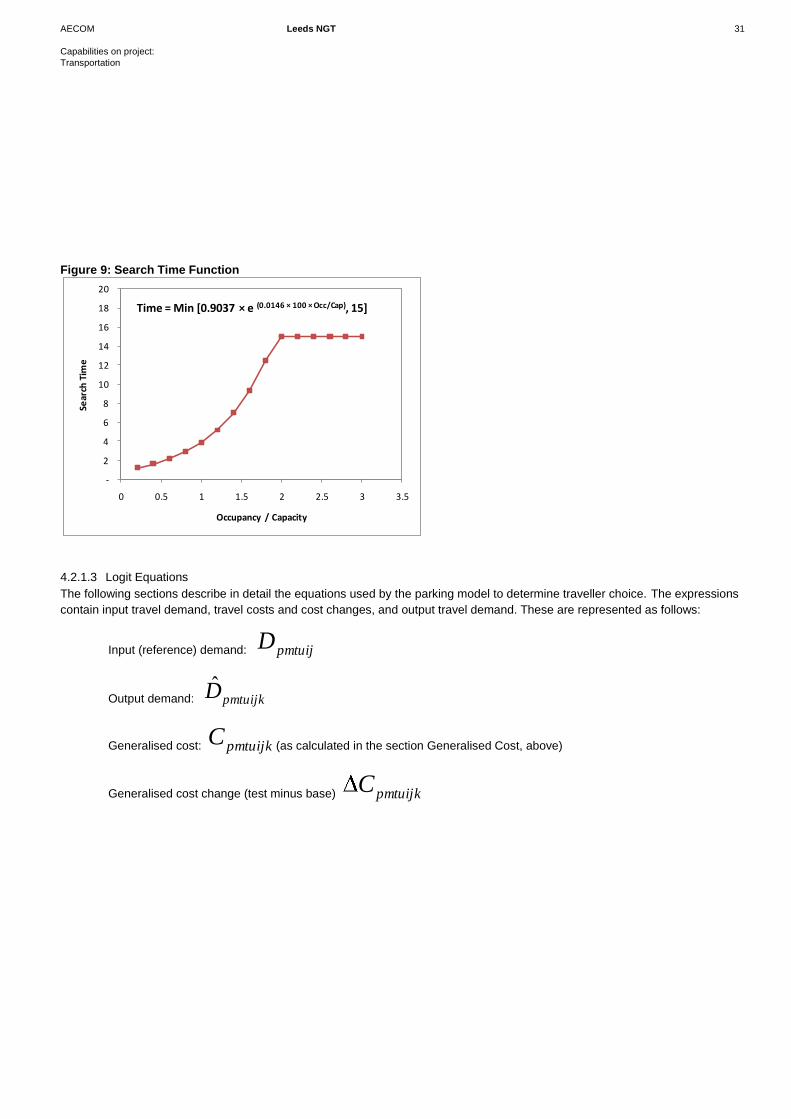
4.2.1.2 Search Times
For the parking model, it is necessary to estimate search times as a function of site capacity and occupancy. Search times have
been estimated based on the occupancy/capacity ratio, as shown by the function below. Occupancy/ Capacity ratios greater than
1 are considered, because in such circumstances cars must simply circle the car park until another car leaves. The model is not
designed to model significantly and consistently over-crowded car-parks.
Robust evidence for search times is currently limited. We have used results of a survey of search times in Leicester to inform the
search time function used in LTM. We note, however, that search times are small compared to other components of travel cost,
such as parking charges, and travel times.
AECOM Leeds NGT 31
Capabilities on project:
Transportation
Figure 9: Search Time Function
4.2.1.3 Logit Equations
The following sections describe in detail the equations used by the parking model to determine traveller choice. The expressions
contain input travel demand, travel costs and cost changes, and output travel demand. These are represented as follows:
Input (reference) demand: pmtuijD
Output demand: pmtuijkD̂
Generalised cost: pmtuijkC (as calculated in the section Generalised Cost, above)
Generalised cost change (test minus base) pmtuijkC
-
2
4
6
8
10
12
14
16
18
20
0 0.5 1 1.5 2 2.5 3 3.5
Sear
ch T
ime
Occupancy / Capacity
Time = Min [0.9037 × e (0.0146 × 100 × Occ/Cap), 15]

AECOM Leeds NGT 32
Capabilities on project:
Transportation
The subscripts refer to the following:
p demand model segment, including both purpose and income
m mode (H: highway (car and freight), P: public transport, A: active modes); The parking model considers only highway
mode demand, as park-and-ride trips are considered “highway” by the demand model.
t time period of outgoing leg of tour, or time period of trip for non-home-based trips;
u time period of return leg of tour, not used for non-home-based trips;
i production zone of trip (‘home’); and
j attraction zone of trip (‘activity area’, such as workplace, leisure centre, friend’s home),
k parking zone of trip (the zone in which the car park is located), and parking type
Where lower-case letters are used as subscripts, the expression is specified to be applied separately for each instance of the
subscript. Where capital letters are used, the expression refers to a specific instance of the subscript (see the designators for
modes above). Where an asterisk (*) is used, the expression refers to a sum (for demand) or a composite average (for cost) over
all instances of the subscript.
Costs and cost-changes refer to the cost for a complete tour (outgoing and return trip combined) for home-based tours, and that
they include costs of all journey stages (car and public transport) for park-and-ride trips.
Demand refers to production to attraction complete journeys. i and j zones refer to the zones in which the traveller actually carries
out an activity, rather than to any intermediate zones such as parking sites. Reference demand does not have a parking zone
subscript; it refers to a sum over all parking options.
The parking choice model uses an absolute formulation, distinct from the incremental model form used in the other choice
modules. This is the more helpful formulation for modelling new car parks or park-and-ride sites that did not exist in the base
year. In addition, we lack suitable base year demand data to create an incremental model in the first place.
The parking model is applied only for car demand.
In applying parking choice, the first step is to decide which ends of which trips, if any, need to make a parking decision. The
criteria are as follows:
any home-based trip is assumed to have access to residential parking at its production end or home; non-home-based
trips are assumed to have un-modelled on-site parking for their origin; and thus only destinations are included in the
parking choice;
any trip-end that is located outside the Leeds urban centre is assumed to have access to readily available parking; and
therefore parking location choice is not modelled outside the centre of Leeds (shown in red in Figure 10)
freight demand (LGV and HGV) is assumed to have access to un-modelled on-site parking at both trip ends, and so
freight parking is not modelled; and
escort trips (ie where passengers are dropped off) are assumed not to require parking at either end; proportions of trips
which are escort have been extracted by purpose from National Travel Survey (NTS) data and applied in the parking
model, as the demand is not explicitly segmented by escort status.
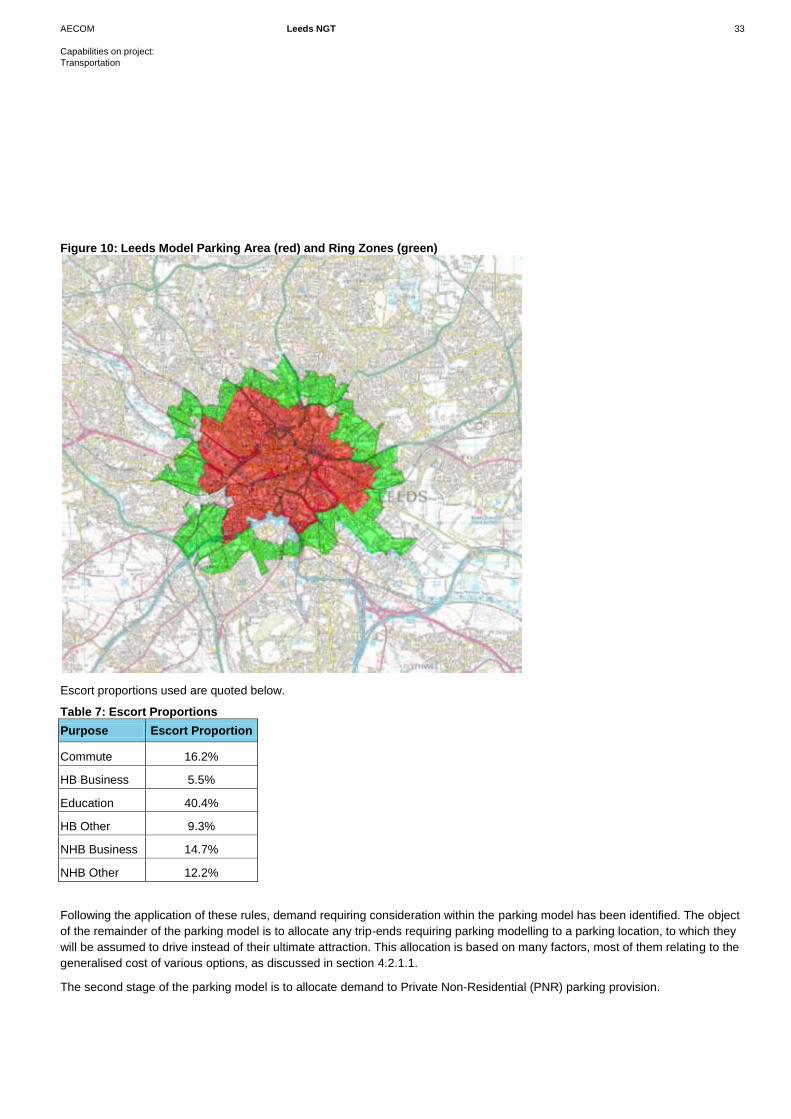
AECOM Leeds NGT 33
Capabilities on project:
Transportation
Figure 10: Leeds Model Parking Area (red) and Ring Zones (green)
Escort proportions used are quoted below.
Table 7: Escort Proportions
Purpose Escort Proportion
Commute 16.2%
HB Business 5.5%
Education 40.4%
HB Other 9.3%
NHB Business 14.7%
NHB Other 12.2%
Following the application of these rules, demand requiring consideration within the parking model has been identified. The object
of the remainder of the parking model is to allocate any trip-ends requiring parking modelling to a parking location, to which they
will be assumed to drive instead of their ultimate attraction. This allocation is based on many factors, most of them relating to the
generalised cost of various options, as discussed in section 4.2.1.1.
The second stage of the parking model is to allocate demand to Private Non-Residential (PNR) parking provision.
AECOM Leeds NGT 34
Capabilities on project:
Transportation
For commuting and business trips the model a specified number of available PNR spaces are coded as available in each zone,
located in the actual attraction zone of the person trips using them; this number of vehicle trips is allocated PNR parking. It is
assumed that the various commuting and business segments will share the available PNR demand proportionally. Spaces are
allocated on a “first come, first served” basis, so that if the PNR spaces are fully occupied by the interpeak period, travellers
inbound in the interpeak will have to find alternative car parks. Only commuting and business trips may use PNR parking. If the
spaces exceed the demand, the excess capacity is not used.
The effect of this rule is to make PNR parking a function of availability rather than traveller choice. It is assumed that any traveller
with access to PNR parking will use it, and that the available spaces are limited. The assumed spaces available, however, vary
by time of day, with additional spaces becoming available as the morning proceeds. This is because companies often allocate
spaces to individuals rather than exclusively allowing the earliest arrivals to use the spaces. The availability profile over the day is
calibrated to reflect usage.
Customer car-parks, such as around large shops and leisure centres, are not modelled as PNR, but treated as public car parks.
The third stage of the parking model is the determination of a parking decision for any trip-ends not allocated to PNR. This
requires identifying a parking zone serving the attraction end of the trip. All non-PNR sites are considered. Where multiple off-
street car parks exist in a single zone, they are treated as a single site, and all on-street spaces in a zone are also treated as a
single site. In addition, a single “park outside the city centre” option is available to every trip, discussed further below. In
summary, the following parking options k are considered for each trip, excluding the PNR option which has already been treated:
Parking at any coded park-and-ride site and using public transport to get into Leeds (3 options in base year).
Parking in any zone in Leeds centre with on-street parking and walking to attraction (74 options in base year).
Parking in any zone in Leeds centre with one or more off-street car parks and walking to attraction (61 options in base
year).
Parking outside the centre, in one of a set of “ring zones” around the centre (shown in green in Figure 10); whichever of
them minimises total drive and walk time (1 option).
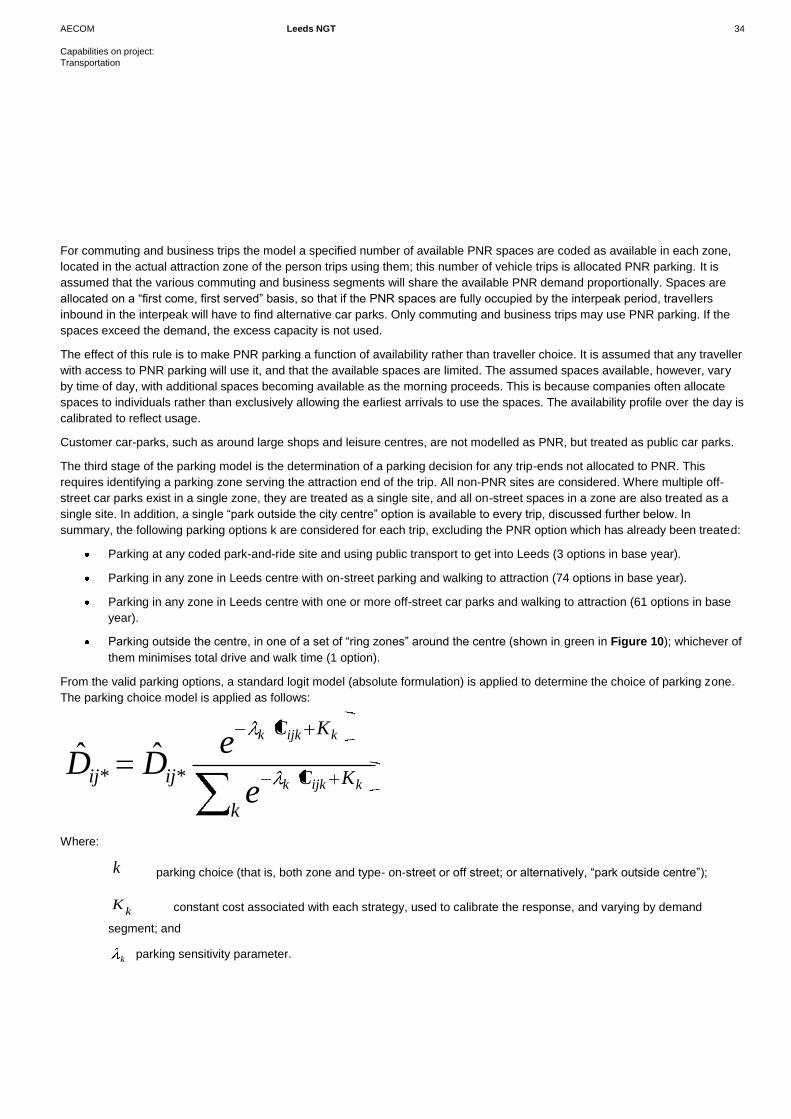
From the valid parking options, a standard logit model (absolute formulation) is applied to determine the choice of parking zone.
The parking choice model is applied as follows:
k
KC
KC
ijijkijkk
kijkk
e
eDD **ˆˆ
Where:
k parking choice (that is, both zone and type- on-street or off street; or alternatively, “park outside centre”);
kK constant cost associated with each strategy, used to calibrate the response, and varying by demand
segment; and
k parking sensitivity parameter.
AECOM Leeds NGT 35
Capabilities on project:
Transportation
Note that we have omitted time period, mode and purpose subscripts here for simplicity. The expression should be understood to
be applied to all time period pairs and purposes individually, and only to the highway mode.
For park-and-ride trips, the total cost is given as the sum of the car cost to drive to the parking site and the public transport cost
to get from the parking site to the attraction zone:
PkjCikijkCCC
The highway assignment matrices calculated by the demand model are adjusted to take account of the parking model choices,
ensuring that the car leg of each journey is assigned in the highway model to the car park zone, while any bus/rail legs are
assigned on the bus/rail networks.
The highway assignment represents costs to the car park rather than the ultimate trip attraction. Because the parking model
causes the overall cost for a car trip to be different from the costs produced by the assignment models, it is necessary to create
composite costs for the other choice functions in the demand model for car trips, to take account of parking. The expression for
this is as follows:
k
t
pmtuijk
k
Ct
pmtuijk
e
kk
b
pmtuijk
k
Cb
pmtuijk
e
k
pmtuijD
eD
D
eDC
t
ptmuijkkb
ptmuijkk
log1
log1
*
The “b” and “t” superscripts refer to base and test demand and costs. A subtraction is necessary here because the parking model
operates using absolute costs, which must be converted into cost changes for use by the incremental choice models.
This cost change is for trips using public parking (i.e. not PNR). The costs provided to the distribution models for commuting and
business trips is a demand-weighted average of this composite cost change and the cost change for commuting/business PNR
trips, as the split of demand into PNR and other parking options is based upon availability rather than cost.
Parking outside the town centre is modelled as a single option, with a cost equal to the minimum sum of highway and active-
mode travel times achieved using a zone on the edge of the city centre (search time and parking charge are assumed zero). The
highway trips are then allocated to that zone for assignment. Capacity is not explicitly modelled, though search times that
increase with the level of demand choosing the “outside town centre” option are calculated. This option is intended to allow the
model to represent reasonably well the fact that not every trip will actually park within the fully-modelled area and to allow drivers
to respond to parking constraint in a way that is commonly used in practice, that is, parking outside the controlled area.
4.3 Additional Data Collection
Park-and-ride surveys were conducted at King Lane, Garforth and New Pudsey in November 2012. This data collection is
discussed in detail in a technical note, “Leeds Park and Ride Surveys”, dated January 2013 which is included in Appendix B.
Here we discuss primarily how these data were interpreted for use in the parking model.
The surveys consisted of complete counts of vehicles entering and exiting the car parks over one to three days, along with
interviews of a sample of users.
4.3.1.1 Information Collected
The survey report contained the following summarised data:
AECOM Leeds NGT 36
Capabilities on project:
Transportation
Numbers of vehicle entries and exits at each site, by hour and car park, along with occupancy at the start and end of the
model/survey period of 7am to 7pm.
Proportions of interviewees parking by location, including in main car-park, on local roads, or dropped-off (“kiss-and-
ride”).
Average person occupancy of cars using the site, by site and park-and-ride/ kiss-and-ride.
Proportions of travellers using the site to travel to the centre of Leeds, by site.
Journey purpose for travellers using the site, by site.
Perceived most likely alternative to park-and-ride, were the site not available.
Reason for using park-and-ride, primary.
Length of stay in the car park, by site and arrival time.
Distance travelled by car to park-and-ride site.
Interviewees were asked for their origins and destinations, so much of these data are in principle available in greater detail, with
limitations due to small sample sizes. In all, around 500 interviews were conducted across the three sites, although only 27 were
at King Lane.
4.3.1.2 Interpretation of Survey Responses
The primary inputs required to calibrate the park-and-ride demand in the parking model are vehicle entries and exits by period,
and vehicle capacity of site. These are available directly from the observations made by the survey. However, several
adjustments were made to the raw survey responses to ensure that the effective capacity and use of the park-and-ride location
for serving park-and-ride trips to the centre of Leeds was correctly represented..
Both the site capacity and the entries and exits were adjusted to account for the proportion of interviewees who parked on local
roads rather than on site. These people were not observed as vehicle entries or exits by the survey, but interviews established
the proportion of people using local roads.
Entries and exits for the site (but not the capacity) were reduced to account for the proportion of kiss-and-ride “dropped-
off” trips. Such trips are outside the scope of the parking model, as these trips do not actually park for any length of time.
They also do not use up capacity.
Both the site capacity and the entries and exits were reduced to reflect the proportion of trips not travelling to the centre
of Leeds; again these are outside the scope of the parking model.
At King Lane only, capacity (but not entries and exits) was reduced to account for the usage of the site to access the
neighbouring school. Entries and exits for school trips were surveyed separately, so the usage did not need further
adjustments. School trips were not interviewed, and so were not included in the survey findings.
The adjustments used are shown below.
AECOM Leeds NGT 37
Capabilities on project:
Transportation
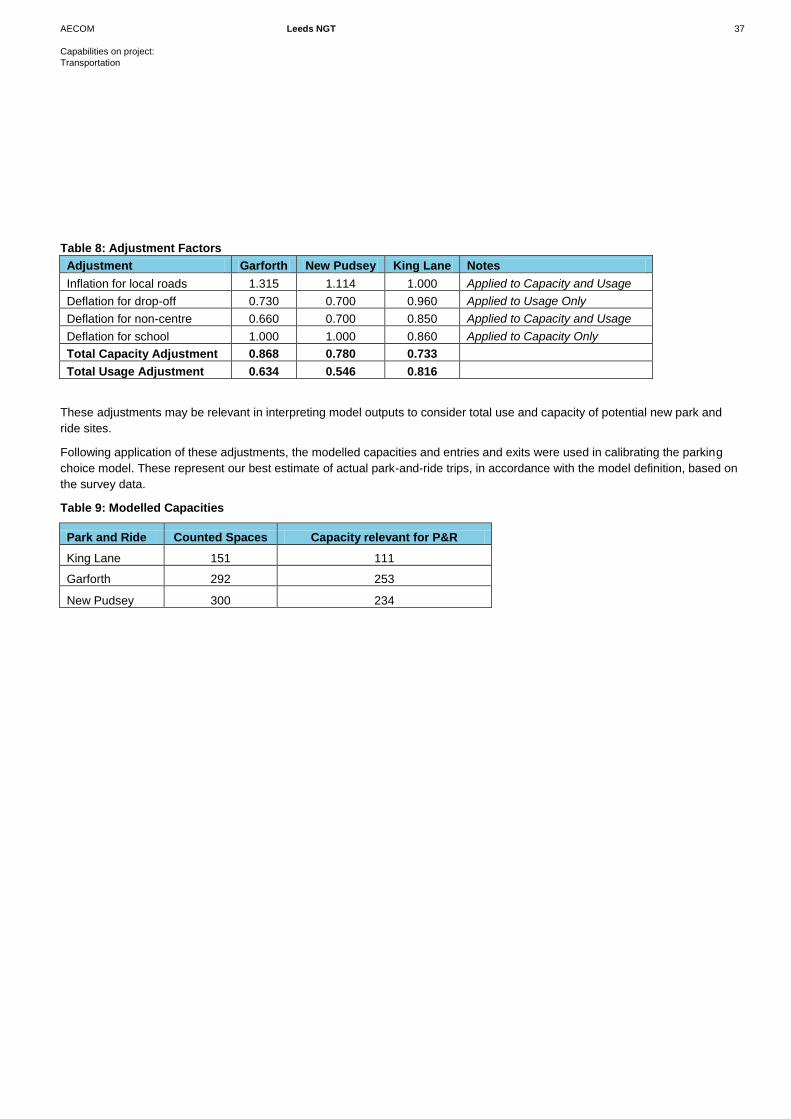
Table 8: Adjustment Factors
Adjustment Garforth New Pudsey King Lane Notes
Inflation for local roads 1.315 1.114 1.000 Applied to Capacity and Usage
Deflation for drop-off 0.730 0.700 0.960 Applied to Usage Only
Deflation for non-centre 0.660 0.700 0.850 Applied to Capacity and Usage
Deflation for school 1.000 1.000 0.860 Applied to Capacity Only
Total Capacity Adjustment 0.868 0.780 0.733
Total Usage Adjustment 0.634 0.546 0.816
These adjustments may be relevant in interpreting model outputs to consider total use and capacity of potential new park and
ride sites.
Following application of these adjustments, the modelled capacities and entries and exits were used in calibrating the parking
choice model. These represent our best estimate of actual park-and-ride trips, in accordance with the model definition, based on
the survey data.
Table 9: Modelled Capacities
Park and Ride Counted Spaces Capacity relevant for P&R
King Lane 151 111
Garforth 292 253
New Pudsey 300 234
AECOM Leeds NGT 38
Capabilities on project:
Transportation
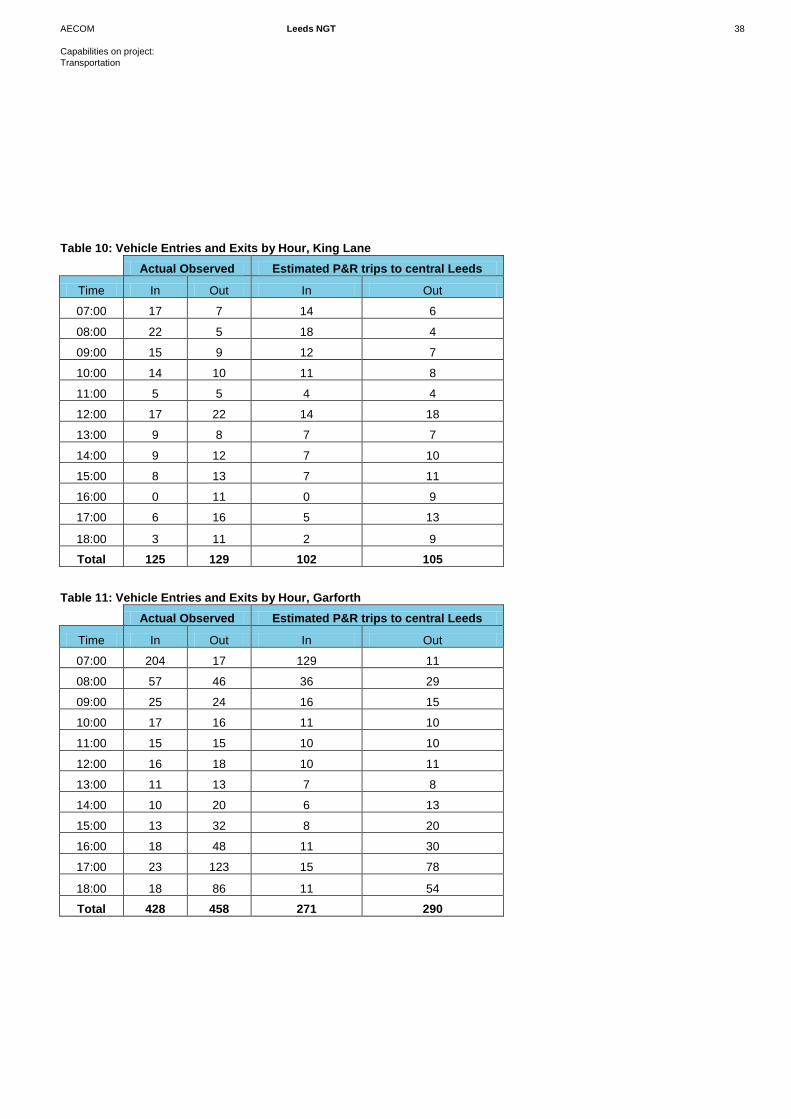
Table 10: Vehicle Entries and Exits by Hour, King Lane
Actual Observed Estimated P&R trips to central Leeds
Time In Out In Out
07:00 17 7 14 6
08:00 22 5 18 4
09:00 15 9 12 7
10:00 14 10 11 8
11:00 5 5 4 4
12:00 17 22 14 18
13:00 9 8 7 7
14:00 9 12 7 10
15:00 8 13 7 11
16:00 0 11 0 9
17:00 6 16 5 13
18:00 3 11 2 9
Total 125 129 102 105
Table 11: Vehicle Entries and Exits by Hour, Garforth
Actual Observed Estimated P&R trips to central Leeds
Time In Out In Out
07:00 204 17 129 11
08:00 57 46 36 29
09:00 25 24 16 15
10:00 17 16 11 10
11:00 15 15 10 10
12:00 16 18 10 11
13:00 11 13 7 8
14:00 10 20 6 13
15:00 13 32 8 20
16:00 18 48 11 30
17:00 23 123 15 78
18:00 18 86 11 54
Total 428 458 271 290
AECOM Leeds NGT 39
Capabilities on project:
Transportation
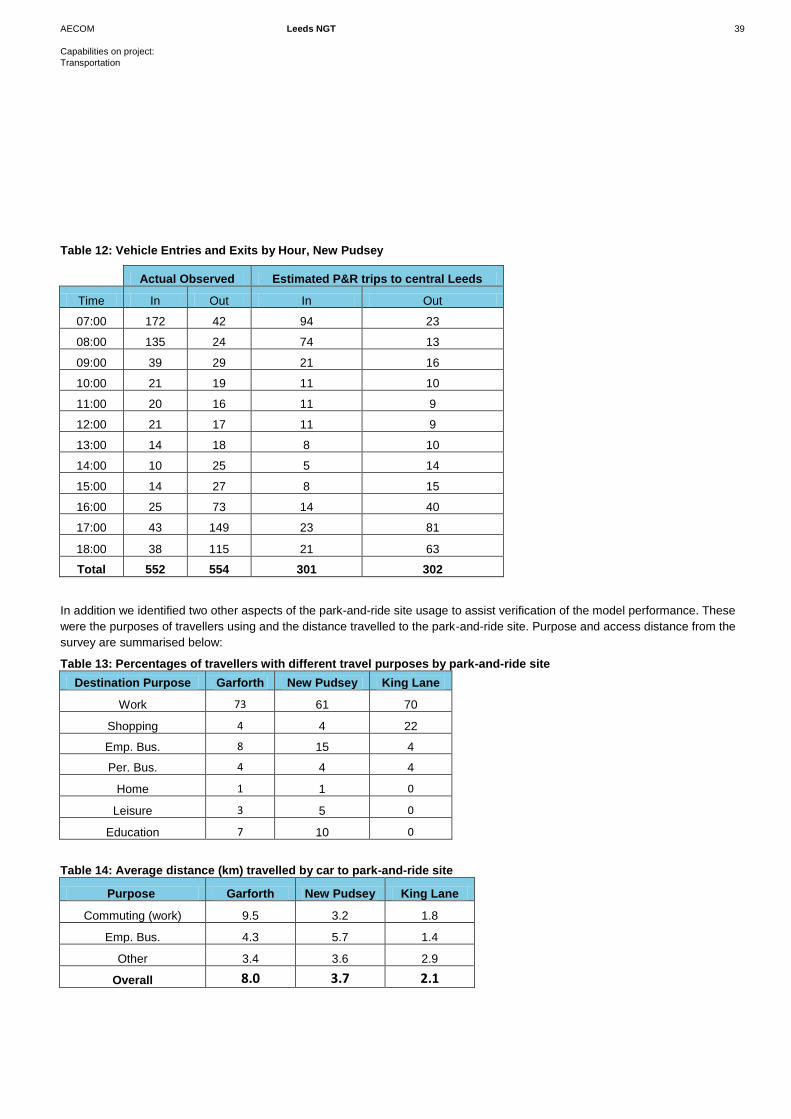
Table 12: Vehicle Entries and Exits by Hour, New Pudsey
Actual Observed Estimated P&R trips to central Leeds
Time In Out In Out
07:00 172 42 94 23
08:00 135 24 74 13
09:00 39 29 21 16
10:00 21 19 11 10
11:00 20 16 11 9
12:00 21 17 11 9
13:00 14 18 8 10
14:00 10 25 5 14
15:00 14 27 8 15
16:00 25 73 14 40
17:00 43 149 23 81
18:00 38 115 21 63
Total 552 554 301 302
In addition we identified two other aspects of the park-and-ride site usage to assist verification of the model performance. These
were the purposes of travellers using and the distance travelled to the park-and-ride site. Purpose and access distance from the
survey are summarised below:
Table 13: Percentages of travellers with different travel purposes by park-and-ride site
Destination Purpose Garforth New Pudsey King Lane
Work 73 61 70
Shopping 4 4 22
Emp. Bus. 8 15 4
Per. Bus. 4 4 4
Home 1 1 0
Leisure 3 5 0
Education 7 10 0
Table 14: Average distance (km) travelled by car to park-and-ride site
Purpose Garforth New Pudsey King Lane
Commuting (work) 9.5 3.2 1.8
Emp. Bus. 4.3 5.7 1.4
Other 3.4 3.6 2.9
Overall 8.0 3.7 2.1
AECOM Leeds NGT 40
Capabilities on project:
Transportation
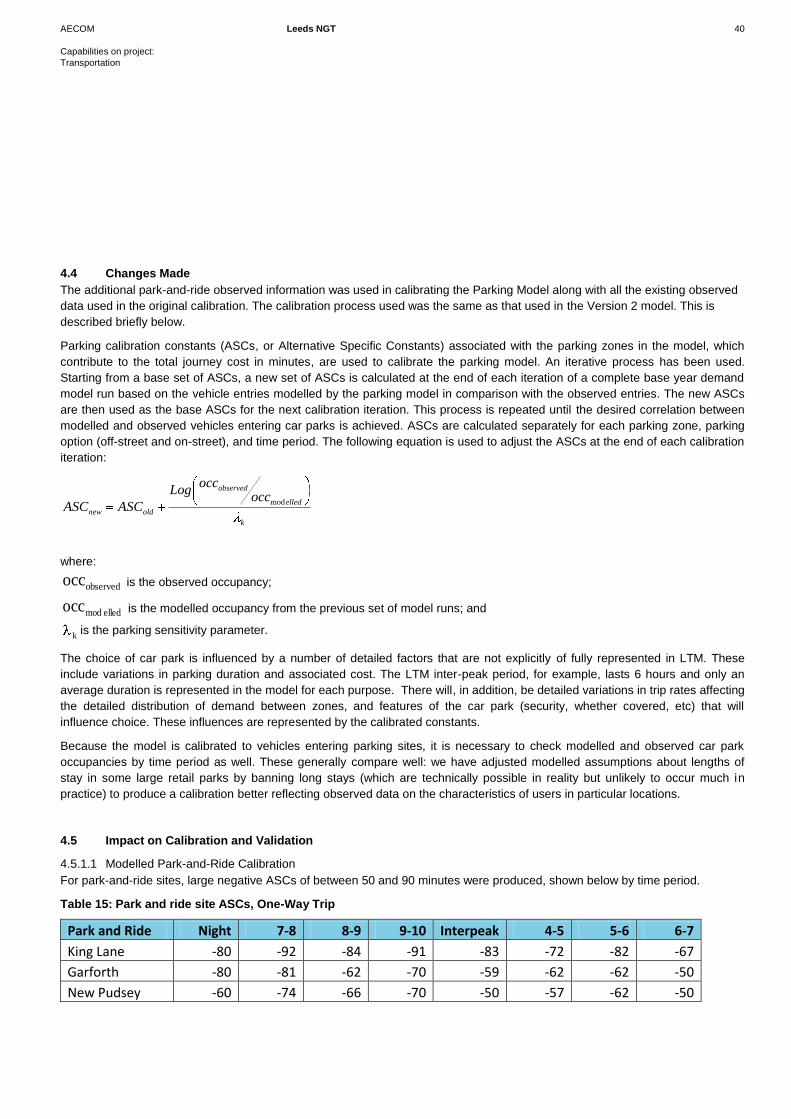
4.4 Changes Made
The additional park-and-ride observed information was used in calibrating the Parking Model along with all the existing observed
data used in the original calibration. The calibration process used was the same as that used in the Version 2 model. This is
described briefly below.
Parking calibration constants (ASCs, or Alternative Specific Constants) associated with the parking zones in the model, which
contribute to the total journey cost in minutes, are used to calibrate the parking model. An iterative process has been used.
Starting from a base set of ASCs, a new set of ASCs is calculated at the end of each iteration of a complete base year demand
model run based on the vehicle entries modelled by the parking model in comparison with the observed entries. The new ASCs
are then used as the base ASCs for the next calibration iteration. This process is repeated until the desired correlation between
modelled and observed vehicles entering car parks is achieved. ASCs are calculated separately for each parking zone, parking
option (off-street and on-street), and time period. The following equation is used to adjust the ASCs at the end of each calibration
iteration:
where:
observedocc is the observed occupancy;
elledmodocc is the modelled occupancy from the previous set of model runs; and
kis the parking sensitivity parameter.
The choice of car park is influenced by a number of detailed factors that are not explicitly of fully represented in LTM. These
include variations in parking duration and associated cost. The LTM inter-peak period, for example, lasts 6 hours and only an
average duration is represented in the model for each purpose. There will, in addition, be detailed variations in trip rates affecting
the detailed distribution of demand between zones, and features of the car park (security, whether covered, etc) that will
influence choice. These influences are represented by the calibrated constants.
Because the model is calibrated to vehicles entering parking sites, it is necessary to check modelled and observed car park
occupancies by time period as well. These generally compare well: we have adjusted modelled assumptions about lengths of
stay in some large retail parks by banning long stays (which are technically possible in reality but unlikely to occur much in
practice) to produce a calibration better reflecting observed data on the characteristics of users in particular locations.
4.5 Impact on Calibration and Validation
4.5.1.1 Modelled Park-and-Ride Calibration
For park-and-ride sites, large negative ASCs of between 50 and 90 minutes were produced, shown below by time period.
Table 15: Park and ride site ASCs, One-Way Trip
Park and Ride Night 7-8 8-9 9-10 Interpeak 4-5 5-6 6-7
King Lane -80 -92 -84 -91 -83 -72 -82 -67
Garforth -80 -81 -62 -70 -59 -62 -62 -50
New Pudsey -60 -74 -66 -70 -50 -57 -62 -50
k
elled
observed
oldnew
occocc
Log
ASCASCmod
AECOM Leeds NGT 41
Capabilities on project:
Transportation
These result primarily from differences in the way highway and public transport assignment models calculate generalised cost.
Because public transport models assign weights to waiting and walking time, add boarding penalties, and calculate fares,
generalised cost for public transport journeys is usually substantially greater than that for a similar highway journey. A
comparison of costs of travel by both modes from the park-and-ride sites to the centre of Leeds is shown below.
Table 16: Public Transport and Highway Costs From Park-and-Ride Sites, Minutes
Park and Ride PT Walking PT Waiting PT Fare PT Board Total PT Cost Highway Cost Difference
King Lane 25 9 13 7 121 18 103
Garforth 12 26 18 7 82 28 55
New Pudsey 24 21 18 7 87 27 60
It can be seen that the differences are generally of a similar order to the park-and-ride ASCs.
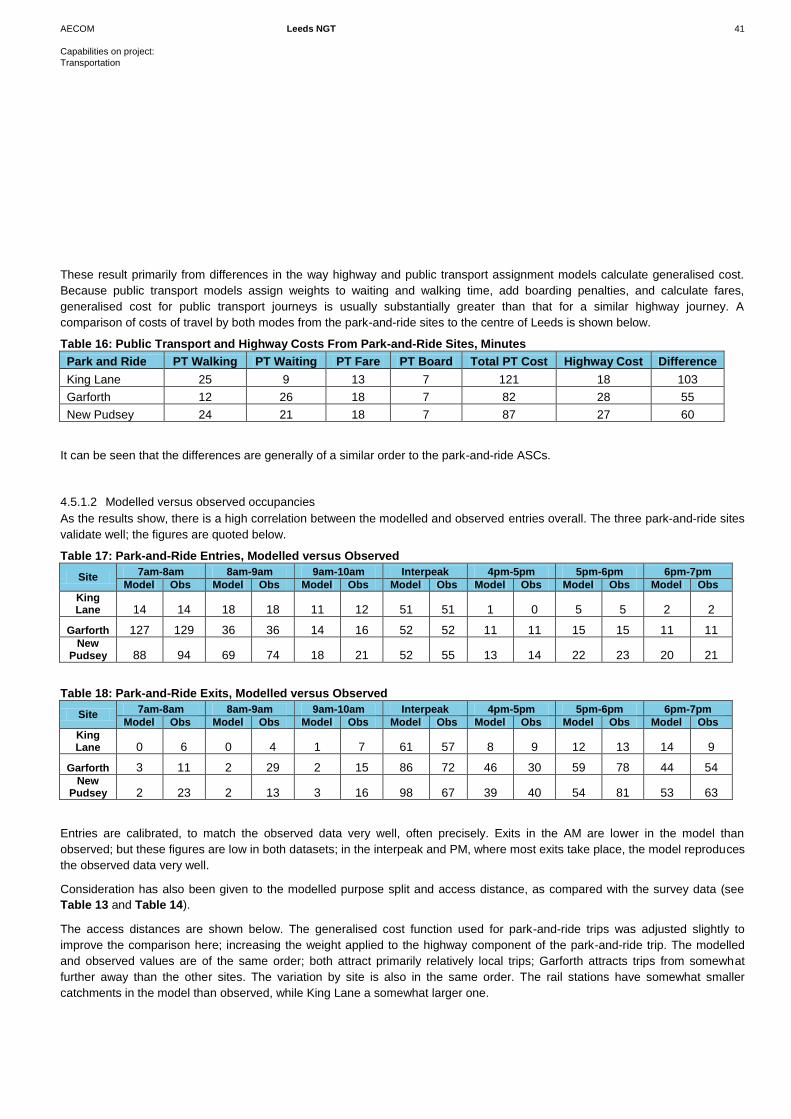
4.5.1.2 Modelled versus observed occupancies
As the results show, there is a high correlation between the modelled and observed entries overall. The three park-and-ride sites
validate well; the figures are quoted below.
Table 17: Park-and-Ride Entries, Modelled versus Observed
Site 7am-8am 8am-9am 9am-10am Interpeak 4pm-5pm 5pm-6pm 6pm-7pm
Model Obs Model Obs Model Obs Model Obs Model Obs Model Obs Model Obs
King Lane 14 14 18 18 11 12 51 51 1 0 5 5 2 2
Garforth 127 129 36 36 14 16 52 52 11 11 15 15 11 11 New
Pudsey 88 94 69 74 18 21 52 55 13 14 22 23 20 21
Table 18: Park-and-Ride Exits, Modelled versus Observed
Site 7am-8am 8am-9am 9am-10am Interpeak 4pm-5pm 5pm-6pm 6pm-7pm
Model Obs Model Obs Model Obs Model Obs Model Obs Model Obs Model Obs
King Lane 0 6 0 4 1 7 61 57 8 9 12 13 14 9
Garforth 3 11 2 29 2 15 86 72 46 30 59 78 44 54 New
Pudsey 2 23 2 13 3 16 98 67 39 40 54 81 53 63
Entries are calibrated, to match the observed data very well, often precisely. Exits in the AM are lower in the model than
observed; but these figures are low in both datasets; in the interpeak and PM, where most exits take place, the model reproduces
the observed data very well.
Consideration has also been given to the modelled purpose split and access distance, as compared with the survey data (see
Table 13 and Table 14).
The access distances are shown below. The generalised cost function used for park-and-ride trips was adjusted slightly to
improve the comparison here; increasing the weight applied to the highway component of the park-and-ride trip. The modelled
and observed values are of the same order; both attract primarily relatively local trips; Garforth attracts trips from somewhat
further away than the other sites. The variation by site is also in the same order. The rail stations have somewhat smaller
catchments in the model than observed, while King Lane a somewhat larger one.

AECOM Leeds NGT 42
Capabilities on project:
Transportation
Table 19: Average distance (km) travelled by car to park-and-ride site
Garforth New Pudsey King Lane
Observed 8.0 3.7 2.1
Modelled 5.0 2.8 2.4
The modelled data evidence low use for business and education purpose, consistently reflecting evidence from the survey that
users are predominantly travelling for commute or other purposes. That said the model indicates a broadly even split between
commute and other purposes, showing less dominance of commuting purpose which was reported by about two thirds of the
respondents.
It would be possible to calibrate additional model parameters to reproduce the observed data more accurately; however this
would introduce complexity in transferring the findings when testing new sites. The comparisons reported here demonstrate that
the model does broadly replicate parking behaviours. While this provides assurance in the broad magnitude of the forecasts it
also suggests that where precise detailed forecasts are required this should be supplemented by more detailed scheme level
analysis.
4.5.1.3 Parking Model Base Calibration Results – Calibrated ASCs
Figure 11 shows the distribution of ASCs, calibrated by site and outbound time period for off-street and on-street car parks in
Leeds, respectively. For any given car park, a larger (more positive) ASC is associated with a lower tendency to use that car park
(greater extra cost) and vice versa.
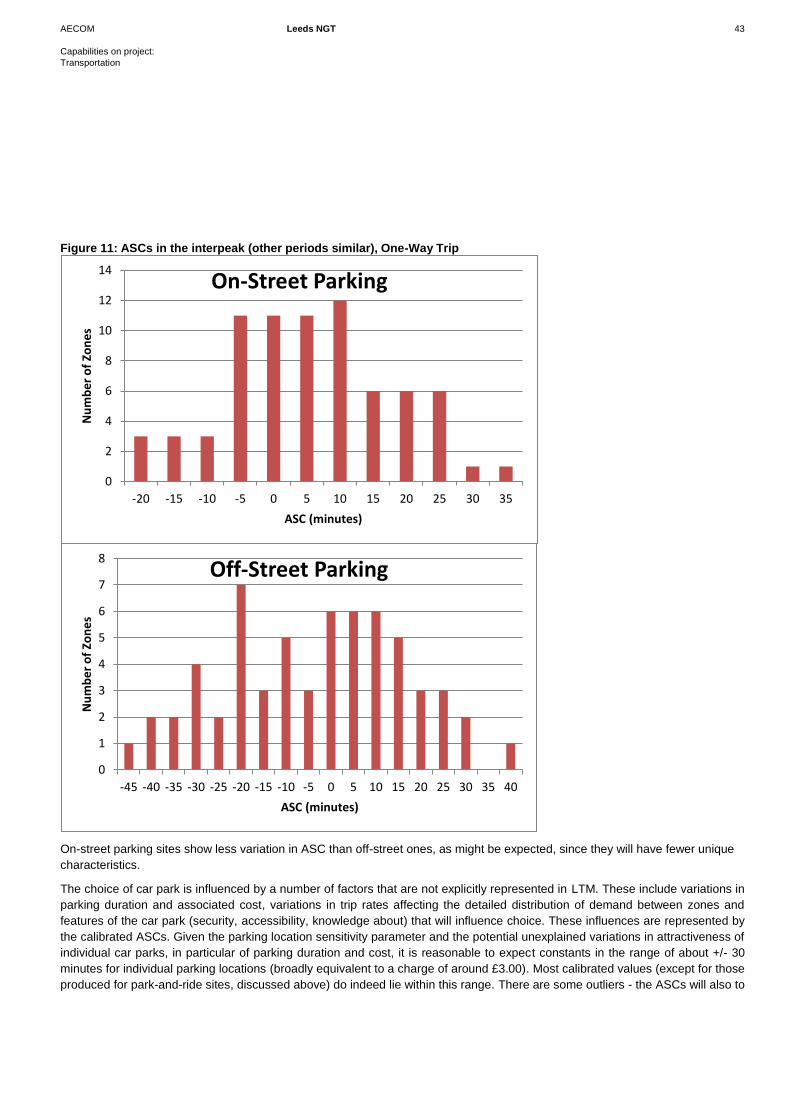
AECOM Leeds NGT 43
Capabilities on project:
Transportation
Figure 11: ASCs in the interpeak (other periods similar), One-Way Trip
On-street parking sites show less variation in ASC than off-street ones, as might be expected, since they will have fewer unique
characteristics.
The choice of car park is influenced by a number of factors that are not explicitly represented in LTM. These include variations in
parking duration and associated cost, variations in trip rates affecting the detailed distribution of demand between zones and
features of the car park (security, accessibility, knowledge about) that will influence choice. These influences are represented by
the calibrated ASCs. Given the parking location sensitivity parameter and the potential unexplained variations in attractiveness of
individual car parks, in particular of parking duration and cost, it is reasonable to expect constants in the range of about +/- 30
minutes for individual parking locations (broadly equivalent to a charge of around £3.00). Most calibrated values (except for those
produced for park-and-ride sites, discussed above) do indeed lie within this range. There are some outliers - the ASCs will also to
0
2
4
6
8
10
12
14
-20 -15 -10 -5 0 5 10 15 20 25 30 35
Nu
mb
er
of
Zon
es
ASC (minutes)
On-Street Parking
0
1
2
3
4
5
6
7
8
-45 -40 -35 -30 -25 -20 -15 -10 -5 0 5 10 15 20 25 30 35 40
Nu
mb
er
of
Zon
es
ASC (minutes)
Off-Street Parking

AECOM Leeds NGT 44
Capabilities on project:
Transportation
some extent compensate for weaknesses and inconsistencies in the input data: demand matrices, capacities, observed usage
and so on.
Figure 12 shows the fitted relationships between modelled and observed vehicle entries by parking type and time period
(shoulder peak periods have been omitted to save space, but show similar correlations).
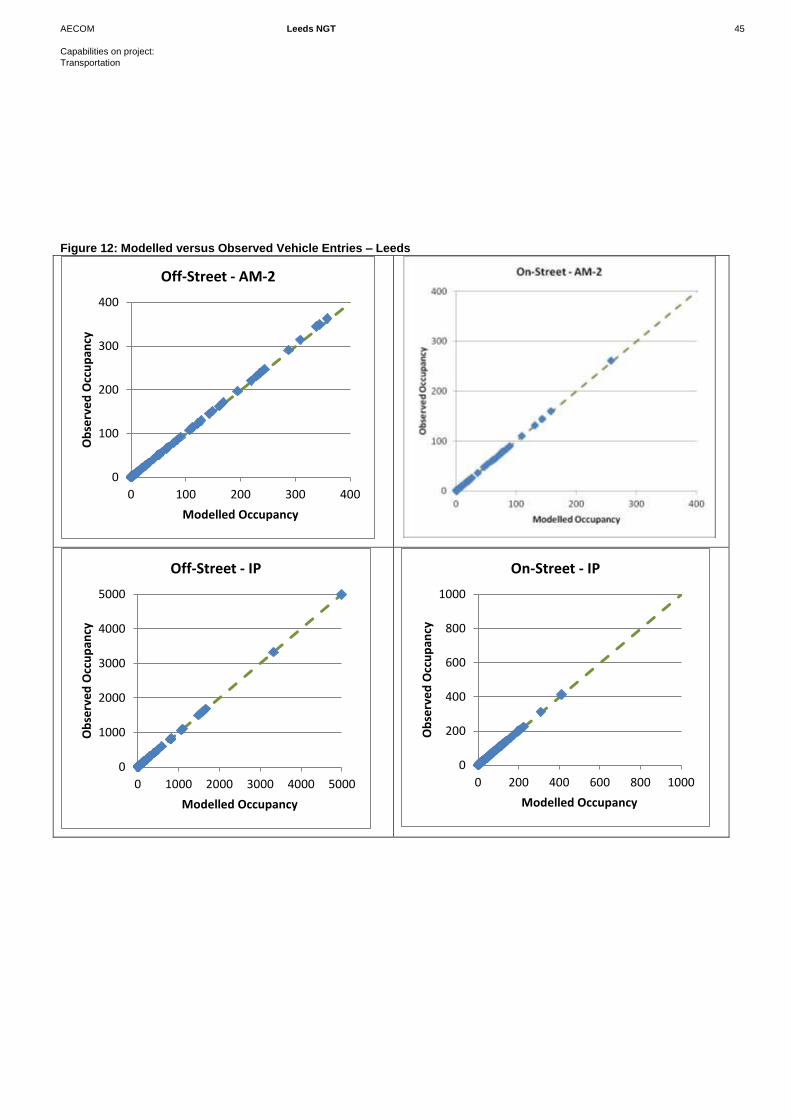
AECOM Leeds NGT 45
Capabilities on project:
Transportation
Figure 12: Modelled versus Observed Vehicle Entries – Leeds
0
100
200
300
400
0 100 200 300 400
Ob
serv
ed
Occ
up
ancy
Modelled Occupancy
Off-Street - AM-2
0
1000
2000
3000
4000
5000
0 1000 2000 3000 4000 5000
Ob
serv
ed
Occ
up
ancy
Modelled Occupancy
Off-Street - IP
0
200
400
600
800
1000
0 200 400 600 800 1000
Ob
serv
ed
Occ
up
ancy
Modelled Occupancy
On-Street - IP
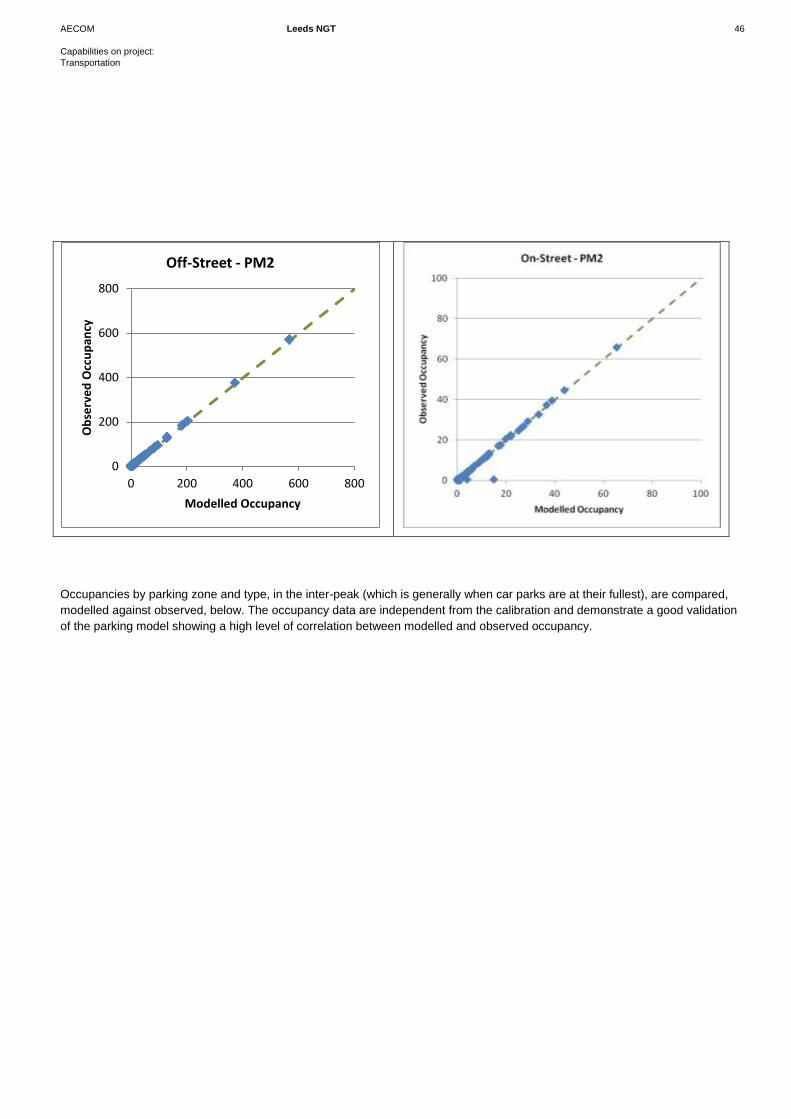
AECOM Leeds NGT 46
Capabilities on project:
Transportation
Occupancies by parking zone and type, in the inter-peak (which is generally when car parks are at their fullest), are compared,
modelled against observed, below. The occupancy data are independent from the calibration and demonstrate a good validation
of the parking model showing a high level of correlation between modelled and observed occupancy.
0
200
400
600
800
0 200 400 600 800
Ob
serv
ed
Occ
up
ancy
Modelled Occupancy
Off-Street - PM2
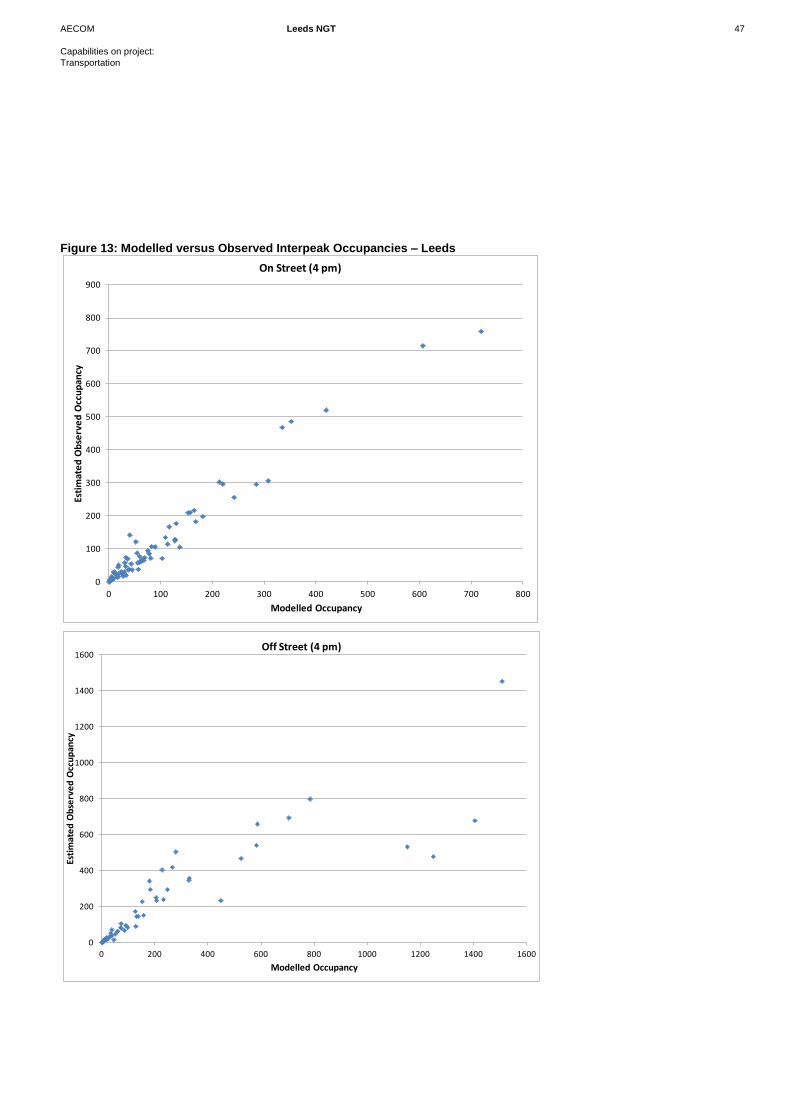
AECOM Leeds NGT 47
Capabilities on project:
Transportation
Figure 13: Modelled versus Observed Interpeak Occupancies – Leeds
0
100
200
300
400
500
600
700
800
900
0 100 200 300 400 500 600 700 800
Esti
mat
ed
Ob
serv
ed
Occ
up
ancy
Modelled Occupancy
On Street (4 pm)
0
200
400
600
800
1000
1200
1400
1600
0 200 400 600 800 1000 1200 1400 1600
Esti
mat
ed
Ob
serv
ed
Occ
up
ancy
Modelled Occupancy
Off Street (4 pm)

AECOM Leeds NGT 48
Capabilities on project:
Transportation
The three largest outliers on the off-street plot represent large sites for which the vehicle entries have been well calibrated and
the exits also proportionally match the observed data well. However, the interpeak exits are a little low, causing the occupancy to
be significantly higher than observed, since the observed data has very large and approximately equal entries and exits in the
interpeak.
4.6 Conclusions
This chapter has explained the collection and analysis of park and ride data. The parking choice model has been calibrated and a
reasonable reproduction of the observed use of the park and ride sites has been demonstrated.
It should be noted that the sample size is moderate and that there are some differences in the modelled and observed
characteristics of the Park and Ride users. Accordingly the information presented indicates that the model outputs can be relied
on to provide the broad scale of park and ride usage such as in planning transport strategies, additional information and analysis
would be advisable where more detailed forecasts are required.

Base Year Model Integration
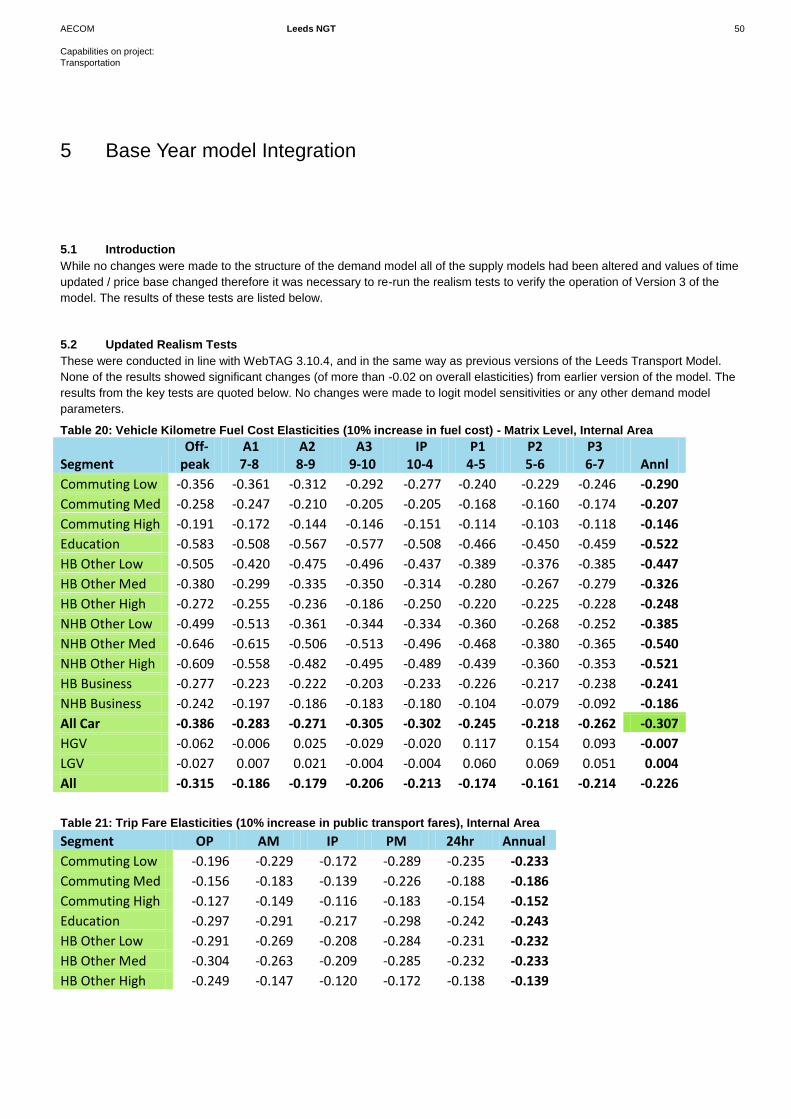
AECOM Leeds NGT 50
Capabilities on project:
Transportation
5.1 Introduction
While no changes were made to the structure of the demand model all of the supply models had been altered and values of time
updated / price base changed therefore it was necessary to re-run the realism tests to verify the operation of Version 3 of the
model. The results of these tests are listed below.
5.2 Updated Realism Tests
These were conducted in line with WebTAG 3.10.4, and in the same way as previous versions of the Leeds Transport Model.
None of the results showed significant changes (of more than -0.02 on overall elasticities) from earlier version of the model. The
results from the key tests are quoted below. No changes were made to logit model sensitivities or any other demand model
parameters.
Table 20: Vehicle Kilometre Fuel Cost Elasticities (10% increase in fuel cost) - Matrix Level, Internal Area
Segment Off- peak
A1 7-8
A2 8-9
A3 9-10
IP 10-4
P1 4-5
P2 5-6
P3 6-7
Annl
Commuting Low -0.356 -0.361 -0.312 -0.292 -0.277 -0.240 -0.229 -0.246 -0.290
Commuting Med -0.258 -0.247 -0.210 -0.205 -0.205 -0.168 -0.160 -0.174 -0.207
Commuting High -0.191 -0.172 -0.144 -0.146 -0.151 -0.114 -0.103 -0.118 -0.146
Education -0.583 -0.508 -0.567 -0.577 -0.508 -0.466 -0.450 -0.459 -0.522
HB Other Low -0.505 -0.420 -0.475 -0.496 -0.437 -0.389 -0.376 -0.385 -0.447
HB Other Med -0.380 -0.299 -0.335 -0.350 -0.314 -0.280 -0.267 -0.279 -0.326
HB Other High -0.272 -0.255 -0.236 -0.186 -0.250 -0.220 -0.225 -0.228 -0.248
NHB Other Low -0.499 -0.513 -0.361 -0.344 -0.334 -0.360 -0.268 -0.252 -0.385
NHB Other Med -0.646 -0.615 -0.506 -0.513 -0.496 -0.468 -0.380 -0.365 -0.540
NHB Other High -0.609 -0.558 -0.482 -0.495 -0.489 -0.439 -0.360 -0.353 -0.521
HB Business -0.277 -0.223 -0.222 -0.203 -0.233 -0.226 -0.217 -0.238 -0.241
NHB Business -0.242 -0.197 -0.186 -0.183 -0.180 -0.104 -0.079 -0.092 -0.186
All Car -0.386 -0.283 -0.271 -0.305 -0.302 -0.245 -0.218 -0.262 -0.307
HGV -0.062 -0.006 0.025 -0.029 -0.020 0.117 0.154 0.093 -0.007
LGV -0.027 0.007 0.021 -0.004 -0.004 0.060 0.069 0.051 0.004
All -0.315 -0.186 -0.179 -0.206 -0.213 -0.174 -0.161 -0.214 -0.226
Table 21: Trip Fare Elasticities (10% increase in public transport fares), Internal Area
Segment OP AM IP PM 24hr Annual
Commuting Low -0.196 -0.229 -0.172 -0.289 -0.235 -0.233
Commuting Med -0.156 -0.183 -0.139 -0.226 -0.188 -0.186
Commuting High -0.127 -0.149 -0.116 -0.183 -0.154 -0.152
Education -0.297 -0.291 -0.217 -0.298 -0.242 -0.243
HB Other Low -0.291 -0.269 -0.208 -0.284 -0.231 -0.232
HB Other Med -0.304 -0.263 -0.209 -0.285 -0.232 -0.233
HB Other High -0.249 -0.147 -0.120 -0.172 -0.138 -0.139
5 Base Year model Integration
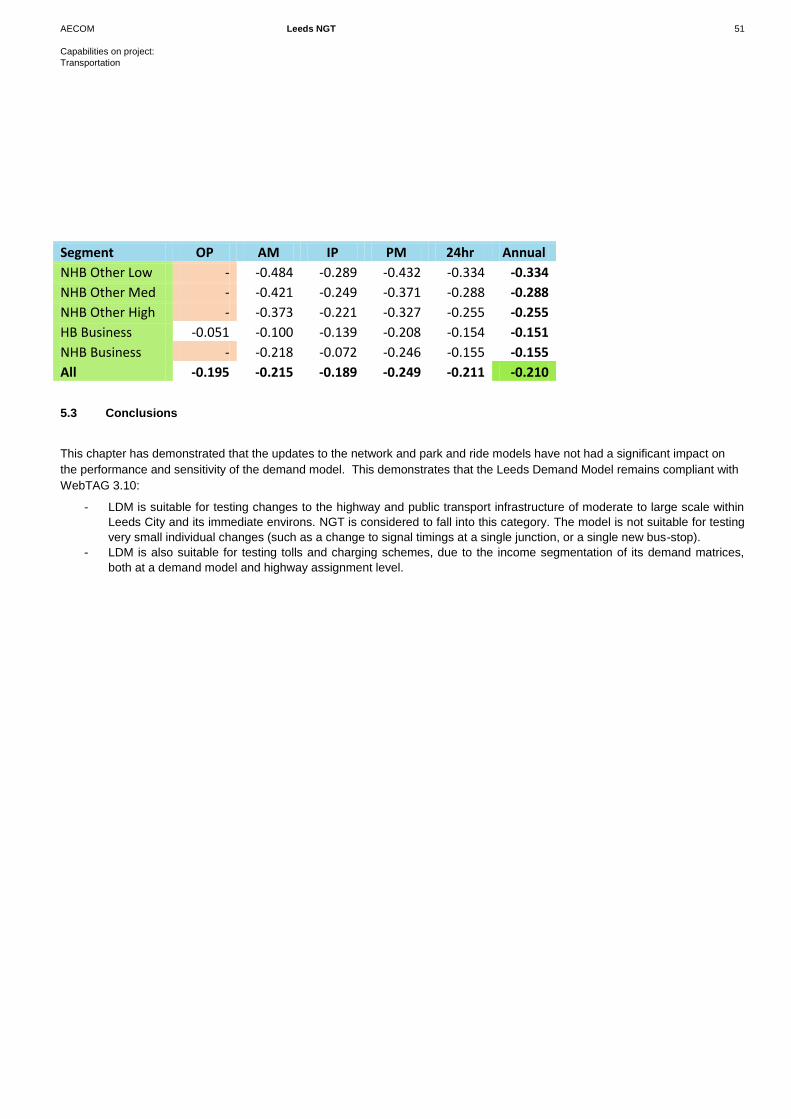
AECOM Leeds NGT 51
Capabilities on project:
Transportation
Segment OP AM IP PM 24hr Annual
NHB Other Low - -0.484 -0.289 -0.432 -0.334 -0.334
NHB Other Med - -0.421 -0.249 -0.371 -0.288 -0.288
NHB Other High - -0.373 -0.221 -0.327 -0.255 -0.255
HB Business -0.051 -0.100 -0.139 -0.208 -0.154 -0.151
NHB Business - -0.218 -0.072 -0.246 -0.155 -0.155
All -0.195 -0.215 -0.189 -0.249 -0.211 -0.210
5.3 Conclusions
This chapter has demonstrated that the updates to the network and park and ride models have not had a significant impact on
the performance and sensitivity of the demand model. This demonstrates that the Leeds Demand Model remains compliant with
WebTAG 3.10:
- LDM is suitable for testing changes to the highway and public transport infrastructure of moderate to large scale within
Leeds City and its immediate environs. NGT is considered to fall into this category. The model is not suitable for testing
very small individual changes (such as a change to signal timings at a single junction, or a single new bus-stop).
- LDM is also suitable for testing tolls and charging schemes, due to the income segmentation of its demand matrices,
both at a demand model and highway assignment level.

Summary and Conclusions
AECOM Leeds NGT 53
Capabilities on project:
Transportation
6.1 Summary
Improvements have been made to the LTM since March 2012. The main purpose of these updates was to improve the capability
of the model to assess the economic and operational impacts of the NGT scheme and the operational impacts of highway
interventions in the Leeds City Centre.
These updates can be categorised by the sub model within LTM.
6.2 Highway Assignment Model
Improvement in calibration and validation through use of additional traffic count and journey time data particularly on the
M621, more generally within the City Centre and along the length of the NGT corridor.
6.3 Public Transport Assignment Model
Refined representation of the walk network in the City Centre.
Introduction of a new sub mode choice model better to represent the choice between NGT and existing public transport,
together with associated revisions to model parameters
6.4 Parking Model
Calibration of local parameters for park and ride facilities based on new survey data collected at existing park and ride
sites.
6.5 General Changes
At the time this work was being undertaken an updated set of values of time were released in WebTAG. These were in a 2010
price base and this was in line with other changes in the appraisal guidance and TUBA. The opportunity was therefore taken to
update the entire LTM from having a 2002 price base to having a 2010 one.
Values of time and vehicle operating costs have also been updated to bring them in line with WebTAG Unit 3.5.6 (August 2012).
6.6 Impact of Update
These updates and improvements have been undertaken such that the validation of the supply models has generally been
improved. The integrity and quality of the model and its data across Leeds have been maintained in Version 3 and tests
undertaken demonstrating its continued suitability for testing the feasibility of transport strategies, subject to specific verification.
The validation of the Version 3 model within the NGT corridor has been improved. Both public transport and highway model
performance are closely aligned with acceptability guidelines in WebTAG units 3.19 and 3.11.2. Realism tests of the demand
model have been updated confirming that the model response sensitivity complies with guidance.
The review of the model performance of the highway model along the NGT corridor demonstrates close alignment with WebTAG
acceptability guidelines (for 85% of observations being within the difference criterion). While the journey time comparisons
demonstrate that the guideline is exceeded the flow comparisons indicate slightly greater variation between modelled flows and
counts. These comparisons indicate a generally good reproduction of flows and travel conditions along and adjacent to the
corridor.
The model outputs for the NGT business case (benefits) are particularly dependent on journey times and on public transport
flows and the model demonstrates a high standard of performance in this regard. Nevertheless, as with most strategic highway
models, there are some differences between modelled flows and counts at individual junctions and there is therefore a need for
care in using detailed local outputs. To ensure their suitability; the detailed model flow forecasts should be supplemented with
more local data and models for the purpose of junction design.
6 Summary and Conclusions

Appendix A
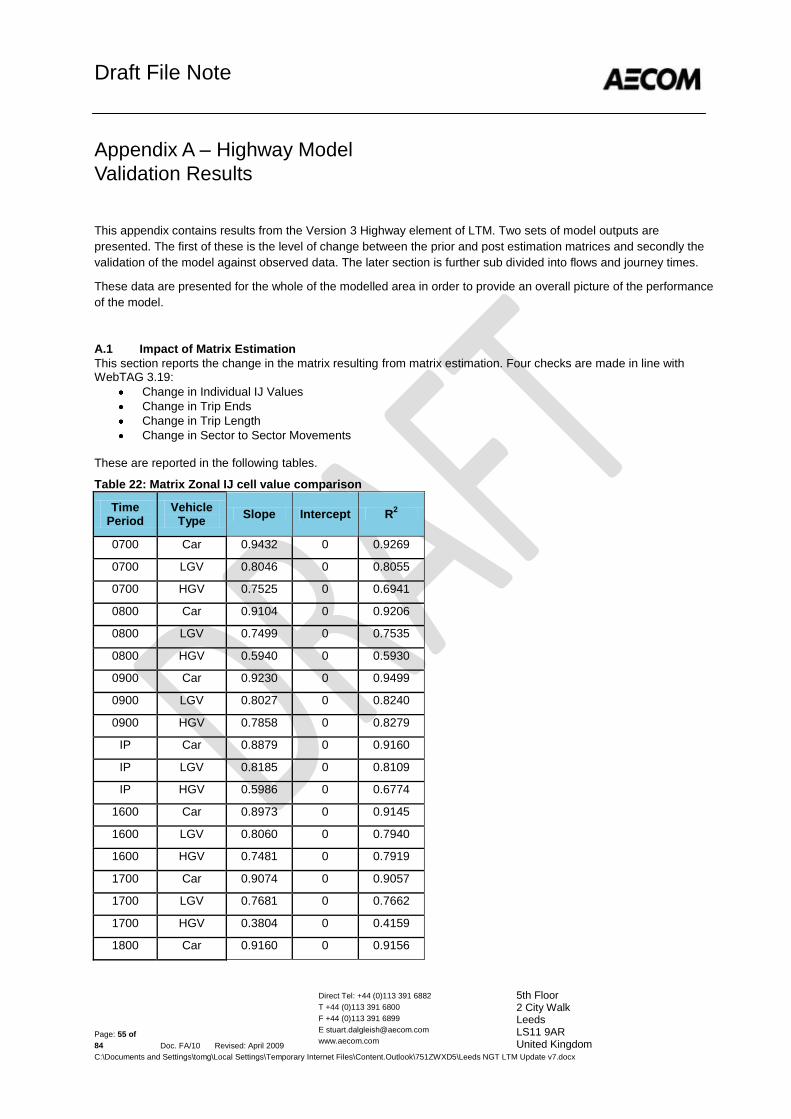
Draft File Note
Direct Tel: +44 (0)113 391 6882
T +44 (0)113 391 6800
F +44 (0)113 391 6899
www.aecom.com
5th Floor 2 City Walk Leeds LS11 9AR United Kingdom
Page: 55 of
84 Doc. FA/10 Revised: April 2009
C:\Documents and Settings\tomg\Local Settings\Temporary Internet Files\Content.Outlook\751ZWXD5\Leeds NGT LTM Update v7.docx
This appendix contains results from the Version 3 Highway element of LTM. Two sets of model outputs are
presented. The first of these is the level of change between the prior and post estimation matrices and secondly the
validation of the model against observed data. The later section is further sub divided into flows and journey times.
These data are presented for the whole of the modelled area in order to provide an overall picture of the performance
of the model.
A.1 Impact of Matrix Estimation
This section reports the change in the matrix resulting from matrix estimation. Four checks are made in line with WebTAG 3.19:
Change in Individual IJ Values
Change in Trip Ends
Change in Trip Length
Change in Sector to Sector Movements These are reported in the following tables.
Table 22: Matrix Zonal IJ cell value comparison
Time Period
Vehicle Type
Slope Intercept R2
0700 Car 0.9432 0 0.9269
0700 LGV 0.8046 0 0.8055
0700 HGV 0.7525 0 0.6941
0800 Car 0.9104 0 0.9206
0800 LGV 0.7499 0 0.7535
0800 HGV 0.5940 0 0.5930
0900 Car 0.9230 0 0.9499
0900 LGV 0.8027 0 0.8240
0900 HGV 0.7858 0 0.8279
IP Car 0.8879 0 0.9160
IP LGV 0.8185 0 0.8109
IP HGV 0.5986 0 0.6774
1600 Car 0.8973 0 0.9145
1600 LGV 0.8060 0 0.7940
1600 HGV 0.7481 0 0.7919
1700 Car 0.9074 0 0.9057
1700 LGV 0.7681 0 0.7662
1700 HGV 0.3804 0 0.4159
1800 Car 0.9160 0 0.9156
Appendix A – Highway Model
Validation Results

Draft File Note
Direct Tel: +44 (0)113 391 6882
T +44 (0)113 391 6800
F +44 (0)113 391 6899
www.aecom.com
5th Floor 2 City Walk Leeds LS11 9AR United Kingdom
Page: 56 of
84 Doc. FA/10 Revised: April 2009
C:\Documents and Settings\tomg\Local Settings\Temporary Internet Files\Content.Outlook\751ZWXD5\Leeds NGT LTM Update v7.docx
1800 LGV 0.7109 0 0.7244
1800 HGV 0.4461 0 0.4933
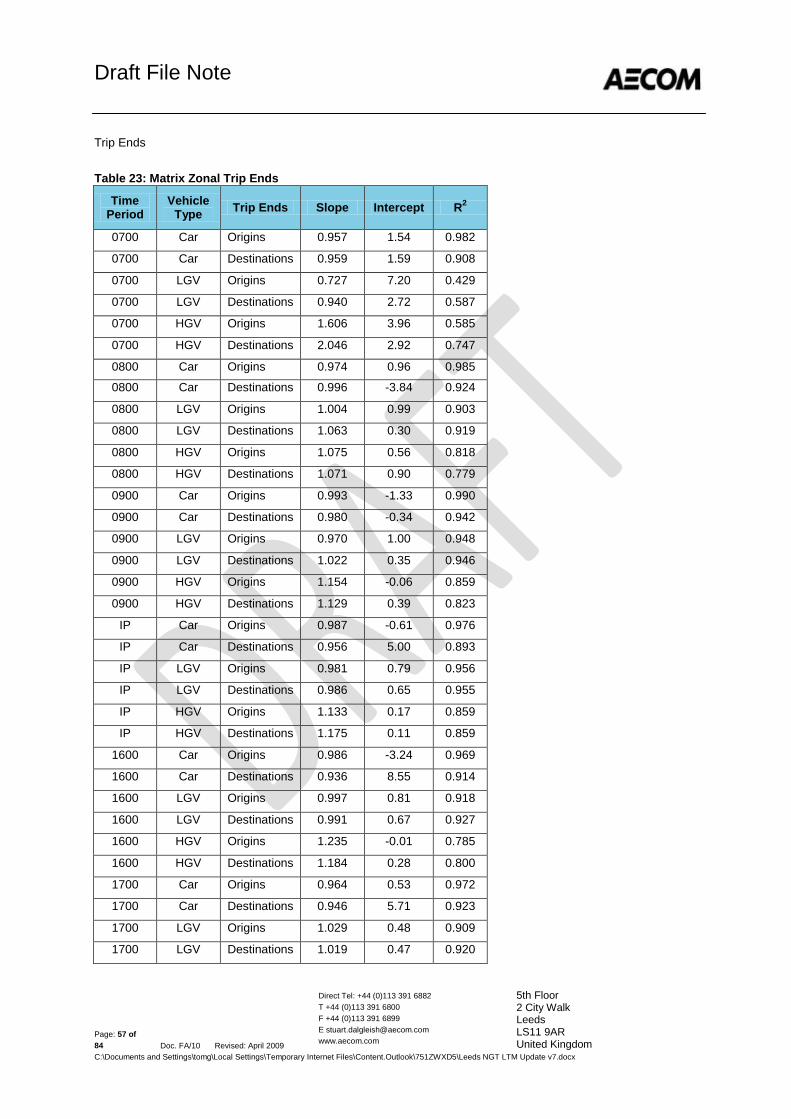
Draft File Note
Direct Tel: +44 (0)113 391 6882
T +44 (0)113 391 6800
F +44 (0)113 391 6899
www.aecom.com
5th Floor 2 City Walk Leeds LS11 9AR United Kingdom
Page: 57 of
84 Doc. FA/10 Revised: April 2009
C:\Documents and Settings\tomg\Local Settings\Temporary Internet Files\Content.Outlook\751ZWXD5\Leeds NGT LTM Update v7.docx
Trip Ends
Table 23: Matrix Zonal Trip Ends
Time Period
Vehicle Type
Trip Ends Slope Intercept R2
0700 Car Origins 0.957 1.54 0.982
0700 Car Destinations 0.959 1.59 0.908
0700 LGV Origins 0.727 7.20 0.429
0700 LGV Destinations 0.940 2.72 0.587
0700 HGV Origins 1.606 3.96 0.585
0700 HGV Destinations 2.046 2.92 0.747
0800 Car Origins 0.974 0.96 0.985
0800 Car Destinations 0.996 -3.84 0.924
0800 LGV Origins 1.004 0.99 0.903
0800 LGV Destinations 1.063 0.30 0.919
0800 HGV Origins 1.075 0.56 0.818
0800 HGV Destinations 1.071 0.90 0.779
0900 Car Origins 0.993 -1.33 0.990
0900 Car Destinations 0.980 -0.34 0.942
0900 LGV Origins 0.970 1.00 0.948
0900 LGV Destinations 1.022 0.35 0.946
0900 HGV Origins 1.154 -0.06 0.859
0900 HGV Destinations 1.129 0.39 0.823
IP Car Origins 0.987 -0.61 0.976
IP Car Destinations 0.956 5.00 0.893
IP LGV Origins 0.981 0.79 0.956
IP LGV Destinations 0.986 0.65 0.955
IP HGV Origins 1.133 0.17 0.859
IP HGV Destinations 1.175 0.11 0.859
1600 Car Origins 0.986 -3.24 0.969
1600 Car Destinations 0.936 8.55 0.914
1600 LGV Origins 0.997 0.81 0.918
1600 LGV Destinations 0.991 0.67 0.927
1600 HGV Origins 1.235 -0.01 0.785
1600 HGV Destinations 1.184 0.28 0.800
1700 Car Origins 0.964 0.53 0.972
1700 Car Destinations 0.946 5.71 0.923
1700 LGV Origins 1.029 0.48 0.909
1700 LGV Destinations 1.019 0.47 0.920
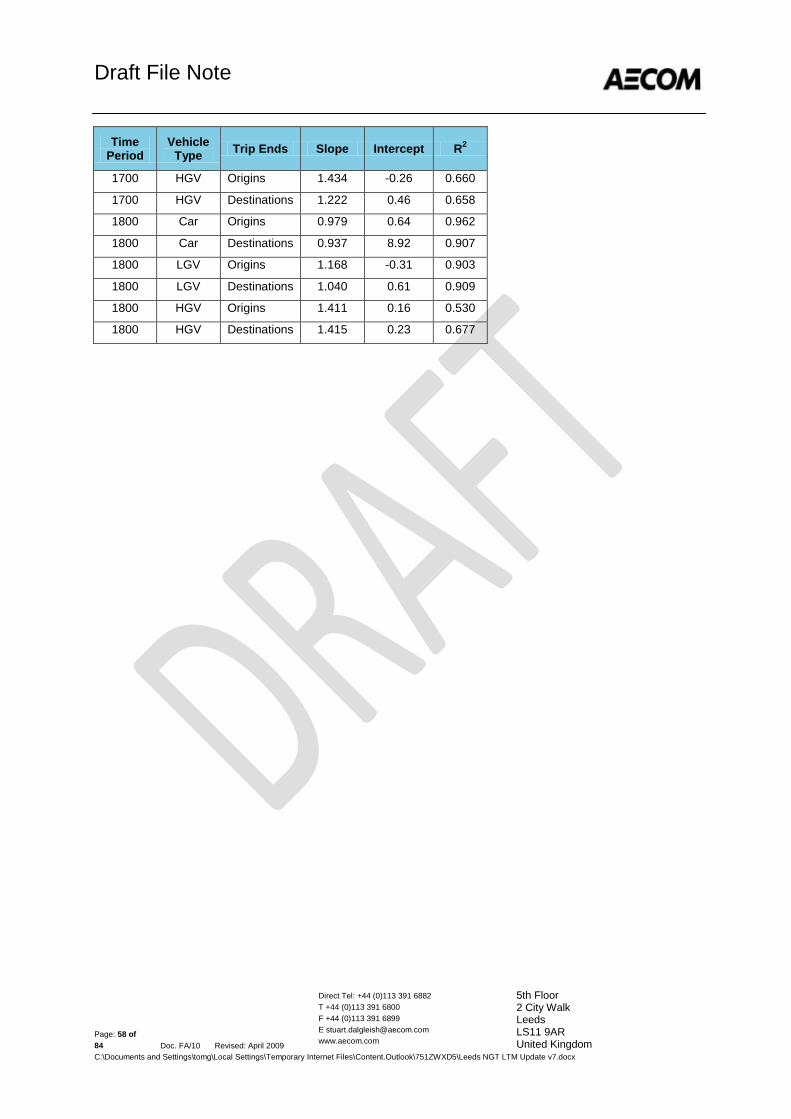
Draft File Note
Direct Tel: +44 (0)113 391 6882
T +44 (0)113 391 6800
F +44 (0)113 391 6899
www.aecom.com
5th Floor 2 City Walk Leeds LS11 9AR United Kingdom
Page: 58 of
84 Doc. FA/10 Revised: April 2009
C:\Documents and Settings\tomg\Local Settings\Temporary Internet Files\Content.Outlook\751ZWXD5\Leeds NGT LTM Update v7.docx
Time Period
Vehicle Type
Trip Ends Slope Intercept R2
1700 HGV Origins 1.434 -0.26 0.660
1700 HGV Destinations 1.222 0.46 0.658
1800 Car Origins 0.979 0.64 0.962
1800 Car Destinations 0.937 8.92 0.907
1800 LGV Origins 1.168 -0.31 0.903
1800 LGV Destinations 1.040 0.61 0.909
1800 HGV Origins 1.411 0.16 0.530
1800 HGV Destinations 1.415 0.23 0.677
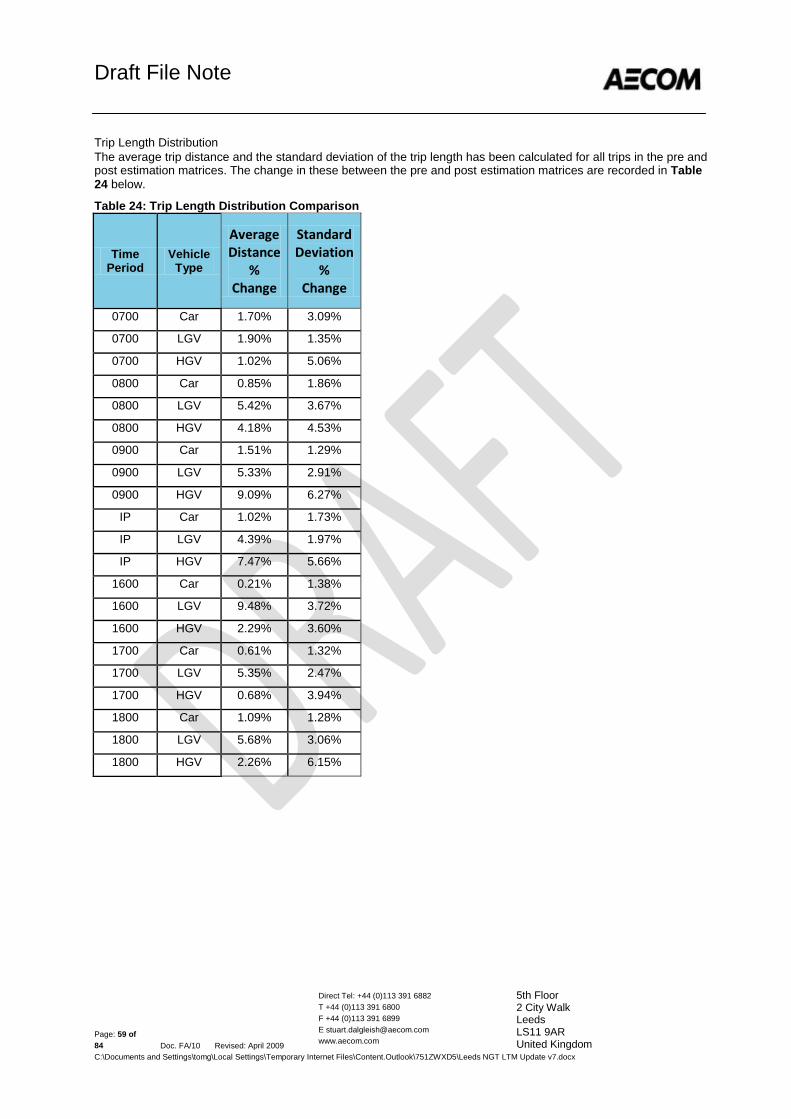
Draft File Note
Direct Tel: +44 (0)113 391 6882
T +44 (0)113 391 6800
F +44 (0)113 391 6899
www.aecom.com
5th Floor 2 City Walk Leeds LS11 9AR United Kingdom
Page: 59 of
84 Doc. FA/10 Revised: April 2009
C:\Documents and Settings\tomg\Local Settings\Temporary Internet Files\Content.Outlook\751ZWXD5\Leeds NGT LTM Update v7.docx
Trip Length Distribution
The average trip distance and the standard deviation of the trip length has been calculated for all trips in the pre and post estimation matrices. The change in these between the pre and post estimation matrices are recorded in Table 24 below.
Table 24: Trip Length Distribution Comparison
Time Period
Vehicle Type
Average Distance
% Change
Standard Deviation
% Change
0700 Car 1.70% 3.09%
0700 LGV 1.90% 1.35%
0700 HGV 1.02% 5.06%
0800 Car 0.85% 1.86%
0800 LGV 5.42% 3.67%
0800 HGV 4.18% 4.53%
0900 Car 1.51% 1.29%
0900 LGV 5.33% 2.91%
0900 HGV 9.09% 6.27%
IP Car 1.02% 1.73%
IP LGV 4.39% 1.97%
IP HGV 7.47% 5.66%
1600 Car 0.21% 1.38%
1600 LGV 9.48% 3.72%
1600 HGV 2.29% 3.60%
1700 Car 0.61% 1.32%
1700 LGV 5.35% 2.47%
1700 HGV 0.68% 3.94%
1800 Car 1.09% 1.28%
1800 LGV 5.68% 3.06%
1800 HGV 2.26% 6.15%
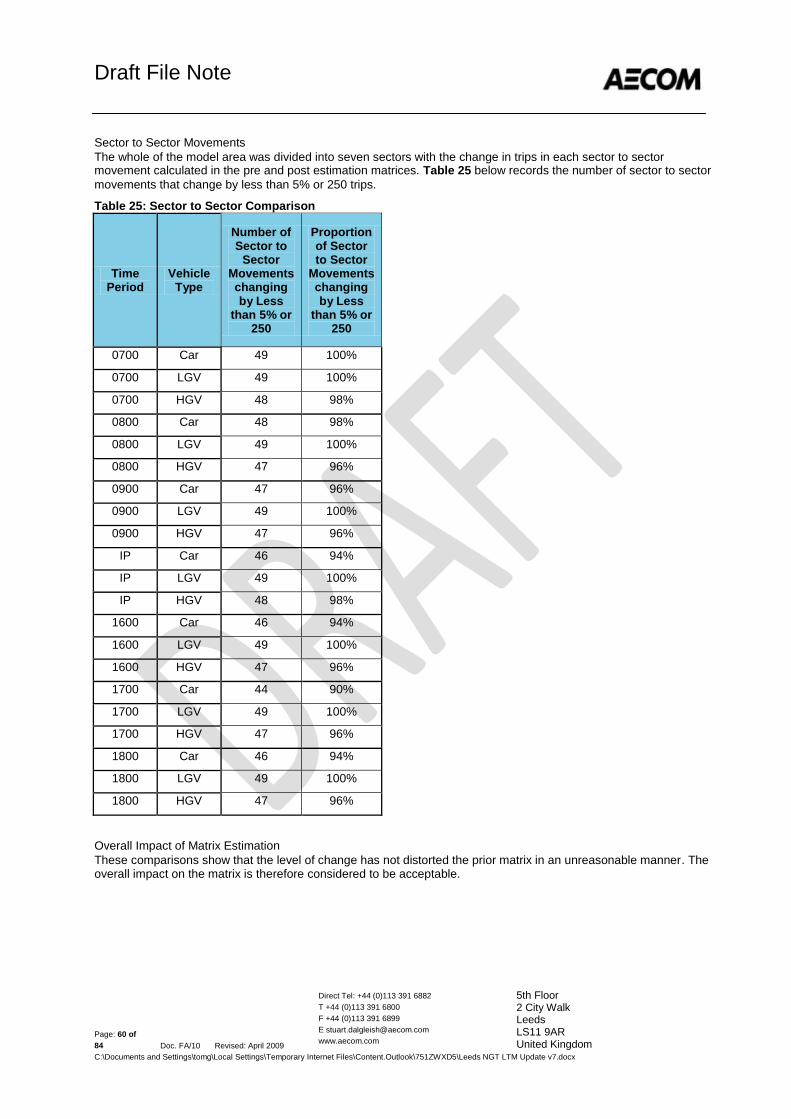
Draft File Note
Direct Tel: +44 (0)113 391 6882
T +44 (0)113 391 6800
F +44 (0)113 391 6899
www.aecom.com
5th Floor 2 City Walk Leeds LS11 9AR United Kingdom
Page: 60 of
84 Doc. FA/10 Revised: April 2009
C:\Documents and Settings\tomg\Local Settings\Temporary Internet Files\Content.Outlook\751ZWXD5\Leeds NGT LTM Update v7.docx
Sector to Sector Movements
The whole of the model area was divided into seven sectors with the change in trips in each sector to sector movement calculated in the pre and post estimation matrices. Table 25 below records the number of sector to sector
movements that change by less than 5% or 250 trips.
Table 25: Sector to Sector Comparison
Time Period
Vehicle Type
Number of Sector to
Sector Movements changing by Less
than 5% or 250
Proportion of Sector to Sector
Movements changing by Less
than 5% or 250
0700 Car 49 100%
0700 LGV 49 100%
0700 HGV 48 98%
0800 Car 48 98%
0800 LGV 49 100%
0800 HGV 47 96%
0900 Car 47 96%
0900 LGV 49 100%
0900 HGV 47 96%
IP Car 46 94%
IP LGV 49 100%
IP HGV 48 98%
1600 Car 46 94%
1600 LGV 49 100%
1600 HGV 47 96%
1700 Car 44 90%
1700 LGV 49 100%
1700 HGV 47 96%
1800 Car 46 94%
1800 LGV 49 100%
1800 HGV 47 96%
Overall Impact of Matrix Estimation
These comparisons show that the level of change has not distorted the prior matrix in an unreasonable manner. The overall impact on the matrix is therefore considered to be acceptable.
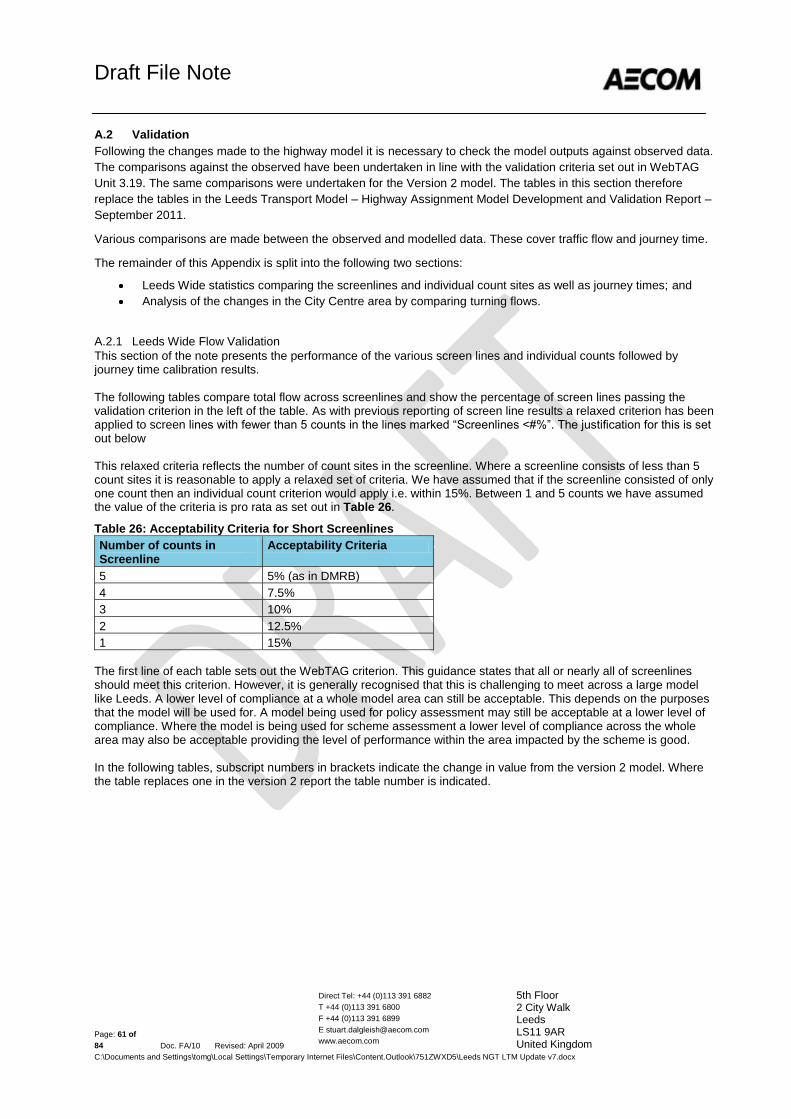
Draft File Note
Direct Tel: +44 (0)113 391 6882
T +44 (0)113 391 6800
F +44 (0)113 391 6899
www.aecom.com
5th Floor 2 City Walk Leeds LS11 9AR United Kingdom
Page: 61 of
84 Doc. FA/10 Revised: April 2009
C:\Documents and Settings\tomg\Local Settings\Temporary Internet Files\Content.Outlook\751ZWXD5\Leeds NGT LTM Update v7.docx
A.2 Validation
Following the changes made to the highway model it is necessary to check the model outputs against observed data.
The comparisons against the observed have been undertaken in line with the validation criteria set out in WebTAG
Unit 3.19. The same comparisons were undertaken for the Version 2 model. The tables in this section therefore
replace the tables in the Leeds Transport Model – Highway Assignment Model Development and Validation Report –
September 2011.
Various comparisons are made between the observed and modelled data. These cover traffic flow and journey time.
The remainder of this Appendix is split into the following two sections:
Leeds Wide statistics comparing the screenlines and individual count sites as well as journey times; and
Analysis of the changes in the City Centre area by comparing turning flows.
A.2.1 Leeds Wide Flow Validation
This section of the note presents the performance of the various screen lines and individual counts followed by journey time calibration results. The following tables compare total flow across screenlines and show the percentage of screen lines passing the validation criterion in the left of the table. As with previous reporting of screen line results a relaxed criterion has been applied to screen lines with fewer than 5 counts in the lines marked “Screenlines <#%”. The justification for this is set out below This relaxed criteria reflects the number of count sites in the screenline. Where a screenline consists of less than 5 count sites it is reasonable to apply a relaxed set of criteria. We have assumed that if the screenline consisted of only one count then an individual count criterion would apply i.e. within 15%. Between 1 and 5 counts we have assumed the value of the criteria is pro rata as set out in Table 26.
Table 26: Acceptability Criteria for Short Screenlines
Number of counts in Screenline
Acceptability Criteria
5 5% (as in DMRB)
4 7.5%
3 10%
2 12.5%
1 15%
The first line of each table sets out the WebTAG criterion. This guidance states that all or nearly all of screenlines should meet this criterion. However, it is generally recognised that this is challenging to meet across a large model like Leeds. A lower level of compliance at a whole model area can still be acceptable. This depends on the purposes that the model will be used for. A model being used for policy assessment may still be acceptable at a lower level of compliance. Where the model is being used for scheme assessment a lower level of compliance across the whole area may also be acceptable providing the level of performance within the area impacted by the scheme is good. In the following tables, subscript numbers in brackets indicate the change in value from the version 2 model. Where the table replaces one in the version 2 report the table number is indicated.
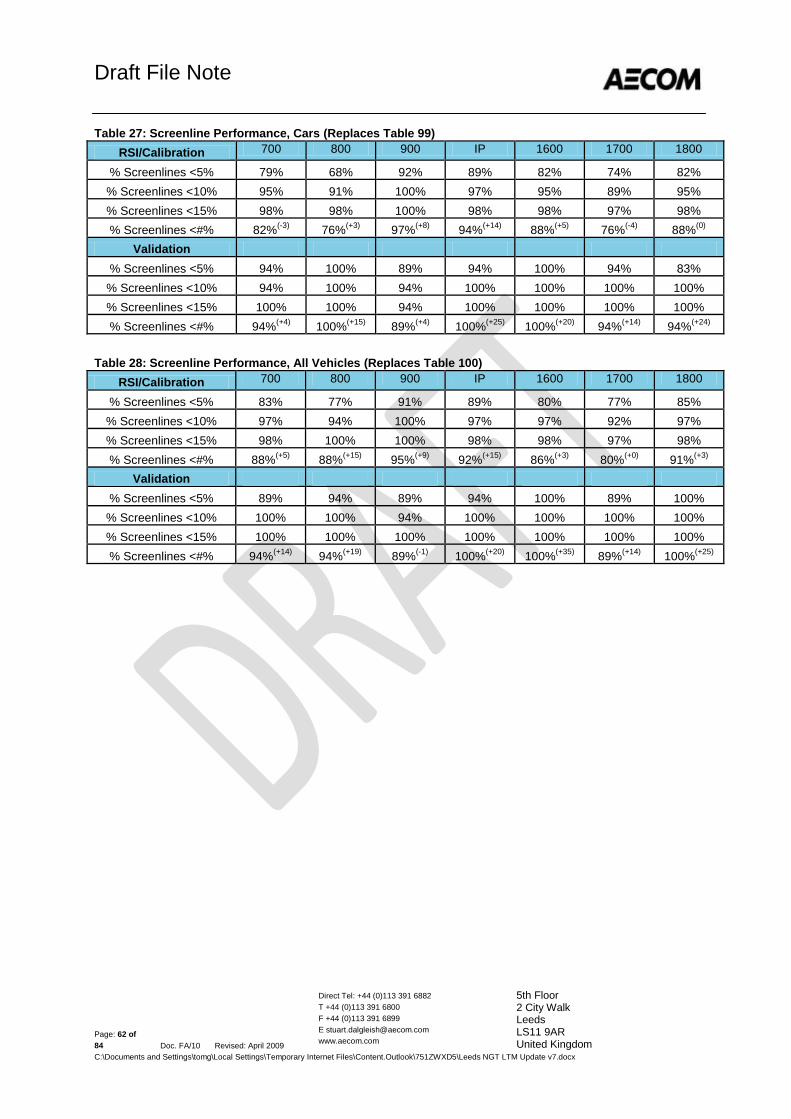
Draft File Note
Direct Tel: +44 (0)113 391 6882
T +44 (0)113 391 6800
F +44 (0)113 391 6899
www.aecom.com
5th Floor 2 City Walk Leeds LS11 9AR United Kingdom
Page: 62 of
84 Doc. FA/10 Revised: April 2009
C:\Documents and Settings\tomg\Local Settings\Temporary Internet Files\Content.Outlook\751ZWXD5\Leeds NGT LTM Update v7.docx
Table 27: Screenline Performance, Cars (Replaces Table 99)
RSI/Calibration 700 800 900 IP 1600 1700 1800
% Screenlines <5% 79% 68% 92% 89% 82% 74% 82%
% Screenlines <10% 95% 91% 100% 97% 95% 89% 95%
% Screenlines <15% 98% 98% 100% 98% 98% 97% 98%
% Screenlines <#% 82%(-3)
76%(+3)
97%(+8)
94%(+14)
88%(+5)
76%(-4)
88%(0)
Validation
% Screenlines <5% 94% 100% 89% 94% 100% 94% 83%
% Screenlines <10% 94% 100% 94% 100% 100% 100% 100%
% Screenlines <15% 100% 100% 94% 100% 100% 100% 100%
% Screenlines <#% 94%(+4)
100%(+15)
89%(+4)
100%(+25)
100%(+20)
94%(+14)
94%(+24)
Table 28: Screenline Performance, All Vehicles (Replaces Table 100)
RSI/Calibration 700 800 900 IP 1600 1700 1800
% Screenlines <5% 83% 77% 91% 89% 80% 77% 85%
% Screenlines <10% 97% 94% 100% 97% 97% 92% 97%
% Screenlines <15% 98% 100% 100% 98% 98% 97% 98%
% Screenlines <#% 88%(+5)
88%(+15)
95%(+9)
92%(+15)
86%(+3)
80%(+0)
91%(+3)
Validation
% Screenlines <5% 89% 94% 89% 94% 100% 89% 100%
% Screenlines <10% 100% 100% 94% 100% 100% 100% 100%
% Screenlines <15% 100% 100% 100% 100% 100% 100% 100%
% Screenlines <#% 94%(+14)
94%(+19)
89%(-1)
100%(+20)
100%(+35)
89%(+14)
100%(+25)
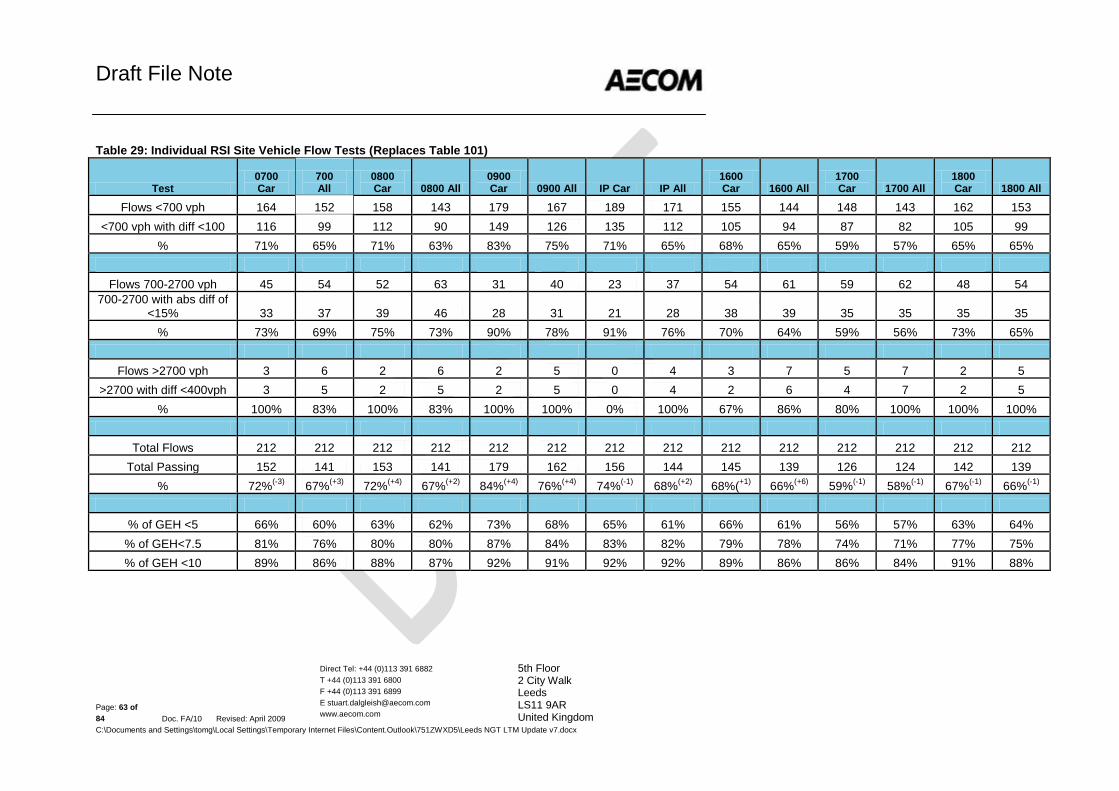
Draft File Note
Direct Tel: +44 (0)113 391 6882
T +44 (0)113 391 6800
F +44 (0)113 391 6899
www.aecom.com
5th Floor 2 City Walk Leeds LS11 9AR United Kingdom
Page: 63 of
84 Doc. FA/10 Revised: April 2009
C:\Documents and Settings\tomg\Local Settings\Temporary Internet Files\Content.Outlook\751ZWXD5\Leeds NGT LTM Update v7.docx
Table 29: Individual RSI Site Vehicle Flow Tests (Replaces Table 101)
Test 0700 Car
700 All
0800 Car 0800 All
0900 Car 0900 All IP Car IP All
1600 Car 1600 All
1700 Car 1700 All
1800 Car 1800 All
Flows <700 vph 164 152 158 143 179 167 189 171 155 144 148 143 162 153
<700 vph with diff <100 116 99 112 90 149 126 135 112 105 94 87 82 105 99
% 71% 65% 71% 63% 83% 75% 71% 65% 68% 65% 59% 57% 65% 65%
Flows 700-2700 vph 45 54 52 63 31 40 23 37 54 61 59 62 48 54
700-2700 with abs diff of <15% 33 37 39 46 28 31 21 28 38 39 35 35 35 35
% 73% 69% 75% 73% 90% 78% 91% 76% 70% 64% 59% 56% 73% 65%
Flows >2700 vph 3 6 2 6 2 5 0 4 3 7 5 7 2 5
>2700 with diff <400vph 3 5 2 5 2 5 0 4 2 6 4 7 2 5
% 100% 83% 100% 83% 100% 100% 0% 100% 67% 86% 80% 100% 100% 100%
Total Flows 212 212 212 212 212 212 212 212 212 212 212 212 212 212
Total Passing 152 141 153 141 179 162 156 144 145 139 126 124 142 139
% 72%(-3)
67%(+3)
72%(+4)
67%(+2)
84%(+4)
76%(+4)
74%(-1)
68%(+2)
68%(+1)
66%(+6)
59%(-1)
58%(-1)
67%(-1)
66%(-1)
% of GEH <5 66% 60% 63% 62% 73% 68% 65% 61% 66% 61% 56% 57% 63% 64%
% of GEH<7.5 81% 76% 80% 80% 87% 84% 83% 82% 79% 78% 74% 71% 77% 75%
% of GEH <10 89% 86% 88% 87% 92% 91% 92% 92% 89% 86% 86% 84% 91% 88%
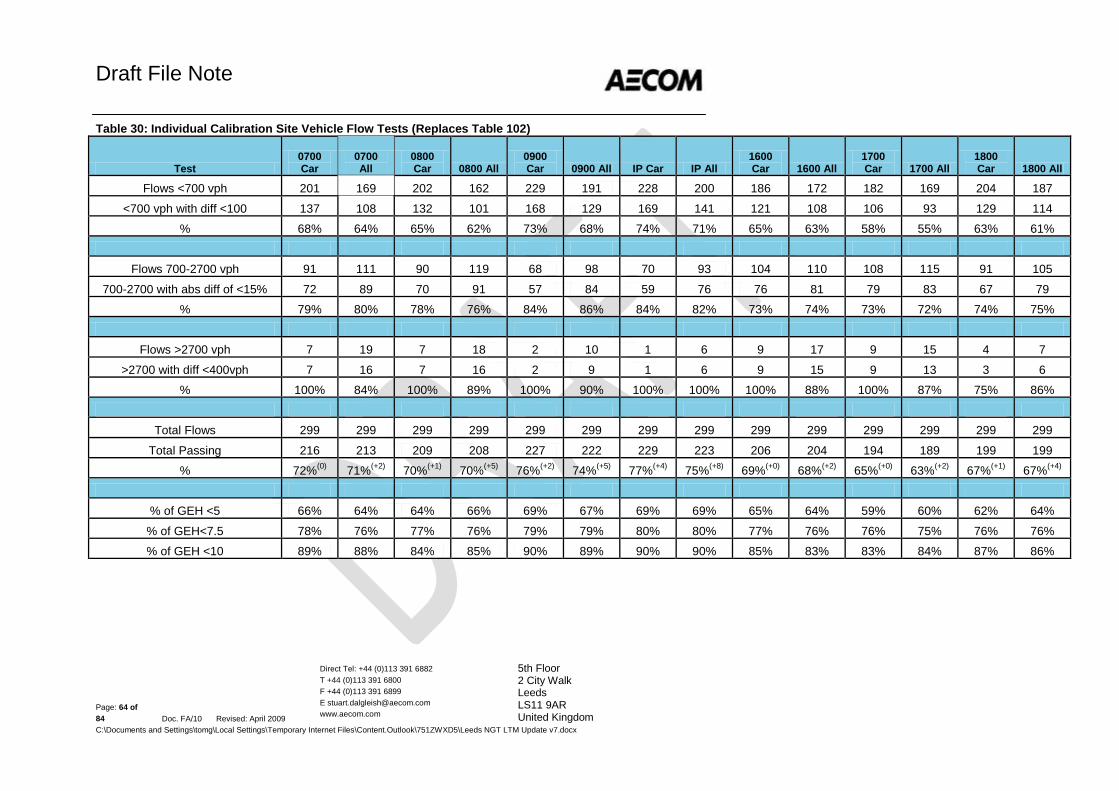
Draft File Note
Direct Tel: +44 (0)113 391 6882
T +44 (0)113 391 6800
F +44 (0)113 391 6899
www.aecom.com
5th Floor 2 City Walk Leeds LS11 9AR United Kingdom
Page: 64 of
84 Doc. FA/10 Revised: April 2009
C:\Documents and Settings\tomg\Local Settings\Temporary Internet Files\Content.Outlook\751ZWXD5\Leeds NGT LTM Update v7.docx
Table 30: Individual Calibration Site Vehicle Flow Tests (Replaces Table 102)
Test 0700 Car
0700 All
0800 Car 0800 All
0900 Car 0900 All IP Car IP All
1600 Car 1600 All
1700 Car 1700 All
1800 Car 1800 All
Flows <700 vph 201 169 202 162 229 191 228 200 186 172 182 169 204 187
<700 vph with diff <100 137 108 132 101 168 129 169 141 121 108 106 93 129 114
% 68% 64% 65% 62% 73% 68% 74% 71% 65% 63% 58% 55% 63% 61%
Flows 700-2700 vph 91 111 90 119 68 98 70 93 104 110 108 115 91 105
700-2700 with abs diff of <15% 72 89 70 91 57 84 59 76 76 81 79 83 67 79
% 79% 80% 78% 76% 84% 86% 84% 82% 73% 74% 73% 72% 74% 75%
Flows >2700 vph 7 19 7 18 2 10 1 6 9 17 9 15 4 7
>2700 with diff <400vph 7 16 7 16 2 9 1 6 9 15 9 13 3 6
% 100% 84% 100% 89% 100% 90% 100% 100% 100% 88% 100% 87% 75% 86%
Total Flows 299 299 299 299 299 299 299 299 299 299 299 299 299 299
Total Passing 216 213 209 208 227 222 229 223 206 204 194 189 199 199
% 72%(0)
71%(+2)
70%(+1)
70%(+5)
76%(+2)
74%(+5)
77%(+4)
75%(+8)
69%(+0)
68%(+2)
65%(+0)
63%(+2)
67%(+1)
67%(+4)
% of GEH <5 66% 64% 64% 66% 69% 67% 69% 69% 65% 64% 59% 60% 62% 64%
% of GEH<7.5 78% 76% 77% 76% 79% 79% 80% 80% 77% 76% 76% 75% 76% 76%
% of GEH <10 89% 88% 84% 85% 90% 89% 90% 90% 85% 83% 83% 84% 87% 86%
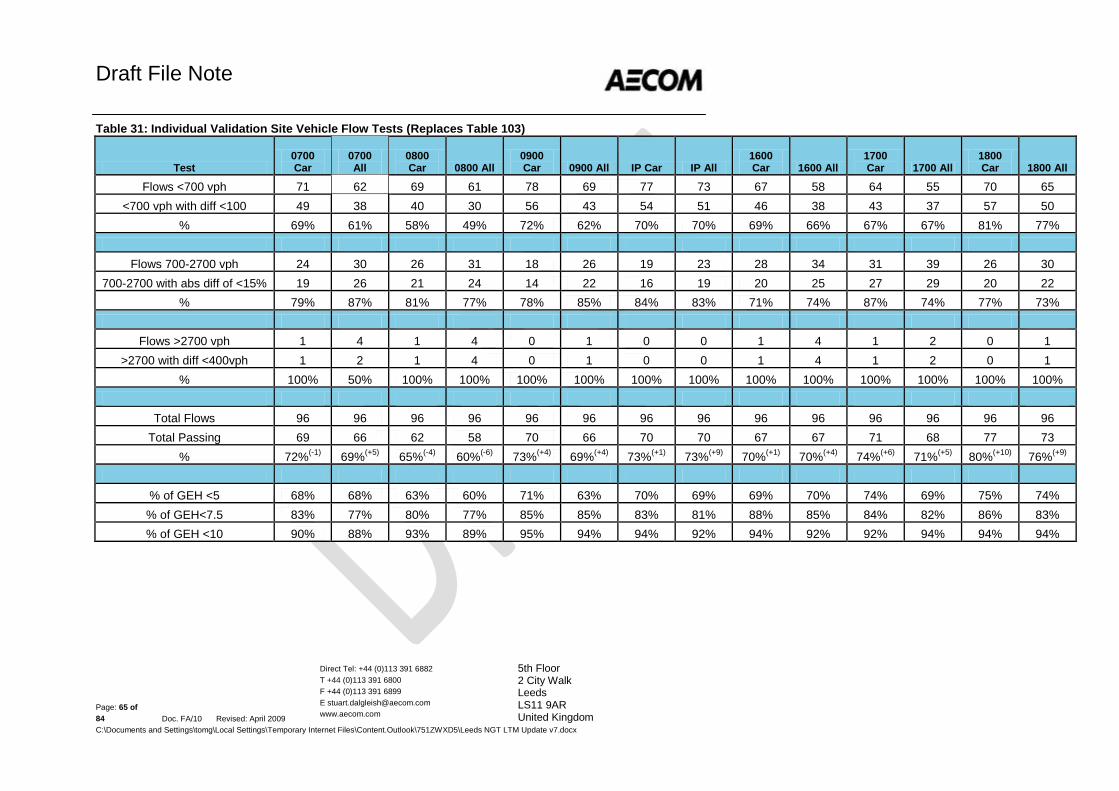
Draft File Note
Direct Tel: +44 (0)113 391 6882
T +44 (0)113 391 6800
F +44 (0)113 391 6899
www.aecom.com
5th Floor 2 City Walk Leeds LS11 9AR United Kingdom
Page: 65 of
84 Doc. FA/10 Revised: April 2009
C:\Documents and Settings\tomg\Local Settings\Temporary Internet Files\Content.Outlook\751ZWXD5\Leeds NGT LTM Update v7.docx
Table 31: Individual Validation Site Vehicle Flow Tests (Replaces Table 103)
Test 0700 Car
0700 All
0800 Car 0800 All
0900 Car 0900 All IP Car IP All
1600 Car 1600 All
1700 Car 1700 All
1800 Car 1800 All
Flows <700 vph 71 62 69 61 78 69 77 73 67 58 64 55 70 65
<700 vph with diff <100 49 38 40 30 56 43 54 51 46 38 43 37 57 50
% 69% 61% 58% 49% 72% 62% 70% 70% 69% 66% 67% 67% 81% 77%
Flows 700-2700 vph 24 30 26 31 18 26 19 23 28 34 31 39 26 30
700-2700 with abs diff of <15% 19 26 21 24 14 22 16 19 20 25 27 29 20 22
% 79% 87% 81% 77% 78% 85% 84% 83% 71% 74% 87% 74% 77% 73%
Flows >2700 vph 1 4 1 4 0 1 0 0 1 4 1 2 0 1
>2700 with diff <400vph 1 2 1 4 0 1 0 0 1 4 1 2 0 1
% 100% 50% 100% 100% 100% 100% 100% 100% 100% 100% 100% 100% 100% 100%
Total Flows 96 96 96 96 96 96 96 96 96 96 96 96 96 96
Total Passing 69 66 62 58 70 66 70 70 67 67 71 68 77 73
% 72%(-1)
69%(+5)
65%(-4)
60%(-6)
73%(+4)
69%(+4)
73%(+1)
73%(+9)
70%(+1)
70%(+4)
74%(+6)
71%(+5)
80%(+10)
76%(+9)
% of GEH <5 68% 68% 63% 60% 71% 63% 70% 69% 69% 70% 74% 69% 75% 74%
% of GEH<7.5 83% 77% 80% 77% 85% 85% 83% 81% 88% 85% 84% 82% 86% 83%
% of GEH <10 90% 88% 93% 89% 95% 94% 94% 92% 94% 92% 92% 94% 94% 94%
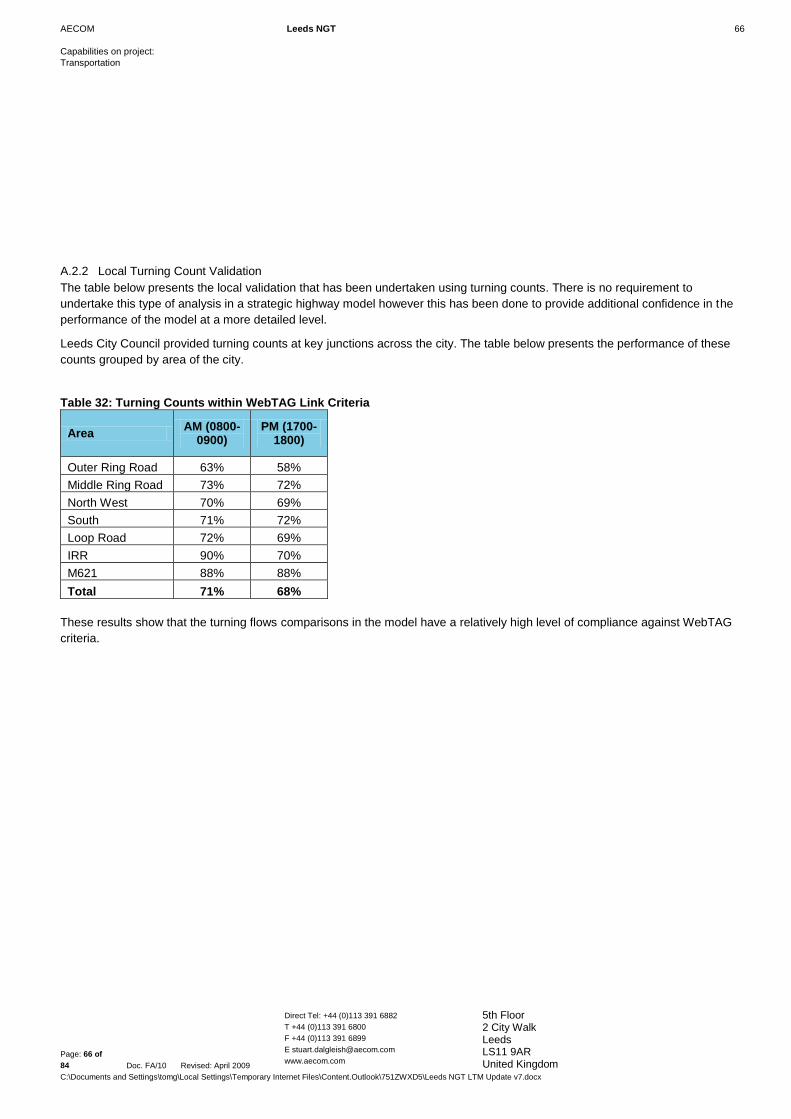
AECOM Leeds NGT 66
Capabilities on project:
Transportation
Direct Tel: +44 (0)113 391 6882
T +44 (0)113 391 6800
F +44 (0)113 391 6899
www.aecom.com
5th Floor 2 City Walk Leeds LS11 9AR United Kingdom
Page: 66 of
84 Doc. FA/10 Revised: April 2009
C:\Documents and Settings\tomg\Local Settings\Temporary Internet Files\Content.Outlook\751ZWXD5\Leeds NGT LTM Update v7.docx
A.2.2 Local Turning Count Validation
The table below presents the local validation that has been undertaken using turning counts. There is no requirement to
undertake this type of analysis in a strategic highway model however this has been done to provide additional confidence in the
performance of the model at a more detailed level.
Leeds City Council provided turning counts at key junctions across the city. The table below presents the performance of these
counts grouped by area of the city.
Table 32: Turning Counts within WebTAG Link Criteria
Area AM (0800-
0900) PM (1700-
1800)
Outer Ring Road 63% 58%
Middle Ring Road 73% 72%
North West 70% 69%
South 71% 72%
Loop Road 72% 69%
IRR 90% 70%
M621 88% 88%
Total 71% 68%
These results show that the turning flows comparisons in the model have a relatively high level of compliance against WebTAG
criteria.
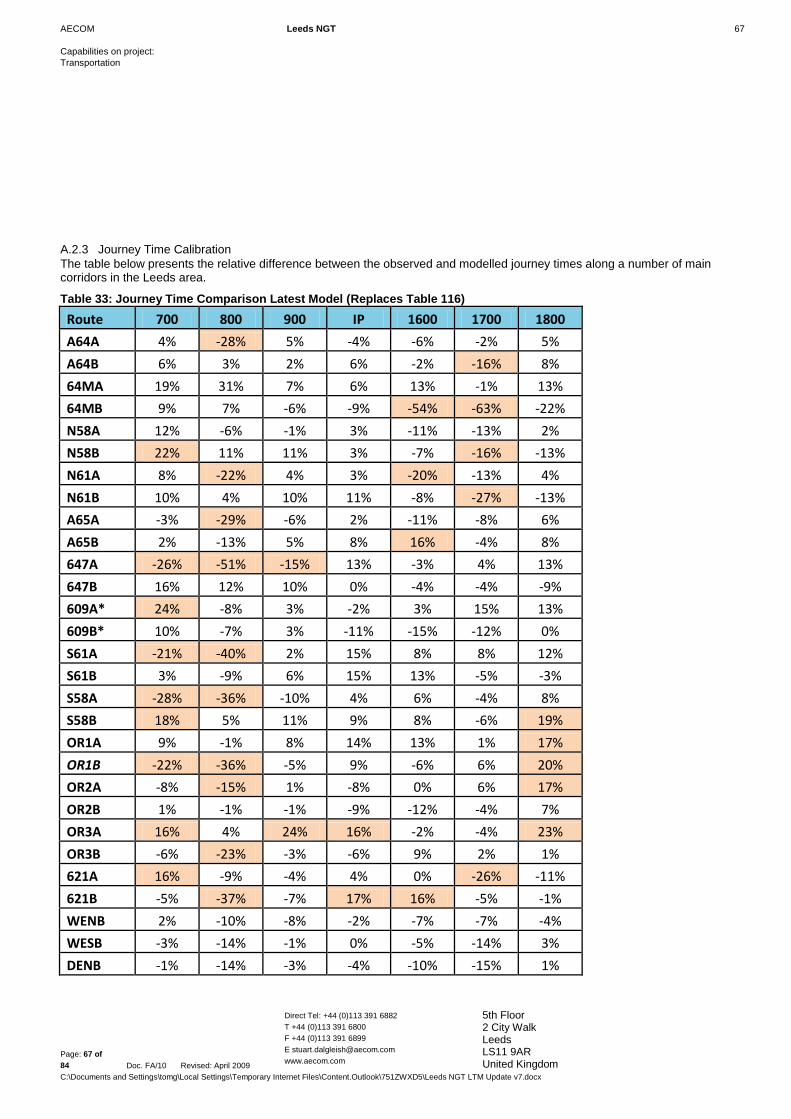
AECOM Leeds NGT 67
Capabilities on project:
Transportation
Direct Tel: +44 (0)113 391 6882
T +44 (0)113 391 6800
F +44 (0)113 391 6899
www.aecom.com
5th Floor 2 City Walk Leeds LS11 9AR United Kingdom
Page: 67 of
84 Doc. FA/10 Revised: April 2009
C:\Documents and Settings\tomg\Local Settings\Temporary Internet Files\Content.Outlook\751ZWXD5\Leeds NGT LTM Update v7.docx
A.2.3 Journey Time Calibration
The table below presents the relative difference between the observed and modelled journey times along a number of main corridors in the Leeds area.
Table 33: Journey Time Comparison Latest Model (Replaces Table 116)
Route 700 800 900 IP 1600 1700 1800
A64A 4% -28% 5% -4% -6% -2% 5%
A64B 6% 3% 2% 6% -2% -16% 8%
64MA 19% 31% 7% 6% 13% -1% 13%
64MB 9% 7% -6% -9% -54% -63% -22%
N58A 12% -6% -1% 3% -11% -13% 2%
N58B 22% 11% 11% 3% -7% -16% -13%
N61A 8% -22% 4% 3% -20% -13% 4%
N61B 10% 4% 10% 11% -8% -27% -13%
A65A -3% -29% -6% 2% -11% -8% 6%
A65B 2% -13% 5% 8% 16% -4% 8%
647A -26% -51% -15% 13% -3% 4% 13%
647B 16% 12% 10% 0% -4% -4% -9%
609A* 24% -8% 3% -2% 3% 15% 13%
609B* 10% -7% 3% -11% -15% -12% 0%
S61A -21% -40% 2% 15% 8% 8% 12%
S61B 3% -9% 6% 15% 13% -5% -3%
S58A -28% -36% -10% 4% 6% -4% 8%
S58B 18% 5% 11% 9% 8% -6% 19%
OR1A 9% -1% 8% 14% 13% 1% 17%
OR1B -22% -36% -5% 9% -6% 6% 20%
OR2A -8% -15% 1% -8% 0% 6% 17%
OR2B 1% -1% -1% -9% -12% -4% 7%
OR3A 16% 4% 24% 16% -2% -4% 23%
OR3B -6% -23% -3% -6% 9% 2% 1%
621A 16% -9% -4% 4% 0% -26% -11%
621B -5% -37% -7% 17% 16% -5% -1%
WENB 2% -10% -8% -2% -7% -7% -4%
WESB -3% -14% -1% 0% -5% -14% 3%
DENB -1% -14% -3% -4% -10% -15% 1%
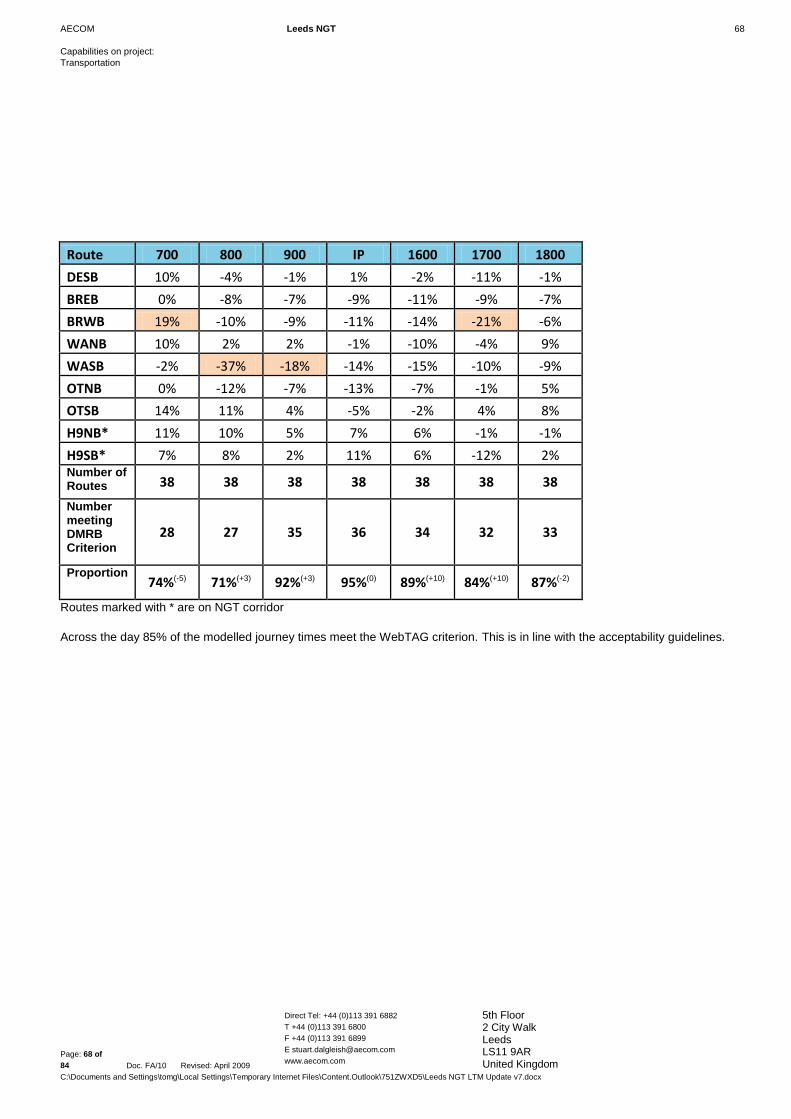
AECOM Leeds NGT 68
Capabilities on project:
Transportation
Direct Tel: +44 (0)113 391 6882
T +44 (0)113 391 6800
F +44 (0)113 391 6899
www.aecom.com
5th Floor 2 City Walk Leeds LS11 9AR United Kingdom
Page: 68 of
84 Doc. FA/10 Revised: April 2009
C:\Documents and Settings\tomg\Local Settings\Temporary Internet Files\Content.Outlook\751ZWXD5\Leeds NGT LTM Update v7.docx
Route 700 800 900 IP 1600 1700 1800
DESB 10% -4% -1% 1% -2% -11% -1%
BREB 0% -8% -7% -9% -11% -9% -7%
BRWB 19% -10% -9% -11% -14% -21% -6%
WANB 10% 2% 2% -1% -10% -4% 9%
WASB -2% -37% -18% -14% -15% -10% -9%
OTNB 0% -12% -7% -13% -7% -1% 5%
OTSB 14% 11% 4% -5% -2% 4% 8%
H9NB* 11% 10% 5% 7% 6% -1% -1%
H9SB* 7% 8% 2% 11% 6% -12% 2% Number of Routes 38 38 38 38 38 38 38
Number meeting DMRB Criterion
28 27 35 36 34 32 33
Proportion 74%(-5) 71%(+3) 92%(+3) 95%(0) 89%(+10) 84%(+10) 87%(-2)
Routes marked with * are on NGT corridor
Across the day 85% of the modelled journey times meet the WebTAG criterion. This is in line with the acceptability guidelines.

Appendix B
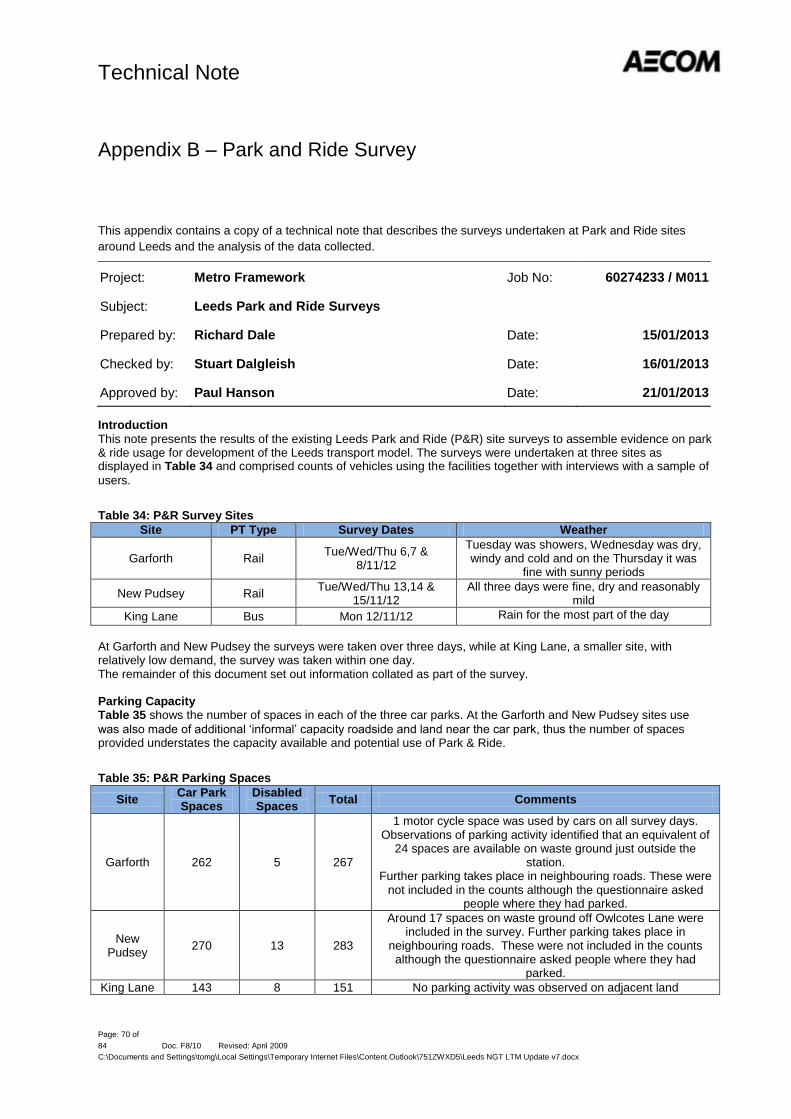
Technical Note
Page: 70 of
84 Doc. F8/10 Revised: April 2009
C:\Documents and Settings\tomg\Local Settings\Temporary Internet Files\Content.Outlook\751ZWXD5\Leeds NGT LTM Update v7.docx
This appendix contains a copy of a technical note that describes the surveys undertaken at Park and Ride sites
around Leeds and the analysis of the data collected.
Project: Metro Framework Job No: 60274233 / M011
Subject: Leeds Park and Ride Surveys
Prepared by: Richard Dale Date: 15/01/2013
Checked by: Stuart Dalgleish Date: 16/01/2013
Approved by: Paul Hanson Date: 21/01/2013
Introduction
This note presents the results of the existing Leeds Park and Ride (P&R) site surveys to assemble evidence on park & ride usage for development of the Leeds transport model. The surveys were undertaken at three sites as displayed in Table 34 and comprised counts of vehicles using the facilities together with interviews with a sample of
users.
Table 34: P&R Survey Sites
Site PT Type Survey Dates Weather
Garforth Rail Tue/Wed/Thu 6,7 &
8/11/12
Tuesday was showers, Wednesday was dry, windy and cold and on the Thursday it was
fine with sunny periods
New Pudsey Rail Tue/Wed/Thu 13,14 &
15/11/12 All three days were fine, dry and reasonably
mild
King Lane Bus Mon 12/11/12 Rain for the most part of the day
At Garforth and New Pudsey the surveys were taken over three days, while at King Lane, a smaller site, with relatively low demand, the survey was taken within one day. The remainder of this document set out information collated as part of the survey. Parking Capacity Table 35 shows the number of spaces in each of the three car parks. At the Garforth and New Pudsey sites use
was also made of additional ‘informal’ capacity roadside and land near the car park, thus the number of spaces provided understates the capacity available and potential use of Park & Ride.
Table 35: P&R Parking Spaces
Site Car Park Spaces
Disabled Spaces
Total Comments
Garforth 262 5 267
1 motor cycle space was used by cars on all survey days. Observations of parking activity identified that an equivalent of
24 spaces are available on waste ground just outside the station.
Further parking takes place in neighbouring roads. These were not included in the counts although the questionnaire asked
people where they had parked.
New Pudsey
270 13 283
Around 17 spaces on waste ground off Owlcotes Lane were included in the survey. Further parking takes place in
neighbouring roads. These were not included in the counts although the questionnaire asked people where they had
parked.
King Lane 143 8 151 No parking activity was observed on adjacent land
Appendix B – Park and Ride Survey

Technical Note
Page: 71 of
84 Doc. F8/10 Revised: April 2009
C:\Documents and Settings\tomg\Local Settings\Temporary Internet Files\Content.Outlook\751ZWXD5\Leeds NGT LTM Update v7.docx
Usage of Parking Spaces The following tables summarise the traffic count data collected at each survey location. In Table 36 the main car park counts are shown alongside vehicles using nearby waste land at Garforth, Table 37 lists the main car park counts with those using waste ground off Owlcotes Lane at New Pudsey, while Table 38 shows those using the
King Lane car park for P&R purposes, and those who use it to access the neighbouring school/sixth form. At Garforth the waste ground is closer to the rail station platform than the main car park therefore it tends to fill up before the main car park. Where results were collected at a site over three days, the total values displayed in the following tables were relatively constant through the survey period.
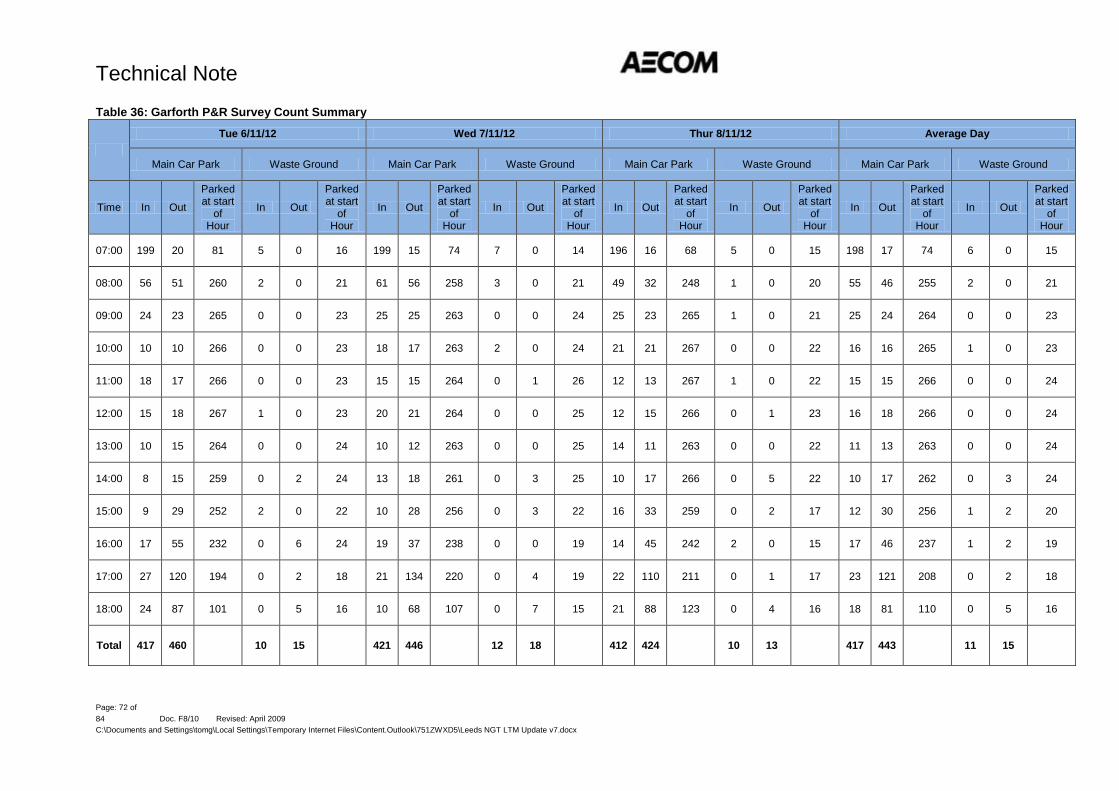
Technical Note
Page: 72 of
84 Doc. F8/10 Revised: April 2009
C:\Documents and Settings\tomg\Local Settings\Temporary Internet Files\Content.Outlook\751ZWXD5\Leeds NGT LTM Update v7.docx
Table 36: Garforth P&R Survey Count Summary
Tue 6/11/12 Wed 7/11/12 Thur 8/11/12 Average Day
Main Car Park Waste Ground Main Car Park Waste Ground Main Car Park Waste Ground Main Car Park Waste Ground
Time In Out
Parked at start
of Hour
In Out
Parked at start
of Hour
In Out
Parked at start
of Hour
In Out
Parked at start
of Hour
In Out
Parked at start
of Hour
In Out
Parked at start
of Hour
In Out
Parked at start
of Hour
In Out
Parked at start
of Hour
07:00 199 20 81 5 0 16 199 15 74 7 0 14 196 16 68 5 0 15 198 17 74 6 0 15
08:00 56 51 260 2 0 21 61 56 258 3 0 21 49 32 248 1 0 20 55 46 255 2 0 21
09:00 24 23 265 0 0 23 25 25 263 0 0 24 25 23 265 1 0 21 25 24 264 0 0 23
10:00 10 10 266 0 0 23 18 17 263 2 0 24 21 21 267 0 0 22 16 16 265 1 0 23
11:00 18 17 266 0 0 23 15 15 264 0 1 26 12 13 267 1 0 22 15 15 266 0 0 24
12:00 15 18 267 1 0 23 20 21 264 0 0 25 12 15 266 0 1 23 16 18 266 0 0 24
13:00 10 15 264 0 0 24 10 12 263 0 0 25 14 11 263 0 0 22 11 13 263 0 0 24
14:00 8 15 259 0 2 24 13 18 261 0 3 25 10 17 266 0 5 22 10 17 262 0 3 24
15:00 9 29 252 2 0 22 10 28 256 0 3 22 16 33 259 0 2 17 12 30 256 1 2 20
16:00 17 55 232 0 6 24 19 37 238 0 0 19 14 45 242 2 0 15 17 46 237 1 2 19
17:00 27 120 194 0 2 18 21 134 220 0 4 19 22 110 211 0 1 17 23 121 208 0 2 18
18:00 24 87 101 0 5 16 10 68 107 0 7 15 21 88 123 0 4 16 18 81 110 0 5 16
Total 417 460
10 15
421 446
12 18
412 424
10 13
417 443
11 15
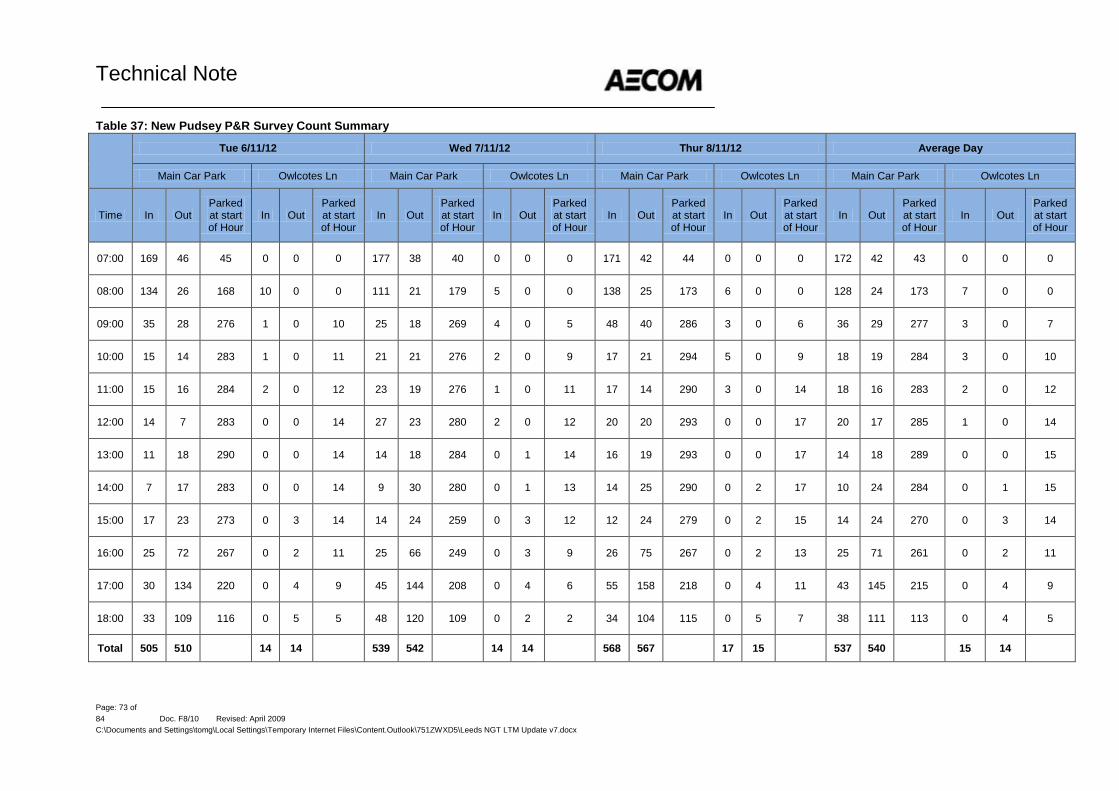
Technical Note
Page: 73 of
84 Doc. F8/10 Revised: April 2009
C:\Documents and Settings\tomg\Local Settings\Temporary Internet Files\Content.Outlook\751ZWXD5\Leeds NGT LTM Update v7.docx
Table 37: New Pudsey P&R Survey Count Summary
Tue 6/11/12 Wed 7/11/12 Thur 8/11/12 Average Day
Main Car Park Owlcotes Ln Main Car Park Owlcotes Ln Main Car Park Owlcotes Ln Main Car Park Owlcotes Ln
Time In Out Parked at start of Hour
In Out Parked at start of Hour
In Out Parked at start of Hour
In Out Parked at start of Hour
In Out Parked at start of Hour
In Out Parked at start of Hour
In Out Parked at start of Hour
In Out Parked at start of Hour
07:00 169 46 45 0 0 0 177 38 40 0 0 0 171 42 44 0 0 0 172 42 43 0 0 0
08:00 134 26 168 10 0 0 111 21 179 5 0 0 138 25 173 6 0 0 128 24 173 7 0 0
09:00 35 28 276 1 0 10 25 18 269 4 0 5 48 40 286 3 0 6 36 29 277 3 0 7
10:00 15 14 283 1 0 11 21 21 276 2 0 9 17 21 294 5 0 9 18 19 284 3 0 10
11:00 15 16 284 2 0 12 23 19 276 1 0 11 17 14 290 3 0 14 18 16 283 2 0 12
12:00 14 7 283 0 0 14 27 23 280 2 0 12 20 20 293 0 0 17 20 17 285 1 0 14
13:00 11 18 290 0 0 14 14 18 284 0 1 14 16 19 293 0 0 17 14 18 289 0 0 15
14:00 7 17 283 0 0 14 9 30 280 0 1 13 14 25 290 0 2 17 10 24 284 0 1 15
15:00 17 23 273 0 3 14 14 24 259 0 3 12 12 24 279 0 2 15 14 24 270 0 3 14
16:00 25 72 267 0 2 11 25 66 249 0 3 9 26 75 267 0 2 13 25 71 261 0 2 11
17:00 30 134 220 0 4 9 45 144 208 0 4 6 55 158 218 0 4 11 43 145 215 0 4 9
18:00 33 109 116 0 5 5 48 120 109 0 2 2 34 104 115 0 5 7 38 111 113 0 4 5
Total 505 510
14 14
539 542
14 14
568 567
17 15
537 540
15 14
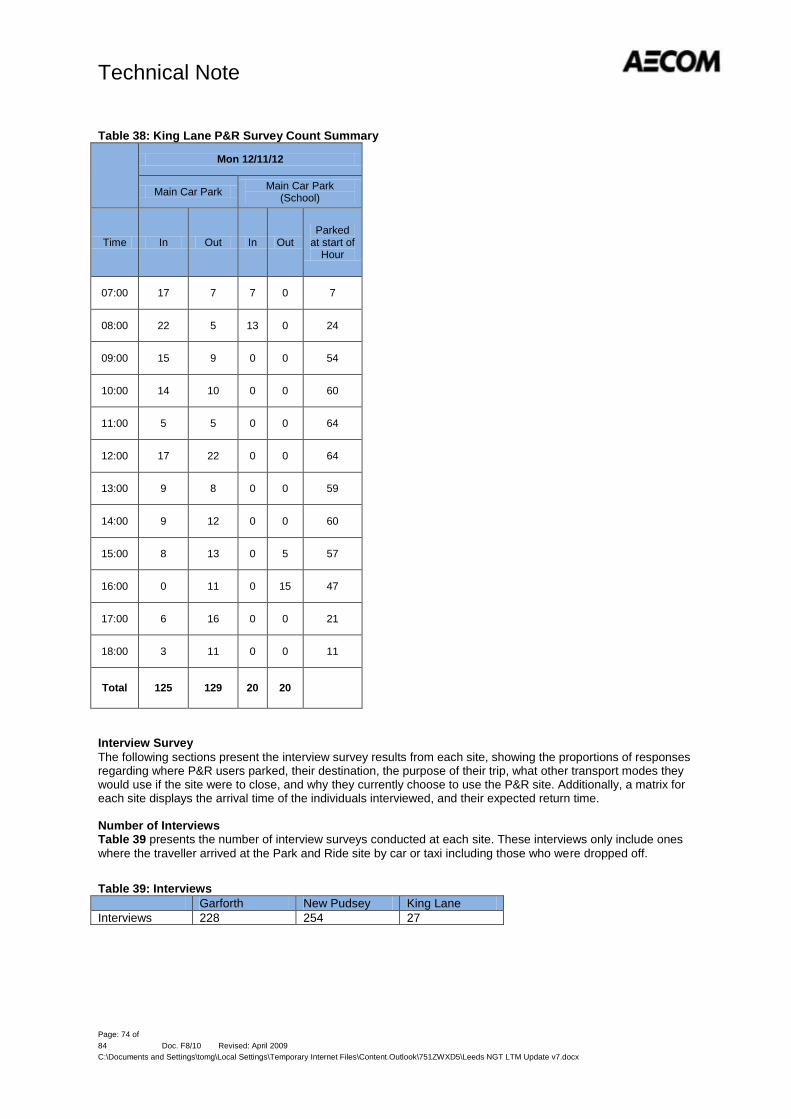
Technical Note
Page: 74 of
84 Doc. F8/10 Revised: April 2009
C:\Documents and Settings\tomg\Local Settings\Temporary Internet Files\Content.Outlook\751ZWXD5\Leeds NGT LTM Update v7.docx
Table 38: King Lane P&R Survey Count Summary
Mon 12/11/12
Main Car Park Main Car Park
(School)
Time In Out In Out Parked
at start of Hour
07:00 17 7 7 0 7
08:00 22 5 13 0 24
09:00 15 9 0 0 54
10:00 14 10 0 0 60
11:00 5 5 0 0 64
12:00 17 22 0 0 64
13:00 9 8 0 0 59
14:00 9 12 0 0 60
15:00 8 13 0 5 57
16:00 0 11 0 15 47
17:00 6 16 0 0 21
18:00 3 11 0 0 11
Total 125 129 20 20
Interview Survey
The following sections present the interview survey results from each site, showing the proportions of responses regarding where P&R users parked, their destination, the purpose of their trip, what other transport modes they would use if the site were to close, and why they currently choose to use the P&R site. Additionally, a matrix for each site displays the arrival time of the individuals interviewed, and their expected return time. Number of Interviews Table 39 presents the number of interview surveys conducted at each site. These interviews only include ones
where the traveller arrived at the Park and Ride site by car or taxi including those who were dropped off.
Table 39: Interviews
Garforth New Pudsey King Lane
Interviews 228 254 27
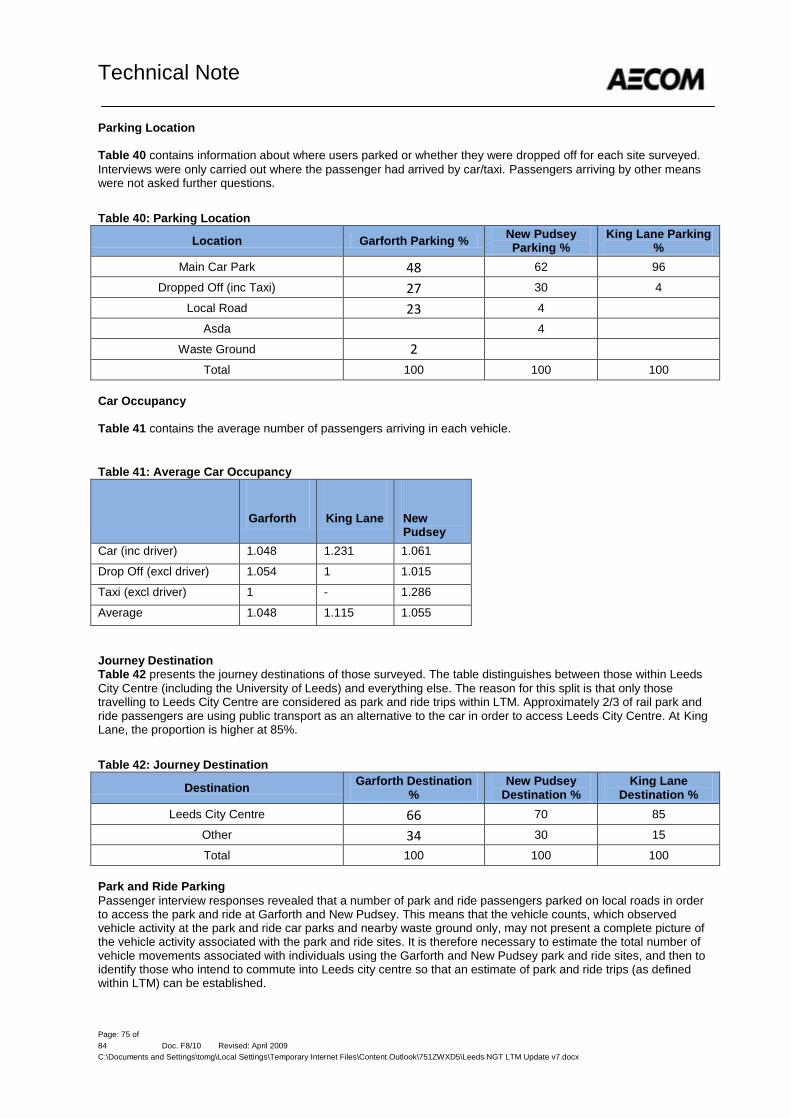
Technical Note
Page: 75 of
84 Doc. F8/10 Revised: April 2009
C:\Documents and Settings\tomg\Local Settings\Temporary Internet Files\Content.Outlook\751ZWXD5\Leeds NGT LTM Update v7.docx
Parking Location
Table 40 contains information about where users parked or whether they were dropped off for each site surveyed.
Interviews were only carried out where the passenger had arrived by car/taxi. Passengers arriving by other means were not asked further questions.
Table 40: Parking Location
Location Garforth Parking % New Pudsey Parking %
King Lane Parking %
Main Car Park 48 62 96
Dropped Off (inc Taxi) 27 30 4
Local Road 23 4
Asda
4
Waste Ground 2
Total 100 100 100
Car Occupancy
Table 41 contains the average number of passengers arriving in each vehicle.
Table 41: Average Car Occupancy
Garforth King Lane New Pudsey
Car (inc driver) 1.048 1.231 1.061
Drop Off (excl driver) 1.054 1 1.015
Taxi (excl driver) 1 - 1.286
Average 1.048 1.115 1.055
Journey Destination Table 42 presents the journey destinations of those surveyed. The table distinguishes between those within Leeds
City Centre (including the University of Leeds) and everything else. The reason for this split is that only those travelling to Leeds City Centre are considered as park and ride trips within LTM. Approximately 2/3 of rail park and ride passengers are using public transport as an alternative to the car in order to access Leeds City Centre. At King Lane, the proportion is higher at 85%.
Table 42: Journey Destination
Destination Garforth Destination
% New Pudsey
Destination % King Lane
Destination %
Leeds City Centre 66 70 85
Other 34 30 15
Total 100 100 100
Park and Ride Parking
Passenger interview responses revealed that a number of park and ride passengers parked on local roads in order to access the park and ride at Garforth and New Pudsey. This means that the vehicle counts, which observed vehicle activity at the park and ride car parks and nearby waste ground only, may not present a complete picture of the vehicle activity associated with the park and ride sites. It is therefore necessary to estimate the total number of vehicle movements associated with individuals using the Garforth and New Pudsey park and ride sites, and then to identify those who intend to commute into Leeds city centre so that an estimate of park and ride trips (as defined within LTM) can be established.
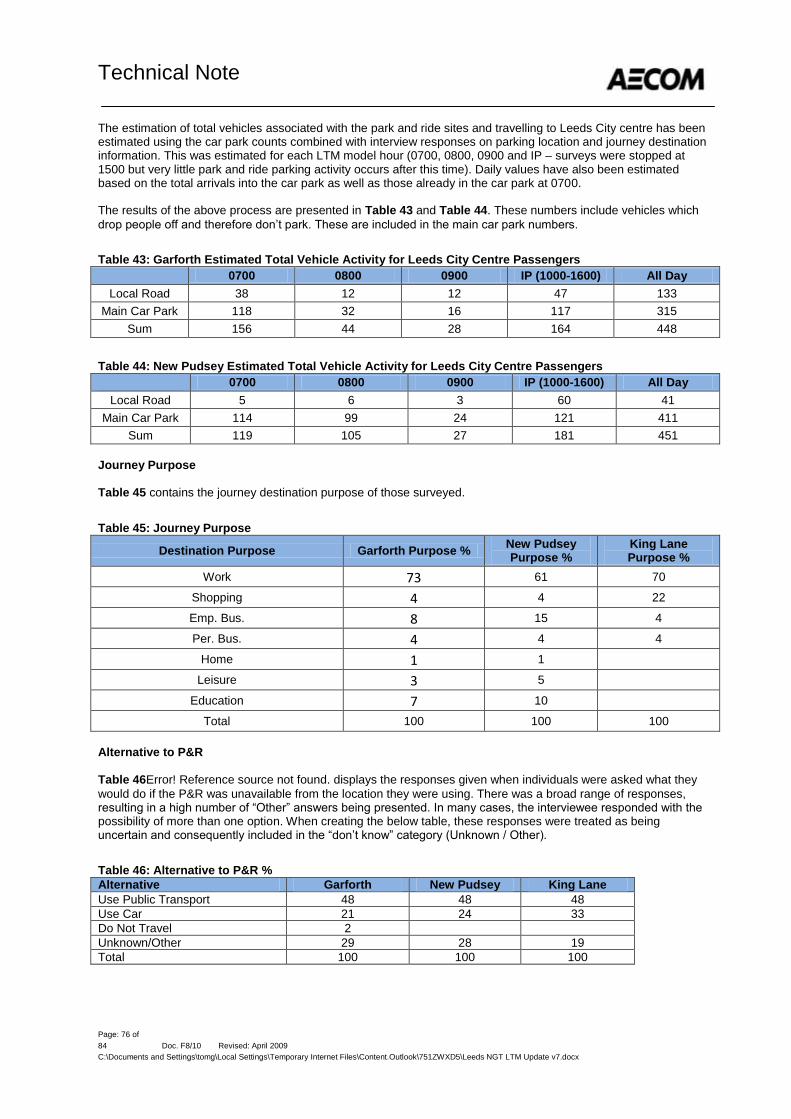
Technical Note
Page: 76 of
84 Doc. F8/10 Revised: April 2009
C:\Documents and Settings\tomg\Local Settings\Temporary Internet Files\Content.Outlook\751ZWXD5\Leeds NGT LTM Update v7.docx
The estimation of total vehicles associated with the park and ride sites and travelling to Leeds City centre has been estimated using the car park counts combined with interview responses on parking location and journey destination information. This was estimated for each LTM model hour (0700, 0800, 0900 and IP – surveys were stopped at 1500 but very little park and ride parking activity occurs after this time). Daily values have also been estimated based on the total arrivals into the car park as well as those already in the car park at 0700. The results of the above process are presented in Table 43 and Table 44. These numbers include vehicles which
drop people off and therefore don’t park. These are included in the main car park numbers.
Table 43: Garforth Estimated Total Vehicle Activity for Leeds City Centre Passengers
0700 0800 0900 IP (1000-1600) All Day
Local Road 38 12 12 47 133
Main Car Park 118 32 16 117 315
Sum 156 44 28 164 448
Table 44: New Pudsey Estimated Total Vehicle Activity for Leeds City Centre Passengers
0700 0800 0900 IP (1000-1600) All Day
Local Road 5 6 3 60 41
Main Car Park 114 99 24 121 411
Sum 119 105 27 181 451
Journey Purpose Table 45 contains the journey destination purpose of those surveyed.
Table 45: Journey Purpose
Destination Purpose Garforth Purpose % New Pudsey Purpose %
King Lane Purpose %
Work 73 61 70
Shopping 4 4 22
Emp. Bus. 8 15 4
Per. Bus. 4 4 4
Home 1 1
Leisure 3 5
Education 7 10
Total 100 100 100
Alternative to P&R Table 46Error! Reference source not found. displays the responses given when individuals were asked what they
would do if the P&R was unavailable from the location they were using. There was a broad range of responses, resulting in a high number of “Other” answers being presented. In many cases, the interviewee responded with the possibility of more than one option. When creating the below table, these responses were treated as being uncertain and consequently included in the “don’t know” category (Unknown / Other).
Table 46: Alternative to P&R %
Alternative Garforth New Pudsey King Lane Use Public Transport 48 48 48
Use Car 21 24 33
Do Not Travel 2
Unknown/Other 29 28 19
Total 100 100 100
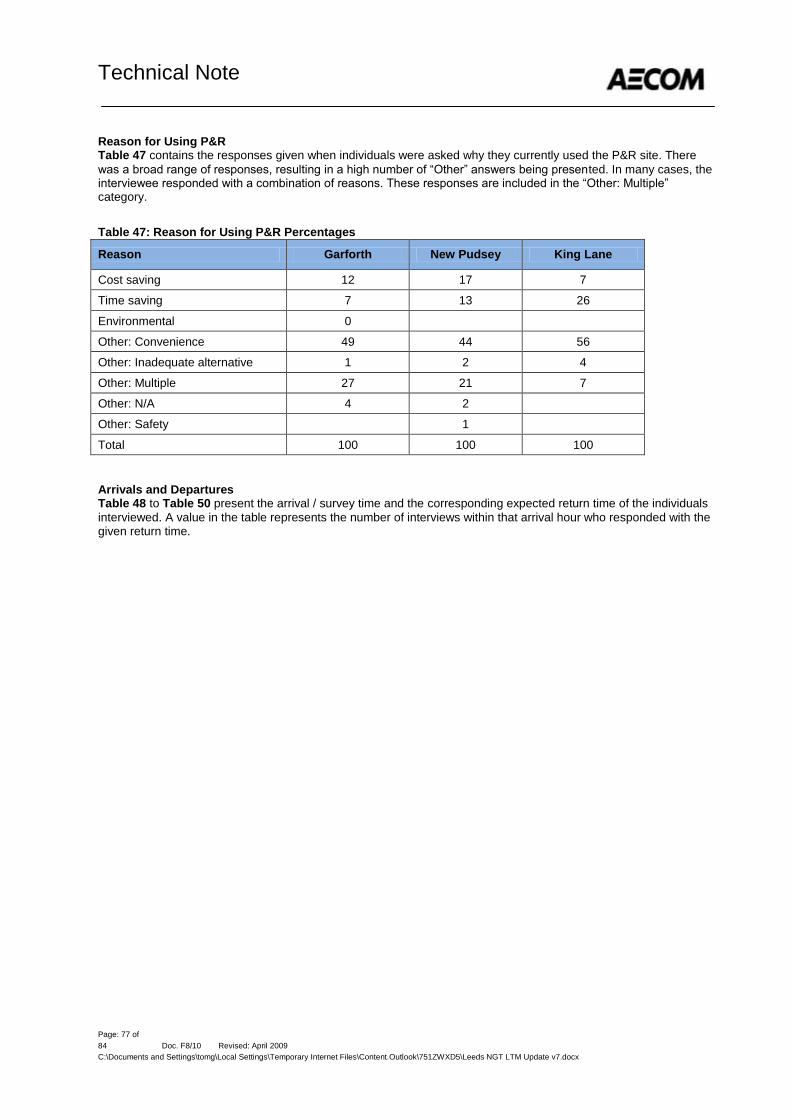
Technical Note
Page: 77 of
84 Doc. F8/10 Revised: April 2009
C:\Documents and Settings\tomg\Local Settings\Temporary Internet Files\Content.Outlook\751ZWXD5\Leeds NGT LTM Update v7.docx
Reason for Using P&R Table 47 contains the responses given when individuals were asked why they currently used the P&R site. There
was a broad range of responses, resulting in a high number of “Other” answers being presented. In many cases, the interviewee responded with a combination of reasons. These responses are included in the “Other: Multiple” category.
Table 47: Reason for Using P&R Percentages
Reason Garforth New Pudsey King Lane
Cost saving 12 17 7
Time saving 7 13 26
Environmental 0
Other: Convenience 49 44 56
Other: Inadequate alternative 1 2 4
Other: Multiple 27 21 7
Other: N/A 4 2
Other: Safety
1
Total 100 100 100
Arrivals and Departures Table 48 to Table 50 present the arrival / survey time and the corresponding expected return time of the individuals
interviewed. A value in the table represents the number of interviews within that arrival hour who responded with the given return time.
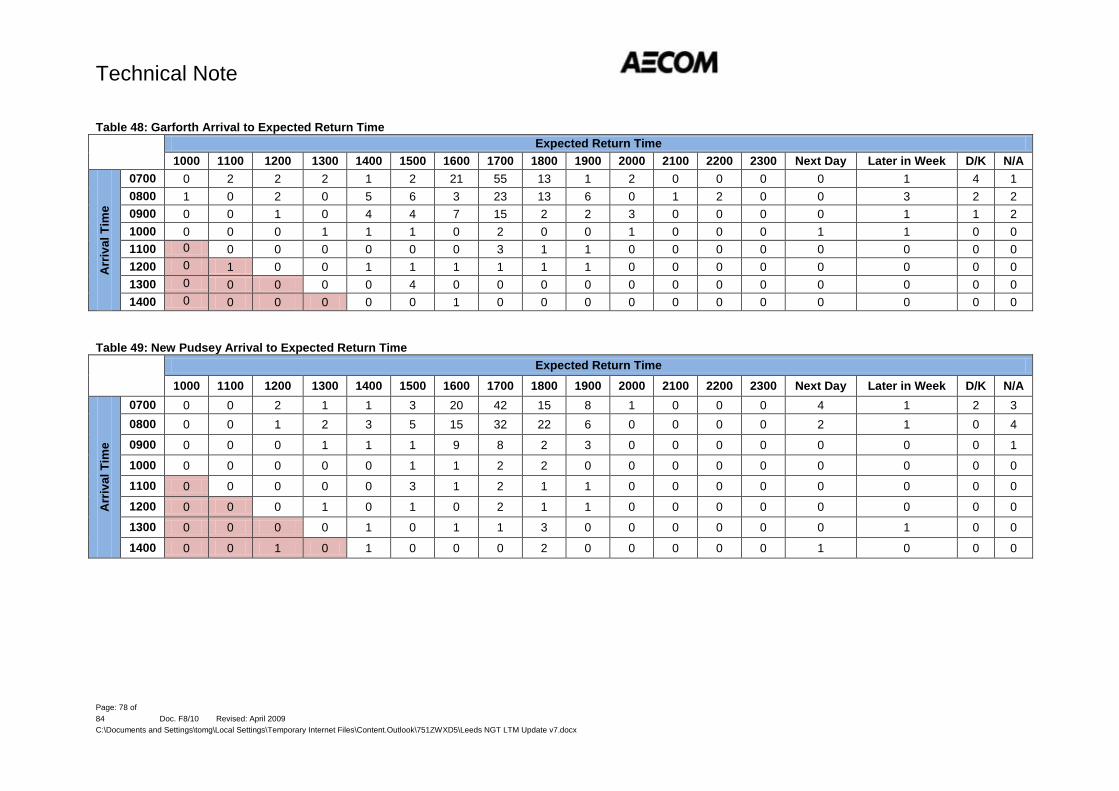
Technical Note
Page: 78 of
84 Doc. F8/10 Revised: April 2009
C:\Documents and Settings\tomg\Local Settings\Temporary Internet Files\Content.Outlook\751ZWXD5\Leeds NGT LTM Update v7.docx
Table 48: Garforth Arrival to Expected Return Time
Expected Return Time
1000 1100 1200 1300 1400 1500 1600 1700 1800 1900 2000 2100 2200 2300 Next Day Later in Week D/K N/A
Arr
iva
l T
ime
0700 0 2 2 2 1 2 21 55 13 1 2 0 0 0 0 1 4 1
0800 1 0 2 0 5 6 3 23 13 6 0 1 2 0 0 3 2 2
0900 0 0 1 0 4 4 7 15 2 2 3 0 0 0 0 1 1 2
1000 0 0 0 1 1 1 0 2 0 0 1 0 0 0 1 1 0 0
1100 0 0 0 0 0 0 0 3 1 1 0 0 0 0 0 0 0 0
1200 0 1 0 0 1 1 1 1 1 1 0 0 0 0 0 0 0 0
1300 0 0 0 0 0 4 0 0 0 0 0 0 0 0 0 0 0 0
1400 0 0 0 0 0 0 1 0 0 0 0 0 0 0 0 0 0 0
Table 49: New Pudsey Arrival to Expected Return Time
Expected Return Time
1000 1100 1200 1300 1400 1500 1600 1700 1800 1900 2000 2100 2200 2300 Next Day Later in Week D/K N/A
Arr
iva
l T
ime
0700 0 0 2 1 1 3 20 42 15 8 1 0 0 0 4 1 2 3
0800 0 0 1 2 3 5 15 32 22 6 0 0 0 0 2 1 0 4
0900 0 0 0 1 1 1 9 8 2 3 0 0 0 0 0 0 0 1
1000 0 0 0 0 0 1 1 2 2 0 0 0 0 0 0 0 0 0
1100 0 0 0 0 0 3 1 2 1 1 0 0 0 0 0 0 0 0
1200 0 0 0 1 0 1 0 2 1 1 0 0 0 0 0 0 0 0
1300 0 0 0 0 1 0 1 1 3 0 0 0 0 0 0 1 0 0
1400 0 0 1 0 1 0 0 0 2 0 0 0 0 0 1 0 0 0
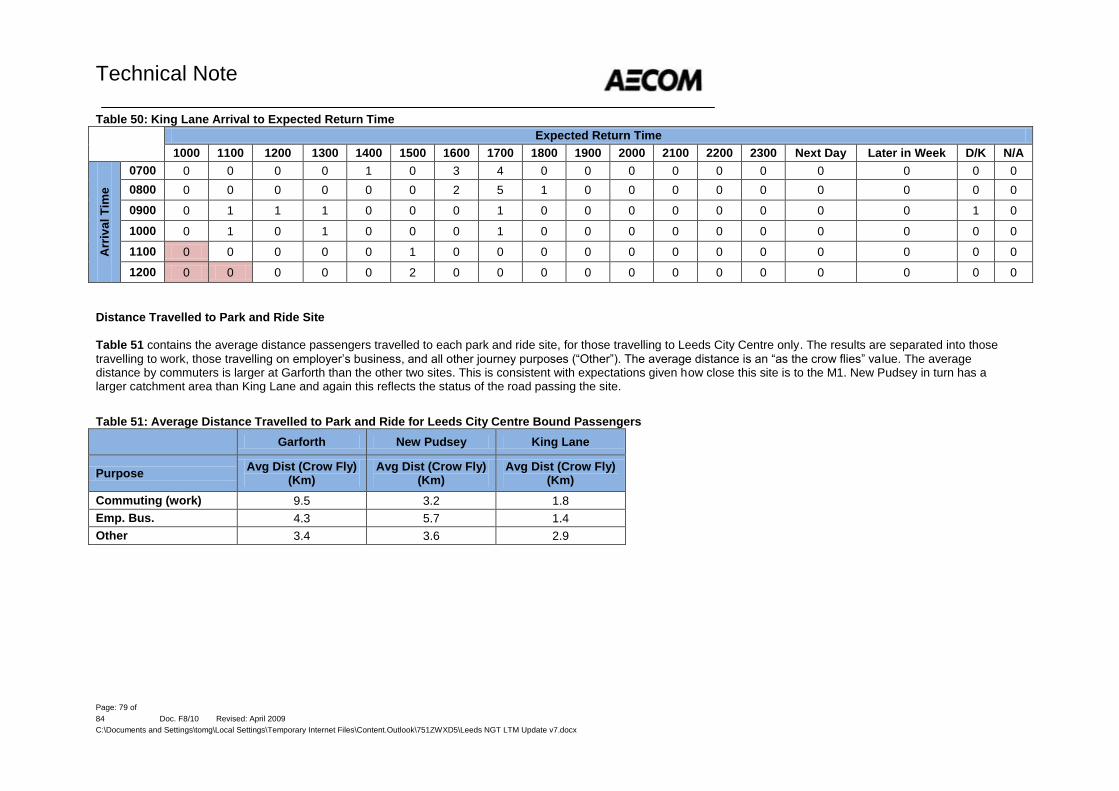
Technical Note
Page: 79 of
84 Doc. F8/10 Revised: April 2009
C:\Documents and Settings\tomg\Local Settings\Temporary Internet Files\Content.Outlook\751ZWXD5\Leeds NGT LTM Update v7.docx
Table 50: King Lane Arrival to Expected Return Time
Expected Return Time
1000 1100 1200 1300 1400 1500 1600 1700 1800 1900 2000 2100 2200 2300 Next Day Later in Week D/K N/A
Arr
iva
l T
ime
0700 0 0 0 0 1 0 3 4 0 0 0 0 0 0 0 0 0 0
0800 0 0 0 0 0 0 2 5 1 0 0 0 0 0 0 0 0 0
0900 0 1 1 1 0 0 0 1 0 0 0 0 0 0 0 0 1 0
1000 0 1 0 1 0 0 0 1 0 0 0 0 0 0 0 0 0 0
1100 0 0 0 0 0 1 0 0 0 0 0 0 0 0 0 0 0 0
1200 0 0 0 0 0 2 0 0 0 0 0 0 0 0 0 0 0 0
Distance Travelled to Park and Ride Site
Table 51 contains the average distance passengers travelled to each park and ride site, for those travelling to Leeds City Centre only. The results are separated into those
travelling to work, those travelling on employer’s business, and all other journey purposes (“Other”). The average distance is an “as the crow flies” va lue. The average distance by commuters is larger at Garforth than the other two sites. This is consistent with expectations given how close this site is to the M1. New Pudsey in turn has a larger catchment area than King Lane and again this reflects the status of the road passing the site.
Table 51: Average Distance Travelled to Park and Ride for Leeds City Centre Bound Passengers
Garforth New Pudsey King Lane
Purpose Avg Dist (Crow Fly)
(Km) Avg Dist (Crow Fly)
(Km) Avg Dist (Crow Fly)
(Km)
Commuting (work) 9.5 3.2 1.8
Emp. Bus. 4.3 5.7 1.4
Other 3.4 3.6 2.9

AECOM Leeds NGT 80
Capabilities on project:
Transportation
Page: 80 of
84 Doc. F8/10 Revised: April 2009
C:\Documents and Settings\tomg\Local Settings\Temporary Internet Files\Content.Outlook\751ZWXD5\Leeds NGT LTM Update v7.docx
Annex
The following table contains the questions which surveyed passengers were asked, with the allowable answers. The surveyors were instructed to ask a total of 11 questions to as many passengers as possible, stood on the Leeds bound platform, between 07:00-15:00 hours on the first day at each location and then between 07:00-10:00 hours on the next two days at each location. At both car parks a minimum of 100 interviews are required over the three days. At King Lane as many interviews as possible will be undertaken. At Garforth and New Pudsey the surveys were taken over three days, while at King Lane, a smaller site, with relatively low demand, the survey was taken within one day.

AECOM Leeds NGT 81
Capabilities on project:
Transportation
Page: 81 of
84 Doc. F8/10 Revised: April 2009
C:\Documents and Settings\tomg\Local Settings\Temporary Internet Files\Content.Outlook\751ZWXD5\Leeds NGT LTM Update v7.docx
Table 52: Questionnaire
Question Allowable Answers Comments
1 Time of Interview Hour bands
2 How did you travel to the P&R today? Car driver
Car passenger / got dropped off
Bus / Train
Taxi
Cycle
Walk
If answer is walk or cycle then terminate interview but keep record of shortened interview.
3 How many people are travelling with you?
Self only
Number of additional people
4 If travelling by car – where did you park? In designated car park
In local roads around car park
5 Where have you come from? Location of origin:
Ideally postcode otherwise address
6 Why were you there? Home
Normal place of work
Employers business
Education
Personal Business / Leisure /
Shopping
Other
7 Where are you going? Location of destination:
Ideally postcode otherwise address
8 What will you be doing there? Home
Normal place of work
Employers business
Education
Personal Business / Leisure /
Shopping
Other
9 When will you be returning? Hour bands up to 1900 then single
band after 1900
Time of train / bus leaving the city centre
10 What would you do if P&R wasn’t available from here?
Bus / train all the way
Use alternative P&R
Drive all the way
Cycle
Travel to other destination
Not travel
Other (Specify)
11 What is the main reason for using Park and Ride?
Cost saving
Time saving
Environmental
Other (Specify)


![INDEX [] LG-1550 LIEBHERR LTM 1500 LIEBHERR LTM-1400 LIEBHERR LTM-1225 LIEBHERR LTM-1220 LIEBHERR ... Cranes_over100tons.pdf](https://img.pdfslide.net/doc/110x75/5b07232e7f8b9ae9628e08fa/index-lg-1550-liebherr-ltm-1500-liebherr-ltm-1400-liebherr-ltm-1225-liebherr.jpg)


![INDEX []cranes over 100 tons index lg-1550 liebherr ltm 1500 liebherr ltm-1400 liebherr ltm-1225 liebherr ltm-1220 liebherr ltm-1130 liebherr ltr-1100 liebherr](https://img.pdfslide.net/doc/110x75/5e6bde846cd1285bdf61f15a/index-cranes-over-100-tons-index-lg-1550-liebherr-ltm-1500-liebherr-ltm-1400.jpg)