Embed Size (px)
DESCRIPTION
Solution book for Lehninger's Biochemstry
Citation preview
S-63
Enzymes
chapter
61. Keeping the Sweet Taste of Corn The sweet taste of freshly picked corn (maize) is due to the
high level of sugar in the kernels. Store-bought corn (several days after picking) is not as sweet,because about 50% of the free sugar is converted to starch within one day of picking. To preserve thesweetness of fresh corn, the husked ears can be immersed in boiling water for a few minutes(“blanched”) then cooled in cold water. Corn processed in this way and stored in a freezer maintainsits sweetness. What is the biochemical basis for this procedure?
Answer After an ear of corn has been removed from the plant, the enzyme-catalyzed conver-sion of sugar to starch continues. Inactivation of these enzymes slows down the conversion toan imperceptible rate. One of the simplest techniques for inactivating enzymes is heat denatura-tion. Freezing the corn lowers any remaining enzyme activity to an insignificant level.
2. Intracellular Concentration of Enzymes To approximate the actual concentration of enzymes in abacterial cell, assume that the cell contains equal concentrations of 1,000 different enzymes in solutionin the cytosol and that each protein has a molecular weight of 100,000. Assume also that the bacterialcell is a cylinder (diameter 1.0 mm, height 2.0 mm), that the cytosol (specific gravity 1.20) is 20% solu-ble protein by weight, and that the soluble protein consists entirely of enzymes. Calculate the average
molar concentration of each enzyme in this hypothetical cell.
Answer There are three different ways to approach this problem.(i) The concentration of total protein in the cytosol is
� 0.24 � 10�5 mol/mL � 2.4 � 10�3M
Thus, for 1 enzyme in 1,000, the enzyme concentration is
� 2.4 � 10�6M
(ii) The average molar concentration �
Volume of bacterial cytosol � pr2h � (3.14)(0.50 mm)2(2.0 mm) � 1.6 mm3
� 1.6 � 10�12 cm3 � 1.6 � 10�12 mL� 1.6 � 10�15 L
Amount (in moles) of each enzyme in cell is
� 3.8 � 10�21 mol
Average molar concentration �
� 2.4 � 10�6 mol/L � 2.4 � 10�6M
3.8 � 10�21 mol��
1.6 � 10�15 L
(0.20)(1.2 g/cm3)(1.6 mm3)(10�12 cm3/mm3)������
(100,000 g/mol)(1000)
moles of each enzyme in cell����
volume of cell in liters
2.4 � 10�3M
��1000
(1.2 g/mL)(0.20)��
100,000 g/mol
2608T_ch06sm_S63-S77 2/1/08 7:34AM Page S-63 ntt 102:WHQY028:Solutions Manual:Ch-06:
S-64 Chapter 6 Enzymes
(iii) Volume of bacterial cytosol � pr2h
� (3.14)(0.50 mm)2(2.0 mm) � 1.6 mm3 � 1.6 � 10�12 mLWeight of cytosol � (specific gravity)(volume)
� (1.2 g/mL)(1.6 � 10�12 mL) � 1.9 � 10�12 gAverage weight of each protein (1 in 1,000, 20% wt/wt protein)
� (1.9 � 10�12 g)(0.20)/(1,000) � 3.8 � 10�16 gAverage molar concentration of each protein
� (average weight)/(Mr)(volume)� (3.8 � 10�16 g)/(105 g/mol)(1.6 � 10�12 mL)(1 L/1000 mL)� 2.4 � 10�6 mol/L � 2.4 � 10�6 M
3. Rate Enhancement by Urease The enzyme urease enhances the rate of urea hydrolysis at pH 8.0and 20 �C by a factor of 1014. If a given quantity of urease can completely hydrolyze a given quantity ofurea in 5.0 min at 20 �C and pH 8.0, how long would it take for this amount of urea to be hydrolyzedunder the same conditions in the absence of urease? Assume that both reactions take place in sterilesystems so that bacteria cannot attack the urea.
AnswerTime to hydrolyze urea
�
� 9.5 � 108 yr
� 950 million years!
4. Protection of an Enzyme against Denaturation by Heat When enzyme solutions are heated,there is a progressive loss of catalytic activity over time due to denaturation of the enzyme. A solutionof the enzyme hexokinase incubated at 45 �C lost 50% of its activity in 12 min, but when incubated at45 �C in the presence of a very large concentration of one of its substrates, it lost only 3% of its activ-ity in 12 min. Suggest why thermal denaturation of hexokinase was retarded in the presence of one ofits substrates.
Answer One possibility is that the ES complex is more stable than the free enzyme. This im-plies that the ground state for the ES complex is at a lower energy level than that for the freeenzyme, thus increasing the height of the energy barrier to be crossed in passing from thenative to the denatured or unfolded state.
An alternative view is that an enzyme denatures in two stages: reversible conversion ofactive native enzyme (N) to an inactive unfolded state (U), followed by irreversible conversionto inactivated enzyme (I):
N 88zy88 U 88n I
If substrate, S, binds only to N, saturation with S to form NS would leave less free N availablefor conversion to U or I, as the N 88zy88 U equilibrium is perturbed toward N. If N but not NS isconverted to U or I, then substrate binding will cause stabilization.
5. Requirements of Active Sites in Enzymes Carboxypeptidase, which sequentially removescarboxyl-terminal amino acid residues from its peptide substrates, is a single polypeptide of 307 aminoacids. The two essential catalytic groups in the active site are furnished by Arg145 and Glu270.(a) If the carboxypeptidase chain were a perfect a helix, how far apart (in Å) would Arg145 and
Glu270 be? (Hint: see Fig. 4–4a.)(b) Explain how the two amino acid residues can catalyze a reaction occurring in the space of a few
angstroms.
(5.0 min)(1014)�����(60 min/hr)(24 hr/day)(365 days/yr)
2608T_ch06sm_S63-S77 2/1/08 7:34AM Page S-64 ntt 102:WHQY028:Solutions Manual:Ch-06:
Answer(a) Arg145 is separated from Glu270 by 270 � 145 � 125 amino acid (AA) residues. From
Figure 4–4a we see that the a helix has 3.6 AA/turn and increases in length along themajor axis by 5.4 Å/turn. Thus, the distance between the two residues is
� 190 Å
(b) Three-dimensional folding of the enzyme brings the two amino acid residues into closeproximity.
6. Quantitative Assay for Lactate Dehydrogenase The muscle enzyme lactate dehydrogenase cat-alyzes the reaction
(125 AA)(5.4 Å/turn)���
3.6 AA/turn
Chapter 6 Enzymes S-65
Pyruvate Lactate
H�� �NADHCH3 C COO�
O
� NAD�CH3 COO�
H
C
OH
NADH and NAD� are the reduced and oxidized forms, respectively, of the coenzyme NAD. Solutions ofNADH, but not NAD�, absorb light at 340 nm. This property is used to determine the concentration ofNADH in solution by measuring spectrophotometrically the amount of light absorbed at 340 nm by thesolution. Explain how these properties of NADH can be used to design a quantitative assay for lactatedehydrogenase.
Answer The reaction rate can be measured by following the decrease in absorption at 340 nm(as NADH is converted to NAD�) as the reaction proceeds. The researcher needs to obtainthree pieces of information to develop a good quantitative assay for lactate dehydrogenase:
(i) Determine Km values (see Box 6–1).
(ii) Measure the initial rate at several known concentrations of enzyme with saturating con-centrations of NADH and pyruvate.
(iii) Plot the initial rates as a function of [E]; the plot should be linear, with a slope that pro-vides a measure of lactate dehydrogenase concentration.
7. Effect of Enzymes on Reactions Which of the following effects would be brought about by any en-zyme catalyzing the simple reaction
Sk188zy88k2
P where K�eq � ?
(a) Decreased K�eq; (b) Increased k1; (c) Increased K�eq; (d) Increased G‡; (e) Decreased G
‡; (f) More negative G��; (g) Increased k2.
Answer (b), (e), (g). Enzymes do not change a reaction’s equilibrium constant and thus cat-alyze the reaction in both directions, making (b) and (g) correct. Enzymes increase the rate ofa reaction by lowering the activation energy, hence (e) is correct.
8. Relation between Reaction Velocity and Substrate Concentration: Michaelis-Menten Equation(a) At what substrate concentration would an enzyme with a kcat of 30.0 s�1 and a Km of 0.0050 M
operate at one-quarter of its maximum rate?(b) Determine the fraction of Vmax that would be obtained at the following substrate concentrations
[S]: �12�Km, 2Km, and 10Km.
[P]�[S]
2608T_ch06sm_S63-S77 2/1/08 7:34AM Page S-65 ntt 102:WHQY028:Solutions Manual:Ch-06:
S-66 Chapter 6 Enzymes
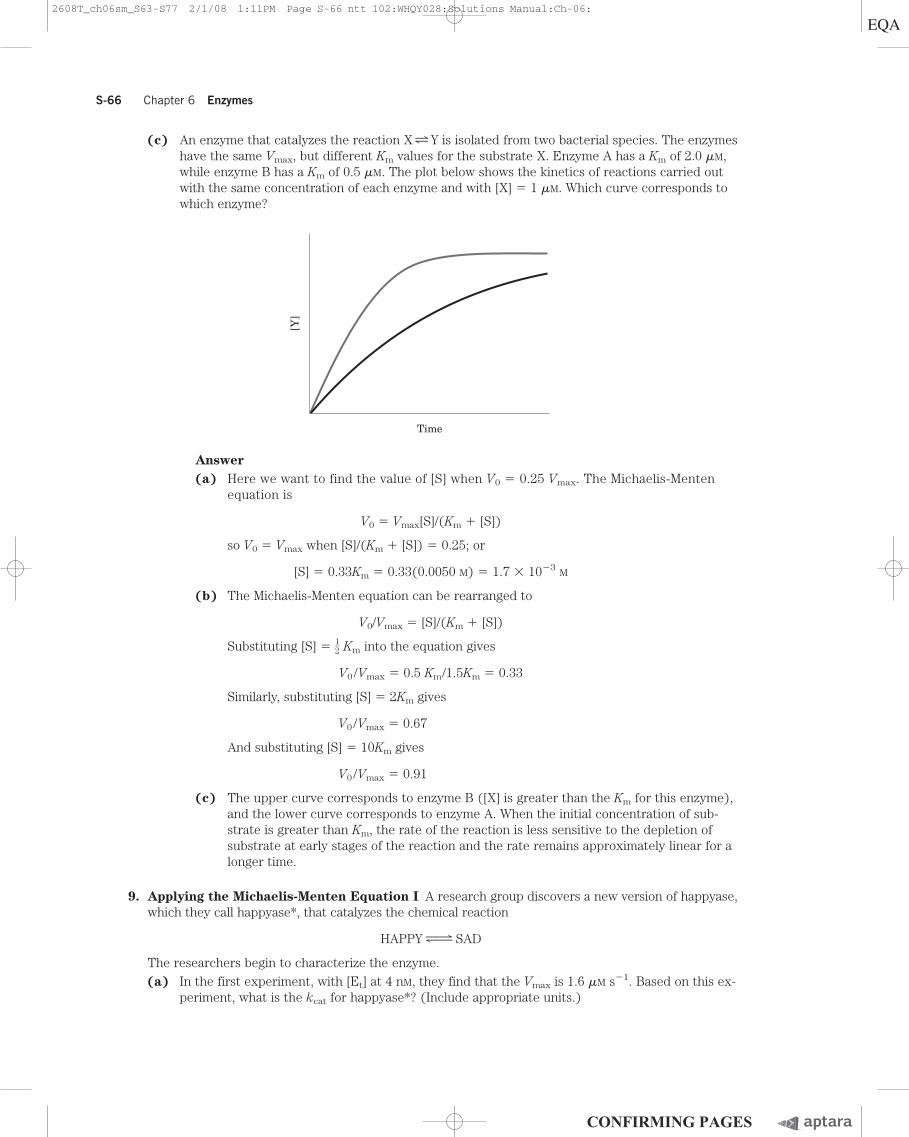
(c) An enzyme that catalyzes the reaction X zy Y is isolated from two bacterial species. The enzymeshave the same Vmax, but different Km values for the substrate X. Enzyme A has a Km of 2.0 �M,while enzyme B has a Km of 0.5 �M. The plot below shows the kinetics of reactions carried outwith the same concentration of each enzyme and with [X] � 1 �M. Which curve corresponds towhich enzyme?
Answer(a) Here we want to find the value of [S] when V0 � 0.25 Vmax. The Michaelis-Menten
equation is
V0 � Vmax[S]/(Km � [S])
so V0 � Vmax when [S]/(Km � [S]) � 0.25; or
[S] � 0.33Km � 0.33(0.0050 M) � 1.7 � 10�3M
(b) The Michaelis-Menten equation can be rearranged to
V0/Vmax � [S]/(Km � [S])
Substituting [S] � �12� Km into the equation gives
V0/Vmax � 0.5 Km/1.5Km � 0.33
Similarly, substituting [S] � 2Km gives
V0/Vmax � 0.67
And substituting [S] � 10Km gives
V0/Vmax � 0.91
(c) The upper curve corresponds to enzyme B ([X] is greater than the Km for this enzyme),and the lower curve corresponds to enzyme A. When the initial concentration of sub-strate is greater than Km, the rate of the reaction is less sensitive to the depletion of substrate at early stages of the reaction and the rate remains approximately linear for alonger time.
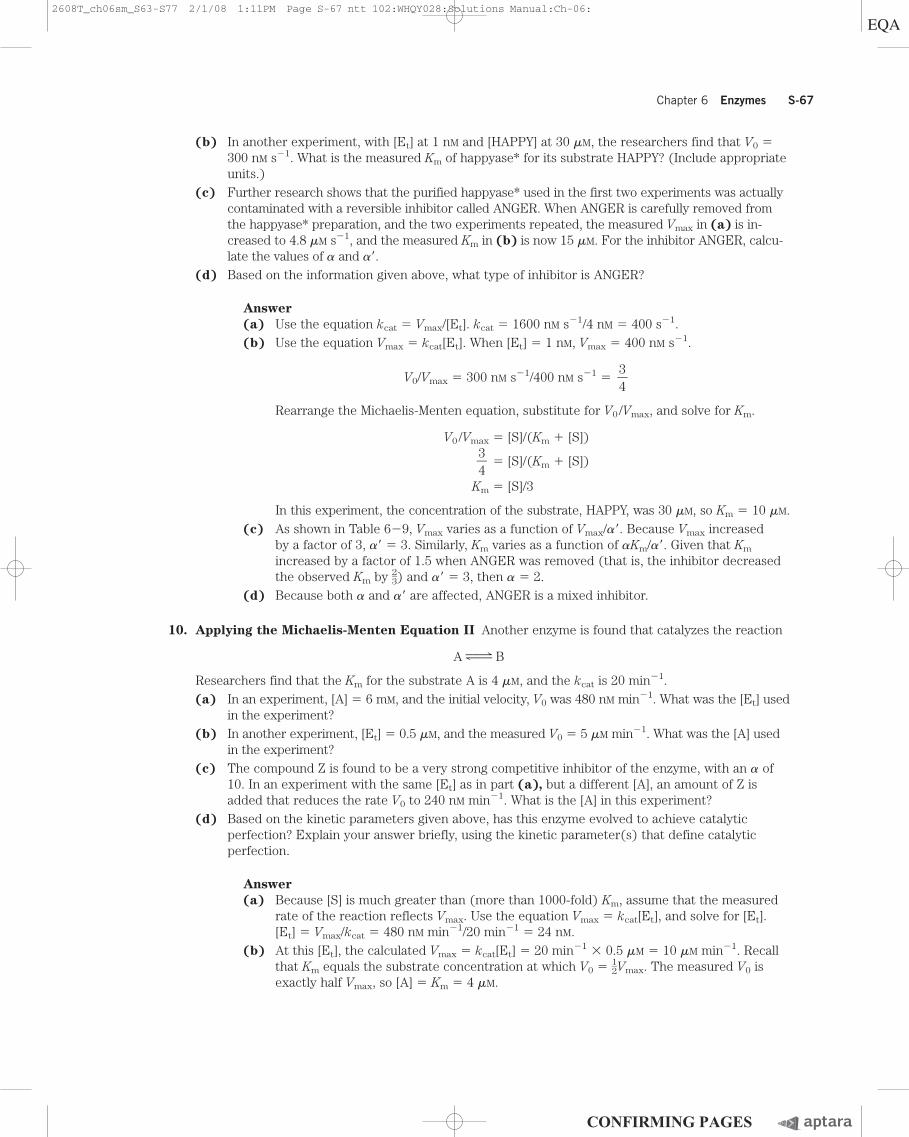
9. Applying the Michaelis-Menten Equation I A research group discovers a new version of happyase,which they call happyase*, that catalyzes the chemical reaction
HAPPY 88zy88 SAD
The researchers begin to characterize the enzyme.(a) In the first experiment, with [Et] at 4 nM, they find that the Vmax is 1.6 �M s�1. Based on this ex-
periment, what is the kcat for happyase*? (Include appropriate units.)
Time
[Y]
2608T_ch06sm_S63-S77 2/1/08 1:11PM Page S-66 ntt 102:WHQY028:Solutions Manual:Ch-06:
(b) In another experiment, with [Et] at 1 nM and [HAPPY] at 30 �M, the researchers find that V0 �300 nM s�1. What is the measured Km of happyase* for its substrate HAPPY? (Include appropriateunits.)
(c) Further research shows that the purified happyase* used in the first two experiments was actuallycontaminated with a reversible inhibitor called ANGER. When ANGER is carefully removed fromthe happyase* preparation, and the two experiments repeated, the measured Vmax in (a) is in-creased to 4.8 �M s�1, and the measured Km in (b) is now 15 �M. For the inhibitor ANGER, calcu-late the values of � and ��.
(d) Based on the information given above, what type of inhibitor is ANGER?
Answer(a) Use the equation kcat � Vmax/[Et]. kcat � 1600 nM s�1/4 nM � 400 s�1.(b) Use the equation Vmax � kcat[Et]. When [Et] � 1 nM, Vmax � 400 nM s�1.
V0/Vmax � 300 nM s�1/400 nM s�1 �
Rearrange the Michaelis-Menten equation, substitute for V0/Vmax, and solve for Km.
V0/Vmax � [S]/(Km � [S])
� [S]/(Km � [S])
Km � [S]/3
In this experiment, the concentration of the substrate, HAPPY, was 30 �M, so Km � 10 �M.(c) As shown in Table 6�9, Vmax varies as a function of Vmax/��. Because Vmax increased
by a factor of 3, �� � 3. Similarly, Km varies as a function of �Km/��. Given that Km
increased by a factor of 1.5 when ANGER was removed (that is, the inhibitor decreasedthe observed Km by �
23�) and �� � 3, then � � 2.
(d) Because both � and �� are affected, ANGER is a mixed inhibitor.
10. Applying the Michaelis-Menten Equation II Another enzyme is found that catalyzes the reaction
A 88zy88 B
Researchers find that the Km for the substrate A is 4 �M, and the kcat is 20 min�1.(a) In an experiment, [A] � 6 mM, and the initial velocity, V0 was 480 nM min�1. What was the [Et] used
in the experiment?(b) In another experiment, [Et] � 0.5 �M, and the measured V0 � 5 �M min�1. What was the [A] used
in the experiment?(c) The compound Z is found to be a very strong competitive inhibitor of the enzyme, with an � of
10. In an experiment with the same [Et] as in part (a), but a different [A], an amount of Z isadded that reduces the rate V0 to 240 nM min�1. What is the [A] in this experiment?
(d) Based on the kinetic parameters given above, has this enzyme evolved to achieve catalyticperfection? Explain your answer briefly, using the kinetic parameter(s) that define catalyticperfection.
Answer(a) Because [S] is much greater than (more than 1000-fold) Km, assume that the measured
rate of the reaction reflects Vmax. Use the equation Vmax � kcat[Et], and solve for [Et].[Et] � Vmax/kcat � 480 nM min�1/20 min�1 � 24 nM.
(b) At this [Et], the calculated Vmax � kcat[Et] � 20 min�1 � 0.5 �M � 10 �M min�1. Recallthat Km equals the substrate concentration at which V0 � �
12�Vmax. The measured V0 is
exactly half Vmax, so [A] � Km � 4 �M.
3�4
3�4
Chapter 6 Enzymes S-67
2608T_ch06sm_S63-S77 2/1/08 1:11PM Page S-67 ntt 102:WHQY028:Solutions Manual:Ch-06:
S-68 Chapter 6 Enzymes
(c) Given the same [Et] as in (a), Vmax � 480 nM min�1. The V0 is again exactly half Vmax
(V0 � 240 nM min�1), so [A] � the apparent or measured Km. In the presence of aninhibitor with � 10, the measured Km � 40 �M � [S].
(d) No. kcat/Km � 0.33/(4 � 10�6M
�1 s�1) � 8.25 � 104M
�1 s�1, well below the diffusion-controlled limit.
11. Estimation of Vmax and Km by Inspection Although graphical methods are available for accuratedetermination of the Vmax and Km of an enzyme-catalyzed reaction (see Box 6–1), sometimes thesequantities can be quickly estimated by inspecting values of V0 at increasing [S]. Estimate the Vmax andKm of the enzyme-catalyzed reaction for which the following data were obtained.
Answer Notice how little the velocity changes as the substrate concentration increases by five-fold from 2 to 10 mM. Thus, we can estimate a Vmax of 140 mM/min. Km is defined as the substrateconcentration that produces a velocity of �
12�Vmax, or 70 mM/min. Inspection of the table indicates
that this V0 occurs at [S] � 1 � 10�5M, thus Km ≈ 1 � 10�5
M.
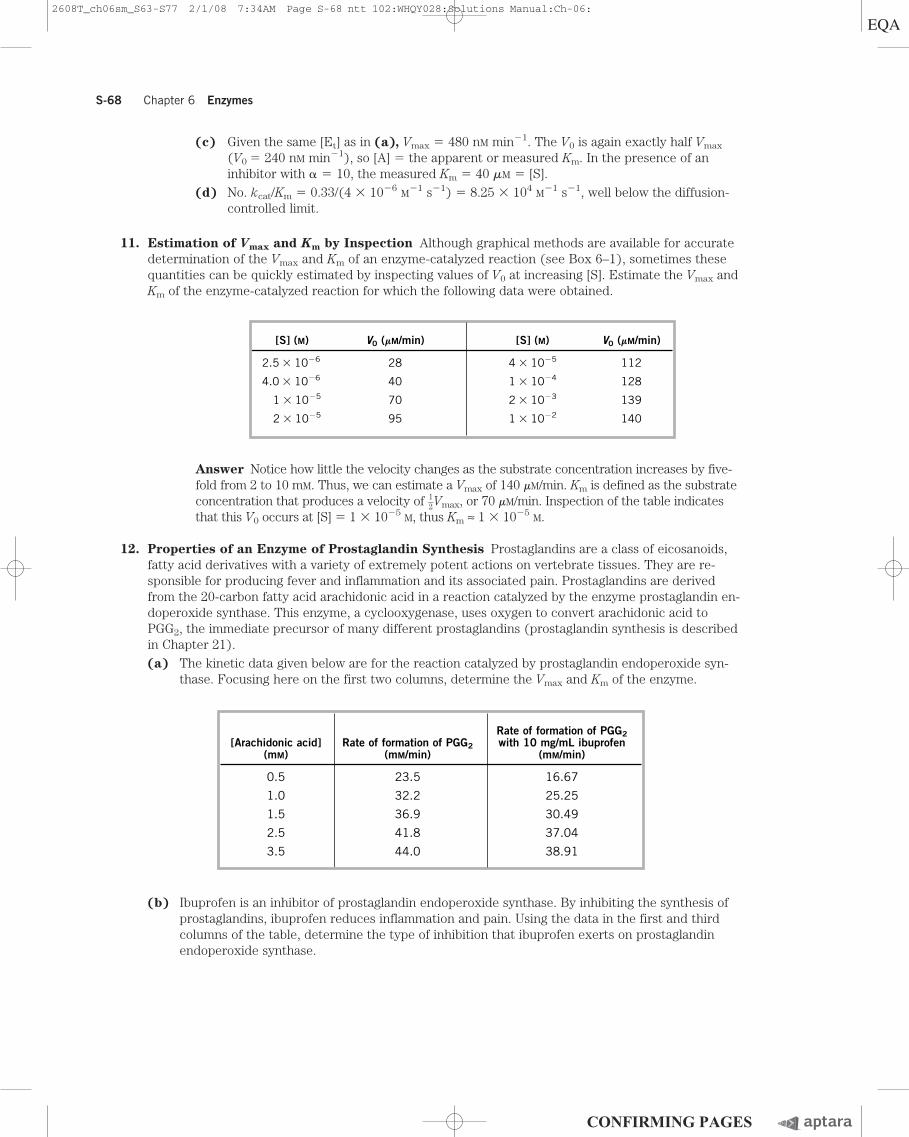
12. Properties of an Enzyme of Prostaglandin Synthesis Prostaglandins are a class of eicosanoids,fatty acid derivatives with a variety of extremely potent actions on vertebrate tissues. They are re-sponsible for producing fever and inflammation and its associated pain. Prostaglandins are derivedfrom the 20-carbon fatty acid arachidonic acid in a reaction catalyzed by the enzyme prostaglandin en-doperoxide synthase. This enzyme, a cyclooxygenase, uses oxygen to convert arachidonic acid toPGG2, the immediate precursor of many different prostaglandins (prostaglandin synthesis is describedin Chapter 21).(a) The kinetic data given below are for the reaction catalyzed by prostaglandin endoperoxide syn-
thase. Focusing here on the first two columns, determine the Vmax and Km of the enzyme.
(b) Ibuprofen is an inhibitor of prostaglandin endoperoxide synthase. By inhibiting the synthesis ofprostaglandins, ibuprofen reduces inflammation and pain. Using the data in the first and thirdcolumns of the table, determine the type of inhibition that ibuprofen exerts on prostaglandinendoperoxide synthase.
[S] (M) V0 (mM/min) [S] (M) V0 (mM/min)
2.5 � 10�6 28 4 � 10�5 112
4.0 � 10�6 40 1 � 10�4 128
1 � 10�5 70 2 � 10�3 139
2 � 10�5 95 1 � 10�2 140
Rate of formation of PGG2[Arachidonic acid] Rate of formation of PGG2 with 10 mg/mL ibuprofen
(mM) (mM/min) (mM/min)
0.5 23.5 16.67
1.0 32.2 25.25
1.5 36.9 30.49
2.5 41.8 37.04
3.5 44.0 38.91
2608T_ch06sm_S63-S77 2/1/08 7:34AM Page S-68 ntt 102:WHQY028:Solutions Manual:Ch-06:
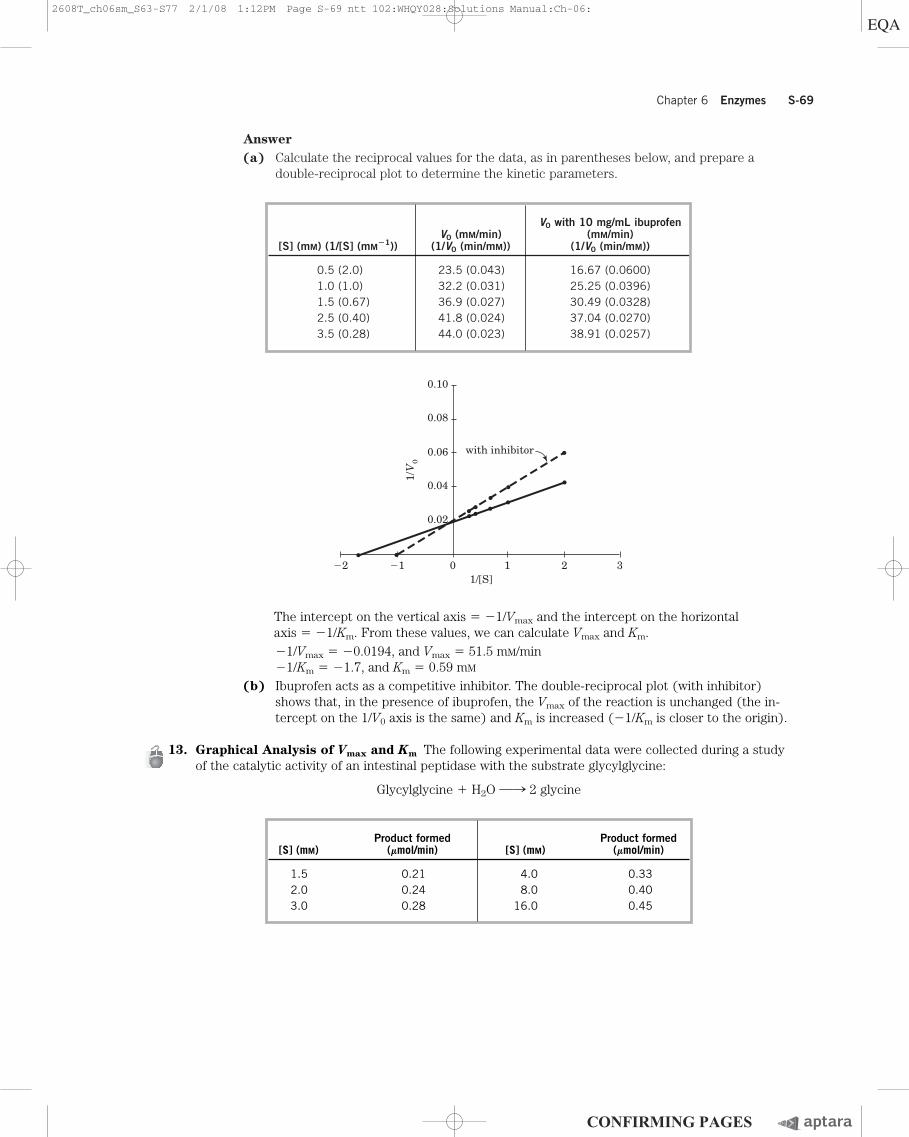
Answer(a) Calculate the reciprocal values for the data, as in parentheses below, and prepare a
double-reciprocal plot to determine the kinetic parameters.
Chapter 6 Enzymes S-69
V0 with 10 mg/mL ibuprofenV0 (mM/min) (mM/min)
[S] (mM) (1/[S] (mM�1)) (1/V0 (min/mM)) (1/V0 (min/mM))
0.5 (2.0) 23.5 (0.043) 16.67 (0.0600)1.0 (1.0) 32.2 (0.031) 25.25 (0.0396)1.5 (0.67) 36.9 (0.027) 30.49 (0.0328)2.5 (0.40) 41.8 (0.024) 37.04 (0.0270)3.5 (0.28) 44.0 (0.023) 38.91 (0.0257)
The intercept on the vertical axis � �1/Vmax and the intercept on the horizontal axis � �1/Km. From these values, we can calculate Vmax and Km.�1/Vmax � �0.0194, and Vmax � 51.5 mM/min�1/Km � �1.7, and Km � 0.59 mM
(b) Ibuprofen acts as a competitive inhibitor. The double-reciprocal plot (with inhibitor)shows that, in the presence of ibuprofen, the Vmax of the reaction is unchanged (the in-tercept on the 1/V0 axis is the same) and Km is increased (�1/Km is closer to the origin).
13. Graphical Analysis of Vmax and Km The following experimental data were collected during a studyof the catalytic activity of an intestinal peptidase with the substrate glycylglycine:
Glycylglycine � H2O 88n 2 glycine
3210�1�2
0.02
0.04
0.06
0.08
0.10
1/V
0
with inhibitor
1/[S]
Product formed Product formed[S] (mM) (mmol/min) [S] (mM) (mmol/min)
1.5 0.21 4.0 0.332.0 0.24 8.0 0.403.0 0.28 16.0 0.45
2608T_ch06sm_S63-S77 2/1/08 1:12PM Page S-69 ntt 102:WHQY028:Solutions Manual:Ch-06:
S-70 Chapter 6 Enzymes
Use graphical analysis (see Box 6–1) to determine the Km and Vmax for this enzyme preparationand substrate.
Answer As described in Box 6–1, the standard method is to use V0 versus [S] data to calcu-late 1/V0 and 1/[S].
Graphing these values gives a Lineweaver-Burk plot. From the best straight line throughthe data, the intercept on the horizontal axis � �1/Km and the intercept on the verticalaxis � 1/Vmax. From these values, we can calculate Km and Vmax:�1/Km � �0.45, and Km � 2.2 mM
�1/Vmax � �2.0, and Vmax � 0.50 mmol/min
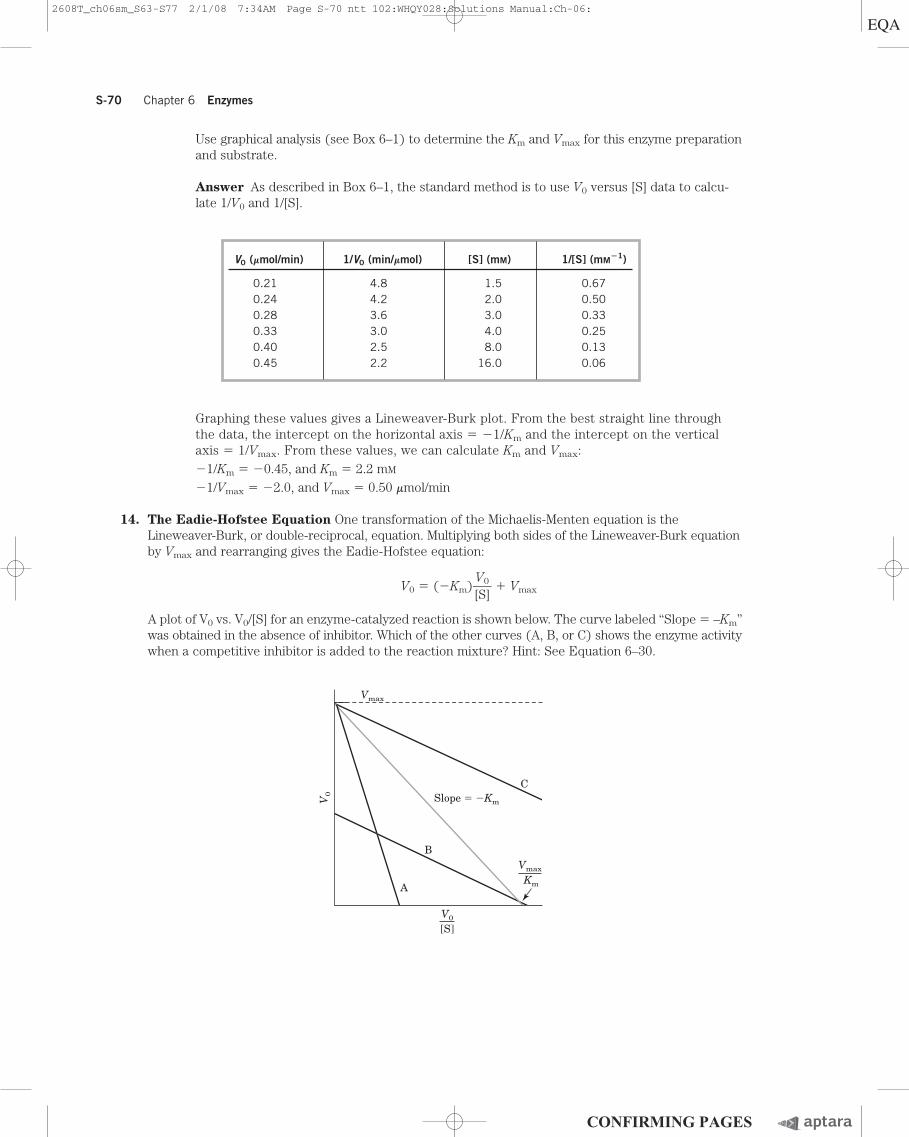
14. The Eadie-Hofstee Equation One transformation of the Michaelis-Menten equation is theLineweaver-Burk, or double-reciprocal, equation. Multiplying both sides of the Lineweaver-Burk equationby Vmax and rearranging gives the Eadie-Hofstee equation:
V0 � (�Km)�[V
S0
]� � Vmax
A plot of V0 vs. V0/[S] for an enzyme-catalyzed reaction is shown below. The curve labeled “Slope � –Km”was obtained in the absence of inhibitor. Which of the other curves (A, B, or C) shows the enzyme activitywhen a competitive inhibitor is added to the reaction mixture? Hint: See Equation 6–30.
V0 (mmol/min) 1/V0 (min/mmol) [S] (mM) 1/[S] (mM�1)
0.21 4.8 1.5 0.670.24 4.2 2.0 0.500.28 3.6 3.0 0.330.33 3.0 4.0 0.250.40 2.5 8.0 0.130.45 2.2 16.0 0.06
A
B
C
Vmax
V0 Slope � �Km
V0
[S]
Vmax
Km
2608T_ch06sm_S63-S77 2/1/08 7:34AM Page S-70 ntt 102:WHQY028:Solutions Manual:Ch-06:
Answer Curve A shows competitive inhibition. Vmax for A is the same as for the normalcurve, as seen by the identical intercepts on the V0 axis. And, for every value of [S] (untilmaximal velocity is reached at saturating substrate levels), V0 is lower for curve A than for thenormal curve, indicating competitive inhibition. Note that as [S] increases, V0/[S] decreases, sothat Vmax—that is, the V0 at the highest (saturating) [S]—is found at the intersection of thecurve at the y axis. Curve C, while also having an identical Vmax, shows higher V0 values forevery [S] (and for every V0/[S]) than the normal curve, which is not indicative of inhibition.The lower Vmax for curve B rules out competitive inhibition.
15. The Turnover Number of Carbonic Anhydrase Carbonic anhydrase of erythrocytes (Mr 30,000)has one of the highest turnover numbers we know of. It catalyzes the reversible hydration of CO2:
H2O � CO288zy88 H2CO3
This is an important process in the transport of CO2 from the tissues to the lungs. If 10.0 mg of purecarbonic anhydrase catalyzes the hydration of 0.30 g of CO2 in 1 min at 37 �C at Vmax, what is theturnover number (kcat) of carbonic anhydrase (in units of min�1)?
Answer The turnover number of an enzyme is the number of substrate molecules trans-formed per unit time by a single enzyme molecule (or a single catalytic site) when the enzymeis saturated with substrate:
kcat � Vmax/Et
where Et � total moles of active sites.We can convert the values given in the problem into a turnover number (min�1) by
converting the weights of enzyme and substrate to molar amounts:
Vmax (moles of CO2/min) � �04.340gg/m/m
oiln
� � 6.8 � 10�3 mol/min
Amount of enzyme (moles) � � 3.3 � 10�10 mol
The turnover number is obtained by dividing moles of CO2/min by moles of enzyme:
kcat � � 2.0 � 107 min�1
16. Deriving a Rate Equation for Competitive Inhibition The rate equation for an enzyme subjectto competitive inhibition is
V0 � �a
V
K
m
m
ax
�
[S[]S]
�
Beginning with a new definition of total enzyme as
[Et] � [E] � [ES] � [EI]
and the definitions of a and KI provided in the text, derive the rate equation above. Use the derivationof the Michaelis-Menten equation as a guide.
Answer The basic assumptions used to derive the Michaelis-Menten equation still hold. Thereaction is at steady state, and the overall rate is determined by
V0 � k2[ES] (a)
With the competitive inhibitor, I, now to be added, the goal again is to describe V0 in terms ofthe measurable quantities [Et], [S], and [I]. In the presence of inhibitor,
6.8 � 10�3 mol/min���
3.3 � 10�10 mol
(10.0 mg)(1 g/106 mg)���
30,000 g/mol
Chapter 6 Enzymes S-71
2608T_ch06sm_S63-S77 2/1/08 7:34AM Page S-71 ntt 102:WHQY028:Solutions Manual:Ch-06:
S-72 Chapter 6 Enzymes
[Et] � [ES] � [E] � [EI] (b)
We first solve for [EI]. As we have seen,
KI � �[E
[E
][
I
I
]
]�; so [EI] �
Substituting for [EI] in (b) gives
[Et] � [ES] � [E] � �[EK
]
I
[I]� (c)
and simplifying gives
[Et] � [ES] � [E]�1 � �K
[I
I
]�� � [ES] � [E]a (d)
where a describes the effect of the competitive inhibitor. [E] in the absence of inhibitor can beobtained from a rearrangement of Equation 6–19 (remembering that [Et] � [ES] � [E]), to give
[E] � �[ES
[S]K]
m� (e)
Substituting (e) into (d) gives
[Et] � [ES] � ��[ES[S
]K]
m��a (f)
and rearranging and solving for [ES] gives
[ES] = �aK
[E
m
t]+[S
[]S]� (g)
Next, substituting (g) into (a), and defining k2[Et] � Vmax, we get the final equation for reac-tion velocity in the presence of a competitive inhibitor:
V0 � �aK
Vm
m
a
�x[S
[]S]
�
17. Irreversible Inhibition of an Enzyme Many enzymes are inhibited irreversibly by heavy metal ionssuch as Hg2�, Cu2�, or Ag�, which can react with essential sulfhydryl groups to form mercaptides:
EnzXSH � Ag� 888n EnzXSXAg � H�
The affinity of Ag� for sulfhydryl groups is so great that Ag� can be used to titrate OSH groupsquantitatively. To 10.0 mL of a solution containing 1.0 mg/mL of a pure enzyme, an investigatoradded just enough AgNO3 to completely inactivate the enzyme. A total of 0.342 mmol of AgNO3 wasrequired. Calculate the minimum molecular weight of the enzyme. Why does the value obtained inthis way give only the minimum molecular weight?
Answer An equivalency exists between millimoles of AgNO3 required for inactivation andmillimoles of OSH group and thus, assuming one OSH group per enzyme molecule, millimolesof enzyme:
0.342 � 10�3 mmol �
Thus, the minimum Mr � � 2.9 � 104 � 29,000
This is the minimum molecular weight because it assumes only one titratable OSH groupper enzyme molecule.
(1.0 mg/mL)(10.0 mL)���
0.342 � 10�3 mmol
(1.0 mg/mL)(10.0 mL)���(minimum Mr)(mg/mmol)
[E][I]�
KI
2608T_ch06sm_S63-S77 2/1/08 7:34AM Page S-72 ntt 102:WHQY028:Solutions Manual:Ch-06:
18. Clinical Application of Differential Enzyme Inhibition Human blood serum contains a class ofenzymes known as acid phosphatases, which hydrolyze biological phosphate esters under slightlyacidic conditions (pH 5.0):
RXOXPO2�3 � H2O 888n RXOH � HOXPO2�
3
Acid phosphatases are produced by erythrocytes, the liver, kidney, spleen, and prostate gland. The en-zyme of the prostate gland is clinically important because its increased activity in the blood can be anindication of prostate cancer. The phosphatase from the prostate gland is strongly inhibited by tartrateion, but acid phosphatases from other tissues are not. How can this information be used to develop aspecific procedure for measuring the activity of the acid phosphatase of the prostate gland in humanblood serum?
Answer First, measure the total acid phosphatase activity in a blood sample in units of mmolof phosphate ester hydrolyzed per mL of serum. Next, remeasure this activity in the presenceof tartrate ion at a concentration sufficient to completely inhibit the enzyme from the prostategland. The difference between the two activities represents the activity of acid phosphatasefrom the prostate gland.
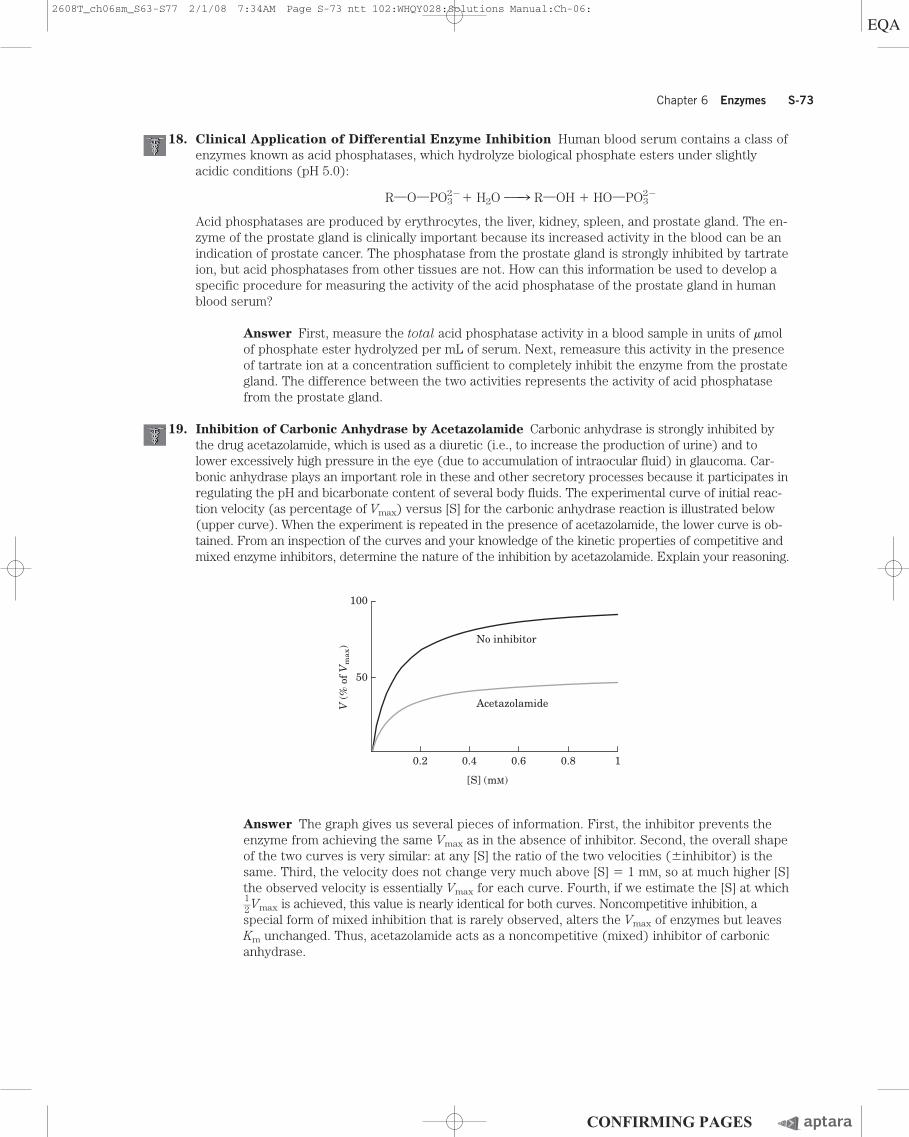
19. Inhibition of Carbonic Anhydrase by Acetazolamide Carbonic anhydrase is strongly inhibited bythe drug acetazolamide, which is used as a diuretic (i.e., to increase the production of urine) and tolower excessively high pressure in the eye (due to accumulation of intraocular fluid) in glaucoma. Car-bonic anhydrase plays an important role in these and other secretory processes because it participates inregulating the pH and bicarbonate content of several body fluids. The experimental curve of initial reac-tion velocity (as percentage of Vmax) versus [S] for the carbonic anhydrase reaction is illustrated below(upper curve). When the experiment is repeated in the presence of acetazolamide, the lower curve is ob-tained. From an inspection of the curves and your knowledge of the kinetic properties of competitive andmixed enzyme inhibitors, determine the nature of the inhibition by acetazolamide. Explain your reasoning.
Answer The graph gives us several pieces of information. First, the inhibitor prevents theenzyme from achieving the same Vmax as in the absence of inhibitor. Second, the overall shapeof the two curves is very similar: at any [S] the ratio of the two velocities (�inhibitor) is thesame. Third, the velocity does not change very much above [S] � 1 mM, so at much higher [S]the observed velocity is essentially Vmax for each curve. Fourth, if we estimate the [S] at which�12�Vmax is achieved, this value is nearly identical for both curves. Noncompetitive inhibition, aspecial form of mixed inhibition that is rarely observed, alters the Vmax of enzymes but leavesKm unchanged. Thus, acetazolamide acts as a noncompetitive (mixed) inhibitor of carbonicanhydrase.
Chapter 6 Enzymes S-73
V (
% o
f V
ma
x) No inhibitor
Acetazolamide
[S] (mM)
0.2
100
50
0.4 0.6 0.8 1
2608T_ch06sm_S63-S77 2/1/08 7:34AM Page S-73 ntt 102:WHQY028:Solutions Manual:Ch-06:
S-74 Chapter 6 Enzymes
20. The Effects of Reversible Inhibitors Derive the expression for the effect of a reversible inhibitoron observed Km (apparent Km � aKm/a�). Start with Equation 6–30 and the statement that apparent Km is equivalent to the [S] at which V0 � Vmax/2a�.
Answer Equation 6–30 is
V0 �
Or V0 � Vmax � [S]/(aKm � a�[S]). Thus, the [S] at which V0 � Vmax/2a� is obtained when all the termson the right side of the equation except Vmax equal 1–2a�:
[S]/(aKm � a�[S]) � 1–2a�
We can now solve this equation for [S]:2a�[S] � aKm � a�[S]2a�[S] � a�[S] � aKm
a�[S] � aKm
[S] � aKm/a�
Thus, observed Km � aKm/a�.
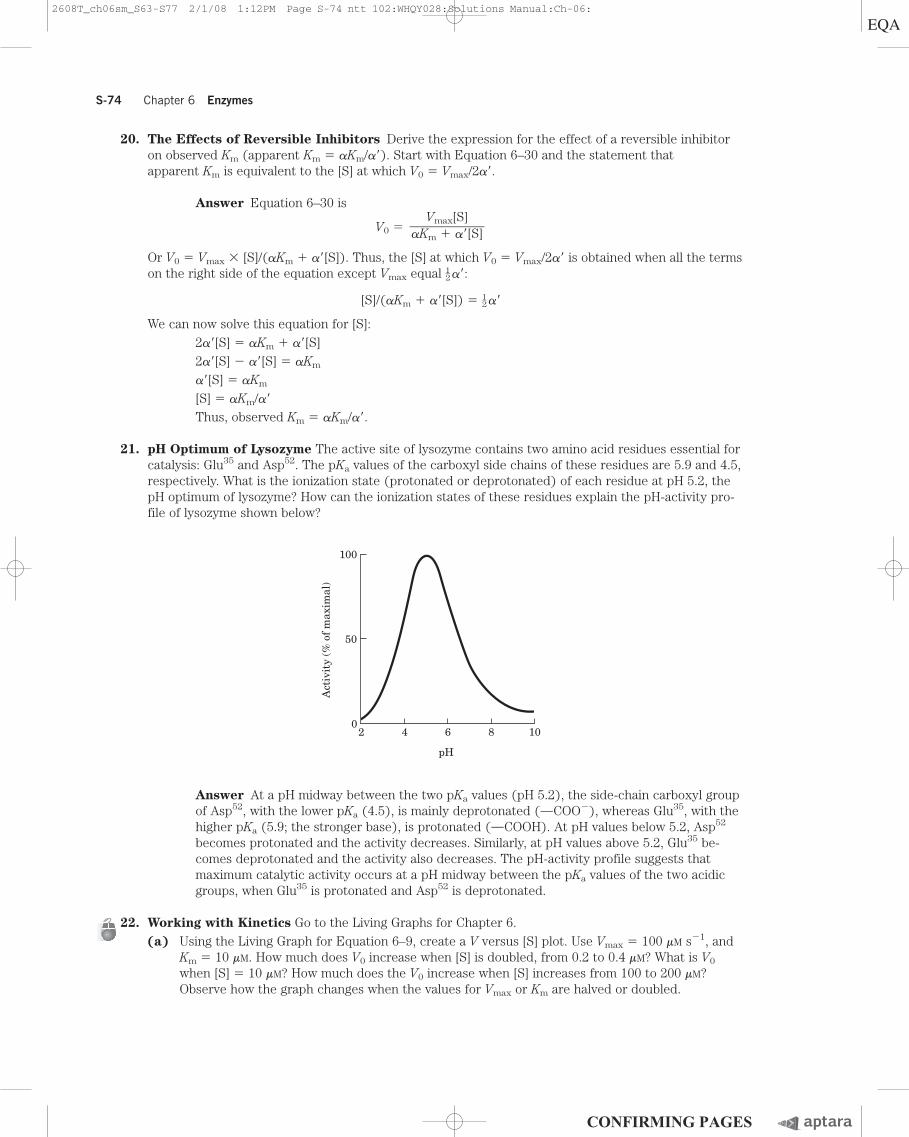
21. pH Optimum of Lysozyme The active site of lysozyme contains two amino acid residues essential forcatalysis: Glu35 and Asp52. The pKa values of the carboxyl side chains of these residues are 5.9 and 4.5,respectively. What is the ionization state (protonated or deprotonated) of each residue at pH 5.2, thepH optimum of lysozyme? How can the ionization states of these residues explain the pH-activity pro-file of lysozyme shown below?
Vmax[S]��aKm � a�[S]
Answer At a pH midway between the two pKa values (pH 5.2), the side-chain carboxyl groupof Asp52, with the lower pKa (4.5), is mainly deprotonated (OCOO�), whereas Glu35, with thehigher pKa (5.9; the stronger base), is protonated (OCOOH). At pH values below 5.2, Asp52
becomes protonated and the activity decreases. Similarly, at pH values above 5.2, Glu35 be-comes deprotonated and the activity also decreases. The pH-activity profile suggests thatmaximum catalytic activity occurs at a pH midway between the pKa values of the two acidicgroups, when Glu35 is protonated and Asp52 is deprotonated.
22. Working with Kinetics Go to the Living Graphs for Chapter 6.(a) Using the Living Graph for Equation 6–9, create a V versus [S] plot. Use Vmax � 100 mM s�1, and
Km � 10 mM. How much does V0 increase when [S] is doubled, from 0.2 to 0.4 mM? What is V0
when [S] � 10 mM? How much does the V0 increase when [S] increases from 100 to 200 mM?Observe how the graph changes when the values for Vmax or Km are halved or doubled.
100
50
02 4 6 8 10
pH
Act
ivit
y (%
of
max
imal
)
2608T_ch06sm_S63-S77 2/1/08 1:12PM Page S-74 ntt 102:WHQY028:Solutions Manual:Ch-06:
(b) Using the Living Graph for Equation 6–30 and the kinetic parameters in (a), create a plot inwhich both a and a� are 1.0. Now observe how the plot changes when a � 2.0; when a� � 3.0;and when a � 2.0 and a� � 3.0.
(c) Using the Living Graphs for Equation 6–30 and the Lineweaver-Burk equation in Box 6–1, createLineweaver-Burk (double-reciprocal) plots for all the cases in (a) and (b). When a � 2.0, doesthe x intercept move to the right or to the left? If a � 2.0 and a� � 3.0, does the x interceptmove to the right or to the left?
Answer(a) When [S] increases from 0.2 to 0.4 mM, V0 increases by a factor of 1.96. When [S] � 10
mM, V0 � 50 mM s�1. When [S] increases from 100 to 200 mM, V0 increases by a factor of1.048.
(b) When a � 2.0, the curve is shifted to the right as the Km is increased by a factor of 2.When a� � 3.0, the asymptote of the curve (the Vmax) declines by a factor of 3. Whena � 2.0 and a� � 3.0, the curve briefly rises above the curve where both a and a� � 1.0,due to a decline in Km. However, the asymptote is lower because Vmax declines by afactor of 3.
(c) When a � 2.0, the x intercept moves to the right. When a � 2.0 and a� � 3.0, the xintercept moves to the left.
Data Analysis Problem
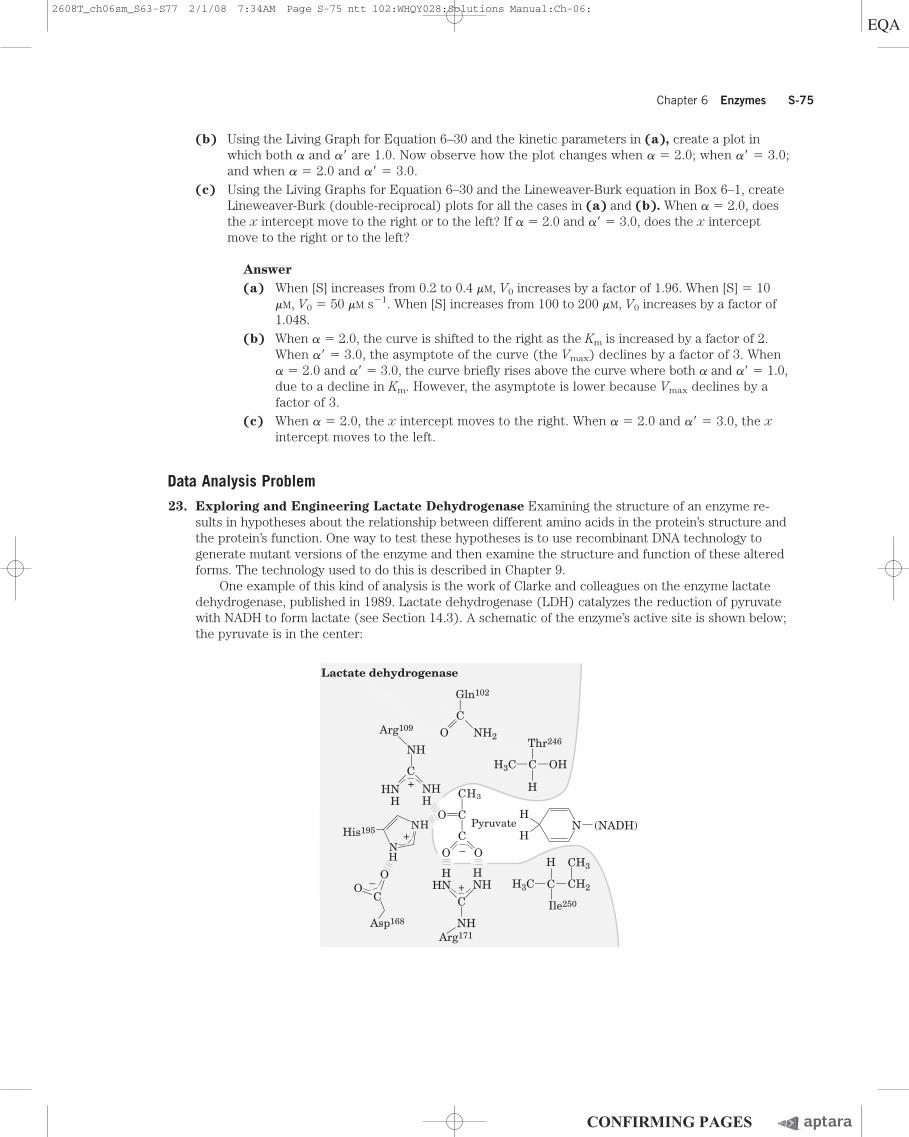
23. Exploring and Engineering Lactate Dehydrogenase Examining the structure of an enzyme re-sults in hypotheses about the relationship between different amino acids in the protein’s structure andthe protein’s function. One way to test these hypotheses is to use recombinant DNA technology togenerate mutant versions of the enzyme and then examine the structure and function of these alteredforms. The technology used to do this is described in Chapter 9.
One example of this kind of analysis is the work of Clarke and colleagues on the enzyme lactatedehydrogenase, published in 1989. Lactate dehydrogenase (LDH) catalyzes the reduction of pyruvatewith NADH to form lactate (see Section 14.3). A schematic of the enzyme’s active site is shown below;the pyruvate is in the center:
Chapter 6 Enzymes S-75
NH2
H3C
OC H
HC
CH3
O(NADH)Pyruvate
O
CO
N
C
H
H3C CH2
CH3
Ile250
Lactate dehydrogenase
Gln102
OH
H
C
Thr246
–
H
C
OO
Asp168
His195 +
–
HN
N
C
NHH
HNH
NH
Arg109
+
C
HNH
NH
HHN
Arg171
+
2608T_ch06sm_S63-S77 2/1/08 7:34AM Page S-75 ntt 102:WHQY028:Solutions Manual:Ch-06:
S-76 Chapter 6 Enzymes
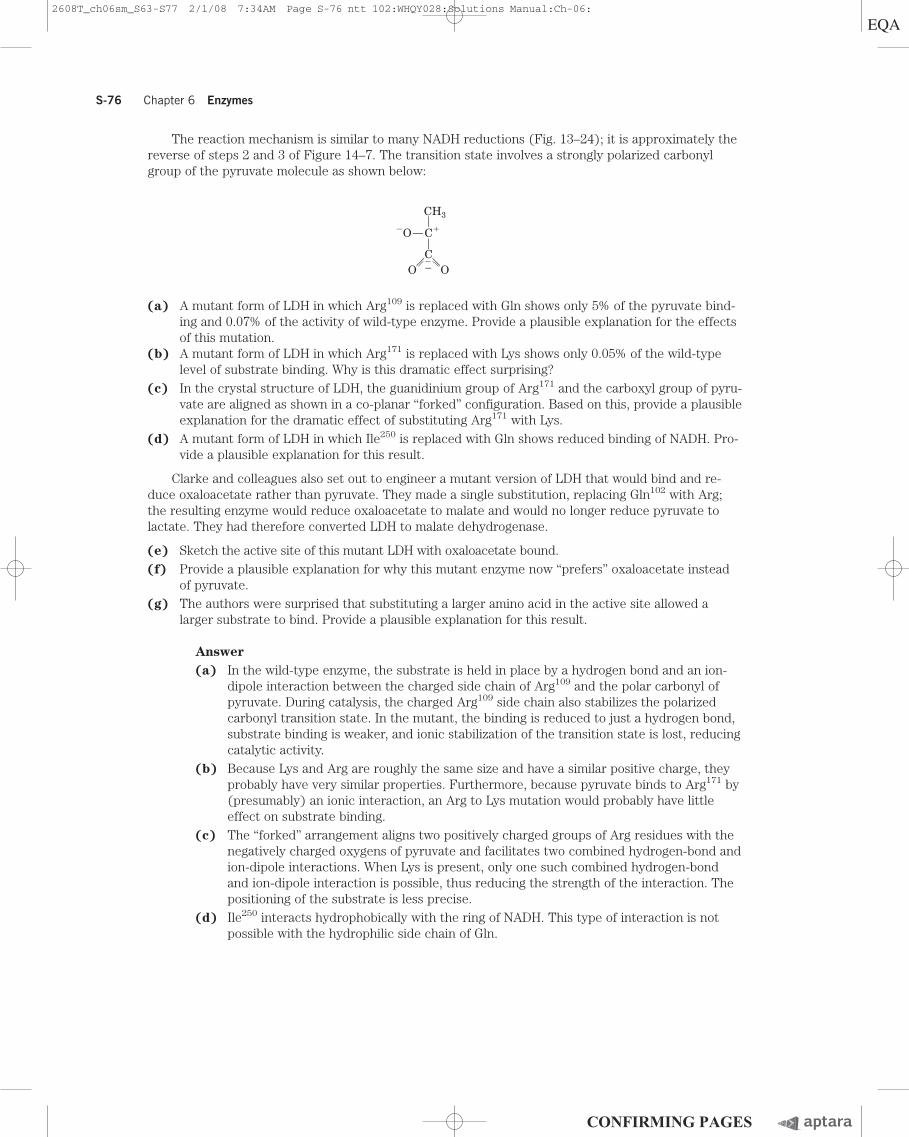
The reaction mechanism is similar to many NADH reductions (Fig. 13–24); it is approximately thereverse of steps 2 and 3 of Figure 14–7. The transition state involves a strongly polarized carbonylgroup of the pyruvate molecule as shown below:
(a) A mutant form of LDH in which Arg109 is replaced with Gln shows only 5% of the pyruvate bind-ing and 0.07% of the activity of wild-type enzyme. Provide a plausible explanation for the effectsof this mutation.
(b) A mutant form of LDH in which Arg171 is replaced with Lys shows only 0.05% of the wild-typelevel of substrate binding. Why is this dramatic effect surprising?
(c) In the crystal structure of LDH, the guanidinium group of Arg171 and the carboxyl group of pyru-vate are aligned as shown in a co-planar “forked” configuration. Based on this, provide a plausibleexplanation for the dramatic effect of substituting Arg171 with Lys.
(d) A mutant form of LDH in which Ile250 is replaced with Gln shows reduced binding of NADH. Pro-vide a plausible explanation for this result.
Clarke and colleagues also set out to engineer a mutant version of LDH that would bind and re-duce oxaloacetate rather than pyruvate. They made a single substitution, replacing Gln102 with Arg;the resulting enzyme would reduce oxaloacetate to malate and would no longer reduce pyruvate tolactate. They had therefore converted LDH to malate dehydrogenase.
(e) Sketch the active site of this mutant LDH with oxaloacetate bound.(f) Provide a plausible explanation for why this mutant enzyme now “prefers” oxaloacetate instead
of pyruvate.(g) The authors were surprised that substituting a larger amino acid in the active site allowed a
larger substrate to bind. Provide a plausible explanation for this result.
Answer(a) In the wild-type enzyme, the substrate is held in place by a hydrogen bond and an ion-
dipole interaction between the charged side chain of Arg109 and the polar carbonyl ofpyruvate. During catalysis, the charged Arg109 side chain also stabilizes the polarizedcarbonyl transition state. In the mutant, the binding is reduced to just a hydrogen bond,substrate binding is weaker, and ionic stabilization of the transition state is lost, reducingcatalytic activity.
(b) Because Lys and Arg are roughly the same size and have a similar positive charge, theyprobably have very similar properties. Furthermore, because pyruvate binds to Arg171 by(presumably) an ionic interaction, an Arg to Lys mutation would probably have littleeffect on substrate binding.
(c) The “forked” arrangement aligns two positively charged groups of Arg residues with thenegatively charged oxygens of pyruvate and facilitates two combined hydrogen-bond andion-dipole interactions. When Lys is present, only one such combined hydrogen-bondand ion-dipole interaction is possible, thus reducing the strength of the interaction. Thepositioning of the substrate is less precise.
(d) Ile250 interacts hydrophobically with the ring of NADH. This type of interaction is notpossible with the hydrophilic side chain of Gln.
�OOC�ACH3
AC
OGG
O–
2608T_ch06sm_S63-S77 2/1/08 7:34AM Page S-76 ntt 102:WHQY028:Solutions Manual:Ch-06:
Chapter 6 Enzymes S-77
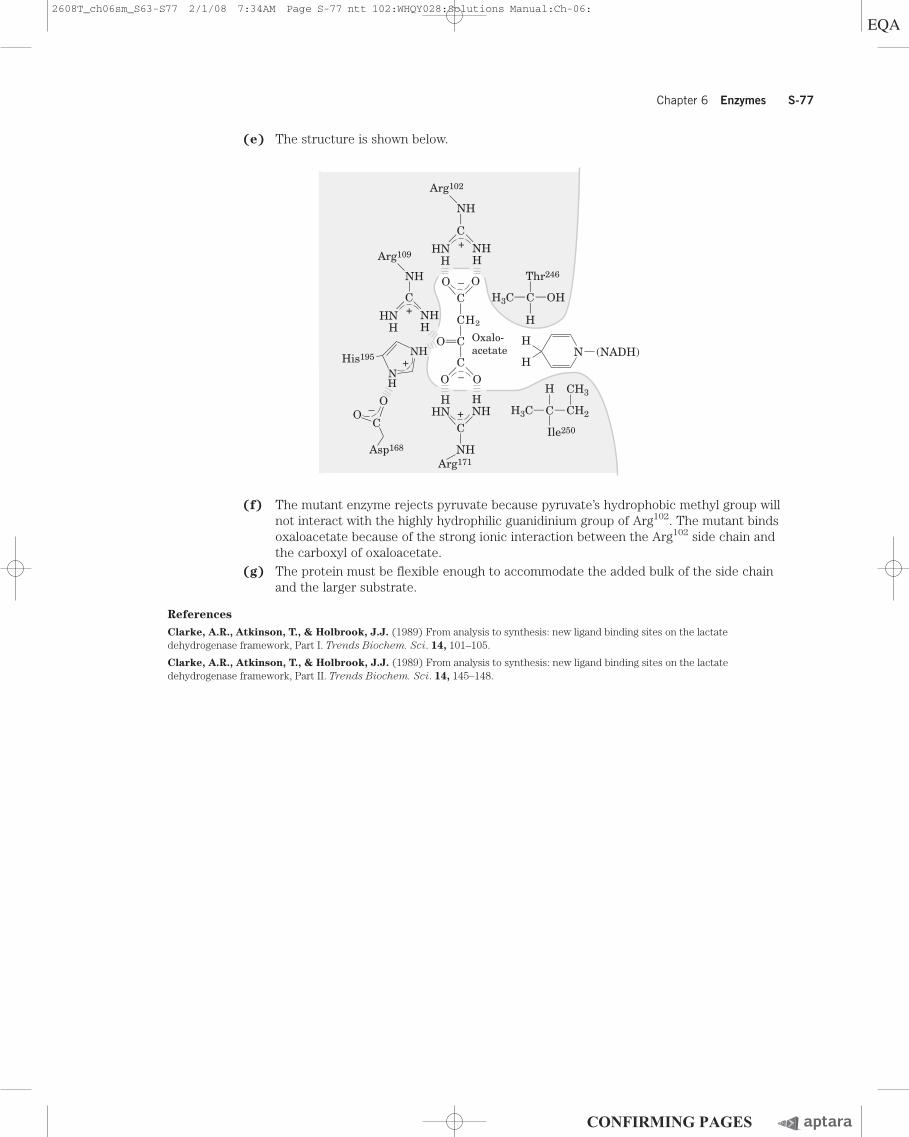
(e) The structure is shown below.
(f) The mutant enzyme rejects pyruvate because pyruvate’s hydrophobic methyl group willnot interact with the highly hydrophilic guanidinium group of Arg102. The mutant bindsoxaloacetate because of the strong ionic interaction between the Arg102 side chain andthe carboxyl of oxaloacetate.
(g) The protein must be flexible enough to accommodate the added bulk of the side chainand the larger substrate.
ReferencesClarke, A.R., Atkinson, T., & Holbrook, J.J. (1989) From analysis to synthesis: new ligand binding sites on the lactatedehydrogenase framework, Part I. Trends Biochem. Sci. 14, 101–105.
Clarke, A.R., Atkinson, T., & Holbrook, J.J. (1989) From analysis to synthesis: new ligand binding sites on the lactatedehydrogenase framework, Part II. Trends Biochem. Sci. 14, 145–148.
C
C
OO
Asp168
His195
C
HNH
NH
HHN
NHH
HNH
NHH
HNH
H3C
Arg171
O
C H
HC
CH2
O(NADH)
Oxalo-acetate
O
C
C
NH
N
C
H
H3C CH2
CH3
Ile250
NH
Arg109
Arg102
OH
H
C
Thr246
+
+
–
–
–
H
HN
N
+
+
OO
2608T_ch06sm_S63-S77 2/1/08 7:34AM Page S-77 ntt 102:WHQY028:Solutions Manual:Ch-06: