Embed Size (px)
Citation preview
Research ArticleLeopard Panthera pardus fusca Density in the Seasonally Dry,Subtropical Forest in the Bhabhar of Terai Arc, Nepal
Kanchan Thapa,1 Rinjan Shrestha,2 Jhamak Karki,3
Gokarna Jung Thapa,4 Naresh Subedi,5 Narendra Man Babu Pradhan,4
Maheshwar Dhakal,6 Pradeep Khanal,4 and Marcella J. Kelly1
! Department of Fish and Wildlife Conservation, Virginia Tech, Blacksburg, Virginia, VA "#$%!, USA"Eastern Himalayas Program (WWF-US), C/O WWF-Canada, "#& Eglinton Avenue E, Toronto, ON, Canada M#P 'J!'Nepal Engineering College-Center for Post Graduate Studies, Kathmandu ##%$$, Nepal#WWF Nepal, Kathmandu ##%$$, Nepal&National Trust for Nature Conservation, Lalitpur ##($$, Nepal%Department of National Park and Wildlife Conservation, Kathmandu ##%$$, Nepal
Correspondence should be addressed to Kanchan!apa; kanchan"@vt.edu
Received "# April $%"#; Revised & June $%"#; Accepted "$ June $%"#; Published "' July $%"#
Academic Editor: Tomasz S. Osiejuk
Copyright © $%"# Kanchan!apa et al.!is is an open access article distributed under the Creative Commons Attribution License,which permits unrestricted use, distribution, and reproduction in any medium, provided the original work is properly cited.
We estimated leopard (Panthera pardus fusca) abundance and density in the Bhabhar physiographic region in Parsa WildlifeReserve, Nepal. !e camera trap grid, covering sampling area of $(& km2 with (( locations, accumulated ",)#$ trap nights in '#days in the winter season of $%%(-$%%& and photographed "& individual leopards. Using models incorporating heterogeneity, weestimated $( (±SE '.%*) and $&.+( (±SE "%.##) leopards in Programs CAPTURE and MARK. Density estimates via "/$ MMDMmethods were +.'" (±SE ".)%) and +.&) (±SE $."+) leopards per "%% km2 using abundance estimates from CAPTURE and MARK,respectively. Spatially explicit capture recapture (SECR) models resulted in lower density estimates, ).*( (±SE %.(+) and ).#( (±SE%.()) leopards per "%% km2, in likelihood based program DENSITY and Bayesian based program SPACECAP, respectively.!e "/$MMDM methods have been known to provide much higher density estimates than SECR modelling techniques. However, ourSECRmodels resulted in high leopard density comparable to areas considered better habitat in Nepal indicating a potentially densepopulation compared to other sites. We provide the ,rst density estimates for leopards in the Bhabhar and a baseline for long termpopulation monitoring of leopards in Parsa Wildlife Reserve and across the Terai Arc.
1. Introduction
!e leopard (Panthera pardus fuscaMeyer, "*&#) is one of themost widely distributed felids across the forested landscapesof the Indian subcontinent [", $]. Being a habitat generalist[)], the leopard has a wider fundamental niche than its largercongener, the tiger (Panthera tigris tigris Linnaeus), in termsof the habitat and area it occupies [#], extending from alluvial-oodplains, subtropical deciduous moist and dry habitat inlowlands and Siwaliks, temperate deciduous forest habitat inmid hills and high mountains, to dry alpine forest in theHimalayas [+]. Leopards occur sympatrically with tigers inNepal, India, and Bhutan ['–(].
!e tiger, being an apex predator, appeals to the publicand serves as a -agship species [&]. Perceived asmore tolerantof anthropogenic in-uences, the leopard on the other handhas received less attention from conservationists despiteits important functional role within ecosystems, includingits potential to cause trophic cascades ["%], its impact onmesopredators ["", "$], and its competitive role within itsguild ["), "#]. In the human dominated landscape of today’sIndian subcontinent, habitat destruction and fragmentationremainmajor threats to leopards [#] and leopard numbers aredeclining due to both direct mortality and decreases in preypopulations ["+].
Hindawi Publishing Corporation
Advances in Ecology
Volume 2014, Article ID 286949, 12 pages
http://dx.doi.org/10.1155/2014/286949
$ Advances in Ecology
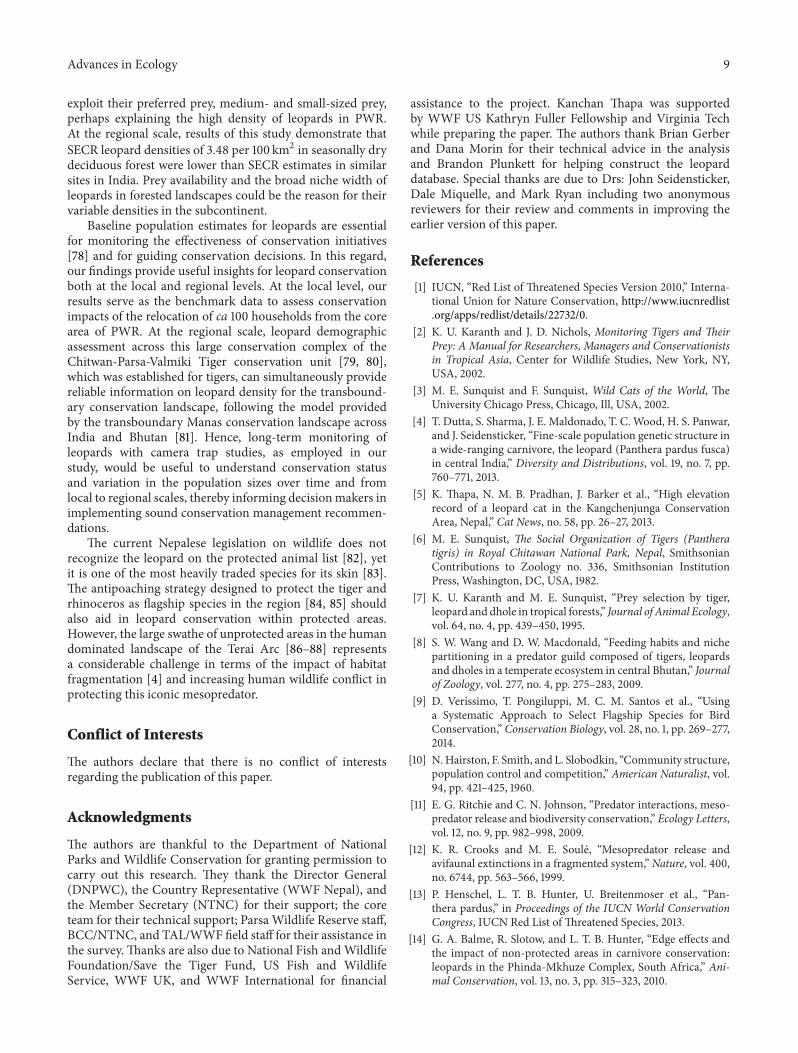
84∘35"0""E "84∘40"0 "E "84∘45"0 "E "84∘50"0 "E 84∘55"0""E 85∘0"0""E
84∘35"0""E "84∘40"0 "E "84∘45"0 "E "84∘50"0 "E 84∘55"0""E 85∘0"0""E
27∘30"0""N
27∘25"0""N
27∘20"0""N
27∘15"0""N
27∘30"0""N
27∘25"0""N
27∘20"0""N
27∘15"0""N
N
India
Nepal
China
International boundaryRiverCamera stationSettlementProtected areasBu!er zoneMCP outline
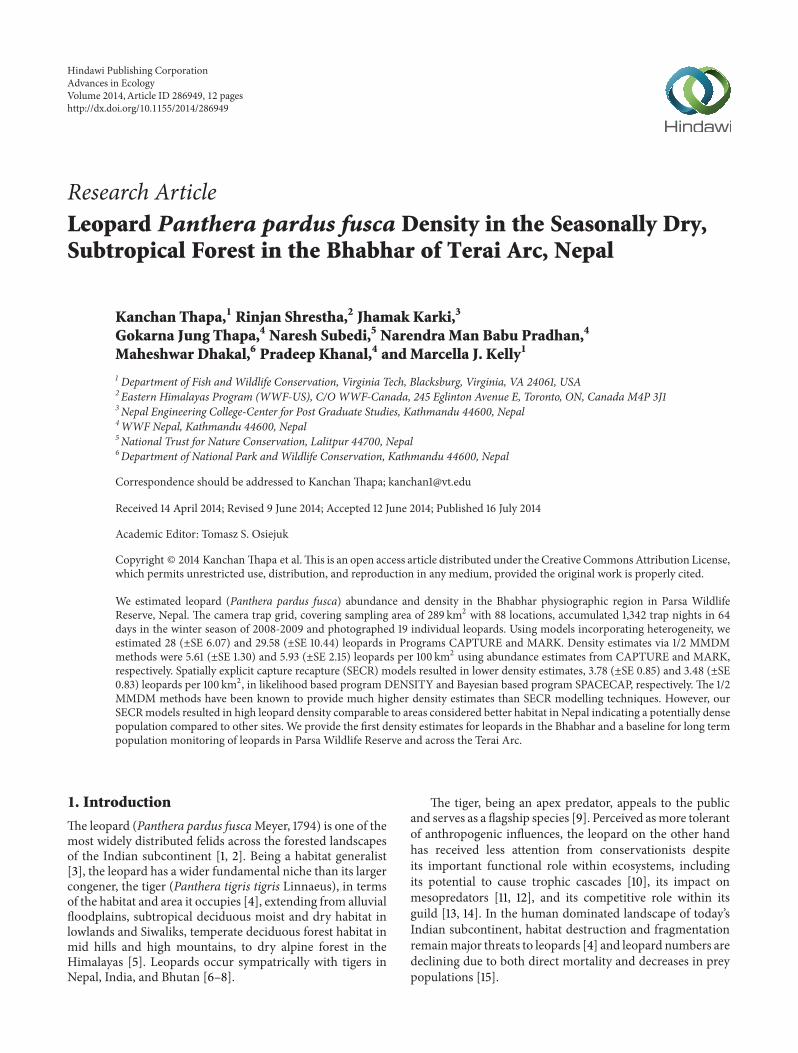
F./012 ": Study areas showing the spatial location of camera traps in the Bhabhar region and the e3ective sampling area formed by drawinga minimum convex polygon surrounding the outermost camera trap locations.!e area of MCP (minimum convex polygon) is $(& km2.
In contrast to tigers, whose population sizes and trendshave been intensively studied in multiple sites across theIndian subcontinent [(, "'–$)], fewer studies have estimatedleopard population sizes across both protected [$#–$'] andnonprotected areas [$*], representing an array of habitattypes in India. In Nepal, even fewer studies are available onleopard demography only representing alluvial -oodplains,grasslands, and deciduous forest from Chitwan [$(, $&] andBardiaNational Parks [)%].However, there are no estimates ofleopard density from seasonally dry subtropical forest in theBhabhar region. Bhabhar is the alluvial apron of sedimentswashed down from the Siwaliks [)"] and represents a keyphysiographic region extending to the “Terai zone” across theTerai Arc Landscape (Terai Arc). Hence, lack of informationfrom Bhabhar habitat has hindered an overall assessment ofleopard conservation status.
We estimate the abundance and density of leopardsfrom the protected area within Bhabhar using a pho-tographic capture-recapture sampling framework [)$–)#].!is approach is widely acknowledged as a robust toolfor estimating population abundance of elusive wild catswith individually distinct pelage patterns ["+, $%]. We usetraditional techniques of estimating the density using thead hoc method of adding a bu3er area around the polygonformed by connecting outer camera trap locations to accountfor edge e3ects (animals that do not occur entirely within
trapping grid but have home range overlapping the edge ofthe grid).!ese bu3ering methods include using an estimateof home range radius derived from GPS or radio telemetry[)+, )'] or the common technique of using half of the meanmaximum distance moved ("/$MMDM) by animals withinthe trap array as a surrogate for home range radius ["(, )*, )(].However, these ad hoc approaches have come under scrutinybecause they are heavily in-uenced by small sample size,camera spacing, and extent of sampling grid relative to theanimal’s home range [)+, )&, #%]. To address the shortcomingsof the traditional approach in estimating leopard density,we also use recently developed spatially explicit capturerecapture (SECR) techniques that use spatial informationmore directly in the density estimation process [#%–#)]. Wecompare the maximum likelihood [##] and Bayesian [#+]SECR approaches in estimating density without the needto estimate an e3ective trapping area using the traditionalad hoc bu3ering approach. We present the result from bothtraditional and SECR approaches allowing us to compare ourleopard density estimates with other studies in South Asia(Nepal, India, and Bhutan).
2. Materials and Methods
!e study was carried out in Parsa Wildlife Reserve (PWR;$*∘"+"N, (#∘#%"E; Figure ") in the south-central lowland Terai
Advances in Ecology )
of Nepal. Encompassing over #&& km2, PWR is the largestwildlife reserve in the country and is contiguous to ChitwanNational Park to the west. PWR is made up mostly of Churiahills (the outermost foothills of Himalayas) and Bhabharregions, a rugged and highly porous landscape largely com-prised of coarse alluvial deposits where streams disappearinto permeable sediments [)"]. PWR has amonsoonal humidclimate with more than (+% of the annual precipitation($"(%mm) occurring between July and October. !e dryseason occurs for (months betweenNovember and June [#'].
!e vegetation can best be described as subtropical, dry,deciduous forest with colonizing Saccharum spontaneum andImperata cylindrica on the dry riverbeds and the -oodplains,to a climax Sal (Shorea robusta) forest on Bhabhar andhillsides [#*]. !e reserve supports a diverse mammalianfauna in addition to leopards, including carnivores such asthe tiger (Panthera tigris tigris), dhole (Cuon alpinus), stripedhyena (Hyaena hyaena), golden jackal (Canis aureus), Indianfox (Vulpes bengalensis), and ratel (Mellivora capensis). !eprinciple wild prey species of the leopard include large sizeanimals (>+% kg): gaur (Bos gaurus), sambar (Rusa unicolor),and nilgai (Boselaphus tragocamelus); medium size animals($%–+% kg): chital (Axis axis), muntjac (Muntiacus muntjak),and wild pig (Sus scrofa); and small size animals (<$% kg):common langur (Semnopithecus entellus) and rhesus monkey(Macaca mulatta). !e combined ungulate prey density isestimated to be '.' individuals (±SE ".") per km2 [#(]. Two ofthe settlements comprising approximately "%% households inRambhori and Bhata in the core area of the reserve have beenrecently relocated [#&]. !is is an event that is expected totrigger the recovery of carnivores within the reserve, makingour density estimation an important baseline study. Illegallivestock grazing along the bu3er zone is believed to reduceforage for wild ungulates, and livestock has been foundgrazing inside the reserve as far as + km from the reserveboundary. Photographic evidence from camera trap pictures[+%] suggests that illegal poaching of wild prey is a directthreat to the carnivore populations in the reserve.
".!. Field Methods. We conducted a camera trap survey for'# days across a $(& km2 core area of the reserve betweenDecember $%%( and March $%%&. We followed the standardstudy design approaches prescribed for large felids at sitesthat had intensive signs of their usage ["(, "&, +"]. We,rst carried out extensive sign surveys for leopards [$, +$]across #$ transect routes spread across the core area of thereserve amounting to *%$ km searched on foot.!ese transectsurveys enabled us to choose key locations for installingcamera traps and identifying survey blocks that covered alarge area without leaving potential gaps in our survey grid.
We selected (( camera-trap locations spread throughoutthe study area based on the presence of leopard tracks,scats, scrapes, and other signs of use. To maximize captureprobability, we positioned our camera traps along forestroads, trails, and dry stream beds, the habitat features knownas leopard travel routes [', +)].!e spacing between camera-trap locations (Figure ") was maintained at approximately".& km (±SE %.%') [$]. At each location, we used $ passive
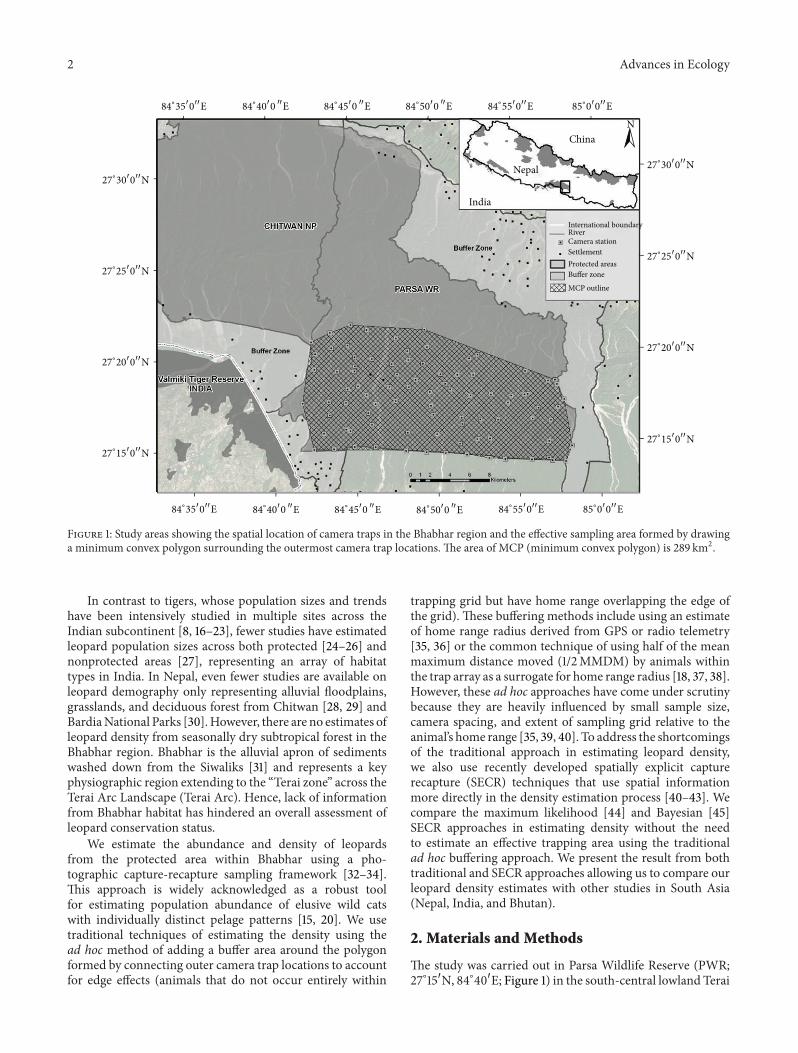
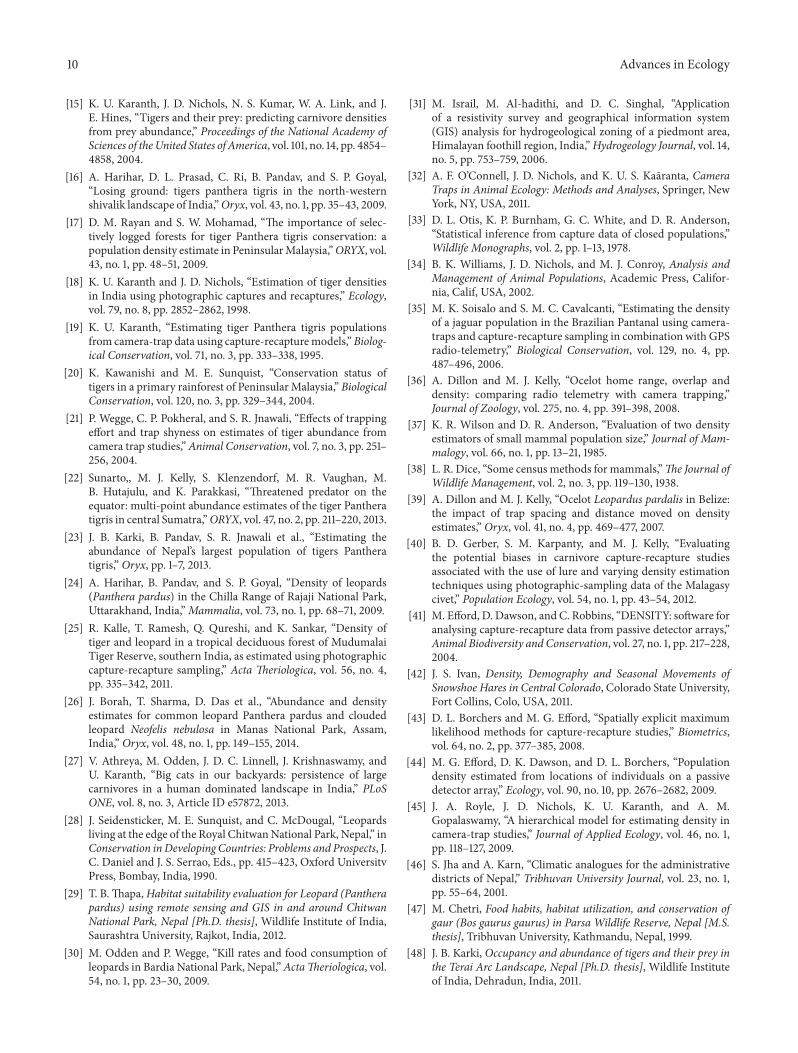
F./012 $: Identical pelage patterns from the same leopard in PWRas displayed in photographic captures from di3erent camera traps.
digital camera traps (Moultrie D+%, Moultrie Feeders, USA)activated by animal movement and placed on either side ofthe trail to photograph both right and le4 -anks of leopards[$, )$]. Each camera trap was active for $# h and was checkedon alternate days for proper recording of capture events, date,time, and any possible malfunctions.
Wedivided the study area into four “trapping blocks” eachmeasuring an average area of *%.+ km2 (±SE *.+#). We placed$$ camera stations per block resulting in an average of )$.$camera stations per "%% km2. Each location was sampled for"' consecutive days resulting in "' encounter occasions, eachconsisting of capture data drawn from one day’s trapping ineach of the blocks [$]. A4er "' days, cameras were moved tothe next block until all # survey blocks were completed.
".". Individual Identi)cation. Two investigators indepen-dently identi,ed the photos for individual identi,cation tobuild consensus on individual leopard identity. Individualleopards were identi,ed based on their unique rosette pat-terns on the -anks, limbs, and forequarters [+#] and givenunique identi,cation numbers (Figure $) as done in otherstudies [$#, $', $*, ++].
".'. Population Estimation. We followed the traditionalcapture-recapture analytic techniques used for estimatingpopulation sizes of large felids from remote camera data [$,"(, "&]. We constructed capture histories for each individualleopard fromphotographic captures and assigned them to theappropriate encounter occasions (refer to Otis et al. [))] andKaranth and Nichols [$] for detail). We used two separateapproaches to statistically test the assumption of populationclosure.
We ,rst used the closure test implemented in programCAPTURE [+']. We then used the Stanley and Burnham [+*]closure test that assumes only time variation in recaptureprobability using the Pradel model [+(] in Program MARKv. +." [+&]. !e Pradel model evaluates geographic closureby estimating the site ,delity (C), immigration (!), and
# Advances in Ecology
recapture probability (") with regard to entry and exit intoor out of the sampling area under assumption of the closurefor the leopard population over our '#-day sampling period.
We used the closed population models [))] implementedin program CAPTURE for estimation of overall captureprobability (") and abundance (%), using several di3er-ent models that can incorporate e3ects of ecological andsampling-related factors (for details refer to [$, *]). We alsoused theHuggins closed capturewith heterogeneitymodelingplatform in program MARK [)), +&, '%] to calculate abun-dance estimates. !ese models use a maximum likelihoodframework and we ,t ( models of Otis et al. [))], whichallow capture probabilities to vary over time ("(&) = '(&)), byindividual’s heterogeneity ("(ℎ) = '(ℎ)), due to a behavioralresponse (initial capture being di3erent from recapture prob-abilities, "(⋅) ⋅ '(⋅)) along with null model (with no variationin capture probabilities, "(⋅) = '(⋅)), and combinations ofthe above factors. Model input includes the one time winterseason capture histories with "' encounter occasions. Weranked all the models using sample size-adjusted Akaike’sInformation Criterion (AIC) ['"] and considered all modelswith ΔAICc < 2 as competing models ['$].
".#. Density Estimation. To convert our abundance estimatesfrom programs CAPTURE and MARK to densities, we usedthe traditional "/$MMDM ["(, )*] and full MMDM [')]approaches to calculate the bu3er strip surrounding ourcamera traps to determine the e3ective trap area (ETA).!e "/$MMDM and full MMDM were calculated from pho-tographed individuals trapped inmore than one location andwe bu3ered each camera trap and dissolved the overlappingareas to calculate the ETA. We then divided our populationestimates from CR (capture-recapture) analysis by total ETAto determine density. We used the delta method to calculatethe variance in density estimates ['#].
We used two SECR approaches to estimate leoparddensity: a maximum likelihoodmodeling framework (SECR-ML) implemented in program DENSITY [#"] and a Bayesianmodeling framework (SECR-B) [#+, '+] implemented in pro-gram SPACECAP ['']. !ese methods allow us to compareour results with recent studies on leopard density estimatesusing SECR-ML models [$+, '*, '(] and using SECR-B [$+,$*, $&, '*].
In program DENSITY v. +.% [#"], we ,rst modeled toselect the appropriate detection (observational) process aseither half-normal, hazard rate, or negative exponential.Using the selected detection function, we then allowed +0(the capture probability at the hypothetical center of anindividual’s home range) and sigma (a function of the scaleof animal movement) to vary using $-class, ,nite mixture(ℎ2) to represent heterogeneity and/or a behavioral response(,). !us, a hazard detection function model with constant+0 and $-class ,nite mixture of sigma would be representedas HZ +0(⋅)sig(ℎ2). We used the estimated log likelihood androot-pooled spatial variance (RPSV) of varying integrationbu3ers [#", '&] for determining the appropriate bu3er size.We ranked all themodels using sample size-adjusted Akaike’sInformation Criterion (AICc) and considered all models
T5672 ": Summary statistics for photographic capture-recapture dataon leopards in PWR.
Survey Summary ValueNumber of camera trap stations ((Sampling occasions (" day each) "'E3ort (trap nights) ",)#$Number of independent photographs #+Leopard activity index (number ofphotographs per "%% trap nights) ).)+
Total number of individuals caught,-#+1 "&Total number of captures )&Number of individual animals caught once "#Number of individual animals caught morethan once +
Survey period $" December $%%(–)March $%%&
with ΔAICc < 2 as competing models. We used the modelaveraging techniques to determine ,nal density estimates['$]. We report the unconditional variance estimates for themodel average estimates.
For the SECR-B approach, we used program SPACECAP[''] implemented in R package v. ).%." [*%] for estimatingleopard density ['+]. We bu3ered "+ km around the samplingarea to represent the probable extent of leopard home rangecenters and generated a grid of hypothetical home rangecenters with equally spaced points (. = 8150), each %.))' kmapart.!is resulted in an area of ",)(& km2 of leopard habitatover which these activity centers were uniformly distributed,a4er removing the '*# km2 area of settlements (villagesand agriculture areas: Rambhori, Bhata, Nirmal basti andamlekhganj). We used three standard input data ,les (animalcapture locations and dates, trap deployment dates andlocations, and hypothetical activity centers) and we assumedthe half normal detection function. We performed +$,%%%iterations, of which the initial $,%%% were discarded as theburn-in period, a thinning rate was set at $%, and we used anaugmentation value of "(% individuals (more than ,ve timesthe expected number of animals). We evaluated results usingthe Geweke diagnostic [*"] and /-score statistics of |/-score|more than ".' implying lack of convergence ['']. We pro-duced the pixelated density map showing the estimated leop-ard densities per pixel of size %.))' km2 using ArcGIS "%.".".&. Comparison of Leopard Estimates. We compiled infor-mation on leopard densities from protected areas across theirrange in Nepal, India, and Bhutan and present cross-sitecomparisons of density and habitat type and describe densityestimates based on type of modeling approach used and theircorresponding standard errors.
3. Results
'.!. Sampling E*ort and Number of Individual LeopardsCaptured. A4er discarding '' trap nights of camera mal-functions, we amassed ",)#$ trap nights and obtained "$%identi,able photographs comprised of '# right -anks and +'le4 -anks of leopard photographs (Table "). Two investigators
Advances in Ecology +
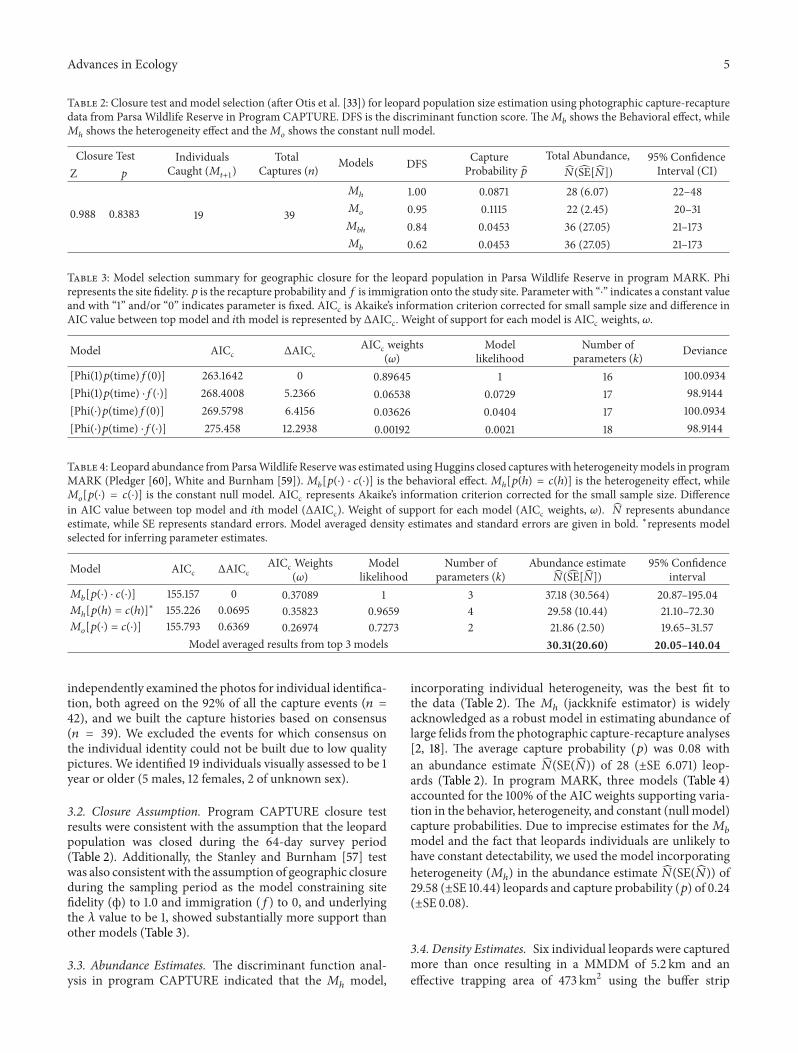
T5672 $: Closure test and model selection (a4er Otis et al. [))]) for leopard population size estimation using photographic capture-recapturedata from Parsa Wildlife Reserve in Program CAPTURE. DFS is the discriminant function score.!e-$ shows the Behavioral e3ect, while-ℎ shows the heterogeneity e3ect and the-& shows the constant null model.
Closure Test IndividualsCaught (-#+1) Total
Captures (.) Models DFS CaptureProbability " Total Abundance,%(SE[%]) &+% Con,dence
Interval (CI)Z p
%.&(( %.()() "& )&
-ℎ ".%% %.%(*" $( ('.%*) $$–#(-& %.&+ %."""+ $$ ($.#+) $%–)"-$ℎ %.(# %.%#+) )' ($*.%+) $"–"*)-$ %.'$ %.%#+) )' ($*.%+) $"–"*)
T5672 ): Model selection summary for geographic closure for the leopard population in Parsa Wildlife Reserve in program MARK. Phirepresents the site ,delity. " is the recapture probability and! is immigration onto the study site. Parameter with “⋅” indicates a constant valueand with “"” and/or “%” indicates parameter is ,xed. AICc is Akaike’s information criterion corrected for small sample size and di3erence inAIC value between top model and 1th model is represented by ΔAICc. Weight of support for each model is AICc weights, 2.Model AICc ΔAICc
AICc weights(2) Model
likelihoodNumber of
parameters (k) Deviance[Phi(")"(time)!(%)] $')."'#$ % %.(&'#+ " "' "%%.%&)#[Phi(")"(time) ⋅!(⋅)] $'(.#%%( +.$)'' %.%'+)( %.%*$& "* &(.&"##[Phi(⋅)"(time)!(%)] $'&.+*&( '.#"+' %.%)'$' %.%#%# "* "%%.%&)#[Phi(⋅)"(time) ⋅!(⋅)] $*+.#+( "$.$&)( %.%%"&$ %.%%$" "( &(.&"##
T5672 #: Leopard abundance fromParsaWildlife Reservewas estimated usingHuggins closed captures with heterogeneitymodels in programMARK (Pledger ['%], White and Burnham [+&]).-$["(⋅) ⋅ '(⋅)] is the behavioral e3ect.-ℎ["(ℎ) = '(ℎ)] is the heterogeneity e3ect, while-&["(⋅) = '(⋅)] is the constant null model. AICc represents Akaike’s information criterion corrected for the small sample size. Di3erencein AIC value between top model and 1th model (ΔAICc). Weight of support for each model (AICc weights, 2). % represents abundanceestimate, while SE represents standard errors. Model averaged density estimates and standard errors are given in bold. ∗represents modelselected for inferring parameter estimates.
Model AICc ΔAICcAICc Weights
(2) Modellikelihood
Number ofparameters (k)
Abundance estimate%(SE[%]) &+% Con,denceinterval-$["(⋅) ⋅ '(⋅)] "++."+* % %.)*%(& " ) )*."( ()%.+'#) $%.(*–"&+.%#-ℎ["(ℎ) = '(ℎ)]∗ "++.$$' %.%'&+ %.)+($) %.&'+& # $&.+( ("%.##) $"."%–*$.)%-&["(⋅) = '(⋅)] "++.*&) %.')'& %.$'&*# %.*$*) $ $".(' ($.+%) "&.'+–)".+*
Model averaged results from top )models !".!#($".%") $"."&–#'"."'
independently examined the photos for individual identi,ca-tion, both agreed on the &$% of all the capture events (. =42), and we built the capture histories based on consensus(. = 39). We excluded the events for which consensus onthe individual identity could not be built due to low qualitypictures. We identi,ed "& individuals visually assessed to be "year or older (+males, "$ females, $ of unknown sex).
'.". Closure Assumption. Program CAPTURE closure testresults were consistent with the assumption that the leopardpopulation was closed during the '#-day survey period(Table $). Additionally, the Stanley and Burnham [+*] testwas also consistent with the assumption of geographic closureduring the sampling period as the model constraining site,delity (C) to ".% and immigration (!) to %, and underlyingthe 3 value to be ", showed substantially more support thanother models (Table )).
'.'. Abundance Estimates. !e discriminant function anal-ysis in program CAPTURE indicated that the -ℎ model,
incorporating individual heterogeneity, was the best ,t tothe data (Table $). !e -ℎ (jackknife estimator) is widelyacknowledged as a robust model in estimating abundance oflarge felids from the photographic capture-recapture analyses[$, "(]. !e average capture probability (") was %.%( withan abundance estimate %(SE(%)) of $( (±SE '.%*") leop-ards (Table $). In program MARK, three models (Table #)accounted for the "%%% of the AIC weights supporting varia-tion in the behavior, heterogeneity, and constant (null model)capture probabilities. Due to imprecise estimates for the-$model and the fact that leopards individuals are unlikely tohave constant detectability, we used the model incorporatingheterogeneity (-ℎ) in the abundance estimate %(SE(%)) of$&.+( (±SE "%.##) leopards and capture probability (") of %.$#(±SE %.%().'.#. Density Estimates. Six individual leopards were capturedmore than once resulting in a MMDM of +.$ km and ane3ective trapping area of #*) km2 using the bu3er strip
' Advances in Ecology
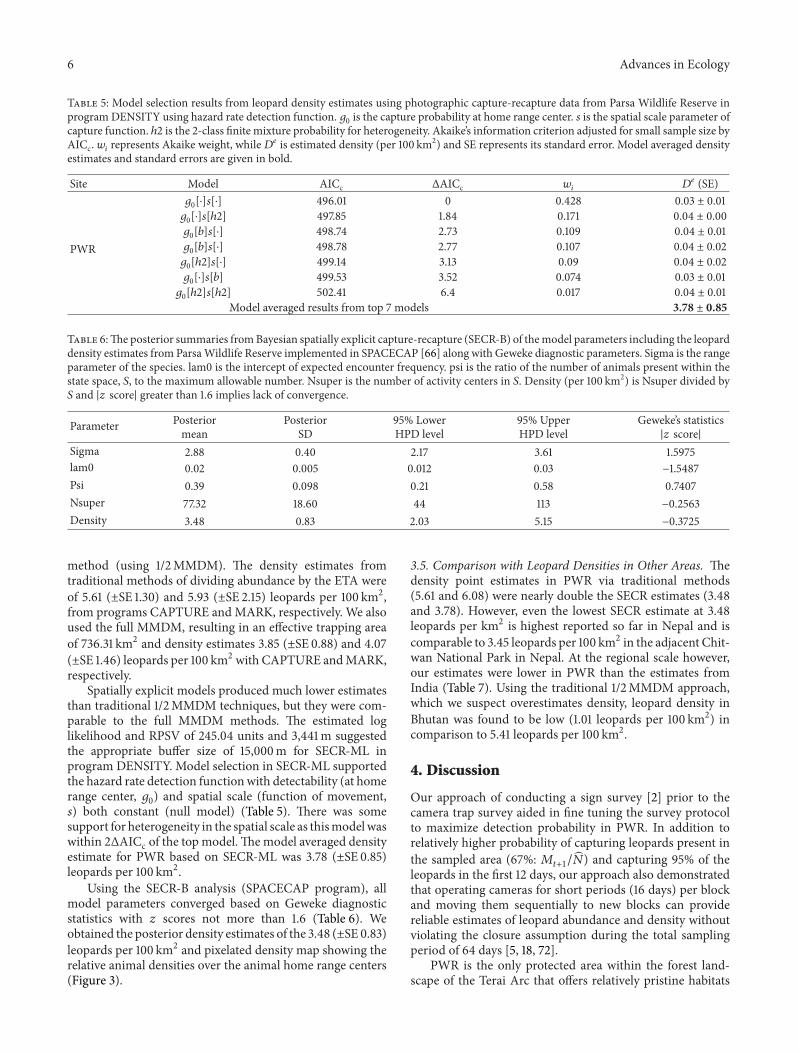
T5672 +: Model selection results from leopard density estimates using photographic capture-recapture data from Parsa Wildlife Reserve inprogram DENSITY using hazard rate detection function. +0 is the capture probability at home range center. 4 is the spatial scale parameter ofcapture function. ℎ2 is the $-class ,nite mixture probability for heterogeneity. Akaike’s information criterion adjusted for small sample size byAICc. 5( represents Akaike weight, while6) is estimated density (per "%% km$) and SE represents its standard error. Model averaged densityestimates and standard errors are given in bold.
Site Model AICc ΔAICc 5( 6) (SE)PWR
+0[⋅]4[⋅] #&'.%" % %.#$( %.%) ± %.%"+0[⋅]4[ℎ2] #&*.(+ ".(# %."*" %.%# ± %.%%+0[,]4[⋅] #&(.*# $.*) %."%& %.%# ± %.%"+0[,]4[⋅] #&(.*( $.** %."%* %.%# ± %.%$+0[ℎ$]4[⋅] #&&."# ).") %.%& %.%# ± %.%$+0[⋅]4[,] #&&.+) ).+$ %.%*# %.%) ± %.%"+0[ℎ2]4[ℎ2] +%$.#" '.# %.%"* %.%# ± %.%"Model averaged results from top *models !.() ± ".)&
T5672 ':!e posterior summaries fromBayesian spatially explicit capture-recapture (SECR-B) of themodel parameters including the leoparddensity estimates from ParsaWildlife Reserve implemented in SPACECAP [''] along with Geweke diagnostic parameters. Sigma is the rangeparameter of the species. lam% is the intercept of expected encounter frequency. psi is the ratio of the number of animals present within thestate space, 7, to the maximum allowable number. Nsuper is the number of activity centers in 7. Density (per "%% km$) is Nsuper divided by7 and |/ score| greater than ".' implies lack of convergence.
Parameter Posteriormean
PosteriorSD
&+% LowerHPD level
&+% UpperHPD level
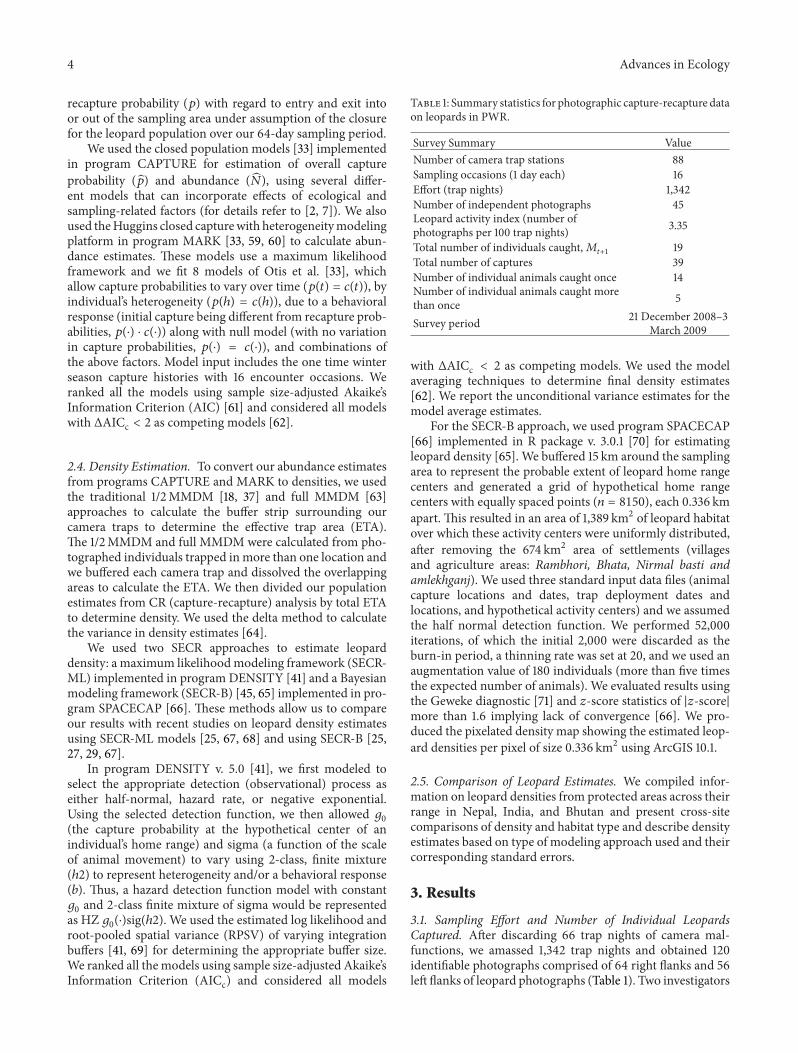
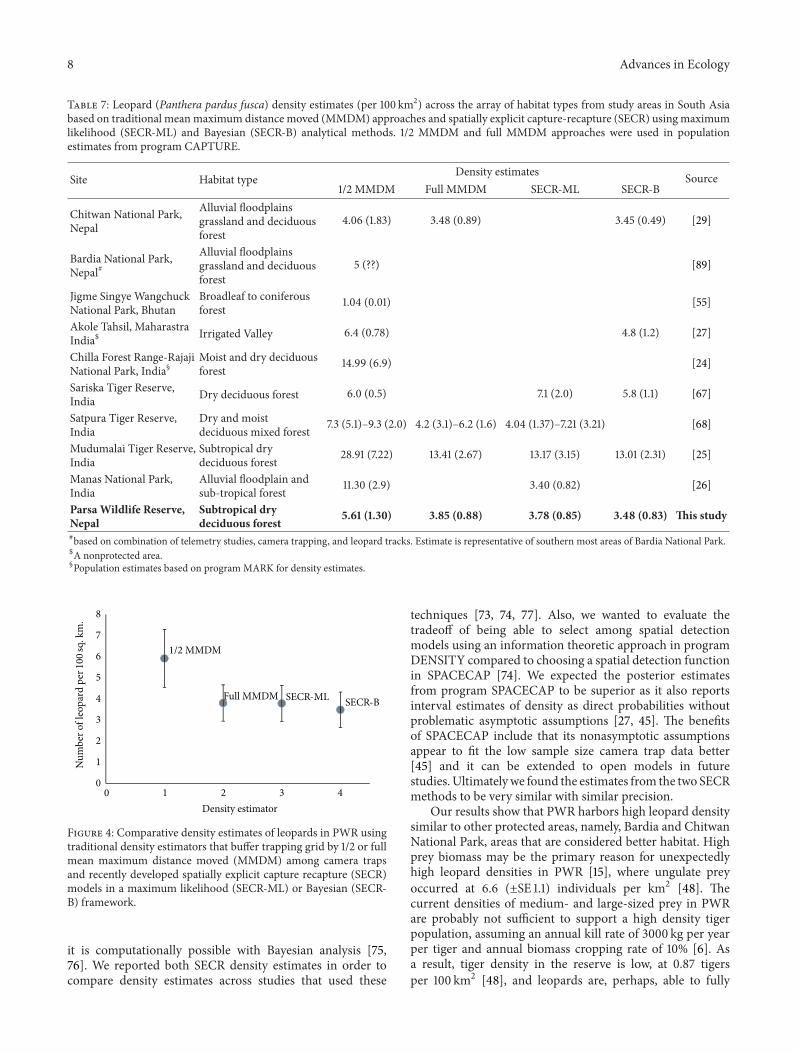
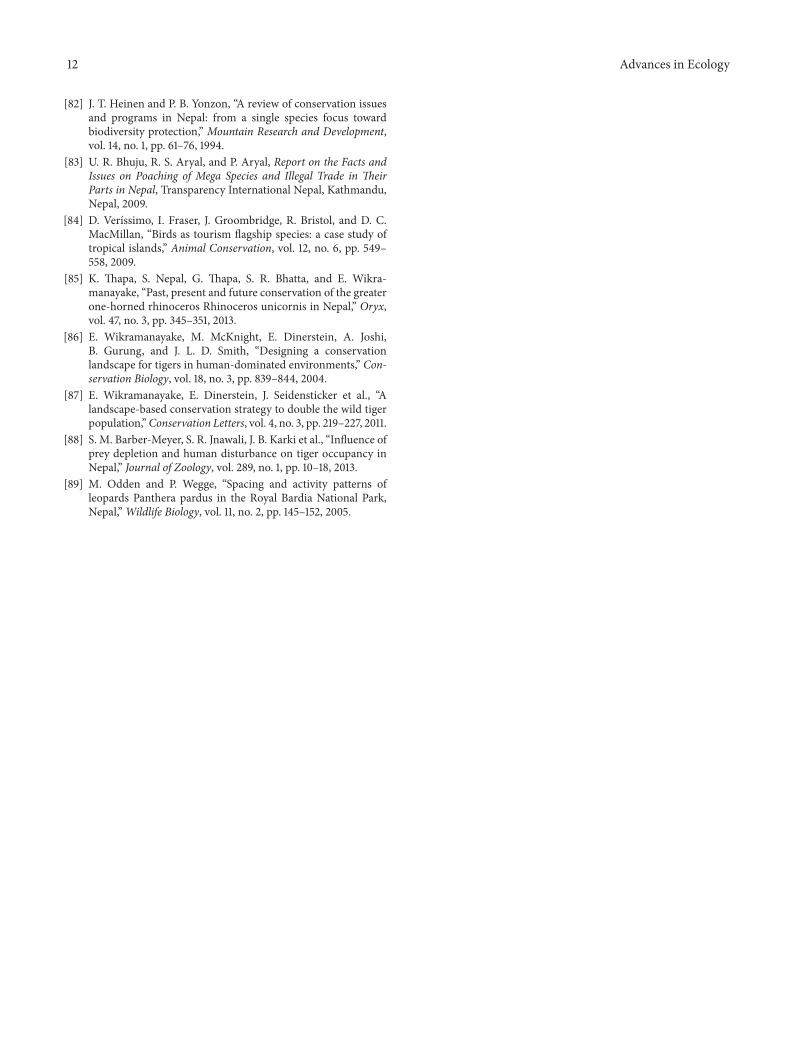
Geweke’s statistics|/ score|Sigma $.(( %.#% $."* ).'" ".+&*+lam% %.%$ %.%%+ %.%"$ %.%) −".+#(*Psi %.)& %.%&( %.$" %.+( %.*#%*Nsuper **.)$ "(.'% ## "") −%.$+')Density ).#( %.() $.%) +."+ −%.)*$+method (using "/$MMDM). !e density estimates fromtraditional methods of dividing abundance by the ETA wereof +.'" (±SE ".)%) and +.&) (±SE $."+) leopards per "%% km2,from programs CAPTURE andMARK, respectively. We alsoused the full MMDM, resulting in an e3ective trapping areaof *)'.)" km2 and density estimates ).(+ (±SE %.(() and #.%*(±SE ".#') leopards per "%% km2 with CAPTURE andMARK,respectively.
Spatially explicit models produced much lower estimatesthan traditional "/$MMDM techniques, but they were com-parable to the full MMDM methods. !e estimated loglikelihood and RPSV of $#+.%# units and ),##"m suggestedthe appropriate bu3er size of "+,%%%m for SECR-ML inprogram DENSITY. Model selection in SECR-ML supportedthe hazard rate detection functionwith detectability (at homerange center, +0) and spatial scale (function of movement,4) both constant (null model) (Table +). !ere was somesupport for heterogeneity in the spatial scale as thismodelwaswithin 2ΔAICc of the top model.!e model averaged densityestimate for PWR based on SECR-ML was ).*( (±SE %.(+)leopards per "%% km2.
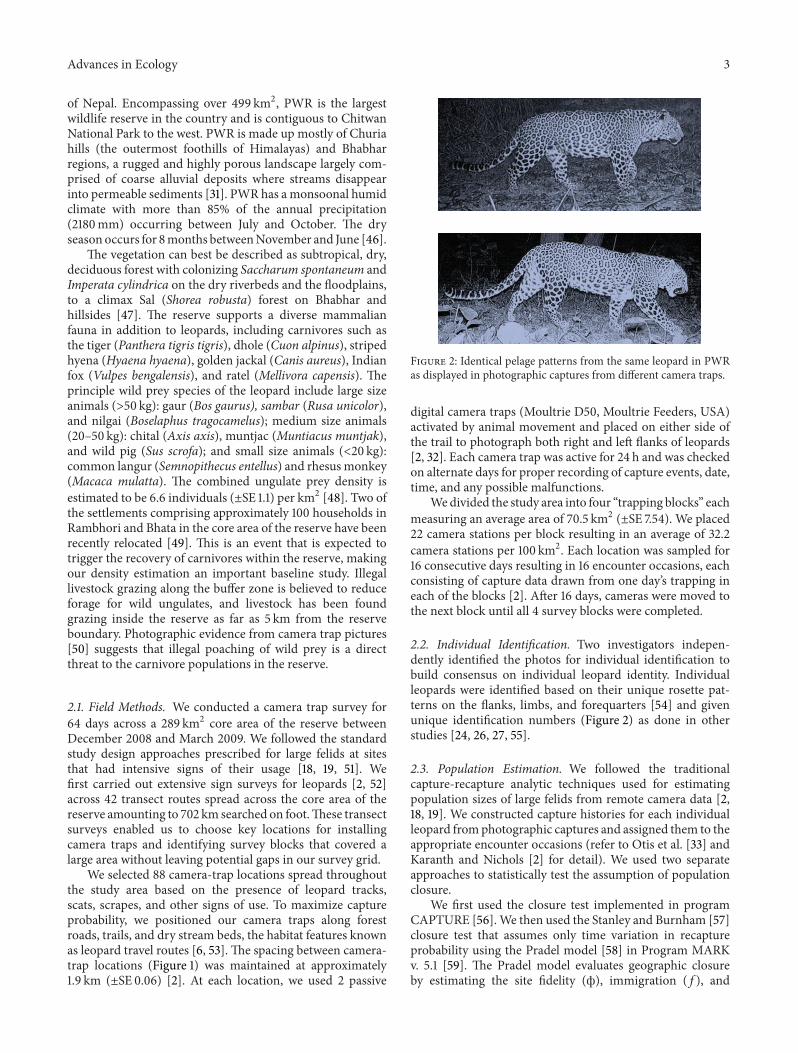
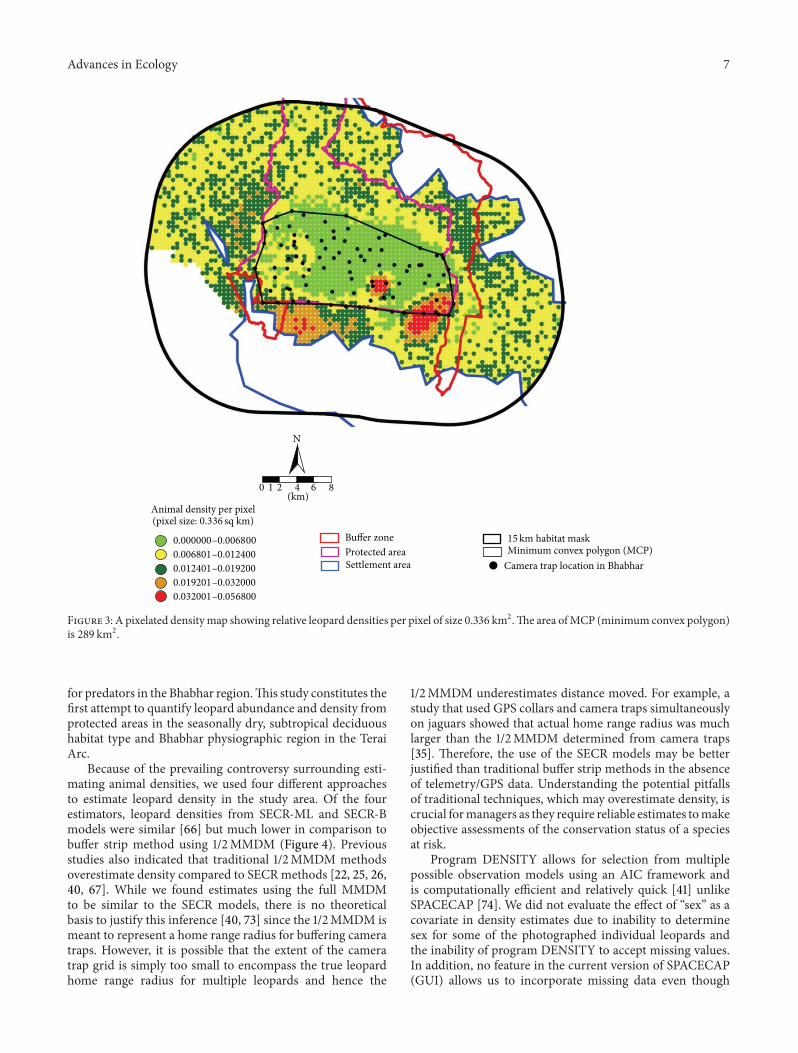
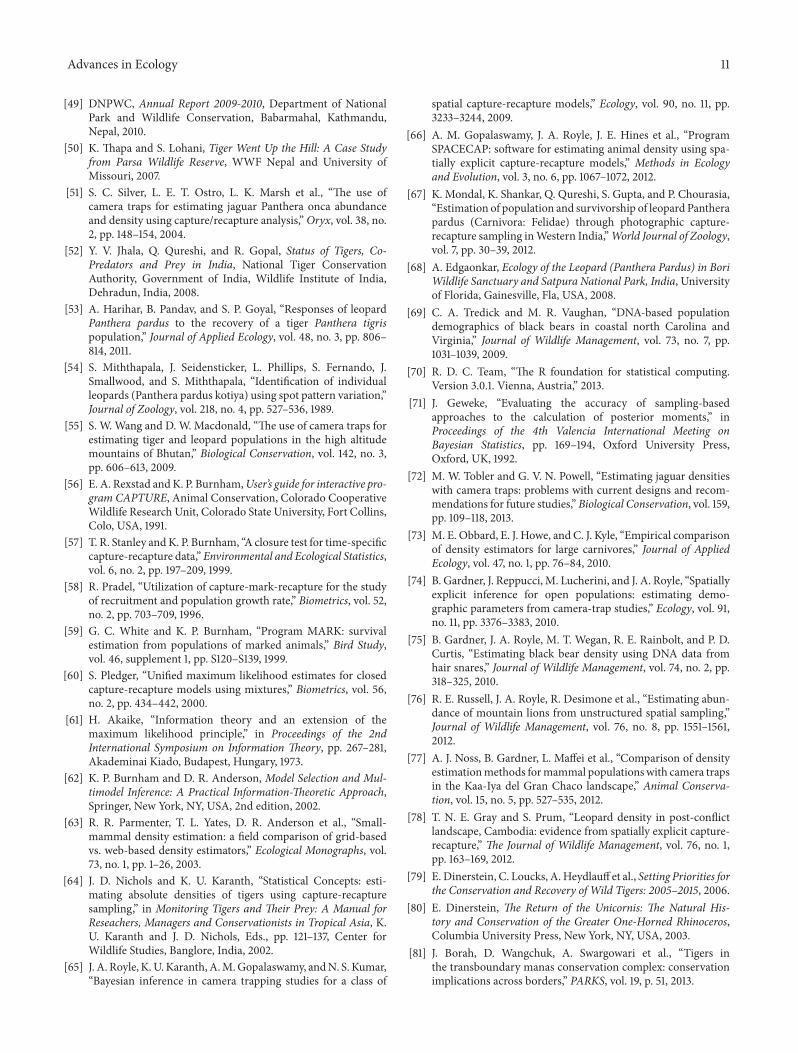
Using the SECR-B analysis (SPACECAP program), allmodel parameters converged based on Geweke diagnosticstatistics with / scores not more than ".' (Table '). Weobtained the posterior density estimates of the ).#( (±SE %.())leopards per "%% km2 and pixelated density map showing therelative animal densities over the animal home range centers(Figure )).
'.&. Comparison with Leopard Densities in Other Areas. !edensity point estimates in PWR via traditional methods(+.'" and '.%() were nearly double the SECR estimates ().#(and ).*(). However, even the lowest SECR estimate at ).#(leopards per km2 is highest reported so far in Nepal and iscomparable to ).#+ leopards per "%% km2 in the adjacent Chit-wan National Park in Nepal. At the regional scale however,our estimates were lower in PWR than the estimates fromIndia (Table *). Using the traditional "/$MMDM approach,which we suspect overestimates density, leopard density inBhutan was found to be low (".%" leopards per "%% km2) incomparison to +.#" leopards per "%% km2.4. Discussion
Our approach of conducting a sign survey [$] prior to thecamera trap survey aided in ,ne tuning the survey protocolto maximize detection probability in PWR. In addition torelatively higher probability of capturing leopards present inthe sampled area ('*%: -#+1/%) and capturing &+% of theleopards in the ,rst "$ days, our approach also demonstratedthat operating cameras for short periods ("' days) per blockand moving them sequentially to new blocks can providereliable estimates of leopard abundance and density withoutviolating the closure assumption during the total samplingperiod of '# days [+, "(, *$].
PWR is the only protected area within the forest land-scape of the Terai Arc that o3ers relatively pristine habitats
Advances in Ecology *
Animal density per pixel(pixel size: 0.336 sq km)
0.000000–0.0068000.006801–0.0124000.012401–0.0192000.019201–0.0320000.032001–0.056800
Bu!er zoneProtected area
15km habitat maskMinimum convex polygon (MCP)
Camera trap location in BhabharSettlement area
N
0 1 2 4 6 8(km)
F./012 ): A pixelated densitymap showing relative leopard densities per pixel of size %.))' km2.!e area ofMCP (minimum convex polygon)is $(& km2.for predators in the Bhabhar region.!is study constitutes the,rst attempt to quantify leopard abundance and density fromprotected areas in the seasonally dry, subtropical deciduoushabitat type and Bhabhar physiographic region in the TeraiArc.
Because of the prevailing controversy surrounding esti-mating animal densities, we used four di3erent approachesto estimate leopard density in the study area. Of the fourestimators, leopard densities from SECR-ML and SECR-Bmodels were similar [''] but much lower in comparison tobu3er strip method using "/$MMDM (Figure #). Previousstudies also indicated that traditional "/$MMDM methodsoverestimate density compared to SECRmethods [$$, $+, $',#%, '*]. While we found estimates using the full MMDMto be similar to the SECR models, there is no theoreticalbasis to justify this inference [#%, *)] since the "/$MMDM ismeant to represent a home range radius for bu3ering cameratraps. However, it is possible that the extent of the cameratrap grid is simply too small to encompass the true leopardhome range radius for multiple leopards and hence the
"/$MMDM underestimates distance moved. For example, astudy that used GPS collars and camera traps simultaneouslyon jaguars showed that actual home range radius was muchlarger than the "/$MMDM determined from camera traps[)+]. !erefore, the use of the SECR models may be betterjusti,ed than traditional bu3er strip methods in the absenceof telemetry/GPS data. Understanding the potential pitfallsof traditional techniques, which may overestimate density, iscrucial formanagers as they require reliable estimates tomakeobjective assessments of the conservation status of a speciesat risk.
Program DENSITY allows for selection from multiplepossible observation models using an AIC framework andis computationally e8cient and relatively quick [#"] unlikeSPACECAP [*#]. We did not evaluate the e3ect of “sex” as acovariate in density estimates due to inability to determinesex for some of the photographed individual leopards andthe inability of program DENSITY to accept missing values.In addition, no feature in the current version of SPACECAP(GUI) allows us to incorporate missing data even though
( Advances in Ecology
T5672 *: Leopard (Panthera pardus fusca) density estimates (per "%% km$) across the array of habitat types from study areas in South Asiabased on traditional meanmaximum distance moved (MMDM) approaches and spatially explicit capture-recapture (SECR) using maximumlikelihood (SECR-ML) and Bayesian (SECR-B) analytical methods. "/$ MMDM and full MMDM approaches were used in populationestimates from program CAPTURE.
Site Habitat type Density estimates Source"/$MMDM Full MMDM SECR-ML SECR-B
Chitwan National Park,Nepal
Alluvial -oodplainsgrassland and deciduousforest
#.%' (".()) ).#( (%.(&) ).#+ (%.#&) [$&]
Bardia National Park,Nepal9
Alluvial -oodplainsgrassland and deciduousforest
+ (??) [(&]
Jigme Singye WangchuckNational Park, Bhutan
Broadleaf to coniferousforest ".%# (%.%") [++]
Akole Tahsil, MaharastraIndia: Irrigated Valley '.# (%.*() #.( (".$) [$*]
Chilla Forest Range-RajajiNational Park, India§
Moist and dry deciduousforest "#.&& ('.&) [$#]
Sariska Tiger Reserve,India Dry deciduous forest '.% (%.+) *." ($.%) +.( (".") ['*]
Satpura Tiger Reserve,India
Dry and moistdeciduous mixed forest *.) (+.")–&.) ($.%) #.$ ().")–'.$ (".') #.%# (".)*)–*.$" ().$") ['(]
Mudumalai Tiger Reserve,India
Subtropical drydeciduous forest $(.&" (*.$$) ").#" ($.'*) ")."* ()."+) ").%" ($.)") [$+]
Manas National Park,India
Alluvial -oodplain andsub-tropical forest "".)% ($.&) ).#% (%.($) [$']
Parsa Wildlife Reserve,Nepal
Subtropical drydeciduous forest &.%# (#.!") !.)& (".))) !.() (".)&) !.') (".)!) *is study
9based on combination of telemetry studies, camera trapping, and leopard tracks. Estimate is representative of southern most areas of Bardia National Park.:A nonprotected area.§Population estimates based on programMARK for density estimates.
1/2 MMDM
Full MMDM SECR-ML SECR-B
0
1
2
3
4
5
6
7
8
0 1 2 3 4
Num
ber o
f leo
pard
per100s
q. k
m.
Density estimator
F./012 #: Comparative density estimates of leopards in PWR usingtraditional density estimators that bu3er trapping grid by "/$ or fullmean maximum distance moved (MMDM) among camera trapsand recently developed spatially explicit capture recapture (SECR)models in a maximum likelihood (SECR-ML) or Bayesian (SECR-B) framework.
it is computationally possible with Bayesian analysis [*+,*']. We reported both SECR density estimates in order tocompare density estimates across studies that used these
techniques [*), *#, **]. Also, we wanted to evaluate thetradeo3 of being able to select among spatial detectionmodels using an information theoretic approach in programDENSITY compared to choosing a spatial detection functionin SPACECAP [*#]. We expected the posterior estimatesfrom program SPACECAP to be superior as it also reportsinterval estimates of density as direct probabilities withoutproblematic asymptotic assumptions [$*, #+]. !e bene,tsof SPACECAP include that its nonasymptotic assumptionsappear to ,t the low sample size camera trap data better[#+] and it can be extended to open models in futurestudies.Ultimatelywe found the estimates from the two SECRmethods to be very similar with similar precision.
Our results show that PWR harbors high leopard densitysimilar to other protected areas, namely, Bardia and ChitwanNational Park, areas that are considered better habitat. Highprey biomass may be the primary reason for unexpectedlyhigh leopard densities in PWR ["+], where ungulate preyoccurred at '.' (±SE ".") individuals per km2 [#(]. !ecurrent densities of medium- and large-sized prey in PWRare probably not su8cient to support a high density tigerpopulation, assuming an annual kill rate of )%%% kg per yearper tiger and annual biomass cropping rate of "%% [']. Asa result, tiger density in the reserve is low, at %.(* tigersper "%% km2 [#(], and leopards are, perhaps, able to fully
Advances in Ecology &
exploit their preferred prey, medium- and small-sized prey,perhaps explaining the high density of leopards in PWR.At the regional scale, results of this study demonstrate thatSECR leopard densities of ).#( per "%% km2 in seasonally drydeciduous forest were lower than SECR estimates in similarsites in India. Prey availability and the broad niche width ofleopards in forested landscapes could be the reason for theirvariable densities in the subcontinent.
Baseline population estimates for leopards are essentialfor monitoring the e3ectiveness of conservation initiatives[*(] and for guiding conservation decisions. In this regard,our ,ndings provide useful insights for leopard conservationboth at the local and regional levels. At the local level, ourresults serve as the benchmark data to assess conservationimpacts of the relocation of ca "%% households from the corearea of PWR. At the regional scale, leopard demographicassessment across this large conservation complex of theChitwan-Parsa-Valmiki Tiger conservation unit [*&, (%],which was established for tigers, can simultaneously providereliable information on leopard density for the transbound-ary conservation landscape, following the model providedby the transboundary Manas conservation landscape acrossIndia and Bhutan [("]. Hence, long-term monitoring ofleopards with camera trap studies, as employed in ourstudy, would be useful to understand conservation statusand variation in the population sizes over time and fromlocal to regional scales, thereby informing decisionmakers inimplementing sound conservation management recommen-dations.
!e current Nepalese legislation on wildlife does notrecognize the leopard on the protected animal list [($], yetit is one of the most heavily traded species for its skin [()].!e antipoaching strategy designed to protect the tiger andrhinoceros as -agship species in the region [(#, (+] shouldalso aid in leopard conservation within protected areas.However, the large swathe of unprotected areas in the humandominated landscape of the Terai Arc [('–((] representsa considerable challenge in terms of the impact of habitatfragmentation [#] and increasing human wildlife con-ict inprotecting this iconic mesopredator.
Conflict of Interests
!e authors declare that there is no con-ict of interestsregarding the publication of this paper.
Acknowledgments
!e authors are thankful to the Department of NationalParks and Wildlife Conservation for granting permission tocarry out this research. !ey thank the Director General(DNPWC), the Country Representative (WWF Nepal), andthe Member Secretary (NTNC) for their support; the coreteam for their technical support; Parsa Wildlife Reserve sta3,BCC/NTNC, and TAL/WWF ,eld sta3 for their assistance inthe survey.!anks are also due to National Fish andWildlifeFoundation/Save the Tiger Fund, US Fish and WildlifeService, WWF UK, and WWF International for ,nancial
assistance to the project. Kanchan !apa was supportedby WWF US Kathryn Fuller Fellowship and Virginia Techwhile preparing the paper. !e authors thank Brian Gerberand Dana Morin for their technical advice in the analysisand Brandon Plunkett for helping construct the leoparddatabase. Special thanks are due to Drs: John Seidensticker,Dale Miquelle, and Mark Ryan including two anonymousreviewers for their review and comments in improving theearlier version of this paper.
References
["] IUCN, “Red List of !reatened Species Version $%"%,” Interna-tional Union for Nature Conservation, http://www.iucnredlist.org/apps/redlist/details/$$*)$/%.
[$] K. U. Karanth and J. D. Nichols, Monitoring Tigers and +eirPrey: A Manual for Researchers, Managers and Conservationistsin Tropical Asia, Center for Wildlife Studies, New York, NY,USA, $%%$.
[)] M. E. Sunquist and F. Sunquist, Wild Cats of the World, !eUniversity Chicago Press, Chicago, Ill, USA, $%%$.
[#] T. Dutta, S. Sharma, J. E. Maldonado, T. C. Wood, H. S. Panwar,and J. Seidensticker, “Fine-scale population genetic structure ina wide-ranging carnivore, the leopard (Panthera pardus fusca)in central India,” Diversity and Distributions, vol. "&, no. *, pp.*'%–**", $%").
[+] K. !apa, N. M. B. Pradhan, J. Barker et al., “High elevationrecord of a leopard cat in the Kangchenjunga ConservationArea, Nepal,” Cat News, no. +(, pp. $'–$*, $%").
['] M. E. Sunquist, +e Social Organization of Tigers (Pantheratigris) in Royal Chitawan National Park, Nepal, SmithsonianContributions to Zoology no. ))', Smithsonian InstitutionPress, Washington, DC, USA, "&($.
[*] K. U. Karanth and M. E. Sunquist, “Prey selection by tiger,leopard and dhole in tropical forests,” Journal of Animal Ecology,vol. '#, no. #, pp. #)&–#+%, "&&+.
[(] S. W. Wang and D. W. Macdonald, “Feeding habits and nichepartitioning in a predator guild composed of tigers, leopardsand dholes in a temperate ecosystem in central Bhutan,” Journalof Zoology, vol. $**, no. #, pp. $*+–$(), $%%&.
[&] D. Verıssimo, T. Pongiluppi, M. C. M. Santos et al., “Usinga Systematic Approach to Select Flagship Species for BirdConservation,” Conservation Biology, vol. $(, no. ", pp. $'&–$**,$%"#.
["%] N.Hairston, F. Smith, and L. Slobodkin, “Community structure,population control and competition,” American Naturalist, vol.&#, pp. #$"–#$+, "&'%.
[""] E. G. Ritchie and C. N. Johnson, “Predator interactions, meso-predator release and biodiversity conservation,” Ecology Letters,vol. "$, no. &, pp. &($–&&(, $%%&.
["$] K. R. Crooks and M. E. Soule, “Mesopredator release andavifaunal extinctions in a fragmented system,” Nature, vol. #%%,no. '*##, pp. +')–+'', "&&&.
[")] P. Henschel, L. T. B. Hunter, U. Breitenmoser et al., “Pan-thera pardus,” in Proceedings of the IUCN World ConservationCongress, IUCN Red List of!reatened Species, $%").
["#] G. A. Balme, R. Slotow, and L. T. B. Hunter, “Edge e3ects andthe impact of non-protected areas in carnivore conservation:leopards in the Phinda-Mkhuze Complex, South Africa,” Ani-mal Conservation, vol. "), no. ), pp. )"+–)$), $%"%.
"% Advances in Ecology
["+] K. U. Karanth, J. D. Nichols, N. S. Kumar, W. A. Link, and J.E. Hines, “Tigers and their prey: predicting carnivore densitiesfrom prey abundance,” Proceedings of the National Academy ofSciences of theUnited States of America, vol. "%", no. "#, pp. #(+#–#(+(, $%%#.
["'] A. Harihar, D. L. Prasad, C. Ri, B. Pandav, and S. P. Goyal,“Losing ground: tigers panthera tigris in the north-westernshivalik landscape of India,”Oryx, vol. #), no. ", pp. )+–#), $%%&.
["*] D. M. Rayan and S. W. Mohamad, “!e importance of selec-tively logged forests for tiger Panthera tigris conservation: apopulation density estimate in PeninsularMalaysia,”ORYX, vol.#), no. ", pp. #(–+", $%%&.
["(] K. U. Karanth and J. D. Nichols, “Estimation of tiger densitiesin India using photographic captures and recaptures,” Ecology,vol. *&, no. (, pp. $(+$–$('$, "&&(.
["&] K. U. Karanth, “Estimating tiger Panthera tigris populationsfrom camera-trap data using capture-recapturemodels,”Biolog-ical Conservation, vol. *", no. ), pp. )))–))(, "&&+.
[$%] K. Kawanishi and M. E. Sunquist, “Conservation status oftigers in a primary rainforest of Peninsular Malaysia,” BiologicalConservation, vol. "$%, no. ), pp. )$&–)##, $%%#.
[$"] P. Wegge, C. P. Pokheral, and S. R. Jnawali, “E3ects of trappinge3ort and trap shyness on estimates of tiger abundance fromcamera trap studies,”Animal Conservation, vol. *, no. ), pp. $+"–$+', $%%#.
[$$] Sunarto,, M. J. Kelly, S. Klenzendorf, M. R. Vaughan, M.B. Hutajulu, and K. Parakkasi, “!reatened predator on theequator: multi-point abundance estimates of the tiger Pantheratigris in central Sumatra,”ORYX, vol. #*, no. $, pp. $""–$$%, $%").
[$)] J. B. Karki, B. Pandav, S. R. Jnawali et al., “Estimating theabundance of Nepal’s largest population of tigers Pantheratigris,” Oryx, pp. "–*, $%").
[$#] A. Harihar, B. Pandav, and S. P. Goyal, “Density of leopards(Panthera pardus) in the Chilla Range of Rajaji National Park,Uttarakhand, India,”Mammalia, vol. *), no. ", pp. '(–*", $%%&.
[$+] R. Kalle, T. Ramesh, Q. Qureshi, and K. Sankar, “Density oftiger and leopard in a tropical deciduous forest of MudumalaiTiger Reserve, southern India, as estimated using photographiccapture-recapture sampling,” Acta +eriologica, vol. +', no. #,pp. ))+–)#$, $%"".
[$'] J. Borah, T. Sharma, D. Das et al., “Abundance and densityestimates for common leopard Panthera pardus and cloudedleopard Neofelis nebulosa in Manas National Park, Assam,India,” Oryx, vol. #(, no. ", pp. "#&–"++, $%"#.
[$*] V. Athreya, M. Odden, J. D. C. Linnell, J. Krishnaswamy, andU. Karanth, “Big cats in our backyards: persistence of largecarnivores in a human dominated landscape in India,” PLoSONE, vol. (, no. ), Article ID e+*(*$, $%").
[$(] J. Seidensticker, M. E. Sunquist, and C. McDougal, “Leopardsliving at the edge of the Royal ChitwanNational Park, Nepal,” inConservation inDeveloping Countries: Problems and Prospects, J.C. Daniel and J. S. Serrao, Eds., pp. #"+–#$), Oxford UniversitvPress, Bombay, India, "&&%.
[$&] T. B.!apa,Habitat suitability evaluation for Leopard (Pantherapardus) using remote sensing and GIS in and around ChitwanNational Park, Nepal [Ph.D. thesis], Wildlife Institute of India,Saurashtra University, Rajkot, India, $%"$.
[)%] M. Odden and P. Wegge, “Kill rates and food consumption ofleopards in Bardia National Park, Nepal,”Acta+eriologica, vol.+#, no. ", pp. $)–)%, $%%&.
[)"] M. Israil, M. Al-hadithi, and D. C. Singhal, “Applicationof a resistivity survey and geographical information system(GIS) analysis for hydrogeological zoning of a piedmont area,Himalayan foothill region, India,”Hydrogeology Journal, vol. "#,no. +, pp. *+)–*+&, $%%'.
[)$] A. F. O’Connell, J. D. Nichols, and K. U. S. Kaaranta, CameraTraps in Animal Ecology: Methods and Analyses, Springer, NewYork, NY, USA, $%"".
[))] D. L. Otis, K. P. Burnham, G. C. White, and D. R. Anderson,“Statistical inference from capture data of closed populations,”Wildlife Monographs, vol. $, pp. "–"), "&*(.
[)#] B. K. Williams, J. D. Nichols, and M. J. Conroy, Analysis andManagement of Animal Populations, Academic Press, Califor-nia, Calif, USA, $%%$.
[)+] M. K. Soisalo and S. M. C. Cavalcanti, “Estimating the densityof a jaguar population in the Brazilian Pantanal using camera-traps and capture-recapture sampling in combination with GPSradio-telemetry,” Biological Conservation, vol. "$&, no. #, pp.#(*–#&', $%%'.
[)'] A. Dillon and M. J. Kelly, “Ocelot home range, overlap anddensity: comparing radio telemetry with camera trapping,”Journal of Zoology, vol. $*+, no. #, pp. )&"–)&(, $%%(.
[)*] K. R. Wilson and D. R. Anderson, “Evaluation of two densityestimators of small mammal population size,” Journal of Mam-malogy, vol. '', no. ", pp. ")–$", "&(+.
[)(] L. R. Dice, “Some census methods for mammals,”+e Journal ofWildlife Management, vol. $, no. ), pp. ""&–")%, "&)(.
[)&] A. Dillon and M. J. Kelly, “Ocelot Leopardus pardalis in Belize:the impact of trap spacing and distance moved on densityestimates,” Oryx, vol. #", no. #, pp. #'&–#**, $%%*.
[#%] B. D. Gerber, S. M. Karpanty, and M. J. Kelly, “Evaluatingthe potential biases in carnivore capture-recapture studiesassociated with the use of lure and varying density estimationtechniques using photographic-sampling data of the Malagasycivet,” Population Ecology, vol. +#, no. ", pp. #)–+#, $%"$.
[#"] M. E3ord, D. Dawson, and C. Robbins, “DENSITY: so4ware foranalysing capture-recapture data from passive detector arrays,”Animal Biodiversity and Conservation, vol. $*, no. ", pp. $"*–$$(,$%%#.
[#$] J. S. Ivan, Density, Demography and Seasonal Movements ofSnowshoe Hares in Central Colorado, Colorado State University,Fort Collins, Colo, USA, $%"".
[#)] D. L. Borchers and M. G. E3ord, “Spatially explicit maximumlikelihood methods for capture-recapture studies,” Biometrics,vol. '#, no. $, pp. )**–)(+, $%%(.
[##] M. G. E3ord, D. K. Dawson, and D. L. Borchers, “Populationdensity estimated from locations of individuals on a passivedetector array,” Ecology, vol. &%, no. "%, pp. $'*'–$'($, $%%&.
[#+] J. A. Royle, J. D. Nichols, K. U. Karanth, and A. M.Gopalaswamy, “A hierarchical model for estimating density incamera-trap studies,” Journal of Applied Ecology, vol. #', no. ",pp. ""(–"$*, $%%&.
[#'] S. Jha and A. Karn, “Climatic analogues for the administrativedistricts of Nepal,” Tribhuvan University Journal, vol. $), no. ",pp. ++–'#, $%%".
[#*] M. Chetri, Food habits, habitat utilization, and conservation ofgaur (Bos gaurus gaurus) in Parsa Wildlife Reserve, Nepal [M.S.thesis], Tribhuvan University, Kathmandu, Nepal, "&&&.
[#(] J. B. Karki, Occupancy and abundance of tigers and their prey inthe Terai Arc Landscape, Nepal [Ph.D. thesis], Wildlife Instituteof India, Dehradun, India, $%"".
Advances in Ecology ""
[#&] DNPWC, Annual Report "$$,-"$!$, Department of NationalPark and Wildlife Conservation, Babarmahal, Kathmandu,Nepal, $%"%.
[+%] K. !apa and S. Lohani, Tiger Went Up the Hill: A Case Studyfrom Parsa Wildlife Reserve, WWF Nepal and University ofMissouri, $%%*.
[+"] S. C. Silver, L. E. T. Ostro, L. K. Marsh et al., “!e use ofcamera traps for estimating jaguar Panthera onca abundanceand density using capture/recapture analysis,”Oryx, vol. )(, no.$, pp. "#(–"+#, $%%#.
[+$] Y. V. Jhala, Q. Qureshi, and R. Gopal, Status of Tigers, Co-Predators and Prey in India, National Tiger ConservationAuthority, Government of India, Wildlife Institute of India,Dehradun, India, $%%(.
[+)] A. Harihar, B. Pandav, and S. P. Goyal, “Responses of leopardPanthera pardus to the recovery of a tiger Panthera tigrispopulation,” Journal of Applied Ecology, vol. #(, no. ), pp. (%'–("#, $%"".
[+#] S. Miththapala, J. Seidensticker, L. Phillips, S. Fernando, J.Smallwood, and S. Miththapala, “Identi,cation of individualleopards (Panthera pardus kotiya) using spot pattern variation,”Journal of Zoology, vol. $"(, no. #, pp. +$*–+)', "&(&.
[++] S. W. Wang and D. W. Macdonald, “!e use of camera traps forestimating tiger and leopard populations in the high altitudemountains of Bhutan,” Biological Conservation, vol. "#$, no. ),pp. '%'–'"), $%%&.
[+'] E. A. Rexstad andK. P. Burnham,User’s guide for interactive pro-gram CAPTURE, Animal Conservation, Colorado CooperativeWildlife Research Unit, Colorado State University, Fort Collins,Colo, USA, "&&".
[+*] T. R. Stanley andK. P. Burnham, “A closure test for time-speci,ccapture-recapture data,” Environmental and Ecological Statistics,vol. ', no. $, pp. "&*–$%&, "&&&.
[+(] R. Pradel, “Utilization of capture-mark-recapture for the studyof recruitment and population growth rate,” Biometrics, vol. +$,no. $, pp. *%)–*%&, "&&'.
[+&] G. C. White and K. P. Burnham, “Program MARK: survivalestimation from populations of marked animals,” Bird Study,vol. #', supplement ", pp. S"$%–S")&, "&&&.
['%] S. Pledger, “Uni,ed maximum likelihood estimates for closedcapture-recapture models using mixtures,” Biometrics, vol. +',no. $, pp. #)#–##$, $%%%.
['"] H. Akaike, “Information theory and an extension of themaximum likelihood principle,” in Proceedings of the "ndInternational Symposium on Information +eory, pp. $'*–$(",Akademinai Kiado, Budapest, Hungary, "&*).
['$] K. P. Burnham and D. R. Anderson, Model Selection and Mul-timodel Inference: A Practical Information-+eoretic Approach,Springer, New York, NY, USA, $nd edition, $%%$.
[')] R. R. Parmenter, T. L. Yates, D. R. Anderson et al., “Small-mammal density estimation: a ,eld comparison of grid-basedvs. web-based density estimators,” Ecological Monographs, vol.*), no. ", pp. "–$', $%%).
['#] J. D. Nichols and K. U. Karanth, “Statistical Concepts: esti-mating absolute densities of tigers using capture-recapturesampling,” in Monitoring Tigers and +eir Prey: A Manual forReseachers, Managers and Conservationists in Tropical Asia, K.U. Karanth and J. D. Nichols, Eds., pp. "$"–")*, Center forWildlife Studies, Banglore, India, $%%$.
['+] J. A. Royle, K.U.Karanth, A.M.Gopalaswamy, andN. S. Kumar,“Bayesian inference in camera trapping studies for a class of
spatial capture-recapture models,” Ecology, vol. &%, no. "", pp.)$))–)$##, $%%&.
[''] A. M. Gopalaswamy, J. A. Royle, J. E. Hines et al., “ProgramSPACECAP: so4ware for estimating animal density using spa-tially explicit capture-recapture models,” Methods in Ecologyand Evolution, vol. ), no. ', pp. "%'*–"%*$, $%"$.
['*] K. Mondal, K. Shankar, Q. Qureshi, S. Gupta, and P. Chourasia,“Estimation of population and survivorship of leopard Pantherapardus (Carnivora: Felidae) through photographic capture-recapture sampling inWestern India,”World Journal of Zoology,vol. *, pp. )%–)&, $%"$.
['(] A. Edgaonkar, Ecology of the Leopard (Panthera Pardus) in BoriWildlife Sanctuary and Satpura National Park, India, Universityof Florida, Gainesville, Fla, USA, $%%(.
['&] C. A. Tredick and M. R. Vaughan, “DNA-based populationdemographics of black bears in coastal north Carolina andVirginia,” Journal of Wildlife Management, vol. *), no. *, pp."%)"–"%)&, $%%&.
[*%] R. D. C. Team, “!e R foundation for statistical computing.Version ).%.". Vienna, Austria,” $%").
[*"] J. Geweke, “Evaluating the accuracy of sampling-basedapproaches to the calculation of posterior moments,” inProceedings of the #th Valencia International Meeting onBayesian Statistics, pp. "'&–"&#, Oxford University Press,Oxford, UK, "&&$.
[*$] M. W. Tobler and G. V. N. Powell, “Estimating jaguar densitieswith camera traps: problems with current designs and recom-mendations for future studies,” Biological Conservation, vol. "+&,pp. "%&–""(, $%").
[*)] M. E. Obbard, E. J. Howe, and C. J. Kyle, “Empirical comparisonof density estimators for large carnivores,” Journal of AppliedEcology, vol. #*, no. ", pp. *'–(#, $%"%.
[*#] B. Gardner, J. Reppucci, M. Lucherini, and J. A. Royle, “Spatiallyexplicit inference for open populations: estimating demo-graphic parameters from camera-trap studies,” Ecology, vol. &",no. "", pp. ))*'–))(), $%"%.
[*+] B. Gardner, J. A. Royle, M. T. Wegan, R. E. Rainbolt, and P. D.Curtis, “Estimating black bear density using DNA data fromhair snares,” Journal of Wildlife Management, vol. *#, no. $, pp.)"(–)$+, $%"%.
[*'] R. E. Russell, J. A. Royle, R. Desimone et al., “Estimating abun-dance of mountain lions from unstructured spatial sampling,”Journal of Wildlife Management, vol. *', no. (, pp. "++"–"+'",$%"$.
[**] A. J. Noss, B. Gardner, L. Ma3ei et al., “Comparison of densityestimationmethods formammal populationswith camera trapsin the Kaa-Iya del Gran Chaco landscape,” Animal Conserva-tion, vol. "+, no. +, pp. +$*–+)+, $%"$.
[*(] T. N. E. Gray and S. Prum, “Leopard density in post-con-ictlandscape, Cambodia: evidence from spatially explicit capture-recapture,” +e Journal of Wildlife Management, vol. *', no. ",pp. "')–"'&, $%"$.
[*&] E. Dinerstein, C. Loucks, A.Heydlau3 et al., Setting Priorities forthe Conservation and Recovery of Wild Tigers: "$$&–"$!&, $%%'.
[(%] E. Dinerstein, +e Return of the Unicornis: +e Natural His-tory and Conservation of the Greater One-Horned Rhinoceros,Columbia University Press, New York, NY, USA, $%%).
[("] J. Borah, D. Wangchuk, A. Swargowari et al., “Tigers inthe transboundary manas conservation complex: conservationimplications across borders,” PARKS, vol. "&, p. +", $%").
"$ Advances in Ecology
[($] J. T. Heinen and P. B. Yonzon, “A review of conservation issuesand programs in Nepal: from a single species focus towardbiodiversity protection,” Mountain Research and Development,vol. "#, no. ", pp. '"–*', "&&#.
[()] U. R. Bhuju, R. S. Aryal, and P. Aryal, Report on the Facts andIssues on Poaching of Mega Species and Illegal Trade in +eirParts in Nepal, Transparency International Nepal, Kathmandu,Nepal, $%%&.
[(#] D. Verıssimo, I. Fraser, J. Groombridge, R. Bristol, and D. C.MacMillan, “Birds as tourism -agship species: a case study oftropical islands,” Animal Conservation, vol. "$, no. ', pp. +#&–++(, $%%&.
[(+] K. !apa, S. Nepal, G. !apa, S. R. Bhatta, and E. Wikra-manayake, “Past, present and future conservation of the greaterone-horned rhinoceros Rhinoceros unicornis in Nepal,” Oryx,vol. #*, no. ), pp. )#+–)+", $%").
[('] E. Wikramanayake, M. McKnight, E. Dinerstein, A. Joshi,B. Gurung, and J. L. D. Smith, “Designing a conservationlandscape for tigers in human-dominated environments,” Con-servation Biology, vol. "(, no. ), pp. ()&–(##, $%%#.
[(*] E. Wikramanayake, E. Dinerstein, J. Seidensticker et al., “Alandscape-based conservation strategy to double the wild tigerpopulation,”Conservation Letters, vol. #, no. ), pp. $"&–$$*, $%"".
[((] S. M. Barber-Meyer, S. R. Jnawali, J. B. Karki et al., “In-uence ofprey depletion and human disturbance on tiger occupancy inNepal,” Journal of Zoology, vol. $(&, no. ", pp. "%–"(, $%").
[(&] M. Odden and P. Wegge, “Spacing and activity patterns ofleopards Panthera pardus in the Royal Bardia National Park,Nepal,”Wildlife Biology, vol. "", no. $, pp. "#+–"+$, $%%+.

Submit your manuscripts athttp://www.hindawi.com
Forestry ResearchInternational Journal of
Hindawi Publishing Corporationhttp://www.hindawi.com Volume 2014
Environmental and Public Health
Journal of
Hindawi Publishing Corporationhttp://www.hindawi.com Volume 201
Hindawi Publishing Corporationhttp://www.hindawi.com Volume 201
EcosystemsJournal of
Meteorology
Hindawi Publishing Corporationhttp://www.hindawi.com Volume 201
Advances in
EcologyInternational Journal of
Hindawi Publishing Corporationhttp://www.hindawi.com Volume 201
Marine BiologyJournal of
Hindawi Publishing Corporationhttp://www.hindawi.com Volume 201
+LQGDZL�3XEOLVKLQJ�&RUSRUDWLRQKWWS���ZZZ�KLQGDZL�FRP
$SSOLHG�(QYLURQPHQWDO6RLO�6FLHQFH
9ROXPH�����
Advances in
Hindawi Publishing Corporationhttp://www.hindawi.com Volume 201
Environmental Chemistry
Atmospheric SciencesInternational Journal of
Hindawi Publishing Corporationhttp://www.hindawi.com Volume 201
Hindawi Publishing Corporationhttp://www.hindawi.com Volume 201
Waste ManagementJournal of
Hindawi Publishing Corporation http://www.hindawi.com Volume 201�
International Journal of
*HRSK\VLFV
Hindawi Publishing Corporationhttp://www.hindawi.com
Volume 201
Geological ResearchJournal of
EarthquakesJournal of
Hindawi Publishing Corporationhttp://www.hindawi.com Volume 2014
Hindawi Publishing Corporationhttp://www.hindawi.com
Volume 2014
BiodiversityInternational Journal of
ScientificaHindawi Publishing Corporationhttp://www.hindawi.com Volume 2014
OceanographyInternational Journal of
Hindawi Publishing Corporationhttp://www.hindawi.com Volume 201
The Scientific World JournalHindawi Publishing Corporation http://www.hindawi.com Volume 2014
Journal of Computational Environmental SciencesHindawi Publishing Corporationhttp://www.hindawi.com Volume 201
Hindawi Publishing Corporationhttp://www.hindawi.com Volume 201
ClimatologyJournal of