Embed Size (px)
Citation preview
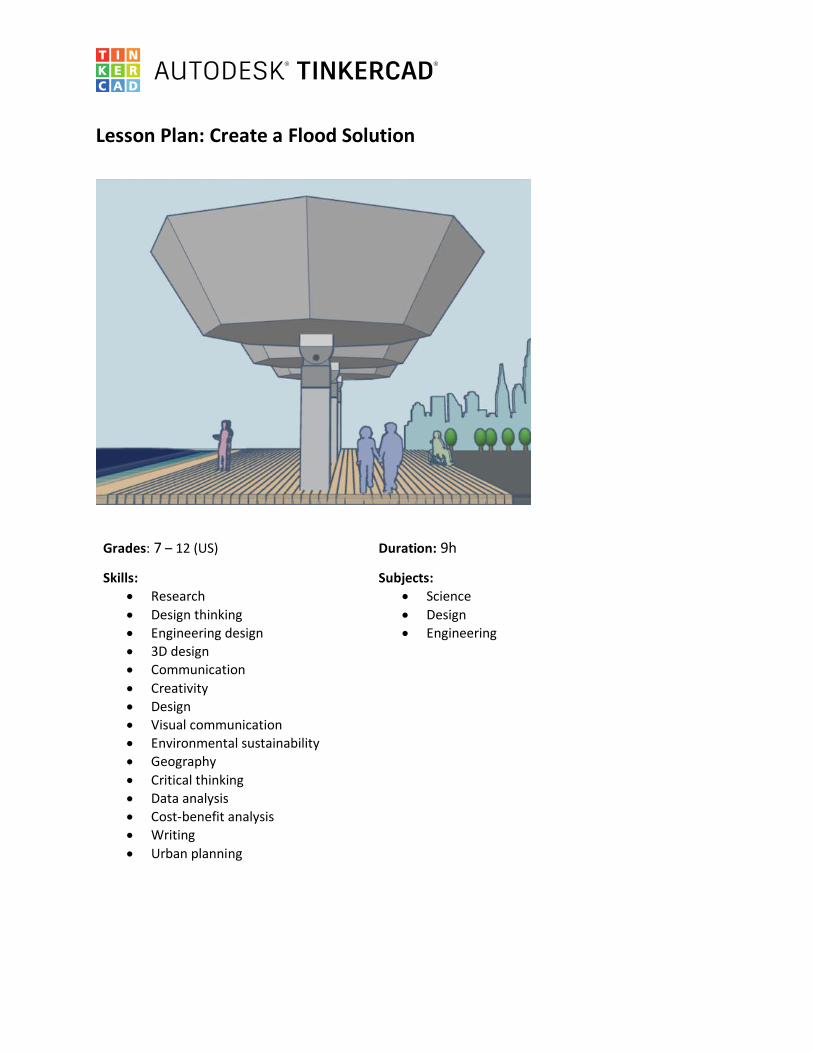
Lesson Plan: Create a Flood Solution
Grades: 7 – 12 (US) Duration: 9h
Skills: • Research
• Design thinking • Engineering design • 3D design • Communication
• Creativity • Design • Visual communication • Environmental sustainability
• Geography
• Critical thinking • Data analysis • Cost-benefit analysis • Writing
• Urban planning
Subjects: • Science
• Design • Engineering
Lesson Plan: Create a Flood Solution
2
Lesson Plan Overview
Young people can make progress now on environmental issues that impact their future by analyzing real data sets and applying critical thinking and problem-solving skills. In this lesson, students research the issue of coastal flooding and ways some regions have addressed it through building sea barriers and using other flood mitigation strategies. Next, they decide on a specific location for where to focus their solution. Using Tinkercad, they explore the forms and functions of traditional and more innovative sea barrier concepts as they ideate on their own design. Finally, they prototype and test their ideas culminating in a cost-benefit analysis of their solution. The estimated duration is provided for each unit in the lesson, giving you the flexibility to adjust as needed. This lesson requires no previous experience in 3D design or Tinkercad.
Learning Objectives
• Research the problem of coastal flooding.
• Explain and contrast approaches to coastal hazard mitigation, including innovative ways that various regions are addressing the issue.
• Make a claim about the most important factor in selecting a location for a flood intervention. • Create a 3D representation of data to support an argument. • Explore the forms and functions of traditional sea barrier designs and identify pros and cons of
each. • Create a digital prototype in Tinkercad of a flood solution.
• Test an idea through constructing a physical scale model. • Communicate a design idea to generate feedback. • Refine a solution based on feedback and by conducting a cost-benefit analysis.
Standards
• ISTE Standard 3 | Knowledge Constructor: Students critically curate a variety of resources using digital tools to construct knowledge, produce creative artifacts and make meaningful learning experiences for themselves and others.
• ISTE Standard 4 | Innovative Designer: Students use a variety of technologies within a design process to identify and solve problems by creating new, useful, or imaginative solutions.
• ISTE Standard 6 | Creative Communicator: Students communicate clearly and express themselves creatively for a variety of purposes using the platforms, tools, styles, formats, and digital media appropriate to their goals.
• MS-ETS1-1 Engineering Design: Define the criteria and constraints of a design problem with sufficient precision to ensure a successful solution, taking into account relevant scientific principles and potential impacts on people and the natural environment that may limit possible solutions.
• MS-ESS3-2 Earth and Human Activity: Analyze and interpret data on natural hazards to forecast future catastrophic events and inform the development of technologies to mitigate their effects.
• CCSS, Grades 6-8, ELA Writing: Conduct short research projects to answer a question (including a self-generated question), drawing on several sources and generating additional related, focused questions that allow for multiple avenues of exploration.
• HS-LS2-7 Ecosystems: Interactions, Energy, and Dynamics: Design, evaluate, and refine a solution for reducing the impacts of human activities on the environment and biodiversity.
Lesson Plan: Create a Flood Solution
3
• HS-ETS1-3 Engineering Design: Evaluate a solution to a complex real-world problem based on prioritized criteria and trade-offs that account for a range of constraints, including cost, safety, reliability, and aesthetics as well as possible social, cultural, and environmental impacts.
• CCSS.ELA-LITERACY.WHST.9-10.7: Conduct short as well as more sustained research projects to answer a question (including a self-generated question) or solve a problem; narrow or broaden the inquiry.
For more information about standards used in this lesson plan, visit these websites:
• ISTE: https://www.iste.org/standards/for-students • Next Generation Science Standards (NGSS):
https://www.nextgenscience.org/search-standards • Common Core (Math): http://www.corestandards.org/Math/Content/5/introduction/
Materials
This is a list of materials each student will need to complete this lesson.
• Computer or tablet with Internet and access to Tinkercad
• Prototyping materials like modeling clay, an aluminum pan, water, an empty plastic bottle, paper, tape, glue, household recyclables, craft supplies, and/or toy bricks.
• Slideshow software, like Google Slides, PowerPoint, or Keynote (optional) • Computer mouse (optional) • 3D printer and supplies (optional) • Files included in this lesson
Lesson Plan: Create a Flood Solution
4
You’ll find links below where you can directly download and print files from the Tinkercad Lesson Plan page (https://www.tinkercad.com/lessonplans/design-a-flood-solution) that your students will need for this lesson.
• Evaluation Rubric [PDF with fillable text fields] • Florida Flood Simulation video [mp4] • Research the Problem slideshow [PPTX] • Flood Research Graphic Organizer [PDF with fillable text fields]
• Explore Existing Solutions slideshow [PPTX]
• Princeton Seawall Tinkercad file [link to Tinkercad] • Select a Location slideshow [PPTX] • Map Making video [mp4] • Neighborhood Map of Boston Tinkercad file [link to Tinkercad] • Tinkercad tutorials [link to Tinkercad]
• Analyze Traditional Sea Barriers Forms [PPTX]
• Pros and Cons Graphic Organizer [PDF] • Tinkercad Starters [link to Tinkercad] • Make a Physical Prototype slideshow [PPTX] • Design Critique Protocol [PDF]
• Criteria and Constraints [PDF]
• Cost-Benefit Analysis [PDF]
Setting Up Your Class
If students are working remotely, ask them to use an online tool approved by your school, such as Zoom, to collaborate with each other. If students are working in a classroom, they can complete this lesson individually. Review the list of materials, and ask students to make sure they have them on hand when they need them.
Lesson Plan: Create a Flood Solution
5
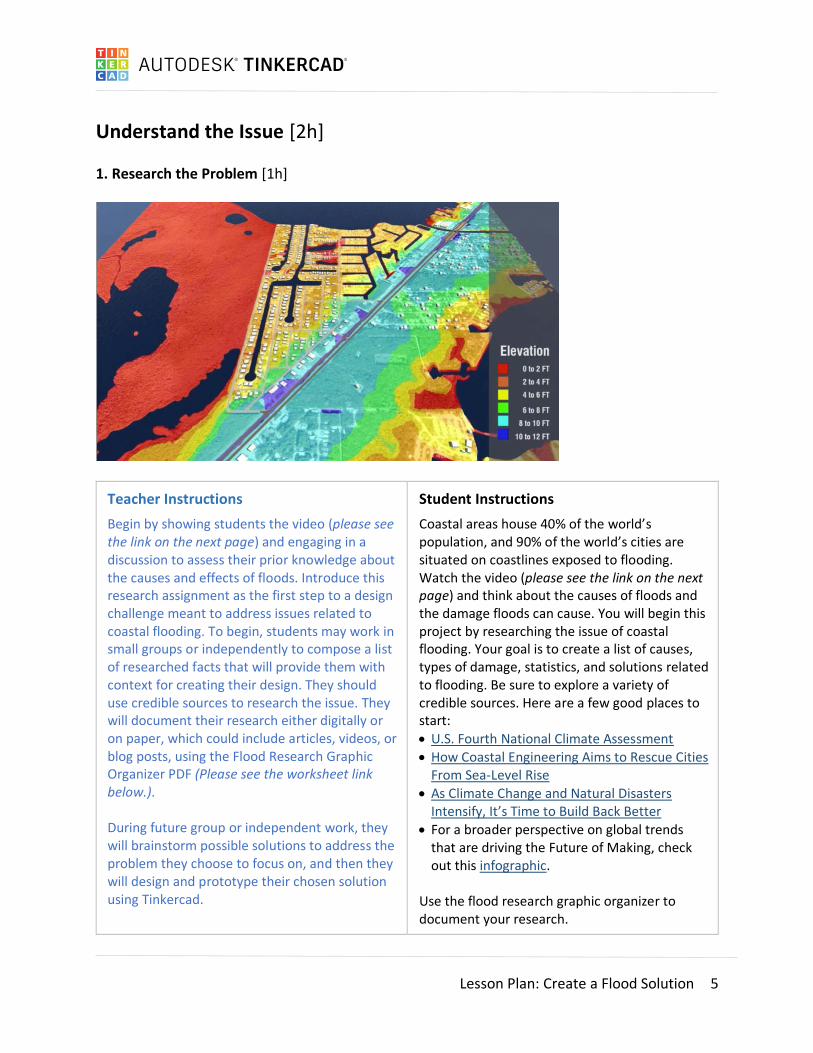
Understand the Issue [2h] 1. Research the Problem [1h]
Teacher Instructions
Begin by showing students the video (please see the link on the next page) and engaging in a discussion to assess their prior knowledge about the causes and effects of floods. Introduce this research assignment as the first step to a design challenge meant to address issues related to coastal flooding. To begin, students may work in small groups or independently to compose a list of researched facts that will provide them with context for creating their design. They should use credible sources to research the issue. They will document their research either digitally or on paper, which could include articles, videos, or blog posts, using the Flood Research Graphic Organizer PDF (Please see the worksheet link below.). During future group or independent work, they will brainstorm possible solutions to address the problem they choose to focus on, and then they will design and prototype their chosen solution using Tinkercad.
Student Instructions
Coastal areas house 40% of the world’s population, and 90% of the world’s cities are situated on coastlines exposed to flooding. Watch the video (please see the link on the next page) and think about the causes of floods and the damage floods can cause. You will begin this project by researching the issue of coastal flooding. Your goal is to create a list of causes, types of damage, statistics, and solutions related to flooding. Be sure to explore a variety of credible sources. Here are a few good places to start: • U.S. Fourth National Climate Assessment • How Coastal Engineering Aims to Rescue Cities
From Sea-Level Rise
• As Climate Change and Natural Disasters Intensify, It’s Time to Build Back Better
• For a broader perspective on global trends that are driving the Future of Making, check out this infographic.
Use the flood research graphic organizer to document your research.
Lesson Plan: Create a Flood Solution
6
Materials: • Computers or tablets with Internet and access to Tinkercad
• Florida Flood Simulation video [mp4]
• Research the Problem slideshow [PPTX] • Flood Research Graphic Organizer [PDF with fillable text fields]
Lesson Plan: Create a Flood Solution
7
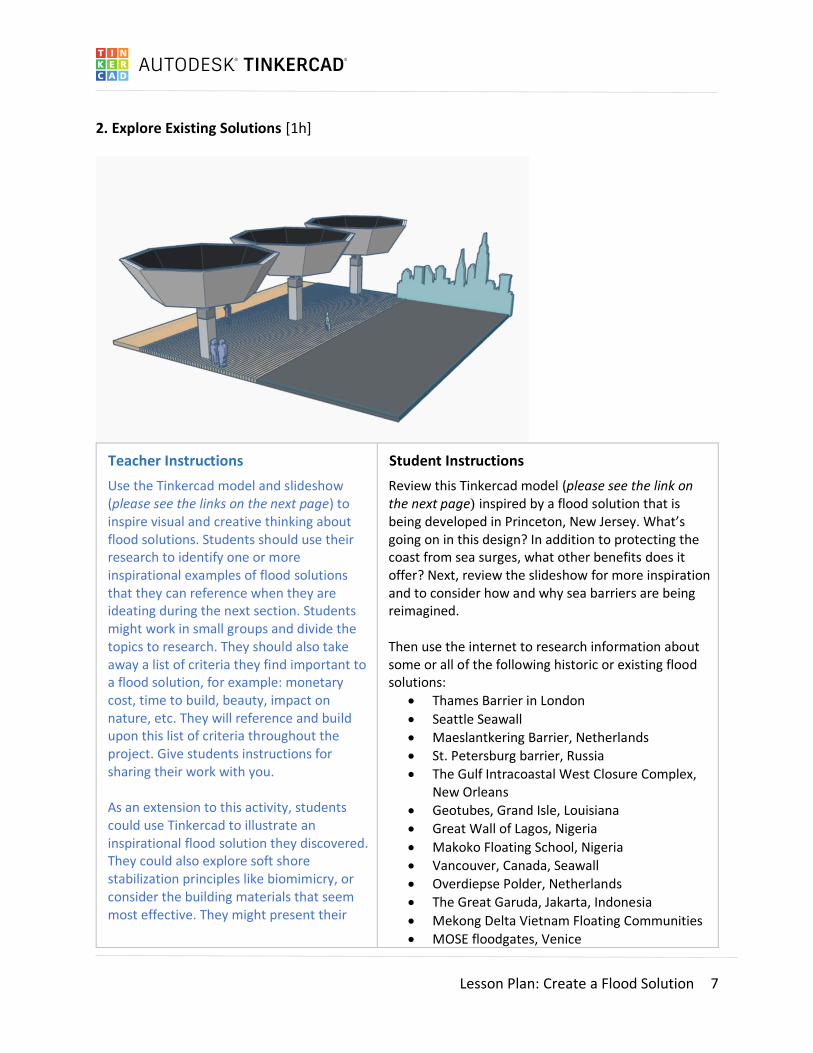
2. Explore Existing Solutions [1h]
Teacher Instructions
Use the Tinkercad model and slideshow (please see the links on the next page) to inspire visual and creative thinking about flood solutions. Students should use their research to identify one or more inspirational examples of flood solutions that they can reference when they are ideating during the next section. Students might work in small groups and divide the topics to research. They should also take away a list of criteria they find important to a flood solution, for example: monetary cost, time to build, beauty, impact on nature, etc. They will reference and build upon this list of criteria throughout the project. Give students instructions for sharing their work with you. As an extension to this activity, students could use Tinkercad to illustrate an inspirational flood solution they discovered. They could also explore soft shore stabilization principles like biomimicry, or consider the building materials that seem most effective. They might present their
Student Instructions
Review this Tinkercad model (please see the link on the next page) inspired by a flood solution that is being developed in Princeton, New Jersey. What’s going on in this design? In addition to protecting the coast from sea surges, what other benefits does it offer? Next, review the slideshow for more inspiration and to consider how and why sea barriers are being reimagined. Then use the internet to research information about some or all of the following historic or existing flood solutions:
• Thames Barrier in London
• Seattle Seawall • Maeslantkering Barrier, Netherlands • St. Petersburg barrier, Russia • The Gulf Intracoastal West Closure Complex,
New Orleans • Geotubes, Grand Isle, Louisiana • Great Wall of Lagos, Nigeria
• Makoko Floating School, Nigeria • Vancouver, Canada, Seawall • Overdiepse Polder, Netherlands
• The Great Garuda, Jakarta, Indonesia
• Mekong Delta Vietnam Floating Communities • MOSE floodgates, Venice
Lesson Plan: Create a Flood Solution
8
findings to a small group or to the whole class.
• Windmills, Netherlands
• Terp building
• Artificial oyster reefs • Berms, wetlands restoration, and raised parks
Choose the example that is most inspirational to you. Describe it and explain why. Be sure to contrast this solution with other solutions. Your teacher will give you instructions for sharing your work. As an extension to this activity, you might also recreate your chosen flood solution in Tinkercad to better understand how it works. In addition, you might explore innovative uses of materials, such as this example: https://redshift.autodesk.com/plastic-roads/ Did you know that barrier islands have been shown to be naturally resilient in response to relative sea-level rise? Find inspiration in nature by learning about barrier islands: https://oceanservice.noaa.gov/facts/barrier-islands.html
Materials:
• Computers or tablets with Internet and access to Tinkercad • Explore Existing Solutions slideshow [PPTX]
• Princeton Seawall Tinkercad file [Link to Tinkercad file; login required.)
Outcome:
• Explain and contrast approaches to coastal hazard mitigation, including innovative ways that various regions are addressing the issue.
Lesson Plan: Create a Flood Solution
9
Define Design Constraints [1h 30m] 3. Select a Location [1h]
Teacher Instructions
Use the slideshow (please see the link on the next page) as a guide for launching students into research that will support them in selecting a place for their design. They might use Google Maps or Bing Maps. They might also supplement their research through searching local census data by zip code. Climate and historical weather data and information can be searched by using NASA’s Advanced Data Access Tool: https://www.globe.gov/globe-data/retrieve-data If your students are not located in a coastal area or wish to learn more about a coastal city that is under threat due to sea-rise and storm surges, this step links to resources about the city of Boston, including a searchable 3D model of the city and a comprehensive plan for how the city will continue to thrive while adapting to long-term climate change. Students should be able to make a claim about the most important factor in choosing a location for a flood intervention. They should be as specific as possible and use their research as evidence to support their claim. Please give them instructions for sharing their work.
Student Instructions
Review the slideshow (please see the link on the next page) and respond to the opening quotation on slide 3. How can we address the needs of socially vulnerable groups when we are designing? Refer to the “needs statement” template in the slide to think about how a designer might gather the information it requires. Where will you locate your flood solution? Will it be a large offshore solution, or a layered solution like berms, wetlands restoration, and raised parks? Historically, layered solutions tend to benefit wealthy areas first, while larger offshore solutions tend to cause pollution or disrupt sea life by trapping sediment. If you’re not in a coastal area, or are having trouble identifying an area of focus, you might consider using the city of Boston, as it is an area of high risk for both sea-level rise and storm surges. Here are some resources to help you learn more about Boston:
• Boston Citywide 3D Model
• Climate Ready Boston Report • Feasibility of Harbor-wide Barrier
Systems Additionally, you might also use this resource to research climate and historical weather data and information: https://www.globe.gov/globe-data/retrieve-data You will need to be as specific as possible in identifying a location for your flood solution and the neighborhoods it would most affect. Keep in mind that sea barrier systems often inadvertently disproportionately impact socially vulnerable populations.
Lesson Plan: Create a Flood Solution
10
Use census and other data to create a profile of the people in the affected area. Use climate and historical weather data information to make predictions about future catastrophic events in the area. Review all the data and the facts you researched. Which factor is the most compelling reason for where to locate the flood intervention? Refer to your list of criteria from the previous step. Do these criteria still apply? Which seem most important? Which new criteria might you add, or which criteria might you take away? Your teacher will give you instructions for sharing your thoughts and work.
Materials:
• Computers or tablets with Internet and access to Tinkercad • Select a Location slideshow [PPTX]
Outcome:
• Make a claim about the most important factor in selecting a location for a flood intervention.
Lesson Plan: Create a Flood Solution
11
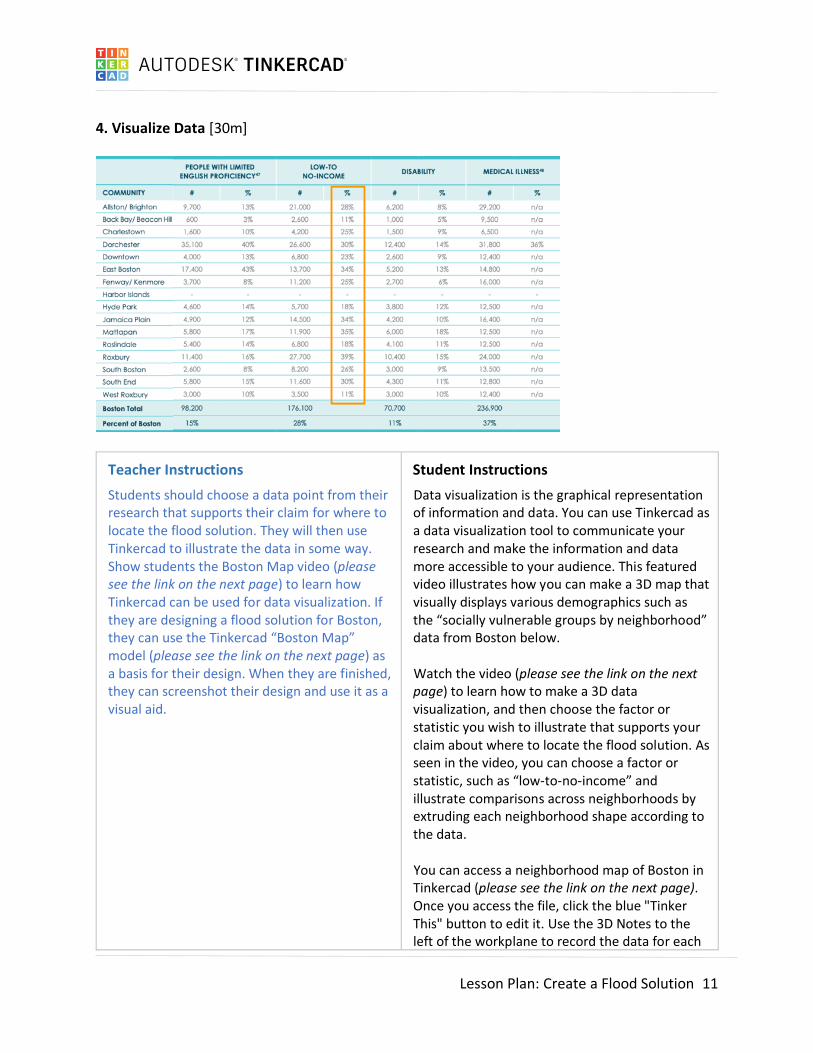
4. Visualize Data [30m]
Teacher Instructions
Students should choose a data point from their research that supports their claim for where to locate the flood solution. They will then use Tinkercad to illustrate the data in some way. Show students the Boston Map video (please see the link on the next page) to learn how Tinkercad can be used for data visualization. If they are designing a flood solution for Boston, they can use the Tinkercad “Boston Map” model (please see the link on the next page) as a basis for their design. When they are finished, they can screenshot their design and use it as a visual aid.
Student Instructions
Data visualization is the graphical representation of information and data. You can use Tinkercad as a data visualization tool to communicate your research and make the information and data more accessible to your audience. This featured video illustrates how you can make a 3D map that visually displays various demographics such as the “socially vulnerable groups by neighborhood” data from Boston below. Watch the video (please see the link on the next page) to learn how to make a 3D data visualization, and then choose the factor or statistic you wish to illustrate that supports your claim about where to locate the flood solution. As seen in the video, you can choose a factor or statistic, such as “low-to-no-income” and illustrate comparisons across neighborhoods by extruding each neighborhood shape according to the data. You can access a neighborhood map of Boston in Tinkercad (please see the link on the next page). Once you access the file, click the blue "Tinker This" button to edit it. Use the 3D Notes to the left of the workplane to record the data for each
Lesson Plan: Create a Flood Solution
12
neighborhood. The Notes blocks are color-coded to match the neighborhood on the map. The white shape is the water. You can hide it by selecting the shape and using the command CNTRL H. Use the light bulb icon to make it reappear. Next you will change the heights for all the neighborhoods to represent the statistic you have selected to illustrate. Click the neighborhood that you wish to edit. Then click the white box on top of the object. You will see the number 1.00 in a box to the right of it to represent 1 millimeter. The snap grid is a setting in the lower right of the canvas that allows you to adjust the precision of your commands. For example, you can change the snap to 5 millimeters to move a shape more quickly across the workplane, or you could change it to .1 millimeter in order pull out the size of a shape in smaller increments. You can also edit the grid to change the unit of measurement to inches or to resize the dimensions of the grid for compatibility with different 3D printers. Change the unit of measurement to inches. When you change the height of each object to correspond with the data, it is easier to use 10.00 as 100% and scale all your statistics from there. So, 50% would be 5.00, 20% is 2.00, etc. Once you’re finished manipulating the height of each neighborhood, take a screen shot of the design and use it as a visual aid to support the claim you are making about where to locate the flood solution.
Materials:
• Computers or tablets with Internet and access to Tinkercad • Map Making video [mp4] • Neighborhood Map of Boston Tinkercad file [Link to Tinkercad file; login required.]
Outcome:
• Create a 3D representation of data to support an argument.
Lesson Plan: Create a Flood Solution
13
Ideate Flood Solutions [2h 30m] 5. Work With Shapes in Tinkercad [30m]
Teacher Instructions
Having basic knowledge of Tinkercad will help students with this lesson. If your students aren’t yet familiar with Tinkercad, guide them through or have them independently complete the brief tutorials (please see the link below). Encourage students to use the software to explore how to place, view, move, rotate, resize, group, copy, duplicate, hide, and align different shapes.
Student Instructions
If you’re new to Tinkercad and 3D design or just need to refresh your knowledge, review these short tutorials (please see the link below). They’ll guide you through working with shapes in a 3D space, including how to place, view, move, rotate, resize, group, copy, duplicate, hide, and align different shapes. These tutorials will help you later in this lesson when you create a prototype!
Materials:
• Computers or tablets with Internet and access to Tinkercad
• Tinkercad tutorials [Link to Tinkercad; login not required.]
Outcome:
• Create a 3D model in Tinkercad.
Lesson Plan: Create a Flood Solution
14
6. Analyze Traditional Sea Barrier Forms [1h]
Teacher Instructions
Use the slideshow and embedded videos (please see the link below) as a guide for discussing the forms and functions of a variety of traditional sea barrier forms. Students should then use the internet to research the pros and cons of each form and document their research in the graphic organizer (please see the link below). An example is provided at the top.
Students might work in small groups and divide the topics to research. After completing this activity, they might use Tinkercad to synthesize their learning by replicating or remixing the traditional forms they studied. Give students instructions for sharing their work.
Student Instructions
Watch the videos in the slideshow (please see the link below) to learn about traditional sea barrier forms and how to make them in Tinkercad. These forms include:
• Wall • Dike • Recurved wall
• Stepped revetment • Rock armor or riprap
• Nearshore breakwater Then research the pros and cons of each design. Document your research in the pros and cons graphic organizer (please see the link below). Your teacher will give you instructions for sharing your work. As an extension, you might explore and remix the traditional sea barrier forms using Tinkercad.
Materials:
• Computers or tablets with Internet and access to Tinkercad • Analyze Traditional Sea Barriers Forms [PPTX] • Pros and Cons Graphic Organizer [PDF]
Outcome:
• Explore the forms and functions of traditional sea barrier designs and identify pros and cons of each.
Lesson Plan: Create a Flood Solution
15
7. Create a Digital Prototype [1h]
Teacher Instructions
Encourage students to use the software to explore 3D design skills and build their 3D digital literacy. Invite them to share their creations with their peers for feedback. Remind them to take careful notes to record feedback and reflection. You may allow them extra time to refine their designs based on feedback.
Student Instructions
Take some time to tinker with your idea. Either continue with the design you may have started in earlier steps, or start a new design. A prototype is just an early model or sample of your idea in a form that you can share for feedback. Create a digital prototype of your idea using Tinkercad. How can you capture the criteria for good flood solutions in your design? How can you make your design fit the location you have chosen? How can you improve life – either for humans, animals, or nature – in other ways through your design? You can “test” your design by sharing it with your peers for feedback. Make some notes about what worked and didn’t work. After completing your prototype in Tinkercad, capture images of your design or share the link with your teacher as instructed.
Materials:
• Computers or tablets with Internet and access to Tinkercad
Outcomes:
• Create a 3D model in Tinkercad.
Lesson Plan: Create a Flood Solution
16
Prototype, Test, and Refine [3h] 8. Make a Physical Prototype [1h]
Teacher Instructions
Use the slideshow to launch students into making a physical prototype based on their Tinkercad design. The slideshow and notes provide ideas and more specific instructions (please see the link on the next page). Before students get started on a physical model, they should place some context in their Tinkercad design – like a human or a building – so that there is a sense of scale within the digital prototype. If you have access to a 3D printer, you could print the students designs, and have them test them out by forming a beach with clay inside an aluminum pan filled with water. The 3D prints could be placed in the clay. An empty plastic bottle can be used to make waves. Students could construct paper buildings and other assets to place behind the barrier for testing purposes. Another way of doing this would be to build the design in toy bricks. Tinkercad has a Bricks feature that can assist this process. Students could also use craft supplies like toothpicks or popsicle sticks to create their flood solution. They should avoid using paper for the flood solution because it is permeable to water. If students are experimenting with floating designs, they might use this time to consider how different materials and shapes affect buoyancy. Read more about Tinkercad’s Bricks feature here.
Student Instructions
View the slideshow and read the notes for more specific instructions (please see the link on the next page). A scale model is a physical representation of an object that maintains accurate relationships between all important aspects of the model. Before you get started on your physical model, place some context in your Tinkercad design – like a human or a building – so that there is a sense of scale within your digital prototype. 3D printing is an easy way to create a physical scale model, but there are other ways too! You can start with an aluminum baking pan, some modeling clay to form your beach, and some water. If you 3D-printed your flood solution, you can place it in the modeling clay where it’s meant to connect to the land or shore. To make waves, you can use an empty plastic bottle and bob it up and down or back and forth so that the waves just hit the top of the beach. At the edge of the beach, behind the flood solution, you can place paper buildings or other assets to test how well your flood solution is protecting them. If you’re experimenting with a floating design, you might use this time to consider how different materials and shapes affect buoyancy. Some alternatives to 3D printing: You can transform your Tinkercad design into Bricks to get a sense of how you might build a physical scale model of your design. Along with toy bricks, another way you might build a physical scale model of your design is with craft supplies or household items. Tinkercad’s “Making at Home” parts collection includes 3D models of ordinary household items like toothpicks and popsicle sticks that are sized to their real-life dimensions.
Lesson Plan: Create a Flood Solution
17
Provide students with instructions for how to share their work with you.
Gather some materials and make a physical prototype of your Tinkercad design. Try your best to maintain scale. Prototyping materials could include modeling clay, an aluminum pan, water, an empty plastic bottle, toothpicks, popsicle sticks, tape, glue, household recyclables, craft supplies, and/or toy bricks. Avoid using paper for your flood solution as it permeable to water. Take some notes on how your flood solution performed. Your teacher will provide instructions for how to turn in your work.
Materials:
• Computers or tablets with Internet and access to Tinkercad
• Make a Physical Prototype slideshow [PPTX] • Prototyping materials like modeling clay, an aluminum pan, water, an empty plastic bottle,
paper, tape, glue, household recyclables, craft supplies, and/or toy bricks
• Computer mouse (optional) • 3D printer and supplies (optional)
Outcome:
• Test an idea through constructing a physical scale model.
Lesson Plan: Create a Flood Solution
18
9. Communicate Your Design Idea [1h]
Teacher Instructions
Give students time to review the Design Critique Protocol (please see the link on the next page) and to prepare for when they will be the Presenter. You may assign students to create a formal presentation using presentation software, or they may present more informally. Depending on your schedule and class size, you may conduct a whole-class critique in which each student presents their design to the whole group, or you may break your class up into small groups in which a rotation of roles is assigned: Presenter, Facilitator, Critiquer. Instructions for how a design critique could be facilitated are included in the Design Critique Protocol PDF. If you’re acting as the Facilitator, you might have your own goals around building community, promoting collaboration within the group, or helping strengthen confidence. You might also reinforce that a critique is a common professional practice that brings together multiple designers who work on different parts of a big project.
This is a great opportunity to invite outside guests such as design industry professionals, environmental scientists, or other community members to provide feedback. You might ask students to submit their presentation, notes, or a short written reflection to you after the critique is finished.
Student Instructions
Now it’s time for design critique! Learning to critique design effectively is a way to become a better designer. Not only will it help you be a more skillful critic of your own work, but through presenting your ideas while helping others analyze their designs, you will also become a better communicator too! Of course, hearing someone say something negative about your work can be difficult at first, but remember that design is meant to be iterative—a cycle of continued improvement through testing an idea and learning from each phase as the design evolves or changes. Failure is a necessary part of the process. The purpose of a critique is shared learning—for all who are involved to learn from the design and to explore where it works well and where it could be refined. When critiquing someone else’s work, remember to be specific, helpful, and kind. When someone offers you advice, you don’t have to follow it… but make sure you’re listening! Listening and taking notes will help you think more deeply about the goals of your design, how to address the problem at the heart of your design, and even how to inspire others to care about your work. Use the Design Critique Protocol PDF to help you prepare for the design critique (please see the link on the next page). Your teacher will give you further instructions for how to get started and how to turn in your work, which could include a presentation, notes, or a brief written reflection.
Materials:
• Computers or tablets with Internet and access to Tinkercad
• Design Critique Protocol [PDF]
• Slideshow software like Google Slides, PowerPoint, or Keynote (optional)
Lesson Plan: Create a Flood Solution
19
Outcome:
• Communicate a design idea to generate feedback.
Lesson Plan: Create a Flood Solution
20
10. Refine Your Design [1h]
Teacher Instructions
Students should follow the instructions provided to conduct a cost-benefit analysis of their design. They may use the Criteria and Constraints PDF to finalize their criteria list and set up parameters (please see the link below). They should use the Cost-Benefit Analysis graphic organizer to document their work. You may assign students to write a final report or presentation to explain their evaluation.
Student Instructions
Gather all your notes and work that you have produced throughout this project. Take some time to review and reflect. Next, refine your list of criteria (positive qualities or goals) to three to five that you think are most important. Review the Criteria and Constraints handout for help in finalizing this list. Then use the Cost-Benefit Analysis graphic organizer to evaluate your design based on the criteria and parameters you have selected (please see the link below). An example is provided at the top. Your teacher may assign you to write a final report or presentation to explain your evaluation.
Materials:
• Computers or tablets with Internet and access to Tinkercad
• Criteria and Constraints [PDF] • Cost-Benefit Analysis [PDF]
Outcome:
• Refine the solution based on feedback and by conducting a cost-benefit analysis.