Embed Size (px)
Citation preview
Light Sheet Microscopy for Tracking Single Molecules on the ApicalSurface of Living CellsYu Li, Ying Hu, and Hu Cang*
Waitt Advanced Biophotonics Center, Salk Institute for Biological Studies, La Jolla, California 92037, United States
*S Supporting Information
ABSTRACT: Single particle tracking is a powerful tool to study single molecule dynamics inliving biological samples. However, current tracking techniques, which are based mainly onepifluorescence, confocal, or TIRF microscopy, have difficulties in tracking single molecules onthe apical surface of a cell. We present here a three-dimensional (3D) single particle trackingtechnique that is based on prism coupled light-sheet microscopy (PCLSM). This novel designprovides a signal-to-noise ratio comparable to confocal microscopy while it has the capability ofilluminating at arbitrary depth. We demonstrate tracking of single EGF molcules on the apicalsurface of live cell membranes from their binding to EGF receptors until they are internalized orphotobleached. We found that EGF exhibits multiple diffusion behaviors on live A549 cellmembranes. At room temperature, the average diffusion coefficient of EGF on A549 cells wasmeasured to be 0.13 μm2/s. Depletion of cellular cholesterol with methyl-β-cyclodextrin leads toa broader distribution of diffusion coefficients and an increase of the average diffusion coefficientat room temperature. This light-sheet based 3D single particle tracking technique solves thetechnique difficulty of tracking single particles on apical membranes and is able to document the whole “lifetime” of a particlefrom binding till photobleaching or internalization.
■ INTRODUCTION
Single-molecule tracking is an important tool to investigatedynamic processes in living cells. By following the motion ofindividual molecules, one can capture and characterizebiological events with high temporal and spatial resolution.Analyzing the trajectories of the tracked molecules providesdirect information of the interactions between a molecule andits environment. Rare and unsynchronized events, which aretypical for most biological processes and often overwhelmed inensemble experiments, can be recovered from single moleculetracking. Single molecule tracking has greatly advanced ourunderstanding of various biological systems at the singlemolecule level including virus−host interactions,1,2 protein−DNA interactions,3 gene expression,4 and ligand−receptorinteractions.5 However, catching the initial ligand/receptorbinding events on the apical surface of a membrane remainschallenging.Biological membranes, which are composed of a thin bilayer
of lipids and membrane proteins, provide an essentialcompartment that separates cells from their environment.Depending upon the specific type and location of a biologicalmembrane, the percentage of protein mass within a membranecan vary from 18% to 76%.6 Three major types of membraneproteins are receptors, transport proteins, and enzymes; and ithas been estimated that more than 27% of human genes encodetransmembrane proteins.7 Surveys on current pharmaceuticalproducts indicate membrane proteins constitute more than50% of modern drug targets of all FDA-approved therapeu-tics8,9 Despite their importance, membrane proteins are farfrom well understood. The plasma membranes of polarized
epithelial cells can be divided into distinct regions named apical(top), basal (bottom), and lateral (side) surfaces.6 Thecompositions of apical and basolateral surfaces are quitedifferent owing to their distinct functional requirements andenvironments. A good example is the nonuniform distributionof transport proteins in epithelial cells of mammalian intestine.At the apical surface, a Na+-linked symporter protein activelytransports glucose against concentration gradients into the cell,while a uniport protein located at the basolateral surfacemediates glucose passive transportation down its concentrationgradient independent of Na+.10,11 In additional to the differencein membrane protein composition, the apical surface ofintestine epithelial cells also has higher ratio of sphingolipidin its lipid composition.6,12 The prevalence of cell polarityrequires studying of both apical and basal surfaces.Currently, the three fluorescence microscopy setups most
commonly used in single molecule tracking studies areepifluorescence microscopy, confocal microscopy, and totalinternal reflection fluorescence (TIRF) microscopy (Figure 1).A wide field epifluorescence microscopy allows single moleculesto be tracked within a large sample volume but suffers from apoor signal-to-noise ratio (SNR).2 Confocal microscopy caneffectively reject background fluorescence and track particles inthree dimensions. However, its temporal resolution is oftenlimited because mechanical motions are involved during
Special Issue: Michael D. Fayer Festschrift
Received: May 31, 2013Revised: July 22, 2013Published: July 29, 2013
Article
pubs.acs.org/JPCB
© 2013 American Chemical Society 15503 dx.doi.org/10.1021/jp405380g | J. Phys. Chem. B 2013, 117, 15503−15511
particle tracking.13−15 TIRF microscopy provides superior SNRand is deployed widely to study biological systems, but thistechnique can only illuminate a few hundred nanometers intothe surface of the cover glass and has no access to apicalmembranes of cells.Recently, light sheet microscopy is gaining in popularity in
developmental biology and neuroscience studies.16−20 Firstdeveloped in 1903,21 light sheet microscopy generates a thinlayer of illumination that effectively rejects out of focusfluorescence, hence greatly improving SNR achievable for tissuesamples.22−24 This potential improvement in SNR makes lightsheet microscopy an attractive technique for single moleculestudies, which so far have heavily relied on TIRF microscopyand largely limited to structures and processes close tomammalian cell membranes. To extend light sheet microscopyto single cell and single molecule studies, a common strategy isto arrange two high numerical aperture (NA) lensesorthogonally,25,26 which often imposes significant spatialconstraint and makes it impossible to access a single
mammalian cell. Recently, a light sheet illumination schemebased on reflection, named reflected light sheet microscopy(RLSM), has been reported.3 RLSM successfully releases thepreviously mentioned geometry constraint and requires nospecial sample chambers. The resulting excellent SNR hasenabled the authors to image single fluorescent proteins withinthe nuclei of mammalian cells. However, this setup is ratherdifficult to implement and its optical stability is a potentialissue. Here, we report a novel strategy to implement light sheetillumination by placing a Pellin−Broca prism after theillumination objective and tilting the sample stage (Figure1d). This design provides significant spatial flexibility forsample placement such that no special imaging chamber isneeded. The diffraction limited light sheet generated by oursetup minimizes phototoxicity to live samples and effectivelysuppresses background fluorescence. The SNR of our lightsheet microscope allows detection of single fluorescentmolecules including small organic fluorophores and fluorescentproteins. This design also allows horizontal sectioning, leadingto much larger field of view compared to HILO microscopy.27
The setup is physically stable and easy to implement. Asdemonstrate in this paper, these combined benefits allow us totrack a single EGF particle on the apical membrane of livingcells from its binding to EGFR until the molecule is internalizedor photobleached.EGFR is a typical receptor tyrosine kinase. It belongs to the
ErbB receptor family, which includes ErbB1 (EGFR), ErbB2,ErbB3, and ErbB4.28 Abnormal signaling of ErbB receptors hasbeen identified in a variety of epithelial cancers, and severalanticancer therapies targeting ErbB receptors have beendeveloped.29 Current understanding is that EGF can bind toeither monomeric or inactive, preformed dimers of EGFR,30
causing a conformation change that results in asymmetric dimerformation.31 These asymmetric dimers then autophosphorylatein trans,32 leading to activation of downstream signal cascades.Biochemistry studies have confirmed that EGFR can form bothhomodimers and heterodimers with other members in ErbBfamily receptors.33,34 ErbB2 does not have any known ligandbut is the preferred dimerization partner of all other receptorsin the ErbB family.33 Using EGF and ErbB receptors as a model
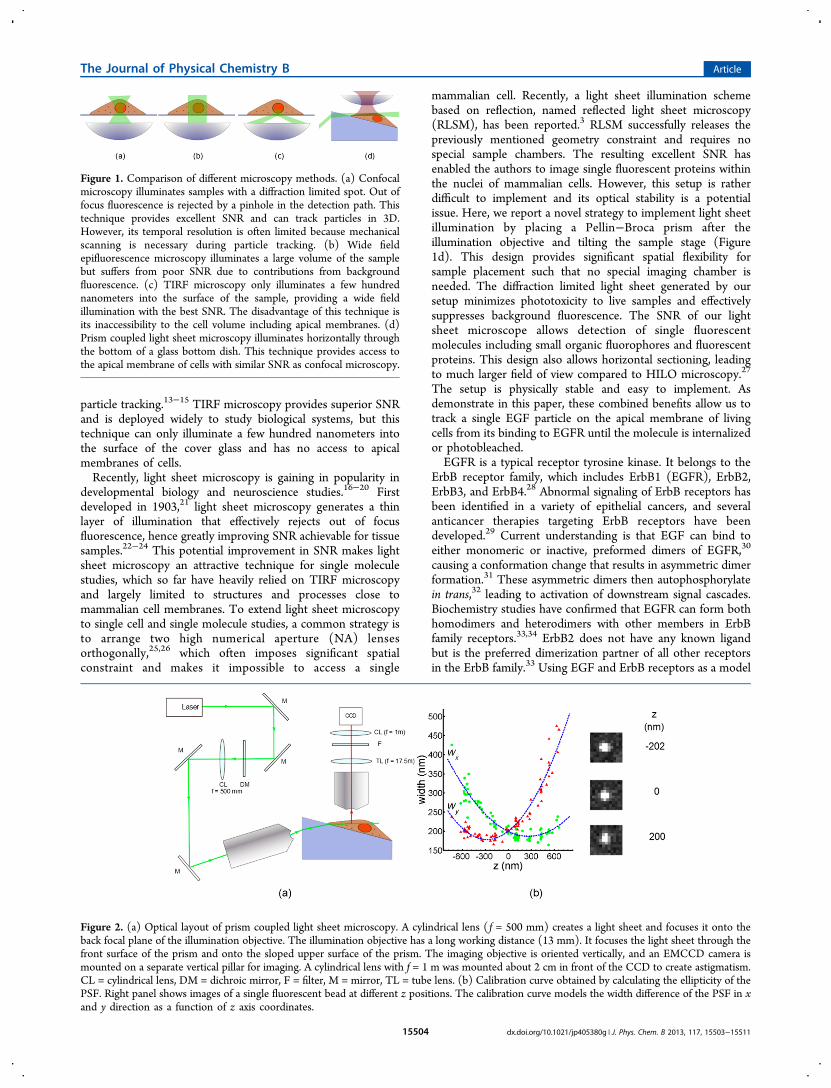
Figure 1. Comparison of different microscopy methods. (a) Confocalmicroscopy illuminates samples with a diffraction limited spot. Out offocus fluorescence is rejected by a pinhole in the detection path. Thistechnique provides excellent SNR and can track particles in 3D.However, its temporal resolution is often limited because mechanicalscanning is necessary during particle tracking. (b) Wide fieldepifluorescence microscopy illuminates a large volume of the samplebut suffers from poor SNR due to contributions from backgroundfluorescence. (c) TIRF microscopy only illuminates a few hundrednanometers into the surface of the sample, providing a wide fieldillumination with the best SNR. The disadvantage of this technique isits inaccessibility to the cell volume including apical membranes. (d)Prism coupled light sheet microscopy illuminates horizontally throughthe bottom of a glass bottom dish. This technique provides access tothe apical membrane of cells with similar SNR as confocal microscopy.
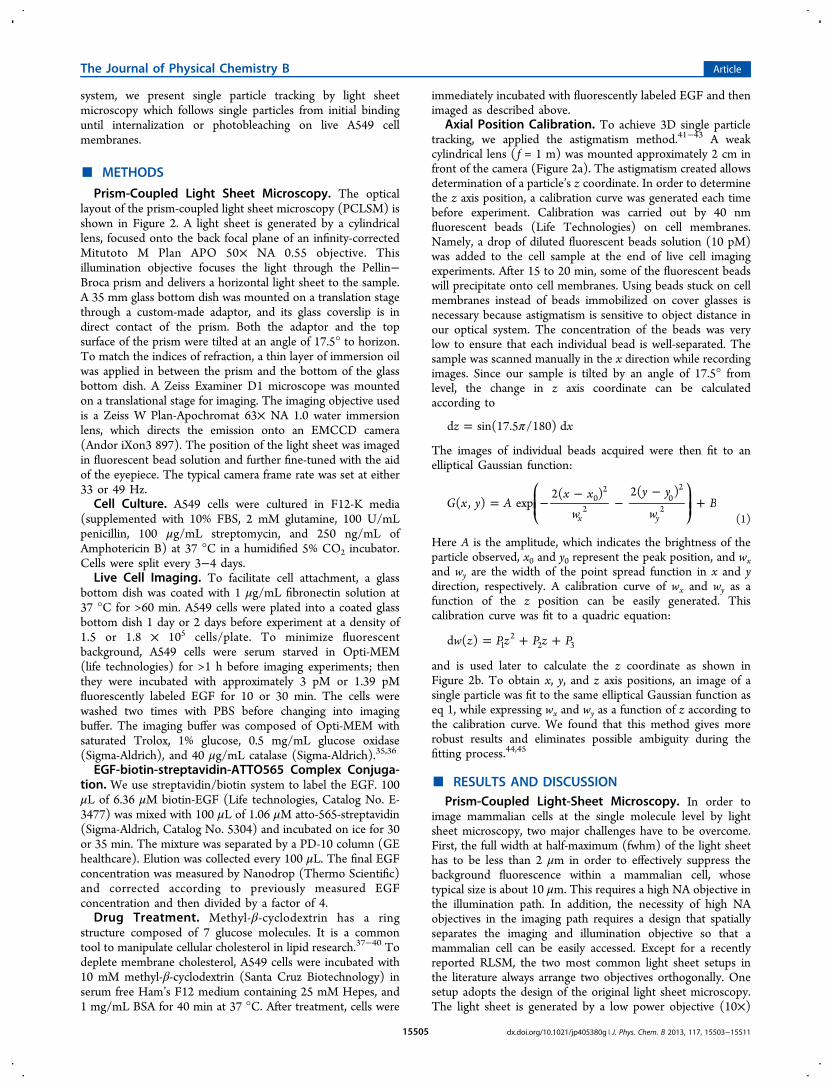
Figure 2. (a) Optical layout of prism coupled light sheet microscopy. A cylindrical lens ( f = 500 mm) creates a light sheet and focuses it onto theback focal plane of the illumination objective. The illumination objective has a long working distance (13 mm). It focuses the light sheet through thefront surface of the prism and onto the sloped upper surface of the prism. The imaging objective is oriented vertically, and an EMCCD camera ismounted on a separate vertical pillar for imaging. A cylindrical lens with f = 1 m was mounted about 2 cm in front of the CCD to create astigmatism.CL = cylindrical lens, DM = dichroic mirror, F = filter, M = mirror, TL = tube lens. (b) Calibration curve obtained by calculating the ellipticity of thePSF. Right panel shows images of a single fluorescent bead at different z positions. The calibration curve models the width difference of the PSF in xand y direction as a function of z axis coordinates.
The Journal of Physical Chemistry B Article
dx.doi.org/10.1021/jp405380g | J. Phys. Chem. B 2013, 117, 15503−1551115504
system, we present single particle tracking by light sheetmicroscopy which follows single particles from initial bindinguntil internalization or photobleaching on live A549 cellmembranes.
■ METHODS
Prism-Coupled Light Sheet Microscopy. The opticallayout of the prism-coupled light sheet microscopy (PCLSM) isshown in Figure 2. A light sheet is generated by a cylindricallens, focused onto the back focal plane of an infinity-correctedMitutoto M Plan APO 50× NA 0.55 objective. Thisillumination objective focuses the light through the Pellin−Broca prism and delivers a horizontal light sheet to the sample.A 35 mm glass bottom dish was mounted on a translation stagethrough a custom-made adaptor, and its glass coverslip is indirect contact of the prism. Both the adaptor and the topsurface of the prism were tilted at an angle of 17.5° to horizon.To match the indices of refraction, a thin layer of immersion oilwas applied in between the prism and the bottom of the glassbottom dish. A Zeiss Examiner D1 microscope was mountedon a translational stage for imaging. The imaging objective usedis a Zeiss W Plan-Apochromat 63× NA 1.0 water immersionlens, which directs the emission onto an EMCCD camera(Andor iXon3 897). The position of the light sheet was imagedin fluorescent bead solution and further fine-tuned with the aidof the eyepiece. The typical camera frame rate was set at either33 or 49 Hz.Cell Culture. A549 cells were cultured in F12-K media
(supplemented with 10% FBS, 2 mM glutamine, 100 U/mLpenicillin, 100 μg/mL streptomycin, and 250 ng/mL ofAmphotericin B) at 37 °C in a humidified 5% CO2 incubator.Cells were split every 3−4 days.Live Cell Imaging. To facilitate cell attachment, a glass
bottom dish was coated with 1 μg/mL fibronectin solution at37 °C for >60 min. A549 cells were plated into a coated glassbottom dish 1 day or 2 days before experiment at a density of1.5 or 1.8 × 10⁵ cells/plate. To minimize fluorescentbackground, A549 cells were serum starved in Opti-MEM(life technologies) for >1 h before imaging experiments; thenthey were incubated with approximately 3 pM or 1.39 pMfluorescently labeled EGF for 10 or 30 min. The cells werewashed two times with PBS before changing into imagingbuffer. The imaging buffer was composed of Opti-MEM withsaturated Trolox, 1% glucose, 0.5 mg/mL glucose oxidase(Sigma-Aldrich), and 40 μg/mL catalase (Sigma-Aldrich).35,36
EGF-biotin-streptavidin-ATTO565 Complex Conjuga-tion. We use streptavidin/biotin system to label the EGF. 100μL of 6.36 μM biotin-EGF (Life technologies, Catalog No. E-3477) was mixed with 100 μL of 1.06 μM atto-565-streptavidin(Sigma-Aldrich, Catalog No. 5304) and incubated on ice for 30or 35 min. The mixture was separated by a PD-10 column (GEhealthcare). Elution was collected every 100 μL. The final EGFconcentration was measured by Nanodrop (Thermo Scientific)and corrected according to previously measured EGFconcentration and then divided by a factor of 4.Drug Treatment. Methyl-β-cyclodextrin has a ring
structure composed of 7 glucose molecules. It is a commontool to manipulate cellular cholesterol in lipid research.37−40 Todeplete membrane cholesterol, A549 cells were incubated with10 mM methyl-β-cyclodextrin (Santa Cruz Biotechnology) inserum free Ham’s F12 medium containing 25 mM Hepes, and1 mg/mL BSA for 40 min at 37 °C. After treatment, cells were
immediately incubated with fluorescently labeled EGF and thenimaged as described above.
Axial Position Calibration. To achieve 3D single particletracking, we applied the astigmatism method.41−43 A weakcylindrical lens ( f = 1 m) was mounted approximately 2 cm infront of the camera (Figure 2a). The astigmatism created allowsdetermination of a particle’s z coordinate. In order to determinethe z axis position, a calibration curve was generated each timebefore experiment. Calibration was carried out by 40 nmfluorescent beads (Life Technologies) on cell membranes.Namely, a drop of diluted fluorescent beads solution (10 pM)was added to the cell sample at the end of live cell imagingexperiments. After 15 to 20 min, some of the fluorescent beadswill precipitate onto cell membranes. Using beads stuck on cellmembranes instead of beads immobilized on cover glasses isnecessary because astigmatism is sensitive to object distance inour optical system. The concentration of the beads was verylow to ensure that each individual bead is well-separated. Thesample was scanned manually in the x direction while recordingimages. Since our sample is tilted by an angle of 17.5° fromlevel, the change in z axis coordinate can be calculatedaccording to
π=z xd sin(17.5 /180) d
The images of individual beads acquired were then fit to anelliptical Gaussian function:
= −−
−−
+⎛⎝⎜⎜
⎞⎠⎟⎟G x y A
x xw
y y
wB( , ) exp
2( ) 2( )
x y
02
20
2
2(1)
Here A is the amplitude, which indicates the brightness of theparticle observed, x0 and y0 represent the peak position, and wxand wy are the width of the point spread function in x and ydirection, respectively. A calibration curve of wx and wy as afunction of the z position can be easily generated. Thiscalibration curve was fit to a quadric equation:
= + +w z Pz P z Pd ( ) 12
2 3
and is used later to calculate the z coordinate as shown inFigure 2b. To obtain x, y, and z axis positions, an image of asingle particle was fit to the same elliptical Gaussian function aseq 1, while expressing wx and wy as a function of z according tothe calibration curve. We found that this method gives morerobust results and eliminates possible ambiguity during thefitting process.44,45
■ RESULTS AND DISCUSSIONPrism-Coupled Light-Sheet Microscopy. In order to
image mammalian cells at the single molecule level by lightsheet microscopy, two major challenges have to be overcome.First, the full width at half-maximum (fwhm) of the light sheethas to be less than 2 μm in order to effectively suppress thebackground fluorescence within a mammalian cell, whosetypical size is about 10 μm. This requires a high NA objective inthe illumination path. In addition, the necessity of high NAobjectives in the imaging path requires a design that spatiallyseparates the imaging and illumination objective so that amammalian cell can be easily accessed. Except for a recentlyreported RLSM, the two most common light sheet setups inthe literature always arrange two objectives orthogonally. Onesetup adopts the design of the original light sheet microscopy.The light sheet is generated by a low power objective (10×)
The Journal of Physical Chemistry B Article
dx.doi.org/10.1021/jp405380g | J. Phys. Chem. B 2013, 117, 15503−1551115505
and introduced from the side of the sample. The fluorescencesignal is collected by a high NA water-dipping or waterimmersion objective at a 90° angle to the illuminationpath.24,46,47 This type of setup can achieve a SNR that allowssuper-resolution imaging. However, the close proximity of twohigh NA objectives imposes a geometry constraint that limits itsapplication to thick biological samples, and special samplechambers are often required. The other common configurationarranges a water-dipping objective at 45° to the bottom of thesample container as illumination objective.25,26 An identicalobjective is mounted at 90° relative to the illuminationobjective. This design provides access to small sized samplessuch as mammalian cells. But a similar geometry constraintimposed by two closely arranged objective lenses restricts thechoices of objectives to be low NA ones, which are notappropriate for single molecule imaging. The recently reportedRLSM successfully releases the geometry constraint byarranging the illumination and imaging objectives vertically.3
The diffraction-limited light sheet generated by the high NAillumination objective is reflected 90° by a Ti-coated AFMcantilever and illuminates the sample horizontally. The fwhm of
RLSM is approximately 1 μm and provides an excellent SNRthat makes imaging single fluorescent protein possible.However, this illumination scheme cannot access any regioncloser than ∼2 μm from the surface of the glass bottom dish. Inaddition, the setup of RLSM is relatively difficult to implementand the AFM cantilever has the intrinsic stability issue.In this paper, we have developed a novel light sheet
microscopy that overcomes the technical difficulty of traditionallight sheet microscopy but also is easy to implement andoptically stable. In this setup, the light sheet is generated by arelay of a cylindrical lens ( f = 500 mm) and a high NA longworking distance objective (Mitutoyo M Plan APO 50× NA =0.55, working distance =13 mm). The cylindrical lens focusesthe laser beam in the vertical direction in the back focal plan ofthe illumination objective, which produces a diffraction-limitedlight sheet and leads to a significant increase of SNR. Thecrucial optical component in this setup is a Pellin−Broca prism,which is placed after the illumination objective and in directcontact with a standard glass bottom dish. Both the top surfaceof the prism and the sample stage are tilted at an angle ofapproximately 17.5° relative to horizon. This optical config-
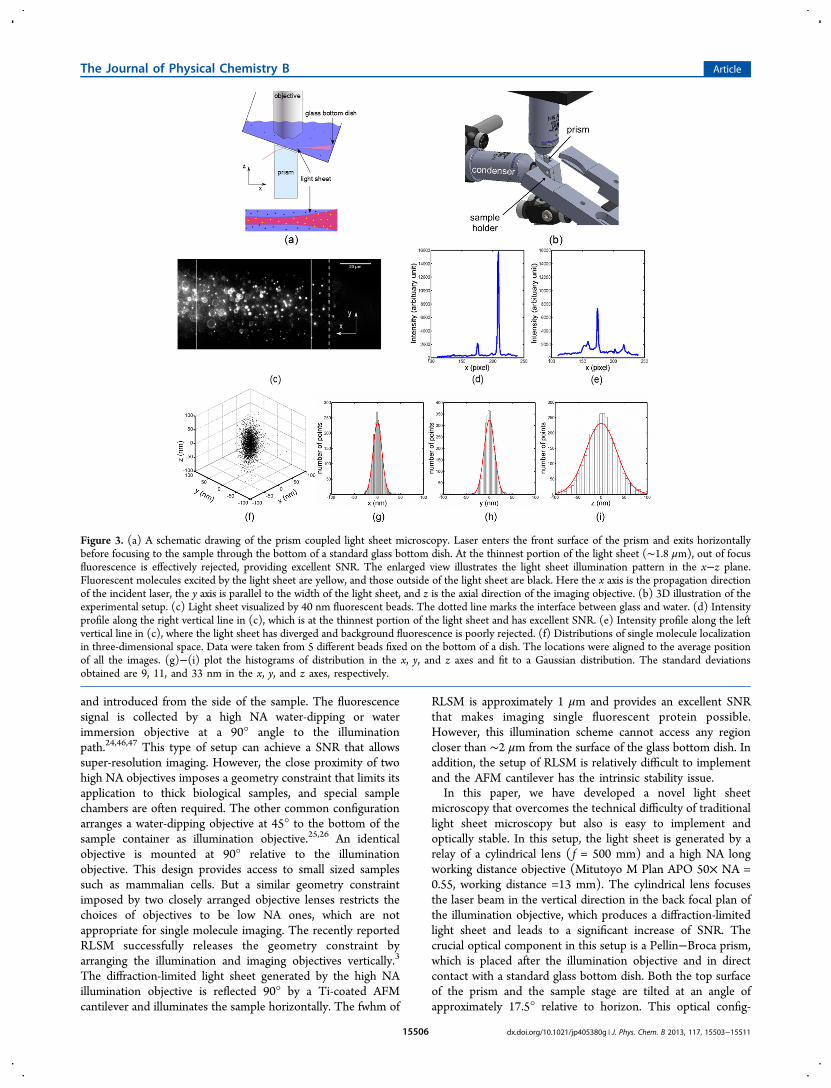
Figure 3. (a) A schematic drawing of the prism coupled light sheet microscopy. Laser enters the front surface of the prism and exits horizontallybefore focusing to the sample through the bottom of a standard glass bottom dish. At the thinnest portion of the light sheet (∼1.8 μm), out of focusfluorescence is effectively rejected, providing excellent SNR. The enlarged view illustrates the light sheet illumination pattern in the x−z plane.Fluorescent molecules excited by the light sheet are yellow, and those outside of the light sheet are black. Here the x axis is the propagation directionof the incident laser, the y axis is parallel to the width of the light sheet, and z is the axial direction of the imaging objective. (b) 3D illustration of theexperimental setup. (c) Light sheet visualized by 40 nm fluorescent beads. The dotted line marks the interface between glass and water. (d) Intensityprofile along the right vertical line in (c), which is at the thinnest portion of the light sheet and has excellent SNR. (e) Intensity profile along the leftvertical line in (c), where the light sheet has diverged and background fluorescence is poorly rejected. (f) Distributions of single molecule localizationin three-dimensional space. Data were taken from 5 different beads fixed on the bottom of a dish. The locations were aligned to the average positionof all the images. (g)−(i) plot the histograms of distribution in the x, y, and z axes and fit to a Gaussian distribution. The standard deviationsobtained are 9, 11, and 33 nm in the x, y, and z axes, respectively.
The Journal of Physical Chemistry B Article
dx.doi.org/10.1021/jp405380g | J. Phys. Chem. B 2013, 117, 15503−1551115506
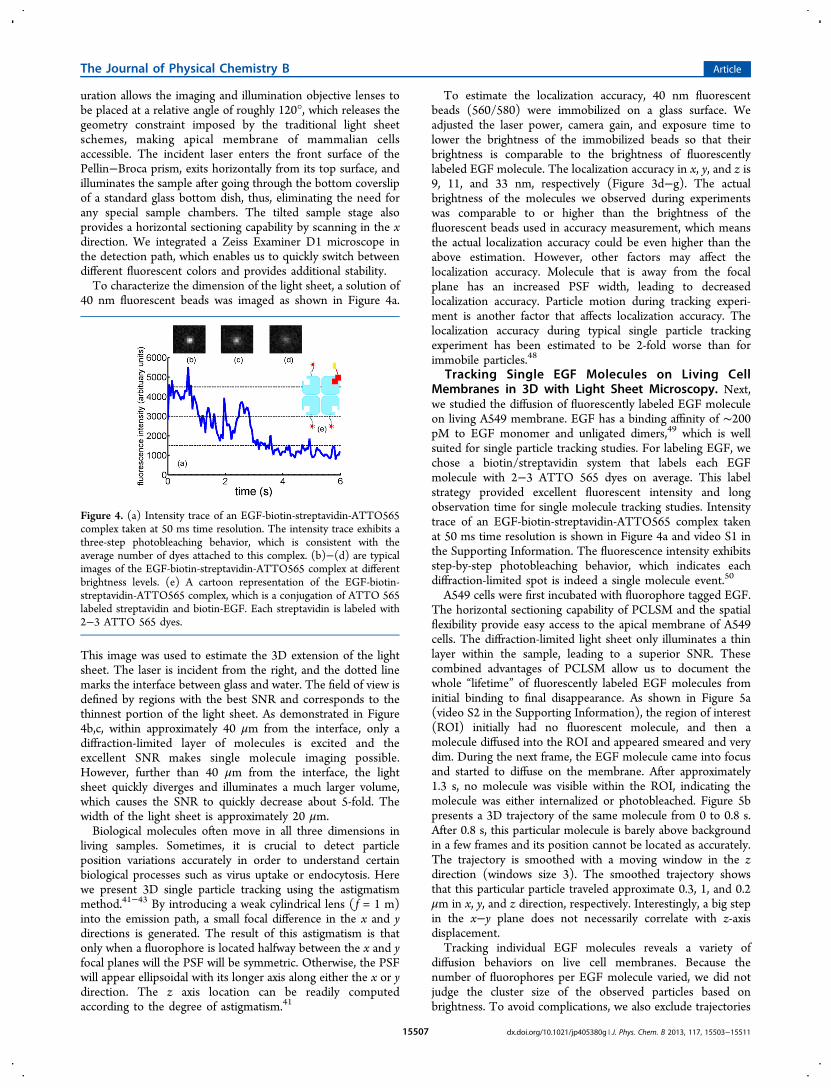
uration allows the imaging and illumination objective lenses tobe placed at a relative angle of roughly 120°, which releases thegeometry constraint imposed by the traditional light sheetschemes, making apical membrane of mammalian cellsaccessible. The incident laser enters the front surface of thePellin−Broca prism, exits horizontally from its top surface, andilluminates the sample after going through the bottom coverslipof a standard glass bottom dish, thus, eliminating the need forany special sample chambers. The tilted sample stage alsoprovides a horizontal sectioning capability by scanning in the xdirection. We integrated a Zeiss Examiner D1 microscope inthe detection path, which enables us to quickly switch betweendifferent fluorescent colors and provides additional stability.To characterize the dimension of the light sheet, a solution of
40 nm fluorescent beads was imaged as shown in Figure 4a.
This image was used to estimate the 3D extension of the lightsheet. The laser is incident from the right, and the dotted linemarks the interface between glass and water. The field of view isdefined by regions with the best SNR and corresponds to thethinnest portion of the light sheet. As demonstrated in Figure4b,c, within approximately 40 μm from the interface, only adiffraction-limited layer of molecules is excited and theexcellent SNR makes single molecule imaging possible.However, further than 40 μm from the interface, the lightsheet quickly diverges and illuminates a much larger volume,which causes the SNR to quickly decrease about 5-fold. Thewidth of the light sheet is approximately 20 μm.Biological molecules often move in all three dimensions in
living samples. Sometimes, it is crucial to detect particleposition variations accurately in order to understand certainbiological processes such as virus uptake or endocytosis. Herewe present 3D single particle tracking using the astigmatismmethod.41−43 By introducing a weak cylindrical lens ( f = 1 m)into the emission path, a small focal difference in the x and ydirections is generated. The result of this astigmatism is thatonly when a fluorophore is located halfway between the x and yfocal planes will the PSF will be symmetric. Otherwise, the PSFwill appear ellipsoidal with its longer axis along either the x or ydirection. The z axis location can be readily computedaccording to the degree of astigmatism.41
To estimate the localization accuracy, 40 nm fluorescentbeads (560/580) were immobilized on a glass surface. Weadjusted the laser power, camera gain, and exposure time tolower the brightness of the immobilized beads so that theirbrightness is comparable to the brightness of fluorescentlylabeled EGF molecule. The localization accuracy in x, y, and z is9, 11, and 33 nm, respectively (Figure 3d−g). The actualbrightness of the molecules we observed during experimentswas comparable to or higher than the brightness of thefluorescent beads used in accuracy measurement, which meansthe actual localization accuracy could be even higher than theabove estimation. However, other factors may affect thelocalization accuracy. Molecule that is away from the focalplane has an increased PSF width, leading to decreasedlocalization accuracy. Particle motion during tracking experi-ment is another factor that affects localization accuracy. Thelocalization accuracy during typical single particle trackingexperiment has been estimated to be 2-fold worse than forimmobile particles.48
Tracking Single EGF Molecules on Living CellMembranes in 3D with Light Sheet Microscopy. Next,we studied the diffusion of fluorescently labeled EGF moleculeon living A549 membrane. EGF has a binding affinity of ∼200pM to EGF monomer and unligated dimers,49 which is wellsuited for single particle tracking studies. For labeling EGF, wechose a biotin/streptavidin system that labels each EGFmolecule with 2−3 ATTO 565 dyes on average. This labelstrategy provided excellent fluorescent intensity and longobservation time for single molecule tracking studies. Intensitytrace of an EGF-biotin-streptavidin-ATTO565 complex takenat 50 ms time resolution is shown in Figure 4a and video S1 inthe Supporting Information. The fluorescence intensity exhibitsstep-by-step photobleaching behavior, which indicates eachdiffraction-limited spot is indeed a single molecule event.50
A549 cells were first incubated with fluorophore tagged EGF.The horizontal sectioning capability of PCLSM and the spatialflexibility provide easy access to the apical membrane of A549cells. The diffraction-limited light sheet only illuminates a thinlayer within the sample, leading to a superior SNR. Thesecombined advantages of PCLSM allow us to document thewhole “lifetime” of fluorescently labeled EGF molecules frominitial binding to final disappearance. As shown in Figure 5a(video S2 in the Supporting Information), the region of interest(ROI) initially had no fluorescent molecule, and then amolecule diffused into the ROI and appeared smeared and verydim. During the next frame, the EGF molecule came into focusand started to diffuse on the membrane. After approximately1.3 s, no molecule was visible within the ROI, indicating themolecule was either internalized or photobleached. Figure 5bpresents a 3D trajectory of the same molecule from 0 to 0.8 s.After 0.8 s, this particular molecule is barely above backgroundin a few frames and its position cannot be located as accurately.The trajectory is smoothed with a moving window in the zdirection (windows size 3). The smoothed trajectory showsthat this particular particle traveled approximate 0.3, 1, and 0.2μm in x, y, and z direction, respectively. Interestingly, a big stepin the x−y plane does not necessarily correlate with z-axisdisplacement.Tracking individual EGF molecules reveals a variety of
diffusion behaviors on live cell membranes. Because thenumber of fluorophores per EGF molecule varied, we did notjudge the cluster size of the observed particles based onbrightness. To avoid complications, we also exclude trajectories
Figure 4. (a) Intensity trace of an EGF-biotin-streptavidin-ATTO565complex taken at 50 ms time resolution. The intensity trace exhibits athree-step photobleaching behavior, which is consistent with theaverage number of dyes attached to this complex. (b)−(d) are typicalimages of the EGF-biotin-streptavidin-ATTO565 complex at differentbrightness levels. (e) A cartoon representation of the EGF-biotin-streptavidin-ATTO565 complex, which is a conjugation of ATTO 565labeled streptavidin and biotin-EGF. Each streptavidin is labeled with2−3 ATTO 565 dyes.
The Journal of Physical Chemistry B Article
dx.doi.org/10.1021/jp405380g | J. Phys. Chem. B 2013, 117, 15503−1551115507
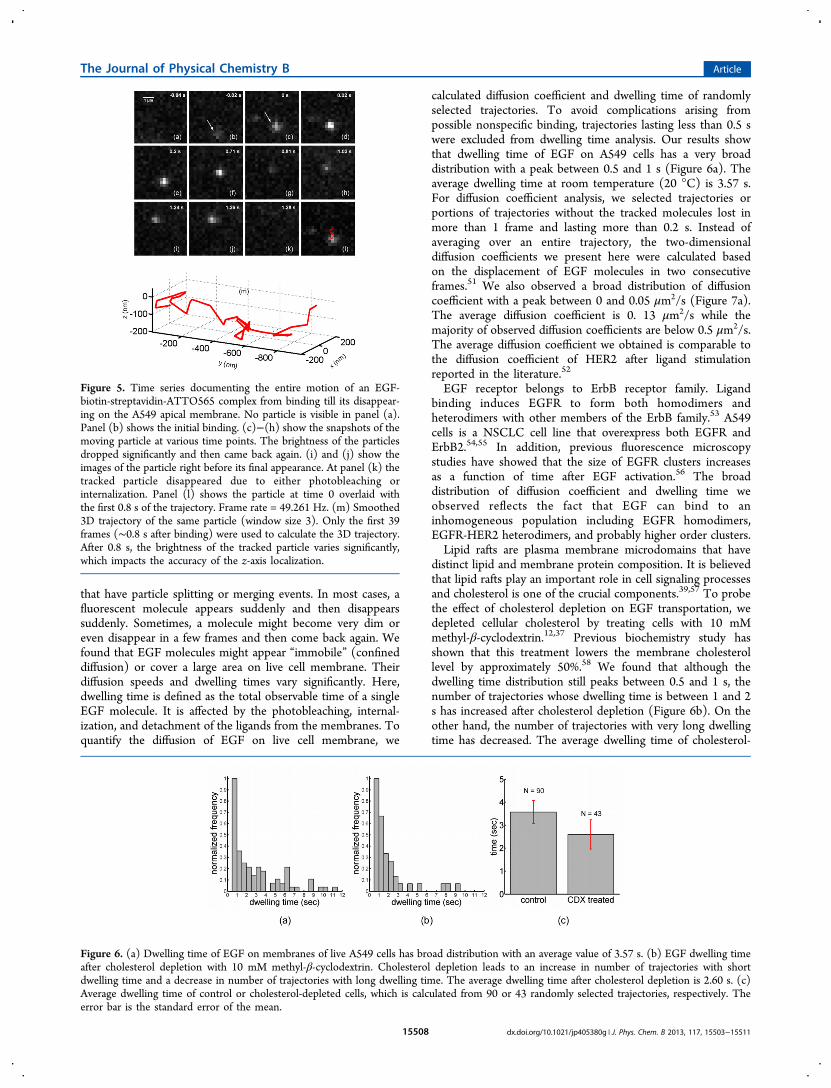
that have particle splitting or merging events. In most cases, afluorescent molecule appears suddenly and then disappearssuddenly. Sometimes, a molecule might become very dim oreven disappear in a few frames and then come back again. Wefound that EGF molecules might appear “immobile” (confineddiffusion) or cover a large area on live cell membrane. Theirdiffusion speeds and dwelling times vary significantly. Here,dwelling time is defined as the total observable time of a singleEGF molecule. It is affected by the photobleaching, internal-ization, and detachment of the ligands from the membranes. Toquantify the diffusion of EGF on live cell membrane, we
calculated diffusion coefficient and dwelling time of randomlyselected trajectories. To avoid complications arising frompossible nonspecific binding, trajectories lasting less than 0.5 swere excluded from dwelling time analysis. Our results showthat dwelling time of EGF on A549 cells has a very broaddistribution with a peak between 0.5 and 1 s (Figure 6a). Theaverage dwelling time at room temperature (20 °C) is 3.57 s.For diffusion coefficient analysis, we selected trajectories orportions of trajectories without the tracked molecules lost inmore than 1 frame and lasting more than 0.2 s. Instead ofaveraging over an entire trajectory, the two-dimensionaldiffusion coefficients we present here were calculated basedon the displacement of EGF molecules in two consecutiveframes.51 We also observed a broad distribution of diffusioncoefficient with a peak between 0 and 0.05 μm2/s (Figure 7a).The average diffusion coefficient is 0. 13 μm2/s while themajority of observed diffusion coefficients are below 0.5 μm2/s.The average diffusion coefficient we obtained is comparable tothe diffusion coefficient of HER2 after ligand stimulationreported in the literature.52
EGF receptor belongs to ErbB receptor family. Ligandbinding induces EGFR to form both homodimers andheterodimers with other members of the ErbB family.53 A549cells is a NSCLC cell line that overexpress both EGFR andErbB2.54,55 In addition, previous fluorescence microscopystudies have showed that the size of EGFR clusters increasesas a function of time after EGF activation.56 The broaddistribution of diffusion coefficient and dwelling time weobserved reflects the fact that EGF can bind to aninhomogeneous population including EGFR homodimers,EGFR-HER2 heterodimers, and probably higher order clusters.Lipid rafts are plasma membrane microdomains that have
distinct lipid and membrane protein composition. It is believedthat lipid rafts play an important role in cell signaling processesand cholesterol is one of the crucial components.39,57 To probethe effect of cholesterol depletion on EGF transportation, wedepleted cellular cholesterol by treating cells with 10 mMmethyl-β-cyclodextrin.12,37 Previous biochemistry study hasshown that this treatment lowers the membrane cholesterollevel by approximately 50%.58 We found that although thedwelling time distribution still peaks between 0.5 and 1 s, thenumber of trajectories whose dwelling time is between 1 and 2s has increased after cholesterol depletion (Figure 6b). On theother hand, the number of trajectories with very long dwellingtime has decreased. The average dwelling time of cholesterol-
Figure 5. Time series documenting the entire motion of an EGF-biotin-streptavidin-ATTO565 complex from binding till its disappear-ing on the A549 apical membrane. No particle is visible in panel (a).Panel (b) shows the initial binding. (c)−(h) show the snapshots of themoving particle at various time points. The brightness of the particlesdropped significantly and then came back again. (i) and (j) show theimages of the particle right before its final appearance. At panel (k) thetracked particle disappeared due to either photobleaching orinternalization. Panel (l) shows the particle at time 0 overlaid withthe first 0.8 s of the trajectory. Frame rate = 49.261 Hz. (m) Smoothed3D trajectory of the same particle (window size 3). Only the first 39frames (∼0.8 s after binding) were used to calculate the 3D trajectory.After 0.8 s, the brightness of the tracked particle varies significantly,which impacts the accuracy of the z-axis localization.
Figure 6. (a) Dwelling time of EGF on membranes of live A549 cells has broad distribution with an average value of 3.57 s. (b) EGF dwelling timeafter cholesterol depletion with 10 mM methyl-β-cyclodextrin. Cholesterol depletion leads to an increase in number of trajectories with shortdwelling time and a decrease in number of trajectories with long dwelling time. The average dwelling time after cholesterol depletion is 2.60 s. (c)Average dwelling time of control or cholesterol-depleted cells, which is calculated from 90 or 43 randomly selected trajectories, respectively. Theerror bar is the standard error of the mean.
The Journal of Physical Chemistry B Article
dx.doi.org/10.1021/jp405380g | J. Phys. Chem. B 2013, 117, 15503−1551115508
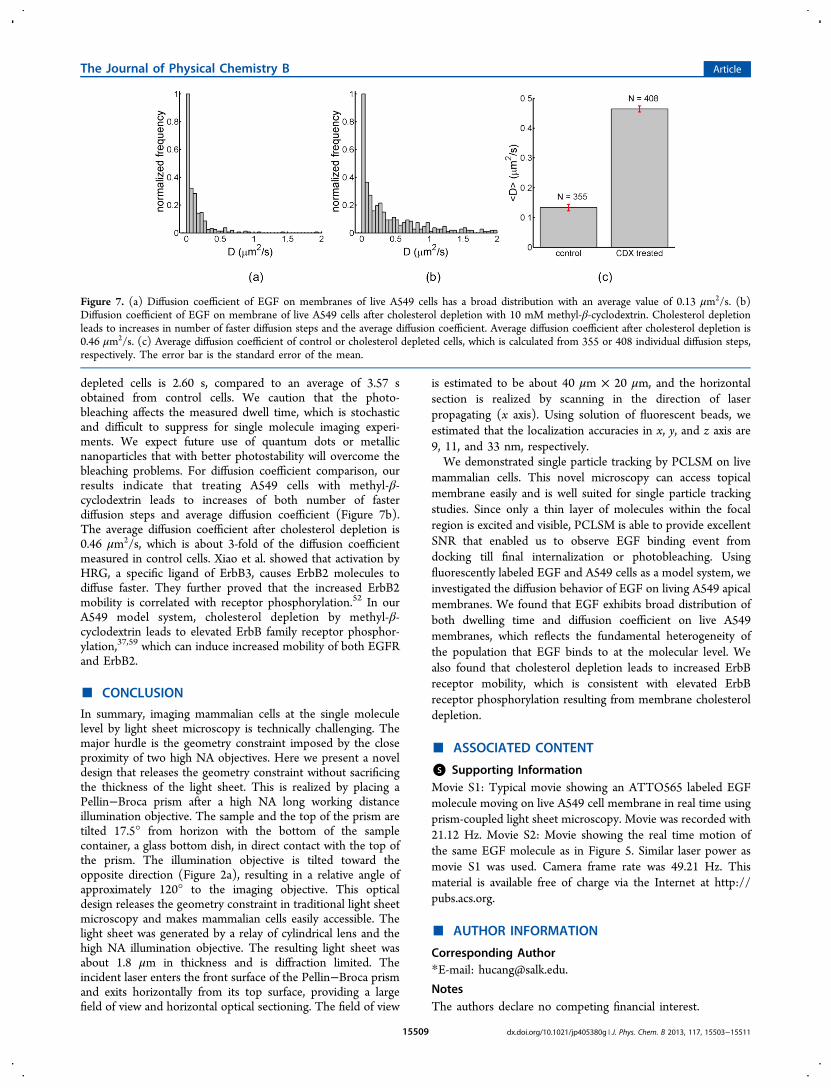
depleted cells is 2.60 s, compared to an average of 3.57 sobtained from control cells. We caution that the photo-bleaching affects the measured dwell time, which is stochasticand difficult to suppress for single molecule imaging experi-ments. We expect future use of quantum dots or metallicnanoparticles that with better photostability will overcome thebleaching problems. For diffusion coefficient comparison, ourresults indicate that treating A549 cells with methyl-β-cyclodextrin leads to increases of both number of fasterdiffusion steps and average diffusion coefficient (Figure 7b).The average diffusion coefficient after cholesterol depletion is0.46 μm2/s, which is about 3-fold of the diffusion coefficientmeasured in control cells. Xiao et al. showed that activation byHRG, a specific ligand of ErbB3, causes ErbB2 molecules todiffuse faster. They further proved that the increased ErbB2mobility is correlated with receptor phosphorylation.52 In ourA549 model system, cholesterol depletion by methyl-β-cyclodextrin leads to elevated ErbB family receptor phosphor-ylation,37,59 which can induce increased mobility of both EGFRand ErbB2.
■ CONCLUSION
In summary, imaging mammalian cells at the single moleculelevel by light sheet microscopy is technically challenging. Themajor hurdle is the geometry constraint imposed by the closeproximity of two high NA objectives. Here we present a noveldesign that releases the geometry constraint without sacrificingthe thickness of the light sheet. This is realized by placing aPellin−Broca prism after a high NA long working distanceillumination objective. The sample and the top of the prism aretilted 17.5° from horizon with the bottom of the samplecontainer, a glass bottom dish, in direct contact with the top ofthe prism. The illumination objective is tilted toward theopposite direction (Figure 2a), resulting in a relative angle ofapproximately 120° to the imaging objective. This opticaldesign releases the geometry constraint in traditional light sheetmicroscopy and makes mammalian cells easily accessible. Thelight sheet was generated by a relay of cylindrical lens and thehigh NA illumination objective. The resulting light sheet wasabout 1.8 μm in thickness and is diffraction limited. Theincident laser enters the front surface of the Pellin−Broca prismand exits horizontally from its top surface, providing a largefield of view and horizontal optical sectioning. The field of view
is estimated to be about 40 μm × 20 μm, and the horizontalsection is realized by scanning in the direction of laserpropagating (x axis). Using solution of fluorescent beads, weestimated that the localization accuracies in x, y, and z axis are9, 11, and 33 nm, respectively.We demonstrated single particle tracking by PCLSM on live
mammalian cells. This novel microscopy can access topicalmembrane easily and is well suited for single particle trackingstudies. Since only a thin layer of molecules within the focalregion is excited and visible, PCLSM is able to provide excellentSNR that enabled us to observe EGF binding event fromdocking till final internalization or photobleaching. Usingfluorescently labeled EGF and A549 cells as a model system, weinvestigated the diffusion behavior of EGF on living A549 apicalmembranes. We found that EGF exhibits broad distribution ofboth dwelling time and diffusion coefficient on live A549membranes, which reflects the fundamental heterogeneity ofthe population that EGF binds to at the molecular level. Wealso found that cholesterol depletion leads to increased ErbBreceptor mobility, which is consistent with elevated ErbBreceptor phosphorylation resulting from membrane cholesteroldepletion.
■ ASSOCIATED CONTENT
*S Supporting InformationMovie S1: Typical movie showing an ATTO565 labeled EGFmolecule moving on live A549 cell membrane in real time usingprism-coupled light sheet microscopy. Movie was recorded with21.12 Hz. Movie S2: Movie showing the real time motion ofthe same EGF molecule as in Figure 5. Similar laser power asmovie S1 was used. Camera frame rate was 49.21 Hz. Thismaterial is available free of charge via the Internet at http://pubs.acs.org.
■ AUTHOR INFORMATION
Corresponding Author*E-mail: [email protected].
NotesThe authors declare no competing financial interest.
Figure 7. (a) Diffusion coefficient of EGF on membranes of live A549 cells has a broad distribution with an average value of 0.13 μm2/s. (b)Diffusion coefficient of EGF on membrane of live A549 cells after cholesterol depletion with 10 mM methyl-β-cyclodextrin. Cholesterol depletionleads to increases in number of faster diffusion steps and the average diffusion coefficient. Average diffusion coefficient after cholesterol depletion is0.46 μm2/s. (c) Average diffusion coefficient of control or cholesterol depleted cells, which is calculated from 355 or 408 individual diffusion steps,respectively. The error bar is the standard error of the mean.
The Journal of Physical Chemistry B Article
dx.doi.org/10.1021/jp405380g | J. Phys. Chem. B 2013, 117, 15503−1551115509

■ ACKNOWLEDGMENTS
We thank Dr. Maxwell Zimmerley for proofreading themanuscript. This research is supported by the WaittFoundation and Ray Thomas Edwards Foundation.
■ REFERENCES(1) Brandenburg, B.; Zhuang, X. Virus Trafficking - Learning fromSingle-Virus Tracking. Nat. Rev. Microbiol. 2007, 5, 197−208.(2) Lakadamyali, M.; Rust, M. J.; Babcock, H. P.; Zhuang, X.Visualizing Infection of Individual Influenza Viruses. Proc. Natl. Acad.Sci. U.S.A. 2003, 100, 9280−5.(3) Gebhardt, J. C. M.; et al. Single-Molecule Imaging ofTranscription Factor Binding to DNA in Live Mammalian Cells.Nat. Methods 2013, 10, 421−6.(4) Li, G.-W.; Xie, X. S. Central Dogma at the Single-Molecule Levelin Living Cells. Nature 2011, 475, 308−15.(5) Low-Nam, S. T.; et al. ErbB1 Dimerization Is Promoted byDomain Co-Confinement and Stabilized by Ligand Binding. Nat.Struct. Mol. Biol. 2011, 18, 1244−9.(6) Lodish, H. et al. Molecular Cell Biology, 5th ed.; W. H. Freeman:2004.(7) Almen, M. S.; Nordstrom, K. J. V; Fredriksson, R.; Schioth, H. B.Mapping the Human Membrane Proteome: A Majority of the HumanMembrane Proteins Can Be Classified According to Function andEvolutionary Origin. BMC Biol. 2009, 7, 50.(8) Imming, P.; Sinning, C.; Meyer, A. Drugs, Their Targets and theNature and Number of Drug Targets. Nat. Rev. Drug Discovery 2006, 5,821−34.(9) Overington, J. P.; Al-Lazikani, B.; Hopkins, A. L. How ManyDrug Targets Are There? Nat. Rev. Drug Discovery 2006, 5, 993−6.(10) Alberts, B. et al. Molecular Biology of the Cell; Garland Science:2002.(11) Bryant, D. M.; Mostov, K. E. From Cells to Organs: BuildingPolarized Tissue. Nat. Rev. Mol. Cell Biol. 2008, 9, 887−901.(12) Schuck, S.; Simons, K. Polarized Sorting in Epithelial Cells: RaftClustering and the Biogenesis of the Apical Membrane. J. Cell Sci.2004, 117, 5955−64.(13) Andersson, S. B.; Sun, T. Linear Optimal Control for Tracking aSingle Fluorescent Particle in a Confocal Microscope. Appl. Phys. B:Laser Opt. 2008, 94, 403−409.(14) Cang, H.; Wong, C. M.; Xu, C. S.; Rizvi, A. H.; Yang, H.Confocal Three Dimensional Tracking of a Single Nanoparticle withConcurrent Spectroscopic Readouts. Appl. Phys. Lett. 2006, 88,223901.(15) Katayama, Y.; et al. Real-Time Nanomicroscopy via Three-Dimensional Single-Particle Tracking. ChemPhysChem 2009, 10,2458−64.(16) Ahrens, M. B.; Orger, M. B.; Robson, D. N.; Li, J. M.; Keller, P.J. Whole-Brain Functional Imaging at Cellular Resolution Using Light-Sheet Microscopy. Nat. Methods 2013, 10, 413−20.(17) Holekamp, T. F.; Turaga, D.; Holy, T. E. Fast Three-Dimensional Fluorescence Imaging of Activity in Neural Populationsby Objective-Coupled Planar Illumination Microscopy. Neuron 2008,57, 661−72.(18) Truong, T. V; Supatto, W.; Koos, D. S.; Choi, J. M.; Fraser, S. E.Deep and Fast Live Imaging with Two-Photon Scanned Light-SheetMicroscopy. Nat. Methods 2011, 8, 757−60.(19) Huisken, J.; Swoger, J.; Del Bene, F.; Wittbrodt, J.; Stelzer, E. H.K. Optical Sectioning Deep Inside Live Embryos by Selective PlaneIllumination Microscopy. Science (New York, N.Y.) 2004, 305, 1007−9.(20) Huisken, J.; Stainier, D. Y. R. Selective Plane IlluminationMicroscopy Techniques in Developmental Biology. Development(Cambridge, England) 2009, 136, 1963−75.(21) Siedentopf, H.; Zsigmondy, R. Groessenbestimmung Ultra-mikroskopischer Teilchen, mit Besonderer Anwendung auf Gold-rubinglaesern. Ann. Phys. 1903, 10, 1−39.(22) Keller, P. J.; Schmidt, A. D.; Wittbrodt, J.; Stelzer, E. H. K.Reconstruction of Zebrafish Early Embryonic Development by
Scanned Light Sheet Microscopy. Science (New York, N.Y.) 2008,322, 1065−9.(23) Santi, P. A. Light Sheet Fluorescence Microscopy: A Review. J.Histochem. Cytochem. 2011, 59, 129−38.(24) Cella Zanacchi, F.; et al. Live-Cell 3D Super-Resolution Imagingin Thick Biological Samples. Nat. Methods 2011, 8, 1047−9.(25) Wu, Y.; et al. Inverted Selective Plane Illumination Microscopy(iSPIM) Enables Coupled Cell Identity Lineaging and Neuro-developmental Imaging in Caenorhabditis elegans. Proc. Natl. Acad.Sci. U.S.A. 2011, 108, 17708−13.(26) Capoulade, J.; Wachsmuth, M.; Hufnagel, L.; Knop, M.Quantitative Fluorescence Imaging of Protein Diffusion andInteraction in Living Cells. Nat. Biotechnol. 2011, 29, 835−9.(27) Tokunaga, M.; Imamoto, N.; Sakata-sogawa, K. Highly InclinedThin Illumination Enables Clear Single-Molecule Imaging in Cells.Nat. Methods 2008, 5, 159−61.(28) Schlessinger, J. Cell Signaling by Receptor Tyrosine Kinases.Cell 2000, 103, 211−25.(29) Zhang, H.; et al. ErbB Receptors: From Oncogenes to TargetedCancer Therapies. J. Clin. Invest. 2007, 117, 2051−8.(30) Liu, P.; et al. A Single Ligand Is Sufficient To Activate EGFRDimers. Proc. Natl. Acad. Sci. U.S.A. 2012, 109, 10861−6.(31) Ferguson, K. M. Structure-Based View of Epidermal GrowthFactor Receptor Regulation. Annu. Rev. Biophys. 2008, 37, 353−73.(32) Zhang, X.; Gureasko, J.; Shen, K.; Cole, P. A.; Kuriyan, J. AnAllosteric Mechanism for Activation of the Kinase Domain ofEpidermal Growth Factor Receptor. Cell 2006, 125, 1137−49.(33) Graus-Porta, D.; Beerli, R. R.; Daly, J. M.; Hynes, N. E. ErbB-2,the Preferred Heterodimerization Partner of All Erbb Receptors, Is aMediator of Lateral Signaling. EMBO J. 1997, 16, 1647−55.(34) Tzahar, E.; et al. A Hierarchical Network of InterreceptorInteractions Determines Signal Transduction by Neu DifferentiationFactor/Neuregulin and Epidermal Growth Factor. Mol. Cell. Biol.1996, 16, 5276−5287.(35) Rasnik, I.; McKinney, S. A.; Ha, T. Nonblinking and Long-Lasting Single-Molecule Fluorescence Imaging. Nat. Methods 2006, 3,891−3.(36) Joo, C.; Ha, T. Imaging and Identifying Impurities in Single-Molecule FRET Studies. Cold Spring Harbor Protoc. 2012, 1109−12.(37) Westover, E. J.; Covey, D. F.; Brockman, H. L.; Brown, R. E.;Pike, L. J. Cholesterol Depletion Results in Site-Specific Increases inEpidermal Growth Factor Receptor Phosphorylation Due toMembrane Level Effects. Studies with Cholesterol Enantiomers. J.Biol. Chem. 2003, 278, 51125−51133.(38) Keller, P.; Simons, K. Cholesterol Is Required for SurfaceTransport of Influenza Virus Hemagglutinin. J. Cell Biol. 1998, 140,1357−1367.(39) Simons, K.; Toomre, D. Lipid Rafts and Signal Transduction.Nat. Rev. Mol. Cell Biol. 2000, 1, 31−39.(40) Rodal, S. K.; et al. Extraction of Cholesterol with Methyl-Beta-Cyclodextrin Perturbs Formation of Clathrin-Coated EndocyticVesicles. Mol. Biol. Cell 1999, 10, 961−74.(41) Huang, B.; Wang, W.; Bates, M.; Zhuang, X. Three-dimensionalSuper-Resolution Imaging by Stochastic Optical ReconstructionMicroscopy. Science (New York, N.Y.) 2008, 319, 810−3.(42) Kao, H. P.; Verkman, A. S. Tracking of Single FluorescentParticles in Three Dimensions: Use of Cylindrical Optics To EncodeParticle Position. Biophys. J. 1994, 67, 1291−300.(43) Holtzer, L.; Meckel, T.; Schmidt, T. Nanometric Three-Dimensional Tracking of Individual Quantum Dots in Cells. Appl.Phys. Lett. 2007, 90, 053902.(44) Smith, C. S.; Joseph, N.; Rieger, B.; Lidke, K. A. Fast, Single-Molecule Localization That Achieves Theoretically MinimumUncertainty. Nat. Methods 2010, 7, 373−5.(45) Babcock, H.; Sigal, Y. M.; Zhuang, X. A High-Density 3DLocalization Algorithm for Stochastic Optical Reconstruction Micros-copy. Opt. Nanosc. 2012, 1, 6.
The Journal of Physical Chemistry B Article
dx.doi.org/10.1021/jp405380g | J. Phys. Chem. B 2013, 117, 15503−1551115510

(46) Ritter, J. G.; Veith, R.; Veenendaal, A.; Siebrasse, J. P.;Kubitscheck, U. Light Sheet Microscopy for Single Molecule Trackingin Living Tissue. PloS One 2010, 5, e11639.(47) Ritter, J. G.; Veith, R.; Siebrasse, J.-P.; Kubitscheck, U. High-Contrast Single-Particle Tracking by Selective Focal Plane IlluminationMicroscopy. Opt. Express 2008, 16, 7142−52.(48) Deschout, H.; Neyts, K.; Braeckmans, K. The Influence ofMovement on the Localization Precision of Sub-Resolution Particles inFluorescence Microscopy. J. Biophotonics 2012, 5, 97−109.(49) Macdonald, J. L.; Pike, L. J. Heterogeneity in EGF-BindingAffinities Arises from Negative Cooperativity in an AggregatingSystem. Proc. Natl. Acad. Sci. U.S.A. 2008, 105, 112−7.(50) Gordon, M. P.; Ha, T.; Selvin, P. R. Single-Molecule High-Resolution Imaging with Photobleaching. Proc. Natl. Acad. Sci. U.S.A.2004, 101, 6462−5.(51) Montiel, D.; Cang, H.; Yang, H. Quantitative characterization ofChanges in Dynamical Behavior for Single-Particle Tracking Studies. J.Phys. Chem. B 2006, 110, 19763−70.(52) Xiao, Z.; et al. Single-Molecule Study of Lateral Mobility ofEpidermal Growth Factor Receptor 2/HER2 on Activation. J. Phys.Chem. B 2008, 112, 4140−5.(53) Yarden, Y.; Schlessinger, J. Self-Phosphorylation of EpidermalGrowth Factor Receptor: Evidence for a Model of IntermolecularAllosteric Activation. Biochemistry 1987, 26, 1434−42.(54) Ono, M.; et al. Sensitivity to Gefitinib (Iressa, ZD1839) in Non-Small Cell Lung Cancer Cell Lines Correlates with Dependence on theEpidermal Growth Factor (EGF) Receptor/Extracellular Signal-Regulated Kinase 1/2 and EGF Receptor/Akt Pathway forProliferation. Mol. Cancer Ther. 2004, 3, 465−72.(55) Nakamura, H.; et al. Cooperative Cell-Growth Inhibition byCombination Treatment with ZD1839 (Iressa) and Trastuzumab(Herceptin) in Non-Small-Cell Lung Cancer. Cancer Lett. 2005, 230,33−46.(56) Sergeev, M.; Swift, J. L.; Godin, A. G.; Wiseman, P. W. Ligand-Induced Clustering of EGF Receptors: A Quantitative Study byFluorescence Image Moment Analysis. Biophys. Chem. 2012, 161, 50−3.(57) Pike, L. J. Lipid Rafts: Heterogeneity on the High Seas. Biochem.J. 2004, 378, 281−92.(58) Pike, L. J.; Miller, J. M. Cholesterol Depletion DelocalizesPhosphatidylinositol Bisphosphate and Inhibits Hormone-StimulatedPhosphatidylinositol Turnover. J. Biol. Chem. 1998, 273, 22298−304.(59) Jans, R.; Atanasova, G.; Jadot, M.; Poumay, Y. CholesterolDepletion Upregulates Involucrin Expression in Epidermal Keratino-cytes through Activation of p38. J. Invest. Dermatol. 2004, 123, 564−73.
The Journal of Physical Chemistry B Article
dx.doi.org/10.1021/jp405380g | J. Phys. Chem. B 2013, 117, 15503−1551115511