Embed Size (px)
Citation preview
i
Lighting Santa Fe: Recommendations to Install LED
Streetlights within Santa Fe
Sponsor: City of Santa Fe
Liaison: Nick Schiavo
Advisor: John Orr
Co-Advisor: Fabio Carrera
Date: May 7th, 2011
Written By: Carl Curran Mari Freitas Mark Johnston Christopher Pryor
http://sites.google.com/site/sf11lights/

ii
Abstract In recent years, the city of Santa Fe has started taking initiatives towards greater
sustainability and increased energy efficiency, and is currently interested in upgrading its street lighting to more efficient and longer lasting light emitting diode (LED) technology. This report presents an analysis of the city’s lighting at its signaled intersections, which ultimately produced the 22 intersections that the team recommends to retrofit with LED lighting. A cost analysis of this project, which includes energy, maintenance, and fixture costs, showed that the break-even point for this project would occur sometime in the 15th year if Federal funding was not available. The report also presents an analysis of street lighting along selected sections of roadways within the City, and recommendations for upgrading the lights along those sections of road.

iii
Authorship Carl Curran: Wrote Abstract, Introduction, parts of Background, parts of Results and Analysis. Edited Background, Methodology, Results and Analysis, Conclusions and Recommendations. Gathered physical data for majority of intersections, collected and delivered GIS data, contributed to parts of PowerPoint Presentation, contributed to parts of the database. Mari Freitas: Wrote abstract, Executive Summary, parts of Background, parts of Results and Analysis, Conclusion and Recommendations. Edited Background and Methodology. Contributed to parts of appendix. Gathered physical data for 10% of intersections, modeled intersections, contributed to parts of the database. Mark Johnston: Wrote Executive Summary, parts of Background, parts of Methodology. Edited Background, Methodology, Results and Analysis. Gathered physical data for majority of intersections, contributed to parts of the database. Christopher Pryor: Wrote parts of Background, Methodology, parts of Results and Analysis. Edited Executive Summary, Conclusions and Recommendations. Contributed to parts of Appendix. Gathered physical data for 10% of intersections, modeled intersections, made most of PowerPoint presentation, coded database.
iv
Acknowledgements We would like to thank everyone in Santa Fe for being kind as well as those at the Santa Fe Complex for their hospitality. We would like to especially thank all of those below: Nick Schiavo – Energy Specialist with the Housing and Community Dev. Dept. Rick Devine – Traffic Operations Supervisor with the MPO Gil Martinez – Project Administrator with the Public Works Department Keith Wilson – MPO Senior Planner Mark Tibbetts – MPO Officer John Romero – Traffic Engineer Supervisor Dale Richardson – LED Roadway Technical Product Specialist John Orr – WPI Interactive Qualifying Project Adviser Fabio Carrera– WPI Interactive Qualifying Project Co-adviser Santa Fe Complex
v
Table of Contents Abstract .......................................................................................................................................... ii Authorship...................................................................................................................................... iii Acknowledgements ........................................................................................................................ iv
Table of Figures ............................................................................................................................ vii List of Tables ................................................................................................................................. ix
1 Executive Summary ................................................................................................................ 1
2 Introduction ............................................................................................................................. 4
3 Background ............................................................................................................................. 6
3.1 National Commercial Electricity Consumption & Price Projections ............................... 6
3.1.1 National Environmental Concerns ............................................................................ 6
3.1.2 National Energy Efficiency Efforts, Legislation & Initiatives ................................. 7
3.1.3 National Municipal Energy Conservation Efforts .................................................... 7
3.2 Santa Fe Conservation Initiatives ..................................................................................... 8
3.2.1 The 2030 Challenge .................................................................................................. 8
3.2.2 Sustainable Santa Fe Plan ......................................................................................... 8
3.2.3 Alternative & Renewable Energy & Energy Conservation ...................................... 9
3.2.4 Traffic Lights in Santa Fe ......................................................................................... 9
3.3 Important Measurements ................................................................................................ 10
3.3.1 Light Intensity ......................................................................................................... 10
3.3.2 Luminous Efficiency ............................................................................................... 11
3.3.3 Color Rendering Index (CRI) ................................................................................. 11
3.3.4 Total Light Loss Factor ........................................................................................... 12
3.3.5 Electricity Consumption ......................................................................................... 12
3.3.6 Santa Fe’s Intersection Lighting Guidelines ........................................................... 13
3.4 General Lighting Information ........................................................................................ 13
3.4.1 High Pressure Sodium Vapor (HPS) Lighting ........................................................ 13
3.4.2 Light Emitting Diode (LED) Lighting .................................................................... 14
3.4.3 Types of Poles ......................................................................................................... 14
3.4.4 Optics of Street Lighting Fixtures........................................................................... 15
3.4.5 Comparison of Types of HPS and LED Lights ...................................................... 16
3.5 Street Lighting ................................................................................................................ 17
3.5.1 GE (General Electric) HPS Fixtures ....................................................................... 17
3.5.2 LED Roadway Streetlight Fixtures ......................................................................... 18
vi
4 Methodology ......................................................................................................................... 19
4.1 Gathering all relevant physical data ............................................................................... 19
4.1.1 Physical Measurements ........................................................................................... 19
4.1.2 Light Intensity Measurements................................................................................. 20
4.1.3 Electric Meter and Traffic Control Box Data ......................................................... 20
4.1.4 Pedestrian Crash Data ............................................................................................. 21
4.2 Model Each Intersection in AutoCAD ........................................................................... 21
4.2.1 Determine Optimal Lighting for Each Intersection in AGi32 ................................ 21
4.3 Lighting Guidelines ........................................................................................................ 22
5 Results & Analysis ................................................................................................................ 23
5.1 Intersection Lighting Models ......................................................................................... 23
5.1.1 Characterization of Signaled Intersections ............................................................. 23
5.1.2 Signaled Intersections ............................................................................................. 23
5.1.3 Traffic Control Box and Intersection Electric Meter Data ..................................... 24
5.1.4 Signaled Intersection Database ............................................................................... 24
5.2 Intersection Lighting Models ......................................................................................... 25
5.3 Retrofit Analysis ............................................................................................................ 26
5.4 Fiscal Analysis ............................................................................................................... 26
5.4.1 The Estimated Costs based on New Mexico’s Current Rate of 5 cents/kWh ......... 27
5.4.2 The Estimated Costs based on 9.6 cents/kWh ........................................................ 28
6 Conclusions and Recommendations ..................................................................................... 29
6.1 Conclusions .................................................................................................................... 29
6.2 Recommendations .......................................................................................................... 31
6.3 Future Work ................................................................................................................... 31
7 Bibliography ......................................................................................................................... 33
8 Appendix ............................................................................................................................... 35
8.1 Google Earth ver. 6.0.2.2074 ......................................................................................... 35
8.2 AutoCAD 2012 .............................................................................................................. 36
8.3 AGi32 ver. 2.17 .............................................................................................................. 37
8.4 Spec Sheets for LED Roadway Lighting fixtures .......................................................... 38
8.5 Google Maps API ........................................................................................................... 40
8.6 Database Code ................................................................................................................ 40
8.7 List of Intersections w/ Statistics ................................................................................... 45
8.8 Costs to the City ............................................................................................................. 52
vii
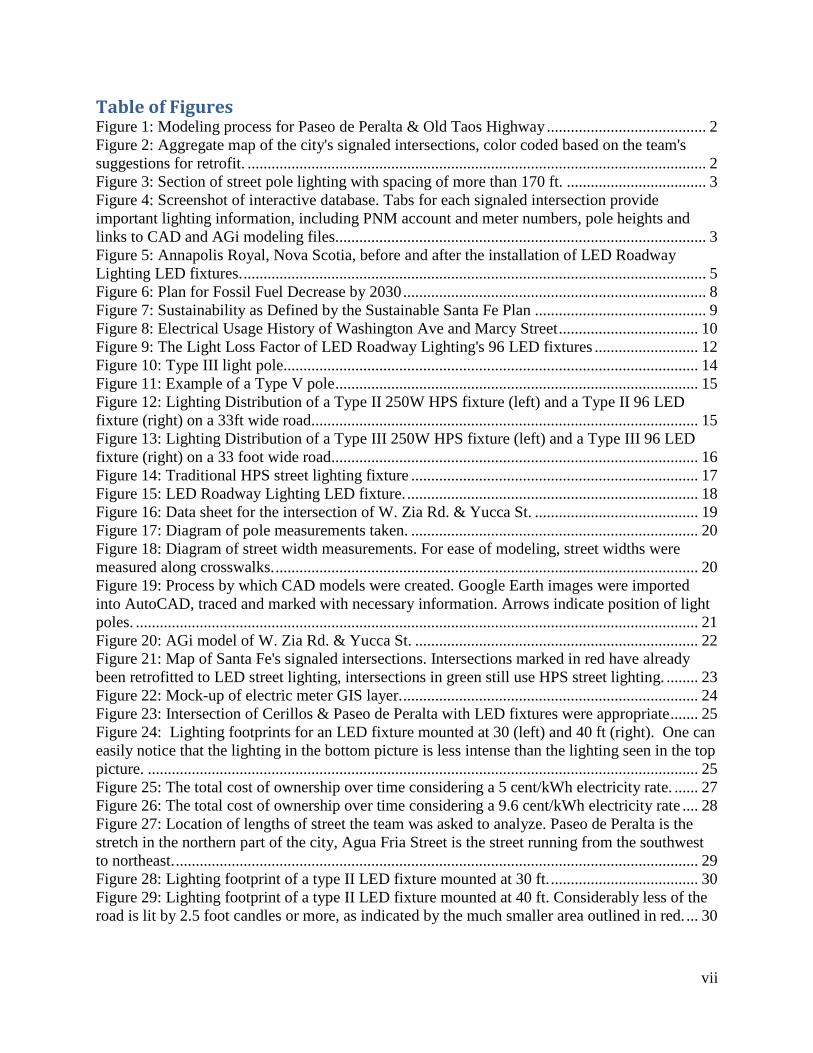
Table of Figures Figure 1: Modeling process for Paseo de Peralta & Old Taos Highway ........................................ 2 Figure 2: Aggregate map of the city's signaled intersections, color coded based on the team's suggestions for retrofit. ................................................................................................................... 2 Figure 3: Section of street pole lighting with spacing of more than 170 ft. ................................... 3 Figure 4: Screenshot of interactive database. Tabs for each signaled intersection provide important lighting information, including PNM account and meter numbers, pole heights and links to CAD and AGi modeling files............................................................................................. 3 Figure 5: Annapolis Royal, Nova Scotia, before and after the installation of LED Roadway Lighting LED fixtures. .................................................................................................................... 5 Figure 6: Plan for Fossil Fuel Decrease by 2030 ............................................................................ 8 Figure 7: Sustainability as Defined by the Sustainable Santa Fe Plan ........................................... 9 Figure 8: Electrical Usage History of Washington Ave and Marcy Street ................................... 10 Figure 9: The Light Loss Factor of LED Roadway Lighting's 96 LED fixtures .......................... 12 Figure 10: Type III light pole........................................................................................................ 14 Figure 11: Example of a Type V pole ........................................................................................... 15 Figure 12: Lighting Distribution of a Type II 250W HPS fixture (left) and a Type II 96 LED fixture (right) on a 33ft wide road................................................................................................. 15 Figure 13: Lighting Distribution of a Type III 250W HPS fixture (left) and a Type III 96 LED fixture (right) on a 33 foot wide road............................................................................................ 16 Figure 14: Traditional HPS street lighting fixture ........................................................................ 17 Figure 15: LED Roadway Lighting LED fixture. ......................................................................... 18 Figure 16: Data sheet for the intersection of W. Zia Rd. & Yucca St. ......................................... 19 Figure 17: Diagram of pole measurements taken. ........................................................................ 20 Figure 18: Diagram of street width measurements. For ease of modeling, street widths were measured along crosswalks. .......................................................................................................... 20 Figure 19: Process by which CAD models were created. Google Earth images were imported into AutoCAD, traced and marked with necessary information. Arrows indicate position of light poles. ............................................................................................................................................. 21 Figure 20: AGi model of W. Zia Rd. & Yucca St. ....................................................................... 22 Figure 21: Map of Santa Fe's signaled intersections. Intersections marked in red have already been retrofitted to LED street lighting, intersections in green still use HPS street lighting. ........ 23 Figure 22: Mock-up of electric meter GIS layer. .......................................................................... 24 Figure 23: Intersection of Cerillos & Paseo de Peralta with LED fixtures were appropriate ....... 25 Figure 24: Lighting footprints for an LED fixture mounted at 30 (left) and 40 ft (right). One can easily notice that the lighting in the bottom picture is less intense than the lighting seen in the top picture. .......................................................................................................................................... 25 Figure 25: The total cost of ownership over time considering a 5 cent/kWh electricity rate. ...... 27 Figure 26: The total cost of ownership over time considering a 9.6 cent/kWh electricity rate .... 28 Figure 27: Location of lengths of street the team was asked to analyze. Paseo de Peralta is the stretch in the northern part of the city, Agua Fria Street is the street running from the southwest to northeast. ................................................................................................................................... 29 Figure 28: Lighting footprint of a type II LED fixture mounted at 30 ft. ..................................... 30 Figure 29: Lighting footprint of a type II LED fixture mounted at 40 ft. Considerably less of the road is lit by 2.5 foot candles or more, as indicated by the much smaller area outlined in red. ... 30
viii
Figure 30: Effect of reorienting mast arm on light levels in an intersection. Notice that with mast arms oriented into the intersection, the intersection becomes completely lit. .............................. 30 Figure 31 Does Not Meeting Guidelines: Current Poles with LED Lights .................................. 32 Figure 32 Does Not Meeting Guidelines: 1 Pole Added to Intersection ...................................... 32 Figure 33 Meets Guidelines: 2 Poles Added and Rotated ........................................................... 32 Figure 34: A screenshot of Google Earth showcasing the Ruler tool ........................................... 35 Figure 35: A screenshot of AutoCAD 2012 showcasing the Measure tool .................................. 36 Figure 36: Agua Fria and Camino Alire ....................................................................................... 54 Figure 37: Artist and Washington ................................................................................................. 54 Figure 38: Paseo de Peralta and Galisteo ...................................................................................... 55 Figure 39: Paseo de Peralta and Washington ................................................................................ 55 Figure 40: Richards and Rufina .................................................................................................... 56 Figure 41: Rufina and Siler ........................................................................................................... 56 Figure 42: W Cordova and Don Diego ......................................................................................... 57 Figure 43: 151 Paseo de Peralta .................................................................................................... 57 Figure 44: Agua Fria and Cristobal Colon .................................................................................... 58 Figure 45: Agua Fria and Siler...................................................................................................... 58 Figure 46: Airport and Calle Atajo ............................................................................................... 59 Figure 47: Airport and Meadows .................................................................................................. 59 Figure 48: De Vargas Middle School ........................................................................................... 60 Figure 49: Old Pecos Trail and E Cordova ................................................................................... 60 Figure 50: Old Pecos and Zia........................................................................................................ 61 Figure 51: Rodeo and Ave de las Campana .................................................................................. 61 Figure 52: Rodeo and Yucca......................................................................................................... 62 Figure 53: Rodeo and Zia ............................................................................................................. 62 Figure 54: Siringo and 5th ............................................................................................................ 63 Figure 55:W San Mateo and Cll Corca ......................................................................................... 63 Figure 56: Zia and Camino Carlos Rey ........................................................................................ 64

ix
List of Tables Table 1: Total costs based on the current PNM electricity rate .................................................... 52 Table 2: Total costs based on the average National electricity rate .............................................. 53
1
Executive Summary 1
In 2008, the city of Santa Fe finished upgrading their incandescent traffic lights to LED lights. This change has led to approximately 75% energy savings and also savings in maintenance costs. After the completion of the traffic lights, the City has moved on to retrofitting streetlights at signaled intersections from high pressure sodium (abbreviated: HPS) lights with LED lights. The City chose to retrofit the streetlights at signaled intersections because they would be able to monitor the exact energy savings, due to the presence of dedicated electric meters. As the first step of this project, streetlights at fourteen of these intersections were retrofitted by the City to determine the feasibility of LEDs in the remaining parts of the City. As a result of their findings, the City wished to examine the remaining intersections. Using $178,000 in American Recovery & Reinvestment Act funding, the city will purchase lighting fixtures from LED Roadway Lighting to retrofit the signaled intersections the team finds suitable for upgrade. LED lights are a newer form of lighting technology that has proven to be more cost effective than HPS lights in certain applications. The benefits of LED lights are their long life span and the more controlled optics that focus the light in more desirable locations. LED lights provide energy savings by not wasting light in areas that are not necessary to light, but the majority of the savings come from maintenance costs. The LED lights the team worked with have a life span of approximately twenty years, whereas HPS lights have a lifespan of about four to five years. As a result, the city will see significant savings from greatly reduced maintenance and replacement costs. In addition, the light emitted by HPS bulbs is not well controlled, as they throw light into areas that do not need to be lit. This extra light leads to additional costs due to wasted energy and provides a basis for why the LED fixtures are appropriate.
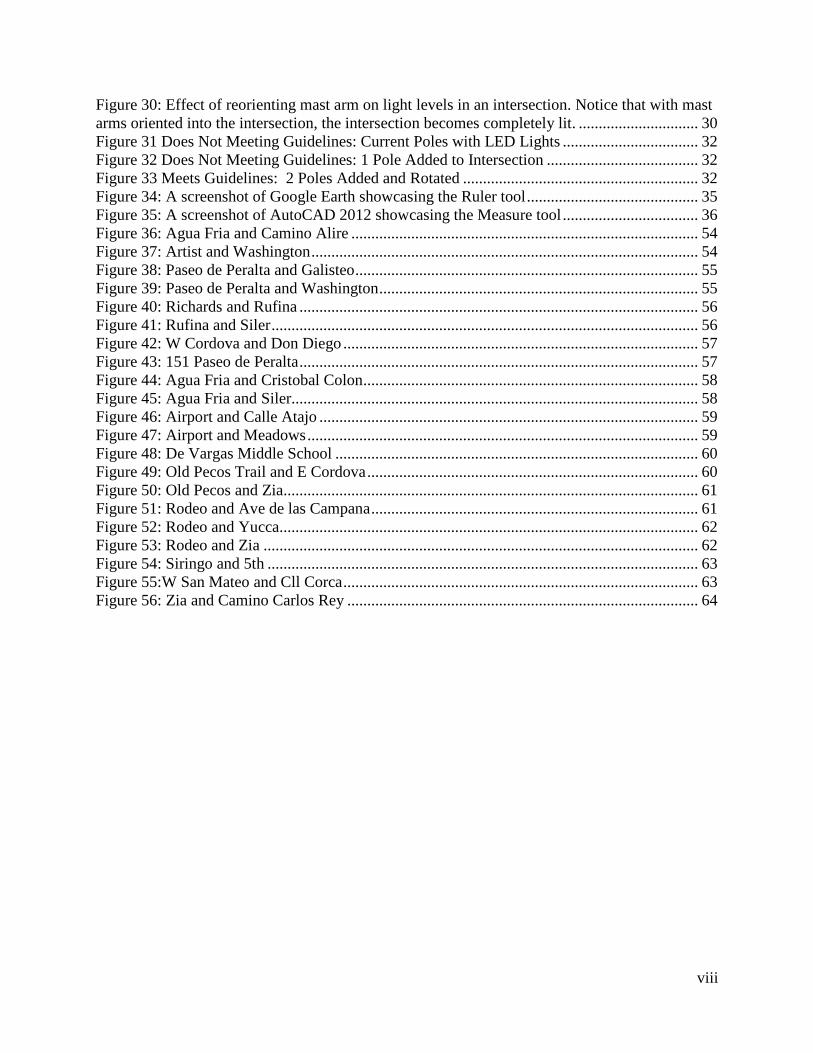
This project analyzed all of the city’s signaled intersections and provided a prioritized list of intersections to be retrofitted. The first step of the project was to measure physical characteristics of each intersection, such as each street dimension as well as each streetlight’s height, setback (the distance from the pole to the curb) and length of mast arm. Next, a picture of each intersection from Google Earth was imported into AutoCAD in order to get the relative spacing of the intersection. The picture above and to the left is an example of a screen shot from Google Earth of the intersection of Paseo de Peralta and Old Taos Highway. In AutoCAD, the intersections were traced and scaled using the measurements gathered from the first step; the picture in the middle is a trace of the previously mentioned intersection. From there the location of sidewalk and each light fixture was identified with a small circle in the drawing. The following step was to import the AutoCAD file into AGi32 lighting software, where various types of lights can be tested to see how each intersection is lit. The ultimate goal of this lighting optimization was to find the best combination of type, size, amperage and the number of fixtures used that would provide best lighting in the most cost effective manner, while still maintaining city lighting guidelines for each intersection. In order for an intersection to be suggested for retrofit, it must maintain an average of 2.0 foot candles and cover at least 90% of the intersection with .8 foot candles or greater with the LED fixtures. Figure 3 is a screen shot from the AGi32 software of the same intersection showing where light will be projected onto the street. After these three steps were completed for every signaled intersection the list of suggested intersection for retrofit was compiled.
2
Figure 1: Modeling process for Paseo de Peralta & Old Taos Highway
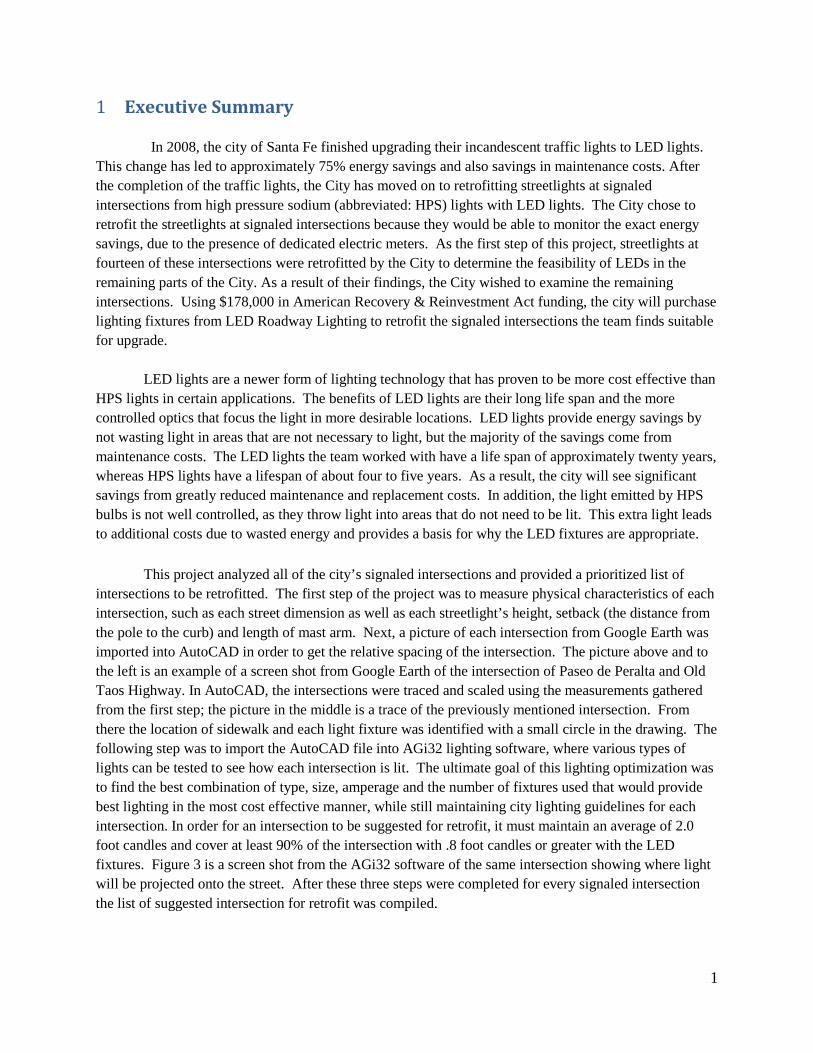
The prioritized list was divided into two different groups; intersections that meet the guidelines and intersections that do not meet the guidelines. The group found that eighteen intersections met the guidelines. However, it was discovered that some poles allowed the mast arm to be rotated in increments of 45 degrees to the left or right. This allowed the team to find four more intersections that meet the City’s guidelines, for a total of twenty-two intersections. The twenty-two intersections being recommended for retrofit along with the previously retrofitted fourteen intersections, leaves a total seventy-nine intersections that cannot be retrofitted. Due to the large size of most intersections and lack of poles, the majority of signaled intersections in the City cannot be retrofitted with LED lights in their current condition. Figure 2 shows the City’s signaled intersections and our recommendations for retrofit. Intersections in red are intersections that the City has previously retrofitted, those in blue can be retrofitted simply by replacing HPS fixtures with LED fixtures, those marked with yellow can be retrofitted by reorienting of mast arms into the intersection, and those in green are intersections that the team does not suggest the City retrofit.
The team recommends that the City only have light fixtures mounted at 30 ft. poles if it wants to use LED lights. However, many streetlights throughout the City are at 40 ft., which do not allow LED lights to provide adequate lighting onto the street and/or intersection, barring unusually small intersections given the heights of the poles. In addition, the team also recommends that if the City is given a budget that it strategically installs more poles and arms at intersections that currently do not meet the lighting guidelines.
Figure 2: Aggregate map of the city's signaled intersections, color coded based on the team's suggestions for retrofit.
3
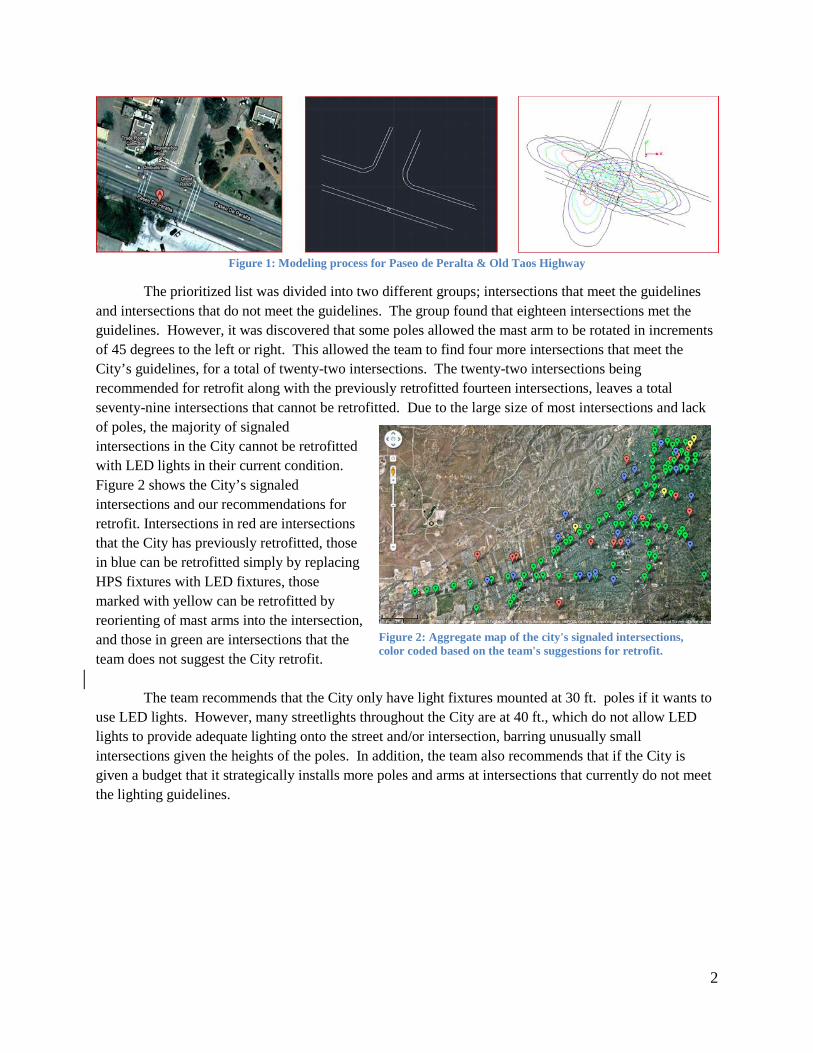
The twenty-two intersections recommended to the City for retrofit will require sixty-seven total fixtures and cost approximately $52,000 which leaves the City with about $126,000 to spend on more fixtures. Because of this, the City asked the team to analyze sections along Agua Fria Street and Paseo de Peralta to see if LED fixtures could be placed there instead. After careful analysis, the team found that the majority of the poles were too far apart to provide adequate uniform lighting with LED lights.
Figure 3: Section of street pole lighting with spacing of more than 170 ft.
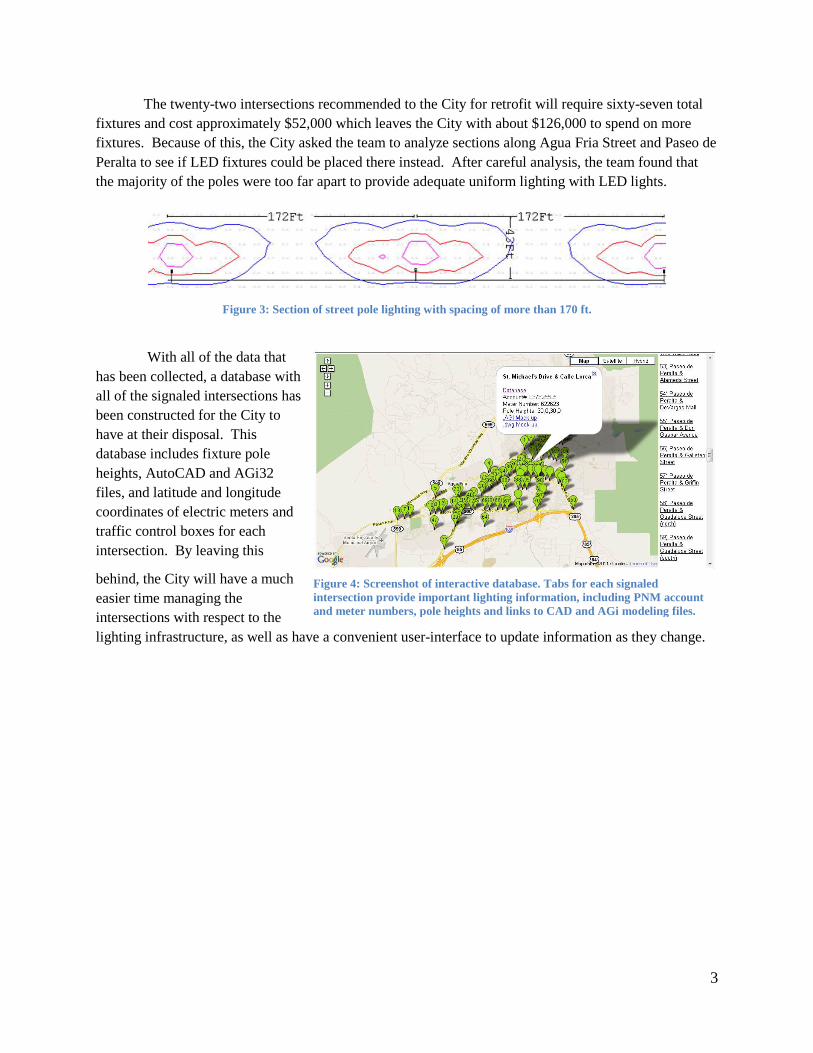
With all of the data that
has been collected, a database with all of the signaled intersections has been constructed for the City to have at their disposal. This database includes fixture pole heights, AutoCAD and AGi32 files, and latitude and longitude coordinates of electric meters and traffic control boxes for each intersection. By leaving this
behind, the City will have a much easier time managing the intersections with respect to the lighting infrastructure, as well as have a convenient user-interface to update information as they change.
Figure 4: Screenshot of interactive database. Tabs for each signaled intersection provide important lighting information, including PNM account and meter numbers, pole heights and links to CAD and AGi modeling files.
4
Introduction 2
An important social and political issue of modern times is serious potential for budget shortfalls throughout all levels of government, ranging from municipal all the way up to the federal level. As a result of these financial pressures, governments at all levels have been looking for ways to minimize spending while maintaining crucial public services. The most obvious and the simplest way of accomplishing this goal is to increase efficiency of government operations. At the national level, the federal government has undertaken several initiatives designed to save money, including an initiative to get rid of unnecessary federally owned real estate, namely underused and unused buildings.1 Another initiative known as the Better Buildings Initiative aims to reduce energy consumption of commercial buildings for significant energy and financial savings.2 Along with these initiatives, the recently enacted American Recovery and Reinvestment Act set aside $16.8 billion in funding for efficiency initiatives at lower levels of government, namely in the area of energy efficiency.3 At the state level, many states have adopted similar initiatives. For example, New Mexico adopted in 2007 a set of building standards that called for efficiency requirements for state buildings.4
In light of these potential budget shortfalls, and as a result of a desire to move towards a more
sustainable city, the city of Santa Fe adopted the Sustainable Santa Fe Plan (SSFP) in October of 2008. The SSFP encompasses a wide variety of sustainability and energy efficiency goals, including water conservation, ecosystem restoration, renewable energy generation and energy conservation. Already, the city has completed several projects relating to those goals. It has upgraded all of their traffic lights to LED technology5, resulting in considerable energy and cost savings. The city of Santa Fe has also adopted a set of green building codes that must be met for all building applications within city limits, upgraded much of the lighting in municipal buildings to LED technology and set minimum efficiency standards for all city vehicle purchases.6 All of these programs have been of immediate benefit to the city, either directly or indirectly, and the city wishes to expand them in order to further the savings seen.
Currently, the city of Santa Fe uses high pressure sodium vapor (HPS) lighting to illuminate their
streets. However, there are certain issues surrounding HPS lights that the city wishes to mitigate or eliminate by switching over to LED technology. The first major issue concerning HPS lighting is that of lifespan. Current HPS bulb models have a lifespan of anywhere between 3.5 years and 5.5 years, while current LED fixtures have lifespans upward of 20 years, easily more than four times that of their HPS counterparts.7 This increased lifespan translates to lower maintenance costs for the city in terms of fewer replacements to buy and fewer hours spent replacing the fixtures, along with the reduced disruption to traffic resulting from light maintenance. In addition, LED lights emit a whiter, higher quality light as measured by the color rendering index (CRI) than HPS lights, making them a more attractive option for
1 (Office of Management and Budget 2010, Office of Management and Budget 2010) 2 (Weatherization and Intergovernmental Program: Energy Efficiency and Conservation Block Grant Program n.d.) 3 (U.S. Senate and House of Representatives 2009, U.S. Senate and House of Representatives 2009) 4 (American Council for an Energy Efficient Economy 2007, American Council for an Energy Efficient Economy 2007) 5 (Santa Fe, NM - Official Website - Clean Renewable Energy n.d.) 6 Ibid 7 (Held 2009)
5
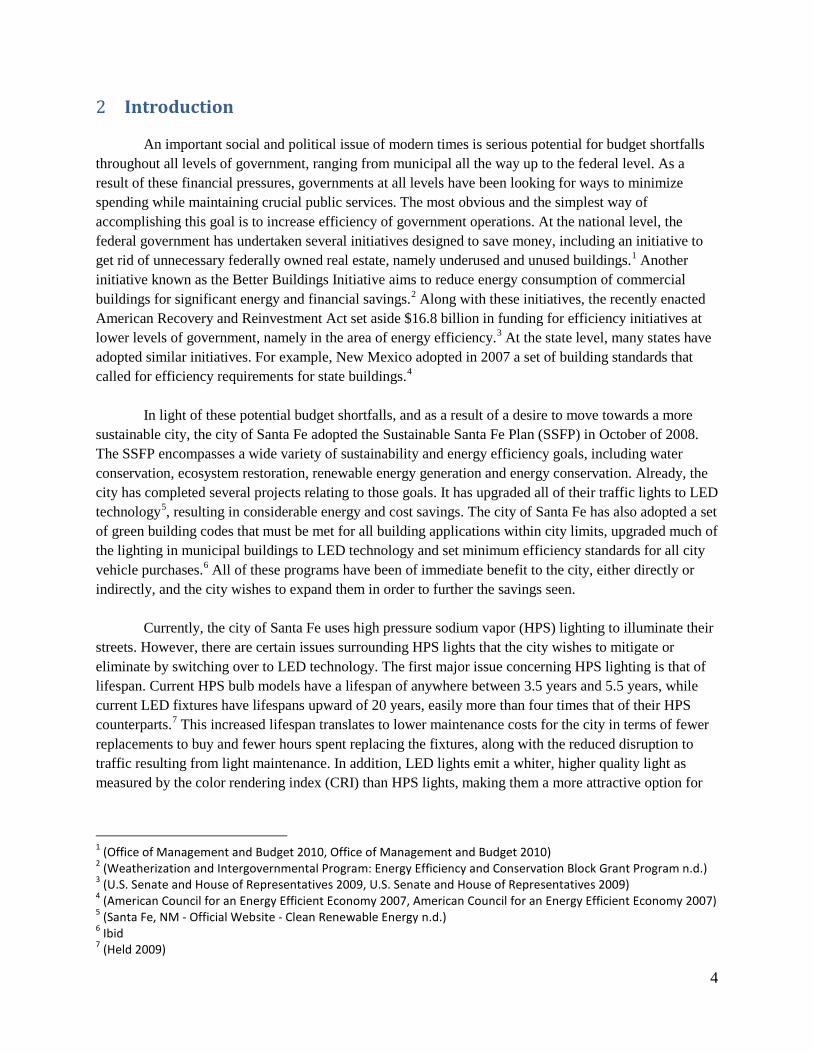
street and intersection lighting.8 The images of Annapolis Royal, Nova Scotia below show the difference in color temperature between HPS lighting and LED lighting.
Figure 5: Annapolis Royal, Nova Scotia, before and after the installation of LED Roadway Lighting
LED fixtures.
Partly in keeping with its commitment to a sustainable future outlined in the SSFP, and partly as a trial run of LED street lighting technology, the city of Santa Fe has already retrofitted the streetlights at 14 of its intersections with LED technology. While this is a good start, there are many more streetlights in Santa Fe that still use HPS lighting. Given the projected maintenance savings at the 14 upgraded intersections, along with the immense savings from the upgrade of the traffic signals, the city would like to expand its use of LED street lighting to many more of its intersections and eventually its streetlights. To accomplish this, the city acquired at $178,000 grant from the American Recovery and Reinvestment Act to purchase LED street lighting fixtures.9 In an effort to help the city further save money through efficiency upgrades, the team worked with the city’s Long Range Development Committee to upgrade street lighting at signaled intersections within the city to more efficient and longer lasting light emitting diode (LED) technology.
Considering this interest from the city in expanding its LED lighting program, the team
developed a proposal to submit to the city suggesting the best intersections to retrofit, given a set budget. The team collected and organized all relevant data, including intersection dimensions and streetlight characteristics. After gathering all this information, the group used this data to determine the best way to allocate the given funds. The project team then determined the best intersections for upgrade while ensuring that all these intersections met minimum luminosity requirements for street lighting. Additionally, due to the fact that many signaled intersections were not fit for retrofit with current LED technology, some stretches of streets were examined for upgrade to LED lighting. By implementing the team’s submitted plan, the city stands to save significant amounts of money on street lighting, and further the goals laid out in the Sustainable Santa Fe Plan.
8 (LEDway® Streetlights | LEDway n.d.) 9 (U.S. Department of Energy 2009)

6
Background 3
All kinds of ways for conserving energy are well known at the national level, and thus has trickled down state and then to city levels. The city of Santa Fe represents one of these cities, which has proposed and now is following the Sustainable Santa Fe Plan, which encompasses a variety of conservation efforts. Replacing its incandescent bulbs with LEDs in all of the traffic lights was one large project the city has undertaken that has led to immense energy and financial savings. The large savings seen has sparked interest in this project, retrofitting the city’s high pressure sodium streetlights at signaled intersections with LEDs.
3.1 National Commercial Electricity Consumption & Price Projections
Current projections from the Energy Information Agency (EIA) paint a rather troubling picture for municipalities struggling to make budgetary ends meet. By looking at the graph below, one can see a projected rise in commercial electricity prices. In addition, there is also an expected increase in electricity consumption by the commercial sector.10 Taken together, these projections predict large increases in cities’ energy bills which must be accounted for in some way. If nothing is done and consumption continues on its projected path, municipalities will soon find themselves dedicating ever larger portions of their budget to energy needs.
3.1.1 National Environmental Concerns In addition to the fiscal challenges posed by increasing electricity consumption and
prices, concerns are also being raised by many prominent scientific societies about the potentially harmful environmental effects of the ever increasing energy consumption. Given that some 45% of the electricity generated in the US comes from coal powered power plants,11 concerns have been raised about greenhouse gas emissions resulting from the burning of coal to generate electricity. Of note, the World Health Organization, the American Association for the Advancement of Science and the American Meteorological Society have all issued warnings about the potentially harmful effects of greenhouse gas emissions resulting from the combustion of fossil fuels for energy generation.12,13,14 In addition, there have long been concerns about environmental harm caused by the mining of coal itself, chief among them the irreparable damage done to landscapes through use of strip mining methods- which involve stripping layers of soil and rock to get to coal veins instead of digging underneath the surface. Also of note, are the concerns have been raised about the contamination of crucial water supplies near coal mines as a result of chemicals used in the mining process leaking into the water tables.15
10 (AEO Table Browser n.d., AEO Table Browser n.d.) 11 (Electricity in the United States - Energy Explained, Your Guide To Understanding Energy n.d., Electricity in the United States - Energy Explained, Your Guide To Understanding Energy n.d.) 12 (Protecting Health from Climate Change 2008, Protecting Health from Climate Change 2008) 13 (AAAS Board Statement on Climate Change 2006, AAAS Board Statement on Climate Change 2006) 14 (Climate Change Research: Issues for the Atmospheric and Related Sciences 2003, Climate Change Research: Issues for the Atmospheric and Related Sciences 2003) 15 (Gabriel 2006)

7
3.1.2 National Energy Efficiency Efforts, Legislation & Initiatives In light of these environmental concerns, and more recently as a result of fiscal pressures
from tightening budgets, there have been efforts introduced at all levels of government to reduce electricity consumption. At the national level, the American Recovery and Reinvestment Act of 2009, commonly known as the ‘stimulus package’, set aside $3.2 billion to fund the Energy Efficiency and Conservation Block Program, a program to “deploy the cheapest, cleanest and most reliable energy technologies we have across the country.”16 In addition, major environmental organizations such as the Sierra Club, The National Audubon Society and the National Wildlife Federation have taken stances favoring energy conservation measures and provide information about energy conservation ideas that can be applicable at all levels, from national policy to individual energy use.17,18,19
3.1.3 National Municipal Energy Conservation Efforts
Because of the many concerns relating to energy consumption facing the world, many cities have begun to launch efforts to cut down on energy consumption in order to reduce their carbon footprint and to reduce financial expenditures for energy. Due to the ease of implementation, many of these cities in question have turned to upgrading their streetlight lights in order to reduce energy bills. For example, the city of Ann Arbor, MI, committed in 2006 to upgrade all of its street lighting to LED technology in an effort to cut down on energy bills.20 Ann Arbor is far from alone in retrofitting their streetlights, as a brief search of American Recovery and Reinvestment Act awards records show that many other cities are pursuing government grants to fund similar upgrades.21 Cities awarded money include Mesa, AZ, New Orleans, LA and Topeka, KS, among others.22
16 (Weatherization and Intergovernmental Program: Energy Efficiency and Conservation Block Grant Program n.d., Weatherization and Intergovernmental Program: Energy Efficiency and Conservation Block Grant Program n.d.) 17 (Sierra Club Conservation Policies - Energy Conservation and Renewables n.d., Sierra Club Conservation Policies - Energy Conservation and Renewables n.d.) 18 (Energy | National Audubon Society Policy Issues & Action n.d., Energy | National Audubon Society Policy Issues & Action n.d.) 19 (Energy Pathway - Top 10 Tips to Minimize Energy Use - National Wildlife Federation n.d., Energy Pathway - Top 10 Tips to Minimize Energy Use - National Wildlife Federation n.d.) 20 (Ann Arbor's Street Light Program 2007) 21 (Search Award Recipient, LED street lighting n.d.) 22 Ibid
8
3.2 Santa Fe Conservation Initiatives
Some of the city’s conservation initiatives include supporting the 2030 Challenge and creating the Sustainable Santa Fe Plan. The 2030 Challenge was a plan set forth whose goal is to completely stop the consumption of fossil fuels by the year of 2030. Meanwhile, the Sustainable Santa Fe Plan was plan proposed by the city that consists of a wide range of projects, which include ecological conservation, renewable energy generation and initiatives to reduce its water consumption, energy consumption and greenhouse gas emissions.23
3.2.1 The 2030 Challenge
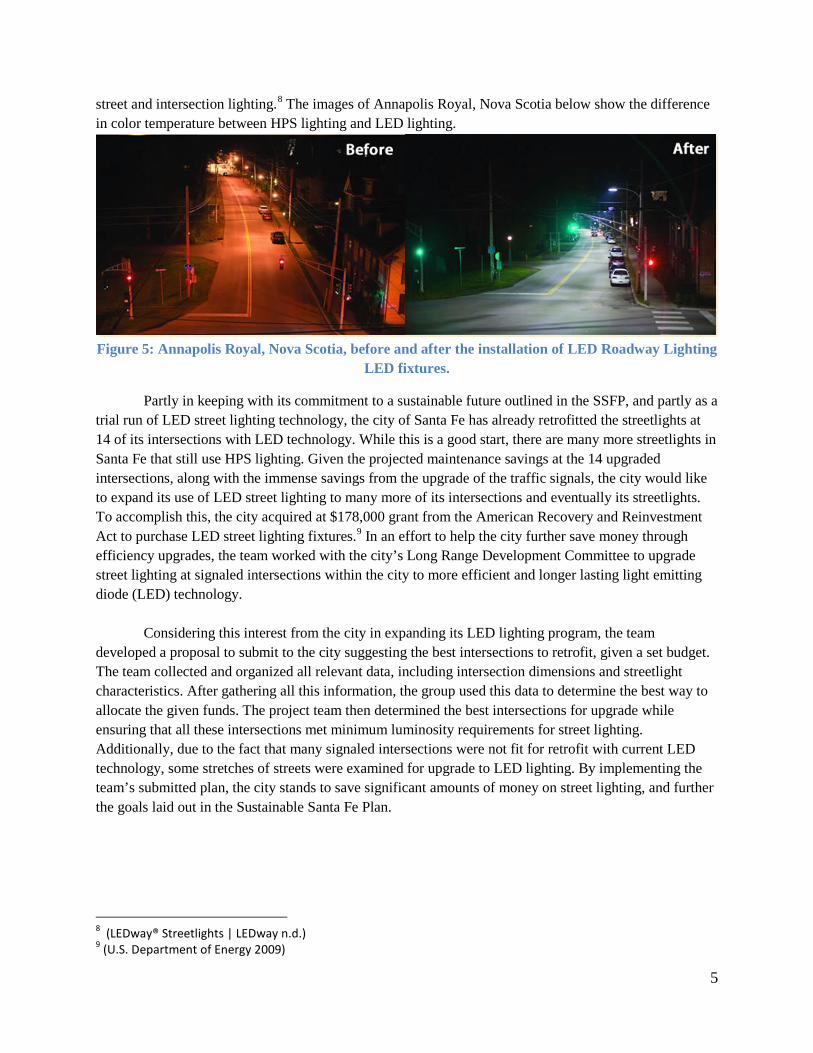
In June of 2006, the city of Santa Fe became the first city in the nation to adopt a set of building guidelines set forth by the environmental advocacy group Architecture 2030, known as the 2030 Challenge. The 2030 Challenge is a set of guidelines with the intent of reducing the greenhouse gas footprint of new buildings to zero by the year 2030.24 These guidelines outline methods of reducing greenhouse gas emissions from buildings, including more energy efficient design strategies, and purchasing additional needed energy from renewable sources.
3.2.2 Sustainable Santa Fe Plan
In October of 2008, the city of Santa Fe adopted the Sustainable Santa Fe Plan (SSFP), a series of guidelines set forth for the city to attain more sustainable methods of operation. For the purposes of the plan, the City defines sustainability as “meeting the needs of the present without compromising the needs of the future.”25 As such, the plan outlines numerous methods to ensure that the city can cut down on its consumption of natural resources; many of which have become strained over recent decades as a result of unsustainable use. Methods outlined include ideas for ecological conservation, renewable energy generation and initiatives to reduce its water consumption, energy consumption and greenhouse gas emissions.26
23 (Architecture 2030: The 2030 Challenge n.d.) 24 (Sustainable Santa Fe Plan 2008) 25 (Sustainable Santa Fe Plan 2008) 26 (Architecture 2030: The 2030 Challenge n.d.)
Figure 6: Plan for Fossil Fuel Decrease by 2030
9
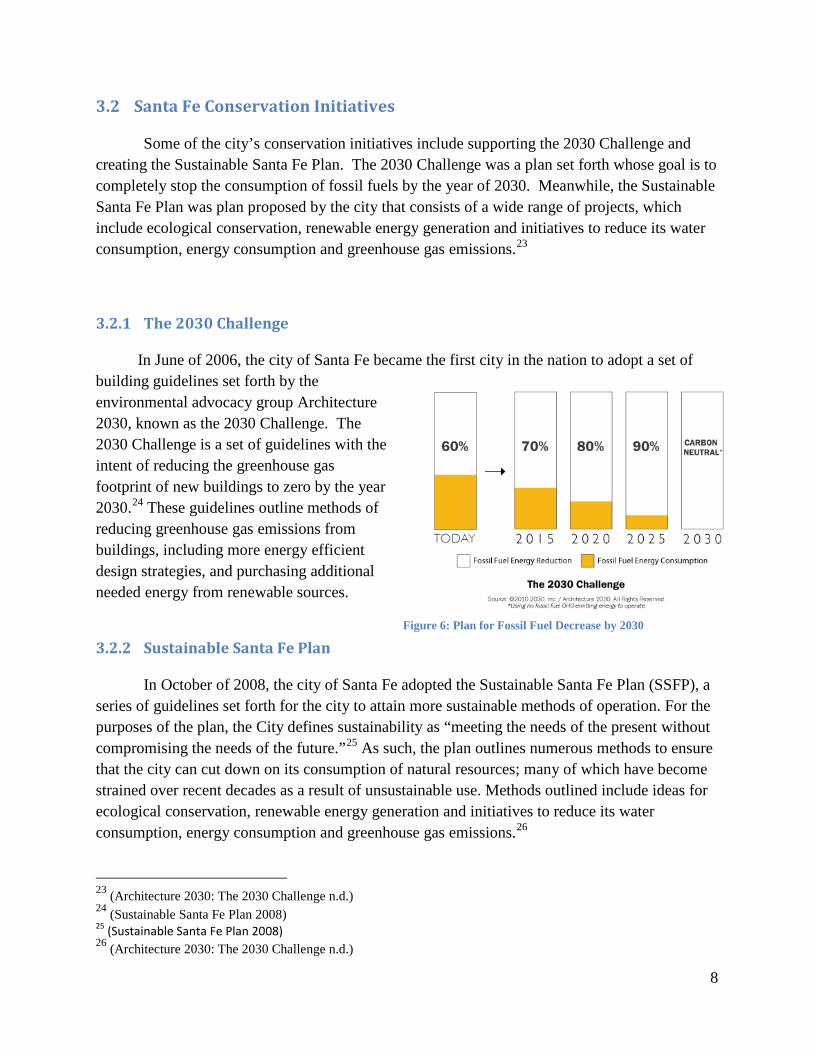
Figure 7 shows the approach the city is taking to sustainability as one balancing social, environmental and economic pressures to ensure that energy and resource conservation efforts do not result in an adversely impacted quality of life for the residents of Santa Fe.
The Sustainable Santa Fe Plan encompasses many initiatives within the city, ranging from efforts to restore local ecology and the local watershed to efforts to increase energy generation from renewable sources and reduce energy consumption. Specific examples of these initiatives include working with area landscapers and farmers to minimize water consumption,27 tree planting programs along the Santa Fe River to replace highly water intensive tree species with less water intensive species.28
3.2.3 Alternative & Renewable Energy & Energy Conservation
In keeping with the guidelines laid out in the SSFP, the City has begun to investigate renewable sources of energy, namely solar energy. In order to attain full energy independence, the city has investigated the possibility of purchasing its electrical grid in order to be able to add in clean sources of energy as they see fit as opposed to being privy to the Public Works of New Mexico’s (PNM) decisions.29 The City has also launched loan programs to allow citizens to obtain funding for energy efficiency upgrades for buildings, undertaken efforts to weatherize buildings to reduce heating and cooling energy consumption and encouraged systems such as photovoltaic solar systems, concentrated solar systems and wind turbines for clean energy generation.30
3.2.4 Traffic Lights in Santa Fe
As part of the Sustainable Santa Fe Plan, the city of Santa Fe has begun a project to upgrade the entire municipality owned lighting system to more energy efficient options, LEDs being a popular choice. It does this by auditing city owned buildings and making recommendations to upgrade the infrastructure as budgetary restrictions allow.
27 (Santa Fe, NM - Official Website - Water Conservation n.d.) 28 (Santa Fe, NM - Official Website - Ecological Adaptation n.d.) 29 (Altman, et al. 2010) 30 (Santa Fe, NM - Official Website - Clean Renewable Energy n.d., Santa Fe, NM - Official Website - Clean Renewable Energy n.d.)
Figure 7: Sustainability as Defined by the Sustainable Santa Fe Plan
10
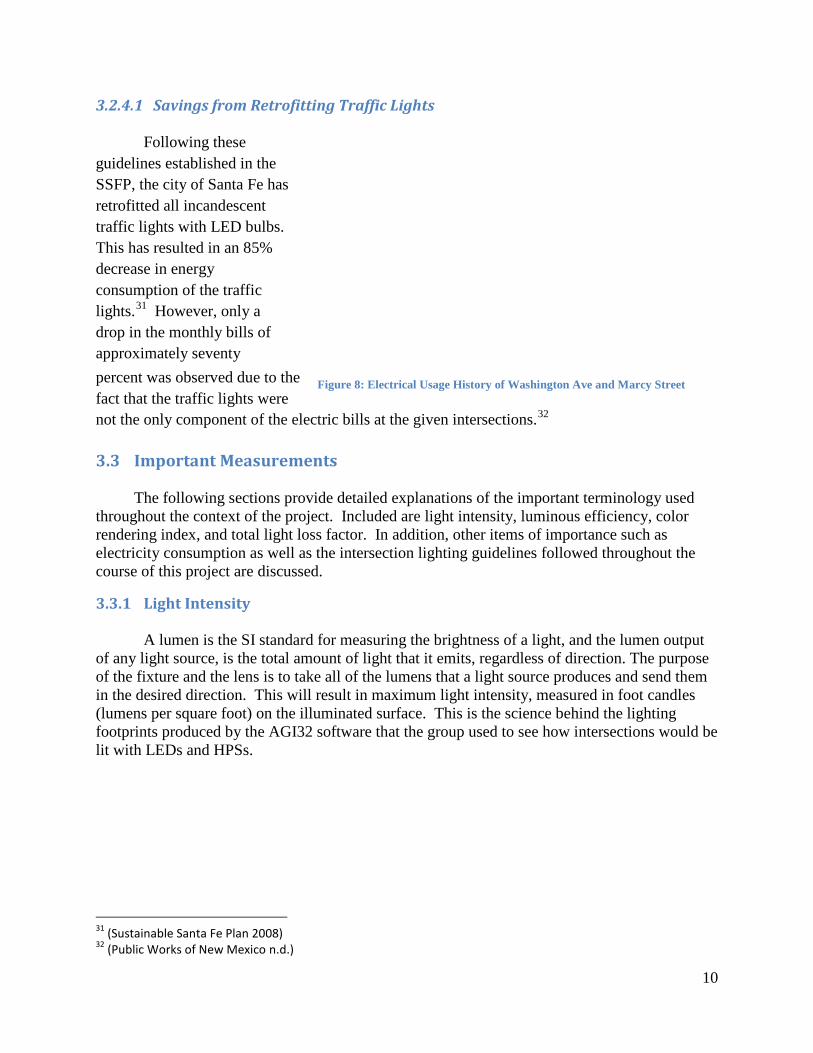
3.2.4.1 Savings from Retrofitting Traffic Lights
Following these guidelines established in the SSFP, the city of Santa Fe has retrofitted all incandescent traffic lights with LED bulbs. This has resulted in an 85% decrease in energy consumption of the traffic lights.31 However, only a drop in the monthly bills of approximately seventy percent was observed due to the fact that the traffic lights were not the only component of the electric bills at the given intersections.32
3.3 Important Measurements
The following sections provide detailed explanations of the important terminology used throughout the context of the project. Included are light intensity, luminous efficiency, color rendering index, and total light loss factor. In addition, other items of importance such as electricity consumption as well as the intersection lighting guidelines followed throughout the course of this project are discussed.
3.3.1 Light Intensity
A lumen is the SI standard for measuring the brightness of a light, and the lumen output of any light source, is the total amount of light that it emits, regardless of direction. The purpose of the fixture and the lens is to take all of the lumens that a light source produces and send them in the desired direction. This will result in maximum light intensity, measured in foot candles (lumens per square foot) on the illuminated surface. This is the science behind the lighting footprints produced by the AGI32 software that the group used to see how intersections would be lit with LEDs and HPSs.
31 (Sustainable Santa Fe Plan 2008) 32 (Public Works of New Mexico n.d.)
Figure 8: Electrical Usage History of Washington Ave and Marcy Street
11
3.3.2 Luminous Efficiency Luminous efficiency is a measure of the effectiveness of a light source in converting
electrical energy into visible light energy. Most commonly, this characteristic is measured in units of lumens per watt. When comparing two light fixtures, the fixture with the higher lumens per watt rating will have lower electricity costs over time, assuming the same rate for electricity. While this is an important parameter in selecting light sources, several other factors, such as maintenance costs, fixture optics, and degradation over time, must also be considered in designing any type of lighting for the minimal total cost.
3.3.3 Color Rendering Index (CRI)
The color rendering index (or CRI) is a normalized linear scale from 0 to 100, which aims to establish how effectively a light source will render the real colors of an object. An incandescent light is ranked at 100 because it is behaves similarly to a source of black body radiation, and is therefore used as the standard to compare light sources. A ranking close to 100 indicates that the light source is capable of rendering an object’s true colors, whereas a ranking close to 0 indicates that a light is incapable of rendering an object’s natural colors.33 In the cases of street and intersection lighting, a high ranking on the CRI scale for lighting fixtures is important for pedestrian and motorist safety reasons.
33 (Full Spectrum Solutions n.d.)
12
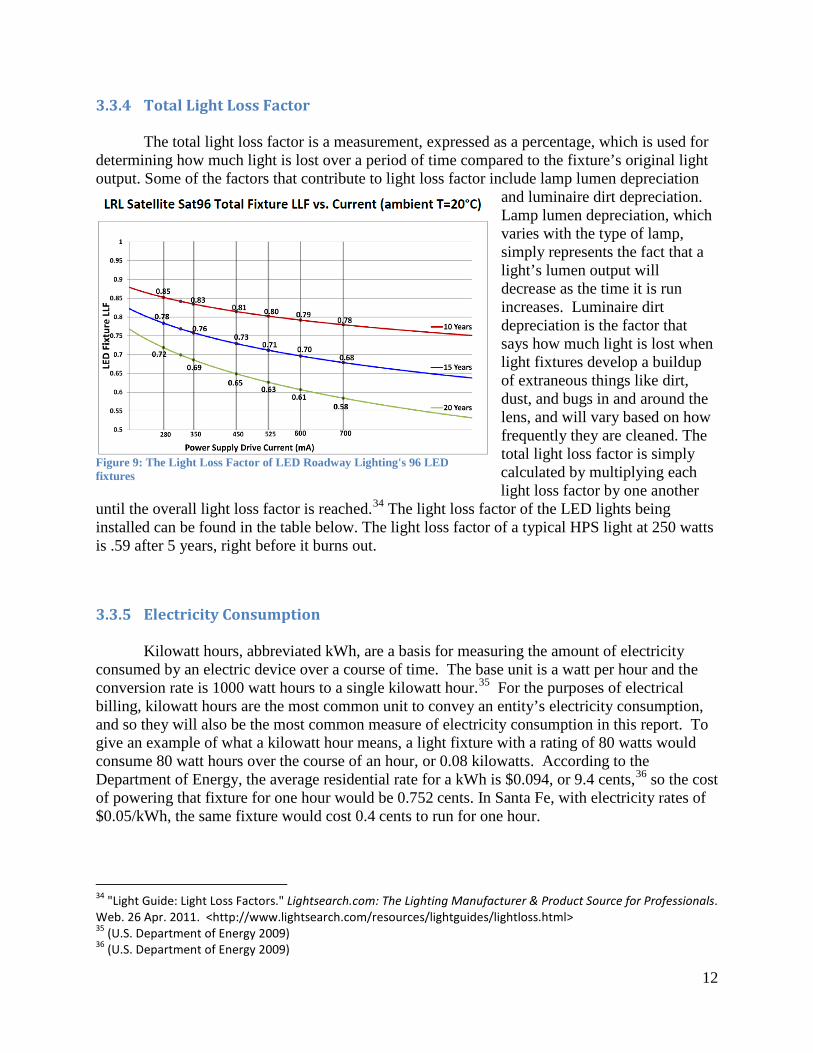
3.3.4 Total Light Loss Factor
The total light loss factor is a measurement, expressed as a percentage, which is used for determining how much light is lost over a period of time compared to the fixture’s original light output. Some of the factors that contribute to light loss factor include lamp lumen depreciation
and luminaire dirt depreciation. Lamp lumen depreciation, which varies with the type of lamp, simply represents the fact that a light’s lumen output will decrease as the time it is run increases. Luminaire dirt depreciation is the factor that says how much light is lost when light fixtures develop a buildup of extraneous things like dirt, dust, and bugs in and around the lens, and will vary based on how frequently they are cleaned. The total light loss factor is simply calculated by multiplying each light loss factor by one another
until the overall light loss factor is reached.34 The light loss factor of the LED lights being installed can be found in the table below. The light loss factor of a typical HPS light at 250 watts is .59 after 5 years, right before it burns out.
3.3.5 Electricity Consumption Kilowatt hours, abbreviated kWh, are a basis for measuring the amount of electricity
consumed by an electric device over a course of time. The base unit is a watt per hour and the conversion rate is 1000 watt hours to a single kilowatt hour.35 For the purposes of electrical billing, kilowatt hours are the most common unit to convey an entity’s electricity consumption, and so they will also be the most common measure of electricity consumption in this report. To give an example of what a kilowatt hour means, a light fixture with a rating of 80 watts would consume 80 watt hours over the course of an hour, or 0.08 kilowatts. According to the Department of Energy, the average residential rate for a kWh is $0.094, or 9.4 cents,36 so the cost of powering that fixture for one hour would be 0.752 cents. In Santa Fe, with electricity rates of $0.05/kWh, the same fixture would cost 0.4 cents to run for one hour.
34 "Light Guide: Light Loss Factors." Lightsearch.com: The Lighting Manufacturer & Product Source for Professionals. Web. 26 Apr. 2011. <http://www.lightsearch.com/resources/lightguides/lightloss.html> 35 (U.S. Department of Energy 2009) 36 (U.S. Department of Energy 2009)
Figure 9: The Light Loss Factor of LED Roadway Lighting's 96 LED fixtures
13
3.3.6 Santa Fe’s Intersection Lighting Guidelines
The city has defined an intersection as the area bounded by the outer limits of the crosswalks, if there are any. These lighting requirements set forth by the city are meeting an average of 2.0 foot candles throughout the intersection as well as having a minimum reading of 0.8 foot candles in at least 90% of the intersection.
3.4 General Lighting Information
The following section discusses high pressure sodium (HPS) lighting, a form of illumination that Santa Fe currently uses in its streetlights. It also discusses light emitting diode (LED) lighting, the kind of illumination Santa Fe would like upgrade its streetlights with. Table 1 shows a comparison of HPS and LED lights. The two different types of poles and lighting encountered throughout this project are also discussed in detail.
3.4.1 High Pressure Sodium Vapor (HPS) Lighting The bulbs currently used for street lighting in Santa Fe are high pressure sodium vapor
bulbs (HPS). HPS lights emit a yellow light and have CRIs that range from 25 to 30,37 with a luminous efficiency of roughly 120 lumens per watt.38 However, the high pressure lights slowly lose their brightness with time.39 The upfront cost of a single, 250 watt, high pressure sodium vapor bulb is approximately $24.40 The lifespan of high pressure sodium vapor lights average around 20,000 hours which equates to around 4.5 years of usage assuming that the bulbs are in use for 12 hours a day.41 The high pressure lamps are more appropriate for nighttime or outdoor use such as street lighting or parking lot lighting.42 Sodium vapor lights can be useful in these settings because the area of coverage provided by the light is very large. A glaring drawback associated with HPS lighting however is that they require special disposal methods due to the harmful nature of the chemicals used in them, which leads to further costs.43
37 (Light Bulbs at the Glance n.d.) 38 (White LED Lights with 135 Lumens per Watt About Ten Time Better than Incandescent n.d.) 39 (Benefits of LED Light Bulbs n.d.) 40 (Light Bulbs at the Glance n.d.) 41 (Light Bulbs at the Glance n.d.) 42 (Why LEDs can be 10 times as efficient as incandescents in some applications but not in general home lighting! n.d.) 43 (LED Light Bulbs: Comparison Charts n.d.)
14
3.4.2 Light Emitting Diode (LED) Lighting
There are many reasons that make LEDs an attractive lighting option. The most well-known advantage is lifespan, as LED lights last upwards of 100,000 hours, or about 20 years if they are run 12 hours/day. Unlike the systems of many other kinds of lights, if one diode in an LED fixture fails, the remaining diodes will continue to run and the failed diode can just be replaced individually. LEDs also have a CRI of about 70, a comparatively high value, and produce approximately 70 lumens/watt, as can be seen in the spec sheets included in Appendix 8.4. In addition LEDs are extremely durable, since they do not contain the fragile tube or filaments found in other lights, require only a few seconds to be powered on, and do not require any kind of proper disposal once they burn out or if they break, since they contain no harmful chemicals.44
3.4.3 Types of Poles
The New Mexico DOT has classifications for all kinds of lighting poles used throughout the state. However, the only ones pertaining to streetlights that were relevant for this report were type III and type V poles.
3.4.3.1 Type III Poles
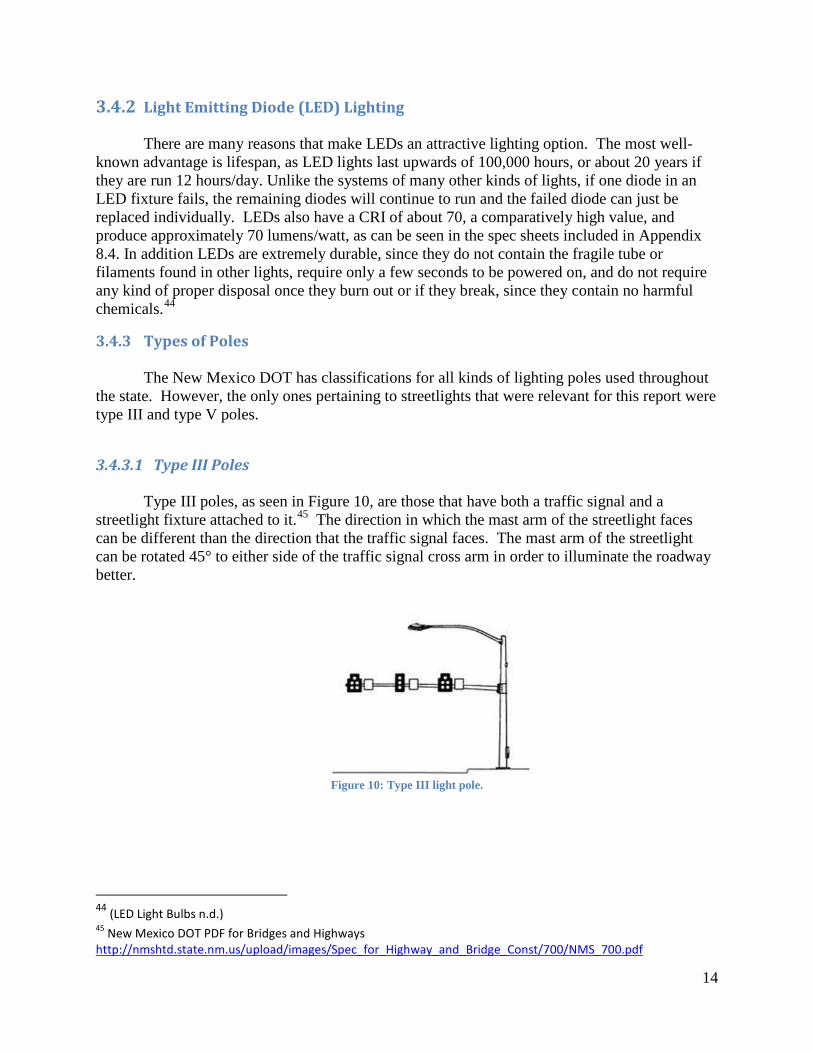
Type III poles, as seen in Figure 10, are those that have both a traffic signal and a streetlight fixture attached to it.45 The direction in which the mast arm of the streetlight faces can be different than the direction that the traffic signal faces. The mast arm of the streetlight can be rotated 45° to either side of the traffic signal cross arm in order to illuminate the roadway better.
Figure 10: Type III light pole.
44 (LED Light Bulbs n.d.) 45 New Mexico DOT PDF for Bridges and Highways http://nmshtd.state.nm.us/upload/images/Spec_for_Highway_and_Bridge_Const/700/NMS_700.pdf
15
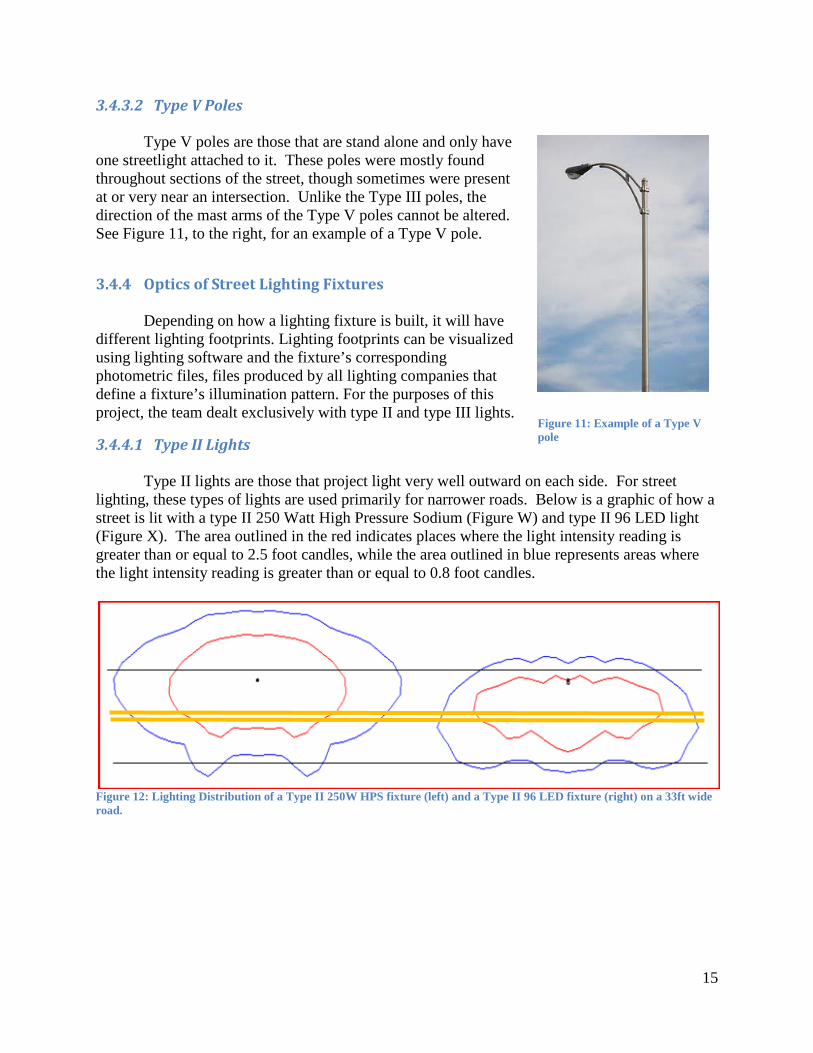
3.4.3.2 Type V Poles
Type V poles are those that are stand alone and only have one streetlight attached to it. These poles were mostly found throughout sections of the street, though sometimes were present at or very near an intersection. Unlike the Type III poles, the direction of the mast arms of the Type V poles cannot be altered. See Figure 11, to the right, for an example of a Type V pole.
3.4.4 Optics of Street Lighting Fixtures
Depending on how a lighting fixture is built, it will have different lighting footprints. Lighting footprints can be visualized using lighting software and the fixture’s corresponding photometric files, files produced by all lighting companies that define a fixture’s illumination pattern. For the purposes of this project, the team dealt exclusively with type II and type III lights.
3.4.4.1 Type II Lights
Type II lights are those that project light very well outward on each side. For street lighting, these types of lights are used primarily for narrower roads. Below is a graphic of how a street is lit with a type II 250 Watt High Pressure Sodium (Figure W) and type II 96 LED light (Figure X). The area outlined in the red indicates places where the light intensity reading is greater than or equal to 2.5 foot candles, while the area outlined in blue represents areas where the light intensity reading is greater than or equal to 0.8 foot candles.
Figure 12: Lighting Distribution of a Type II 250W HPS fixture (left) and a Type II 96 LED fixture (right) on a 33ft wide road.
Figure 11: Example of a Type V pole
16
3.4.4.2 Type III Lights
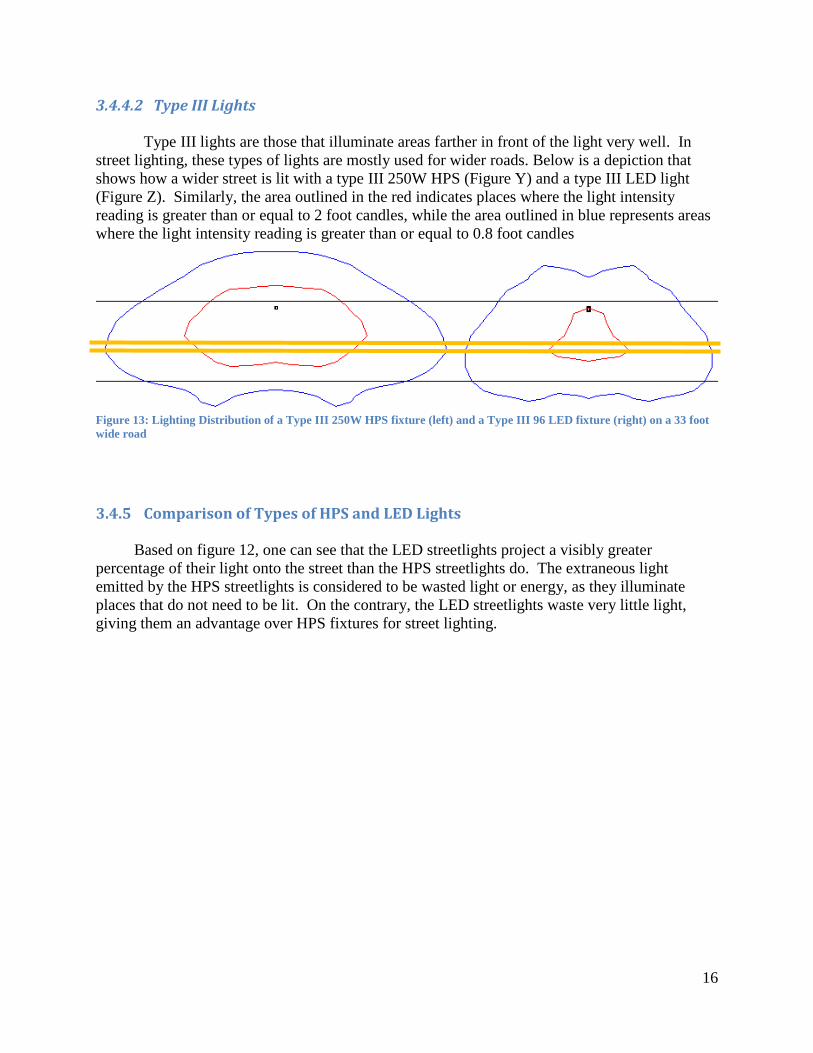
Type III lights are those that illuminate areas farther in front of the light very well. In street lighting, these types of lights are mostly used for wider roads. Below is a depiction that shows how a wider street is lit with a type III 250W HPS (Figure Y) and a type III LED light (Figure Z). Similarly, the area outlined in the red indicates places where the light intensity reading is greater than or equal to 2 foot candles, while the area outlined in blue represents areas where the light intensity reading is greater than or equal to 0.8 foot candles
Figure 13: Lighting Distribution of a Type III 250W HPS fixture (left) and a Type III 96 LED fixture (right) on a 33 foot wide road
3.4.5 Comparison of Types of HPS and LED Lights
Based on figure 12, one can see that the LED streetlights project a visibly greater percentage of their light onto the street than the HPS streetlights do. The extraneous light emitted by the HPS streetlights is considered to be wasted light or energy, as they illuminate places that do not need to be lit. On the contrary, the LED streetlights waste very little light, giving them an advantage over HPS fixtures for street lighting.
17
3.5 Street Lighting
This section discusses the General Electric HPS fixtures that are used in the majority of Santa Fe’s streetlights and LED Roadway LED fixtures that this report suggests to supplant the HPSs.
3.5.1 GE (General Electric) HPS Fixtures
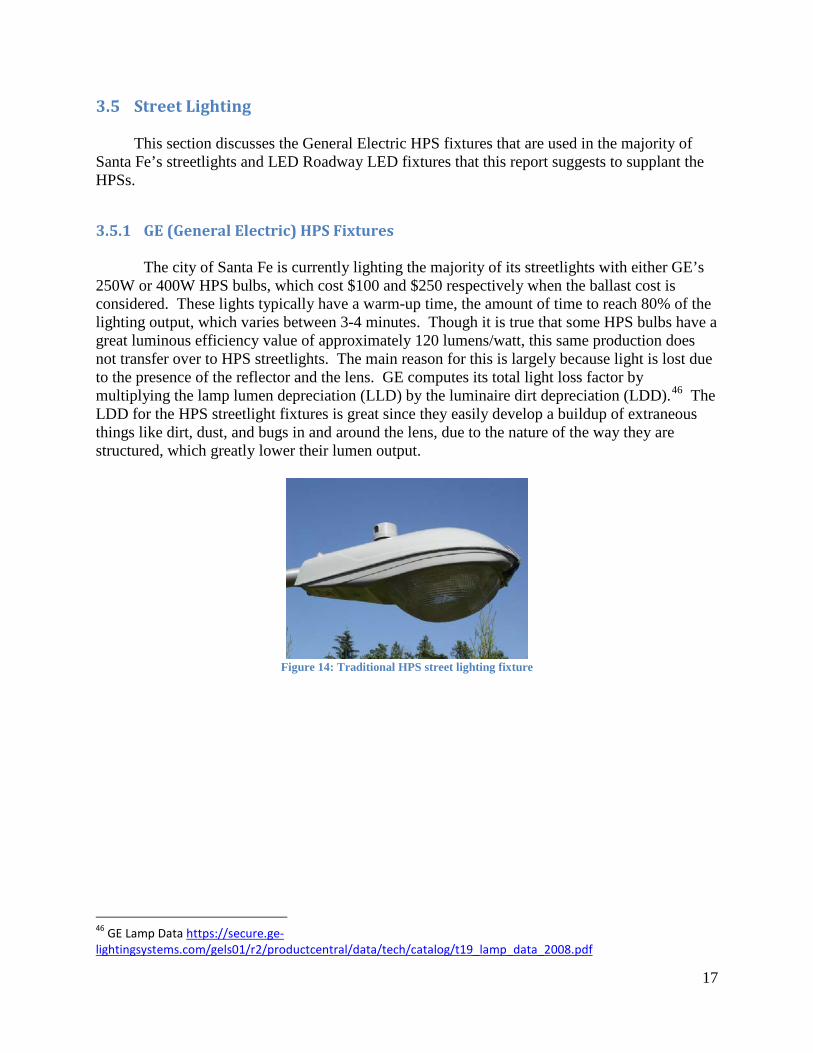
The city of Santa Fe is currently lighting the majority of its streetlights with either GE’s 250W or 400W HPS bulbs, which cost $100 and $250 respectively when the ballast cost is considered. These lights typically have a warm-up time, the amount of time to reach 80% of the lighting output, which varies between 3-4 minutes. Though it is true that some HPS bulbs have a great luminous efficiency value of approximately 120 lumens/watt, this same production does not transfer over to HPS streetlights. The main reason for this is largely because light is lost due to the presence of the reflector and the lens. GE computes its total light loss factor by multiplying the lamp lumen depreciation (LLD) by the luminaire dirt depreciation (LDD).46 The LDD for the HPS streetlight fixtures is great since they easily develop a buildup of extraneous things like dirt, dust, and bugs in and around the lens, due to the nature of the way they are structured, which greatly lower their lumen output.
Figure 14: Traditional HPS street lighting fixture
46 GE Lamp Data https://secure.ge-lightingsystems.com/gels01/r2/productcentral/data/tech/catalog/t19_lamp_data_2008.pdf

18
3.5.2 LED Roadway Streetlight Fixtures
The majority of the LED Roadway Lighting fixtures the team used were 96 LED fixtures, run at 600 milliamps, which draw 201 W of electricity and output 59 lumens per watt. The light loss factor for this size of LED is .79 after 10 years and.62 after 20 years47. The lifespan of LED Roadway’s fixtures is around 20 years, which means that they still emit 62% of the light they produced originally after 20 years. The most significant advantage of the LED Roadway fixtures is that they were specifically designed to light streets, meaning they only illuminate streets and sidewalks, hence wasting very little light.48
Figure 15: LED Roadway Lighting LED fixture.
47 LED Roadway LLF pdf http://www.ledroadwaylighting.com/light-loss-factor.html 48 "Optics | Advantages | LED Roadway Lighting." LED Roadway Lighting Ltd | LED Lighting Solutions for Roads & Highways | Environmentally Friendly | Cost Effective. http://www.ledroadwaylighting.com/optics.html
19
Methodology 4 The goal of this project is to present the city of Santa Fe with an analysis of its
streetlights at signaled intersections, and propose a plan to the city to replace these street lights with LED lights to reduce maintenance costs and maximize the number of retrofitted intersections, while maintaining safe lighting levels. The data collection and analysis portion of the project took place between March 21st, 2011 and May 7th, 2011. The installation of the LED fixtures will occur after May 7th, 2011 with no set dates as of the writing of this report. The team accomplished the goals of the project by achieving these objectives:
1. Gather all relevant physical data for all signaled intersections in the city of Santa Fe. 2. Create a model of each intersection in AutoCAD, using Google Earth images as a guide. 3. Use AGi32 lighting software to determine the optimal lighting configuration for each
intersection, taking into account fixture size, running amperage, and physical characteristics of intersections.
4.1 Gathering all relevant physical data In order to properly analyze the city’s 115 signaled intersections, a number of physical characteristics had to be measured and recorded. The team measured street width, pole setback, fixture height, and arm length for use in the modeling and lighting optimization of each intersection.
4.1.1 Physical Measurements
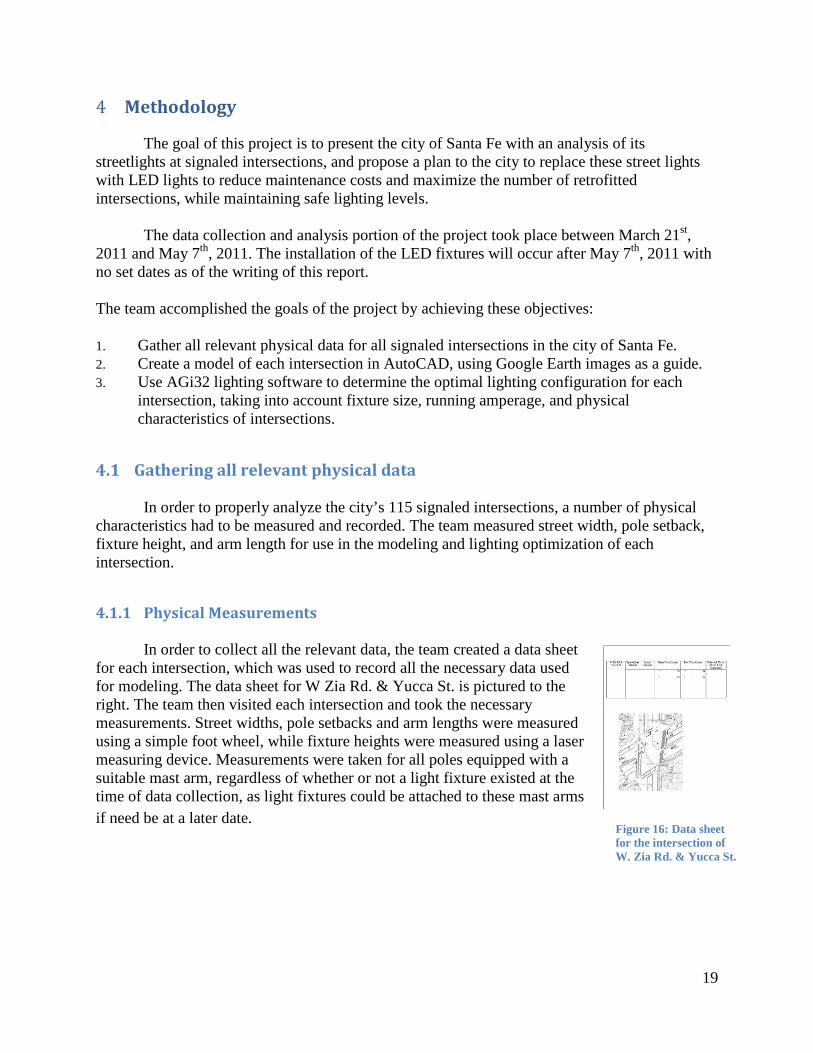
In order to collect all the relevant data, the team created a data sheet for each intersection, which was used to record all the necessary data used for modeling. The data sheet for W Zia Rd. & Yucca St. is pictured to the right. The team then visited each intersection and took the necessary measurements. Street widths, pole setbacks and arm lengths were measured using a simple foot wheel, while fixture heights were measured using a laser measuring device. Measurements were taken for all poles equipped with a suitable mast arm, regardless of whether or not a light fixture existed at the time of data collection, as light fixtures could be attached to these mast arms if need be at a later date.
Figure 16: Data sheet for the intersection of W. Zia Rd. & Yucca St.
20
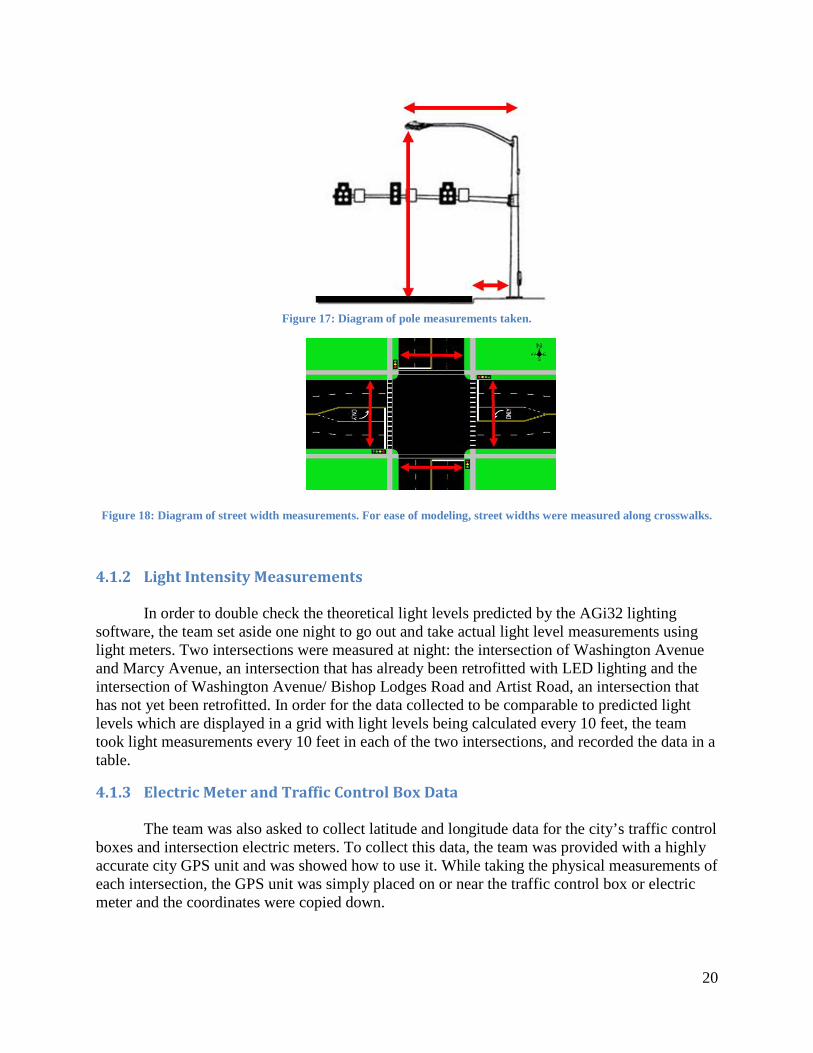
Figure 17: Diagram of pole measurements taken.
Figure 18: Diagram of street width measurements. For ease of modeling, street widths were measured along crosswalks.
4.1.2 Light Intensity Measurements In order to double check the theoretical light levels predicted by the AGi32 lighting
software, the team set aside one night to go out and take actual light level measurements using light meters. Two intersections were measured at night: the intersection of Washington Avenue and Marcy Avenue, an intersection that has already been retrofitted with LED lighting and the intersection of Washington Avenue/ Bishop Lodges Road and Artist Road, an intersection that has not yet been retrofitted. In order for the data collected to be comparable to predicted light levels which are displayed in a grid with light levels being calculated every 10 feet, the team took light measurements every 10 feet in each of the two intersections, and recorded the data in a table.
4.1.3 Electric Meter and Traffic Control Box Data The team was also asked to collect latitude and longitude data for the city’s traffic control
boxes and intersection electric meters. To collect this data, the team was provided with a highly accurate city GPS unit and was showed how to use it. While taking the physical measurements of each intersection, the GPS unit was simply placed on or near the traffic control box or electric meter and the coordinates were copied down.
21
4.1.4 Pedestrian Crash Data The team was also asked to analyze crash data from the city and state to see if lighting
conditions could be considered as a factor in pedestrian crashes in recent years. The team was given access to databases maintained by various transportation agencies in the area, which were analyzed for crashes occurring at night with a mention of lighting anywhere in the report.
4.2 Model Each Intersection in AutoCAD
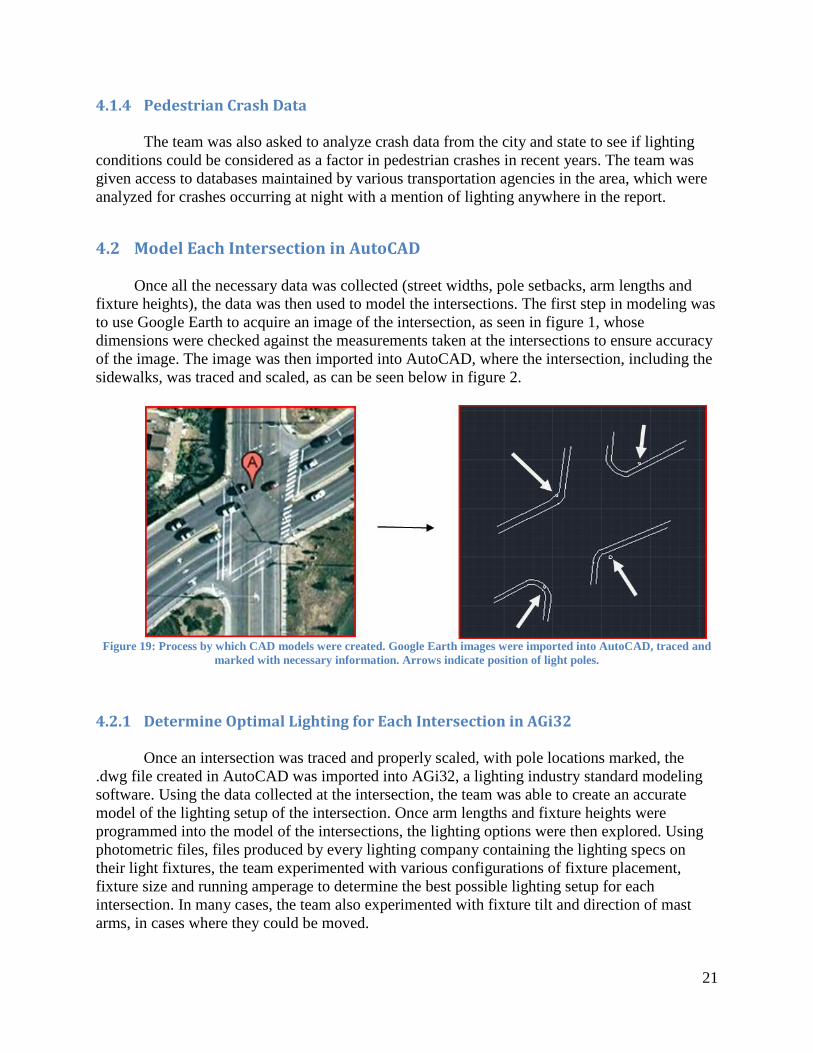
Once all the necessary data was collected (street widths, pole setbacks, arm lengths and fixture heights), the data was then used to model the intersections. The first step in modeling was to use Google Earth to acquire an image of the intersection, as seen in figure 1, whose dimensions were checked against the measurements taken at the intersections to ensure accuracy of the image. The image was then imported into AutoCAD, where the intersection, including the sidewalks, was traced and scaled, as can be seen below in figure 2.
Figure 19: Process by which CAD models were created. Google Earth images were imported into AutoCAD, traced and
marked with necessary information. Arrows indicate position of light poles.
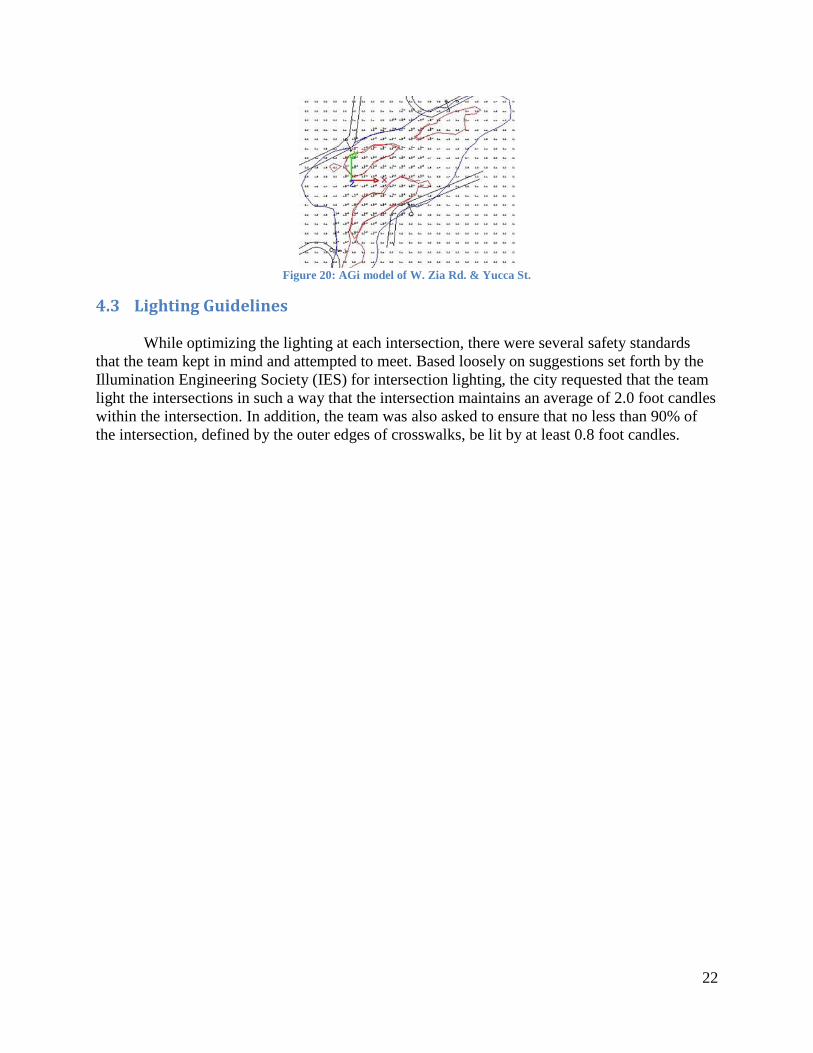
4.2.1 Determine Optimal Lighting for Each Intersection in AGi32
Once an intersection was traced and properly scaled, with pole locations marked, the .dwg file created in AutoCAD was imported into AGi32, a lighting industry standard modeling software. Using the data collected at the intersection, the team was able to create an accurate model of the lighting setup of the intersection. Once arm lengths and fixture heights were programmed into the model of the intersections, the lighting options were then explored. Using photometric files, files produced by every lighting company containing the lighting specs on their light fixtures, the team experimented with various configurations of fixture placement, fixture size and running amperage to determine the best possible lighting setup for each intersection. In many cases, the team also experimented with fixture tilt and direction of mast arms, in cases where they could be moved.
22
Figure 20: AGi model of W. Zia Rd. & Yucca St.
4.3 Lighting Guidelines While optimizing the lighting at each intersection, there were several safety standards
that the team kept in mind and attempted to meet. Based loosely on suggestions set forth by the Illumination Engineering Society (IES) for intersection lighting, the city requested that the team light the intersections in such a way that the intersection maintains an average of 2.0 foot candles within the intersection. In addition, the team was also asked to ensure that no less than 90% of the intersection, defined by the outer edges of crosswalks, be lit by at least 0.8 foot candles.
23
Results & Analysis 5
5.1 Intersection Lighting Models
This section discusses the data obtained from the methods discussed in the methodology section of this paper. This section discusses our characterization of signaled intersections, our lighting models of signaled intersections and issues that presented themselves during the modeling, our analysis of intersections suitable for retrofit and analysis of selected lengths of street within the city.
5.1.1 Characterization of Signaled Intersections The team gathered a large amount of data about each signaled intersection; the use of which is discussed in the following subsections.
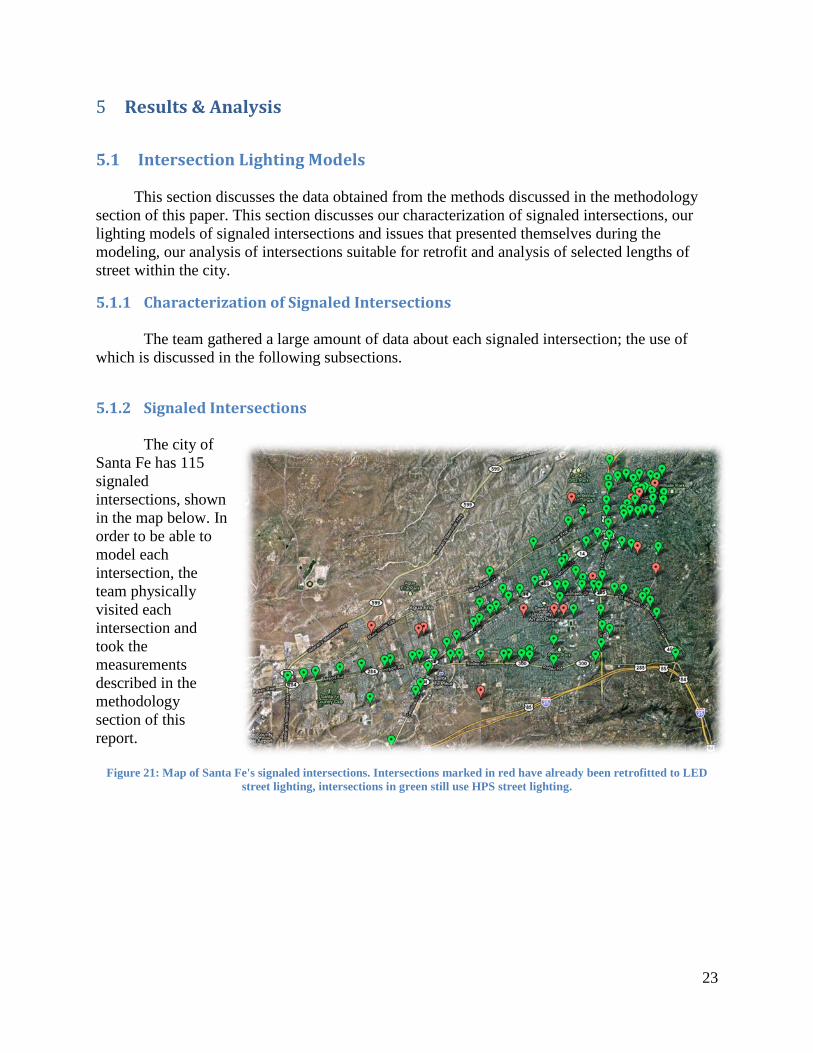
5.1.2 Signaled Intersections The city of Santa Fe has 115 signaled intersections, shown in the map below. In order to be able to model each intersection, the team physically visited each intersection and took the measurements described in the methodology section of this report.
Figure 21: Map of Santa Fe's signaled intersections. Intersections marked in red have already been retrofitted to LED
street lighting, intersections in green still use HPS street lighting.
24
5.1.3 Traffic Control Box and Intersection Electric Meter Data
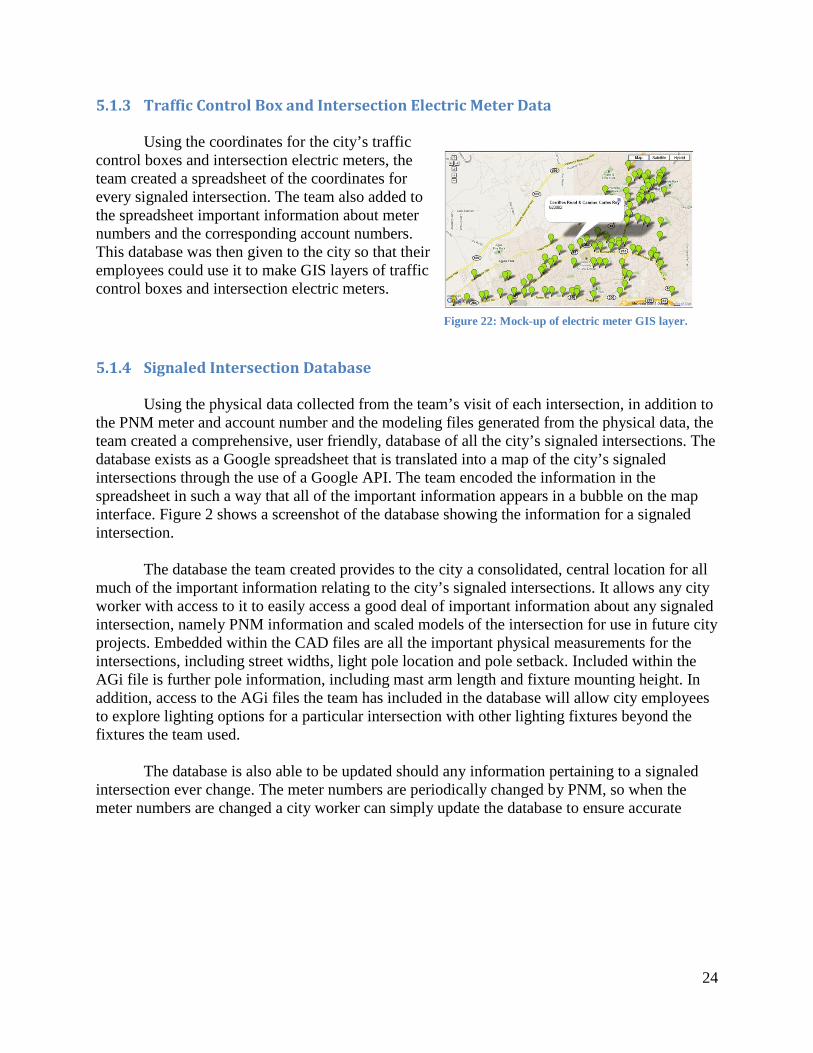
Using the coordinates for the city’s traffic control boxes and intersection electric meters, the team created a spreadsheet of the coordinates for every signaled intersection. The team also added to the spreadsheet important information about meter numbers and the corresponding account numbers. This database was then given to the city so that their employees could use it to make GIS layers of traffic control boxes and intersection electric meters.
5.1.4 Signaled Intersection Database Using the physical data collected from the team’s visit of each intersection, in addition to the PNM meter and account number and the modeling files generated from the physical data, the team created a comprehensive, user friendly, database of all the city’s signaled intersections. The database exists as a Google spreadsheet that is translated into a map of the city’s signaled intersections through the use of a Google API. The team encoded the information in the spreadsheet in such a way that all of the important information appears in a bubble on the map interface. Figure 2 shows a screenshot of the database showing the information for a signaled intersection. The database the team created provides to the city a consolidated, central location for all much of the important information relating to the city’s signaled intersections. It allows any city worker with access to it to easily access a good deal of important information about any signaled intersection, namely PNM information and scaled models of the intersection for use in future city projects. Embedded within the CAD files are all the important physical measurements for the intersections, including street widths, light pole location and pole setback. Included within the AGi file is further pole information, including mast arm length and fixture mounting height. In addition, access to the AGi files the team has included in the database will allow city employees to explore lighting options for a particular intersection with other lighting fixtures beyond the fixtures the team used. The database is also able to be updated should any information pertaining to a signaled intersection ever change. The meter numbers are periodically changed by PNM, so when the meter numbers are changed a city worker can simply update the database to ensure accurate
Figure 22: Mock-up of electric meter GIS layer.
25
5.2 Intersection Lighting Models After an intersection was modeled with optimal lighting in Agi32 software, the team could see the associated illumination patterns for it. Upon completing this process for all 115 signaled intersections, the team could see what the average foot candle rating was for each one as well as what percentage of the intersection was lit at or above 0.8 foot candles, which can be seen in Appendix 8.4. Initially, the team thought that it would be able to find enough intersections to retrofit in order to be able to use up most of the $178,000 allocated for LED fixtures. However, provided that the city defined their intersection lighting requirements as meeting an average coverage of 2.0 foot candles in the intersection and a minimum of reading of .8 foot candles in 90% of the intersection, the team was ultimately only able to find 22 intersections that met these specifications.
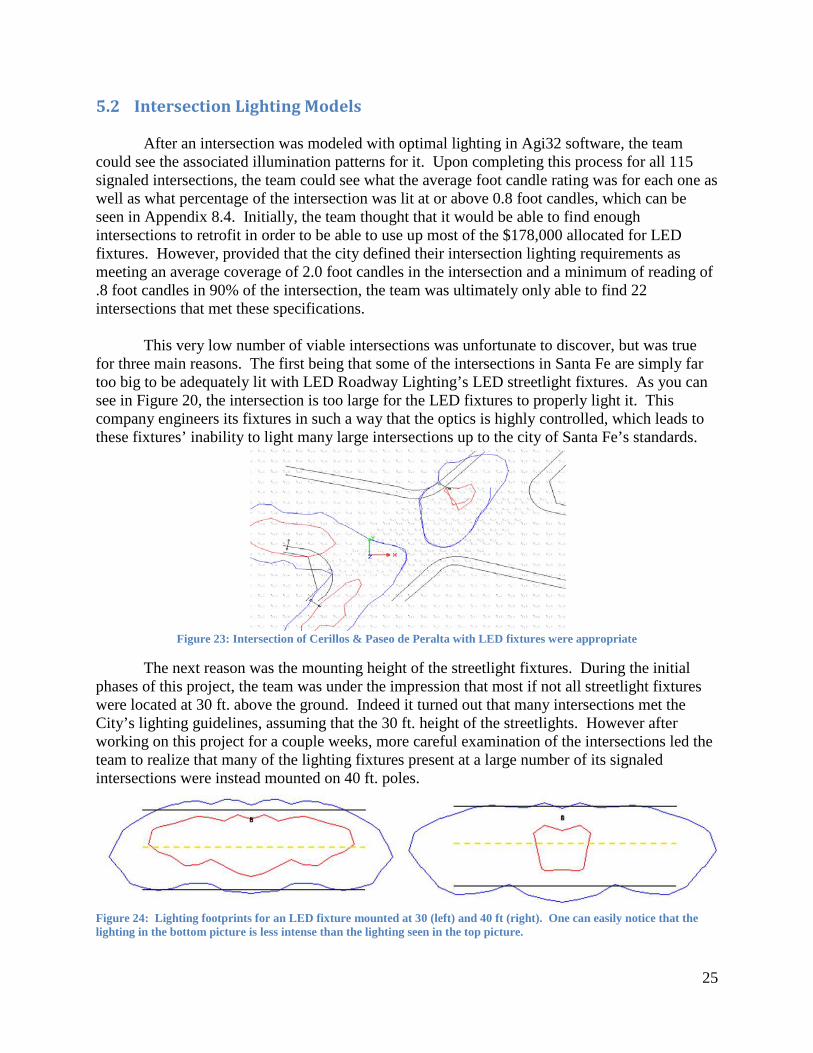
This very low number of viable intersections was unfortunate to discover, but was true for three main reasons. The first being that some of the intersections in Santa Fe are simply far too big to be adequately lit with LED Roadway Lighting’s LED streetlight fixtures. As you can see in Figure 20, the intersection is too large for the LED fixtures to properly light it. This company engineers its fixtures in such a way that the optics is highly controlled, which leads to these fixtures’ inability to light many large intersections up to the city of Santa Fe’s standards.
Figure 23: Intersection of Cerillos & Paseo de Peralta with LED fixtures were appropriate
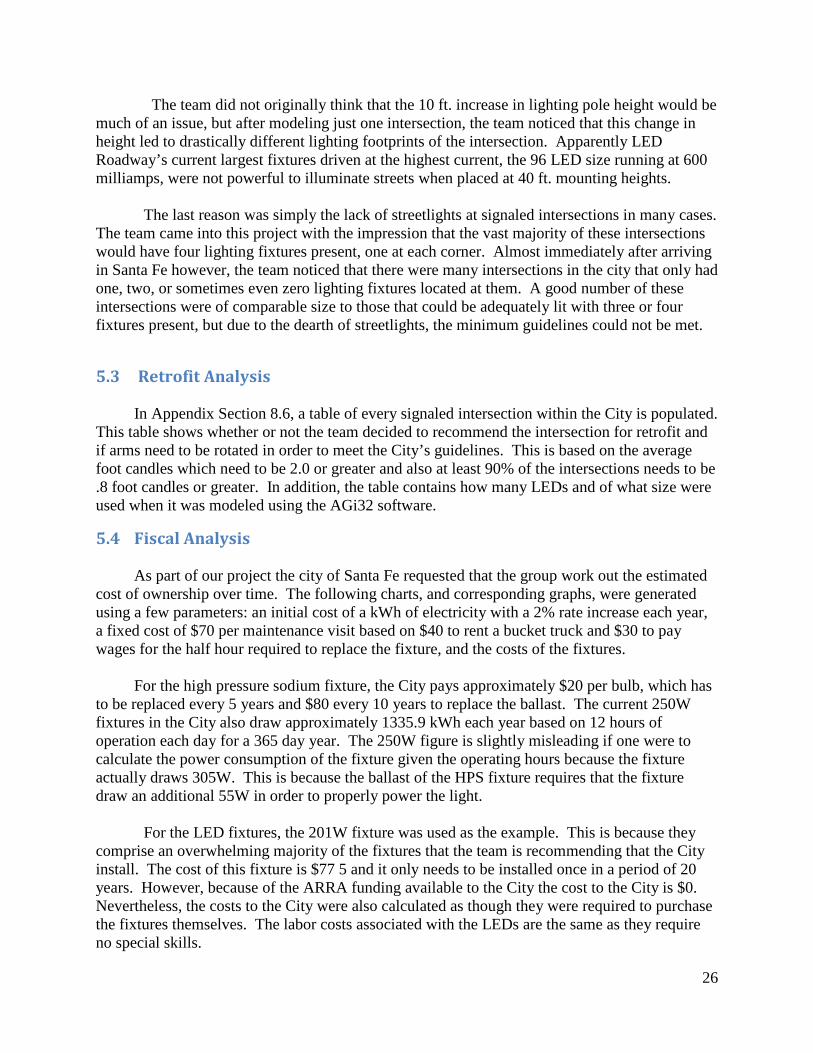
The next reason was the mounting height of the streetlight fixtures. During the initial phases of this project, the team was under the impression that most if not all streetlight fixtures were located at 30 ft. above the ground. Indeed it turned out that many intersections met the City’s lighting guidelines, assuming that the 30 ft. height of the streetlights. However after working on this project for a couple weeks, more careful examination of the intersections led the team to realize that many of the lighting fixtures present at a large number of its signaled intersections were instead mounted on 40 ft. poles.
Figure 24: Lighting footprints for an LED fixture mounted at 30 (left) and 40 ft (right). One can easily notice that the lighting in the bottom picture is less intense than the lighting seen in the top picture.
26
The team did not originally think that the 10 ft. increase in lighting pole height would be much of an issue, but after modeling just one intersection, the team noticed that this change in height led to drastically different lighting footprints of the intersection. Apparently LED Roadway’s current largest fixtures driven at the highest current, the 96 LED size running at 600 milliamps, were not powerful to illuminate streets when placed at 40 ft. mounting heights.
The last reason was simply the lack of streetlights at signaled intersections in many cases.
The team came into this project with the impression that the vast majority of these intersections would have four lighting fixtures present, one at each corner. Almost immediately after arriving in Santa Fe however, the team noticed that there were many intersections in the city that only had one, two, or sometimes even zero lighting fixtures located at them. A good number of these intersections were of comparable size to those that could be adequately lit with three or four fixtures present, but due to the dearth of streetlights, the minimum guidelines could not be met.
5.3 Retrofit Analysis
In Appendix Section 8.6, a table of every signaled intersection within the City is populated. This table shows whether or not the team decided to recommend the intersection for retrofit and if arms need to be rotated in order to meet the City’s guidelines. This is based on the average foot candles which need to be 2.0 or greater and also at least 90% of the intersections needs to be .8 foot candles or greater. In addition, the table contains how many LEDs and of what size were used when it was modeled using the AGi32 software.
5.4 Fiscal Analysis
As part of our project the city of Santa Fe requested that the group work out the estimated cost of ownership over time. The following charts, and corresponding graphs, were generated using a few parameters: an initial cost of a kWh of electricity with a 2% rate increase each year, a fixed cost of $70 per maintenance visit based on $40 to rent a bucket truck and $30 to pay wages for the half hour required to replace the fixture, and the costs of the fixtures.
For the high pressure sodium fixture, the City pays approximately $20 per bulb, which has
to be replaced every 5 years and $80 every 10 years to replace the ballast. The current 250W fixtures in the City also draw approximately 1335.9 kWh each year based on 12 hours of operation each day for a 365 day year. The 250W figure is slightly misleading if one were to calculate the power consumption of the fixture given the operating hours because the fixture actually draws 305W. This is because the ballast of the HPS fixture requires that the fixture draw an additional 55W in order to properly power the light.
For the LED fixtures, the 201W fixture was used as the example. This is because they comprise an overwhelming majority of the fixtures that the team is recommending that the City install. The cost of this fixture is $77 5 and it only needs to be installed once in a period of 20 years. However, because of the ARRA funding available to the City the cost to the City is $0. Nevertheless, the costs to the City were also calculated as though they were required to purchase the fixtures themselves. The labor costs associated with the LEDs are the same as they require no special skills.
27
5.4.1 The Estimated Costs based on New Mexico’s Current Rate of 5 cents/kWh
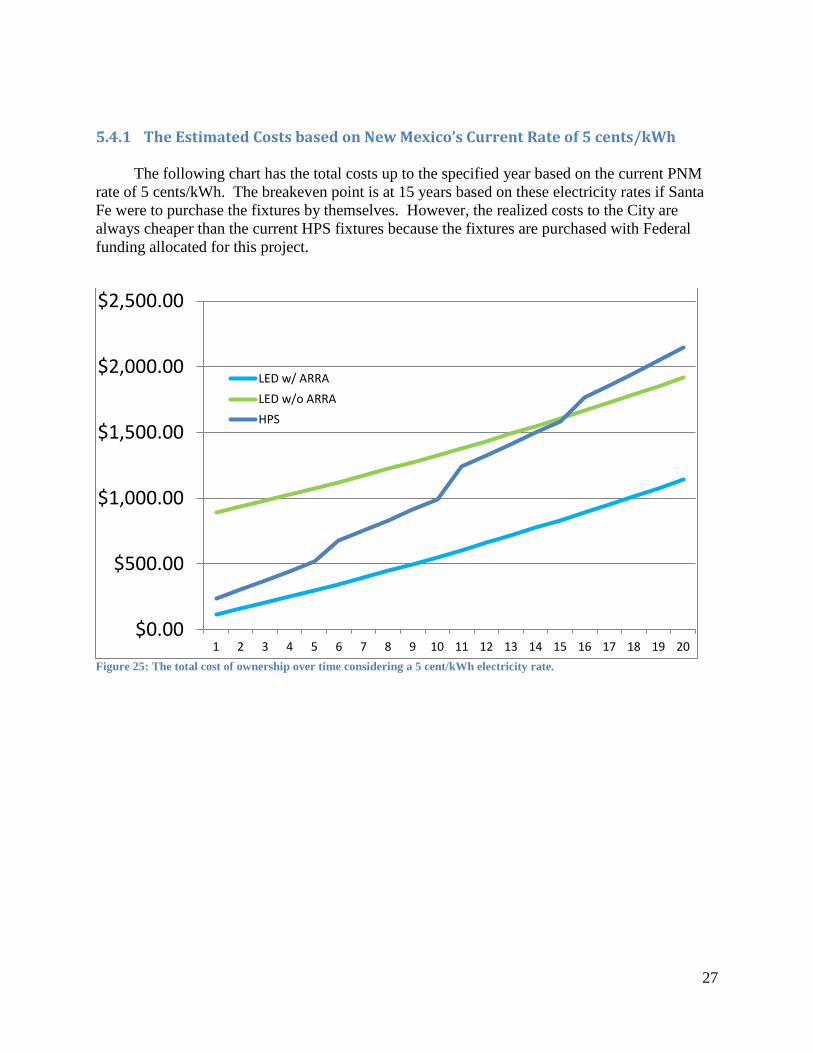
The following chart has the total costs up to the specified year based on the current PNM rate of 5 cents/kWh. The breakeven point is at 15 years based on these electricity rates if Santa Fe were to purchase the fixtures by themselves. However, the realized costs to the City are always cheaper than the current HPS fixtures because the fixtures are purchased with Federal funding allocated for this project.
Figure 25: The total cost of ownership over time considering a 5 cent/kWh electricity rate.
$0.00
$500.00
$1,000.00
$1,500.00
$2,000.00
$2,500.00
1 2 3 4 5 6 7 8 9 10 11 12 13 14 15 16 17 18 19 20
LED w/ ARRALED w/o ARRAHPS
28
5.4.2 The Estimated Costs based on 9.6 cents/kWh
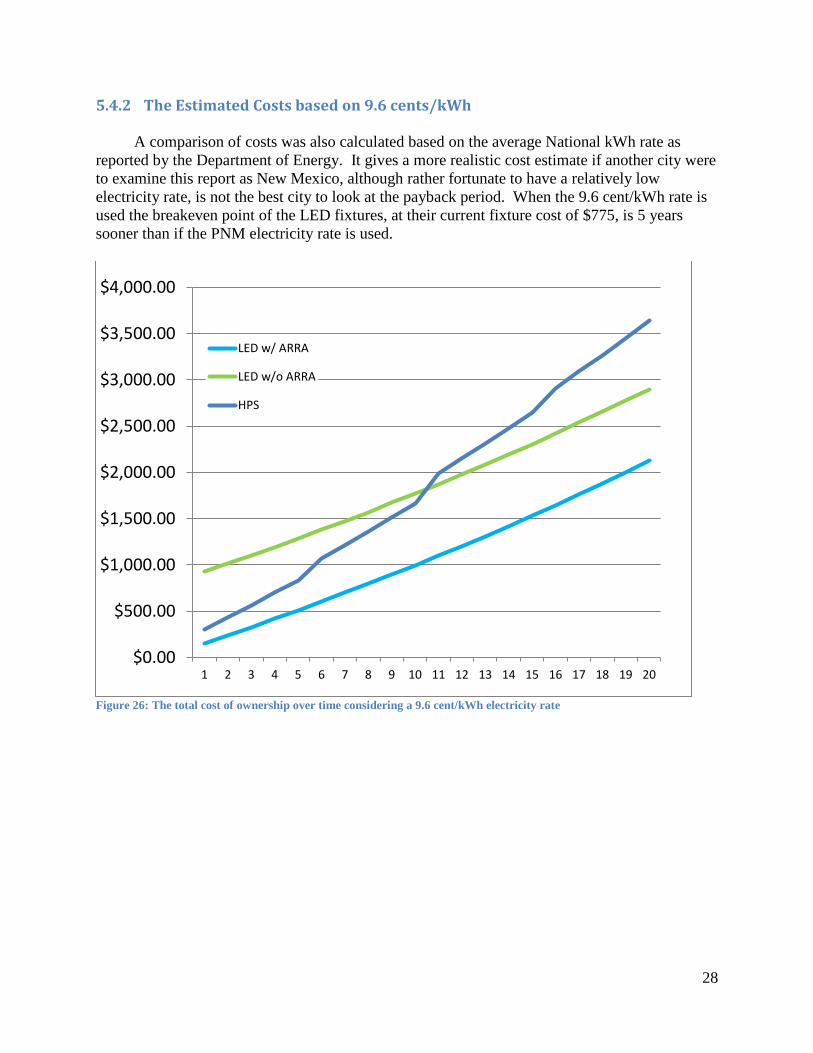
A comparison of costs was also calculated based on the average National kWh rate as reported by the Department of Energy. It gives a more realistic cost estimate if another city were to examine this report as New Mexico, although rather fortunate to have a relatively low electricity rate, is not the best city to look at the payback period. When the 9.6 cent/kWh rate is used the breakeven point of the LED fixtures, at their current fixture cost of $775, is 5 years sooner than if the PNM electricity rate is used.
Figure 26: The total cost of ownership over time considering a 9.6 cent/kWh electricity rate
$0.00
$500.00
$1,000.00
$1,500.00
$2,000.00
$2,500.00
$3,000.00
$3,500.00
$4,000.00
1 2 3 4 5 6 7 8 9 10 11 12 13 14 15 16 17 18 19 20
LED w/ ARRA
LED w/o ARRA
HPS
29
Conclusions and Recommendations 6
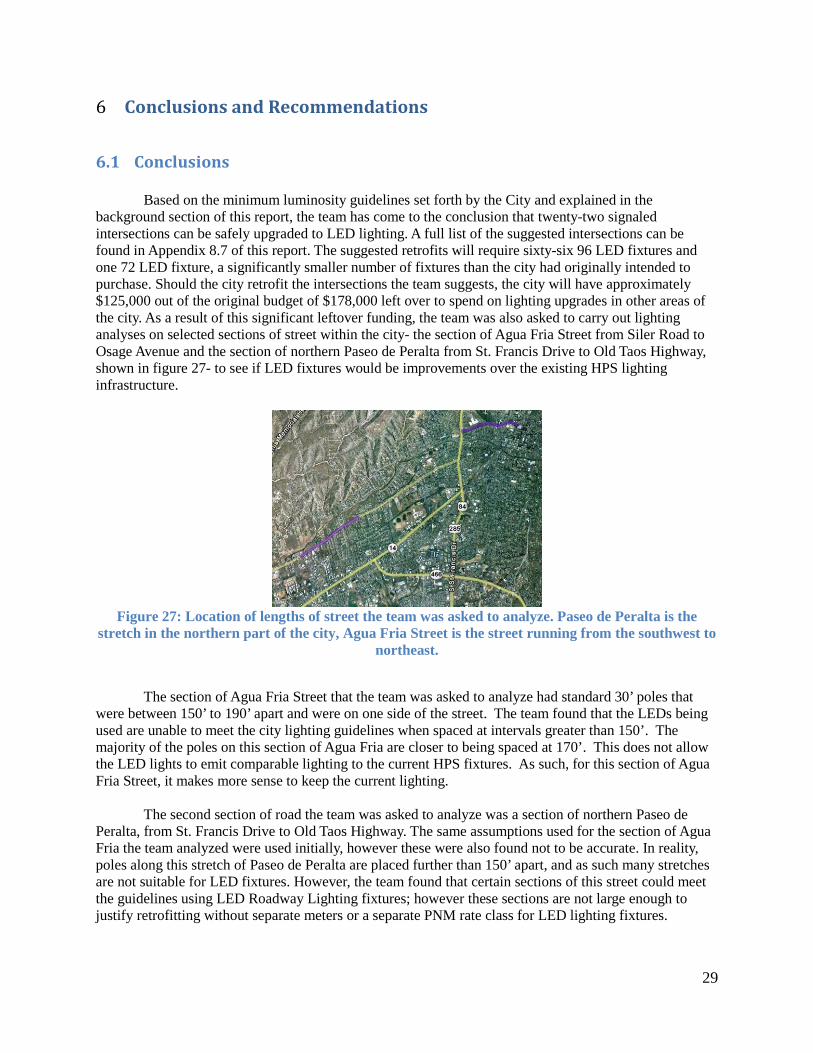
6.1 Conclusions Based on the minimum luminosity guidelines set forth by the City and explained in the background section of this report, the team has come to the conclusion that twenty-two signaled intersections can be safely upgraded to LED lighting. A full list of the suggested intersections can be found in Appendix 8.7 of this report. The suggested retrofits will require sixty-six 96 LED fixtures and one 72 LED fixture, a significantly smaller number of fixtures than the city had originally intended to purchase. Should the city retrofit the intersections the team suggests, the city will have approximately $125,000 out of the original budget of $178,000 left over to spend on lighting upgrades in other areas of the city. As a result of this significant leftover funding, the team was also asked to carry out lighting analyses on selected sections of street within the city- the section of Agua Fria Street from Siler Road to Osage Avenue and the section of northern Paseo de Peralta from St. Francis Drive to Old Taos Highway, shown in figure 27- to see if LED fixtures would be improvements over the existing HPS lighting infrastructure.
Figure 27: Location of lengths of street the team was asked to analyze. Paseo de Peralta is the
stretch in the northern part of the city, Agua Fria Street is the street running from the southwest to northeast.
The section of Agua Fria Street that the team was asked to analyze had standard 30’ poles that were between 150’ to 190’ apart and were on one side of the street. The team found that the LEDs being used are unable to meet the city lighting guidelines when spaced at intervals greater than 150’. The majority of the poles on this section of Agua Fria are closer to being spaced at 170’. This does not allow the LED lights to emit comparable lighting to the current HPS fixtures. As such, for this section of Agua Fria Street, it makes more sense to keep the current lighting.
The second section of road the team was asked to analyze was a section of northern Paseo de Peralta, from St. Francis Drive to Old Taos Highway. The same assumptions used for the section of Agua Fria the team analyzed were used initially, however these were also found not to be accurate. In reality, poles along this stretch of Paseo de Peralta are placed further than 150’ apart, and as such many stretches are not suitable for LED fixtures. However, the team found that certain sections of this street could meet the guidelines using LED Roadway Lighting fixtures; however these sections are not large enough to justify retrofitting without separate meters or a separate PNM rate class for LED lighting fixtures.
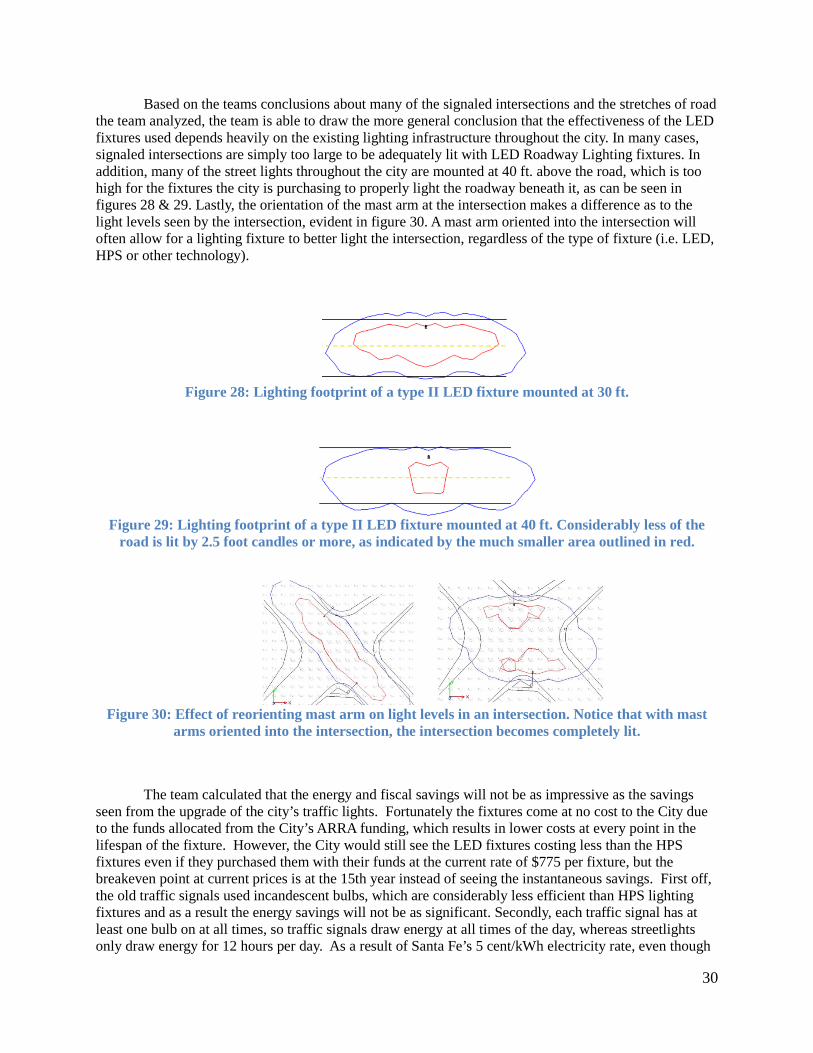
30
Based on the teams conclusions about many of the signaled intersections and the stretches of road the team analyzed, the team is able to draw the more general conclusion that the effectiveness of the LED fixtures used depends heavily on the existing lighting infrastructure throughout the city. In many cases, signaled intersections are simply too large to be adequately lit with LED Roadway Lighting fixtures. In addition, many of the street lights throughout the city are mounted at 40 ft. above the road, which is too high for the fixtures the city is purchasing to properly light the roadway beneath it, as can be seen in figures 28 & 29. Lastly, the orientation of the mast arm at the intersection makes a difference as to the light levels seen by the intersection, evident in figure 30. A mast arm oriented into the intersection will often allow for a lighting fixture to better light the intersection, regardless of the type of fixture (i.e. LED, HPS or other technology).
Figure 28: Lighting footprint of a type II LED fixture mounted at 30 ft.
Figure 29: Lighting footprint of a type II LED fixture mounted at 40 ft. Considerably less of the
road is lit by 2.5 foot candles or more, as indicated by the much smaller area outlined in red.
Figure 30: Effect of reorienting mast arm on light levels in an intersection. Notice that with mast
arms oriented into the intersection, the intersection becomes completely lit.
The team calculated that the energy and fiscal savings will not be as impressive as the savings seen from the upgrade of the city’s traffic lights. Fortunately the fixtures come at no cost to the City due to the funds allocated from the City’s ARRA funding, which results in lower costs at every point in the lifespan of the fixture. However, the City would still see the LED fixtures costing less than the HPS fixtures even if they purchased them with their funds at the current rate of $775 per fixture, but the breakeven point at current prices is at the 15th year instead of seeing the instantaneous savings. First off, the old traffic signals used incandescent bulbs, which are considerably less efficient than HPS lighting fixtures and as a result the energy savings will not be as significant. Secondly, each traffic signal has at least one bulb on at all times, so traffic signals draw energy at all times of the day, whereas streetlights only draw energy for 12 hours per day. As a result of Santa Fe’s 5 cent/kWh electricity rate, even though
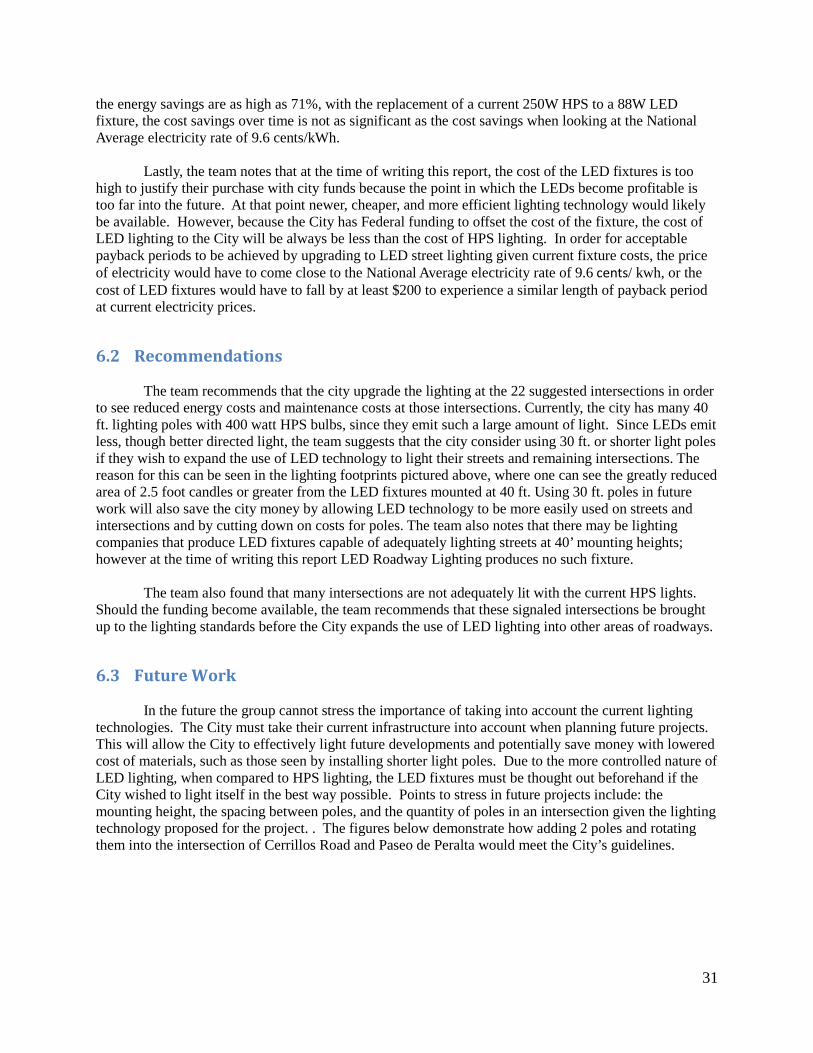
31
the energy savings are as high as 71%, with the replacement of a current 250W HPS to a 88W LED fixture, the cost savings over time is not as significant as the cost savings when looking at the National Average electricity rate of 9.6 cents/kWh.
Lastly, the team notes that at the time of writing this report, the cost of the LED fixtures is too high to justify their purchase with city funds because the point in which the LEDs become profitable is too far into the future. At that point newer, cheaper, and more efficient lighting technology would likely be available. However, because the City has Federal funding to offset the cost of the fixture, the cost of LED lighting to the City will be always be less than the cost of HPS lighting. In order for acceptable payback periods to be achieved by upgrading to LED street lighting given current fixture costs, the price of electricity would have to come close to the National Average electricity rate of 9.6 cents/ kwh, or the cost of LED fixtures would have to fall by at least $200 to experience a similar length of payback period at current electricity prices.
6.2 Recommendations The team recommends that the city upgrade the lighting at the 22 suggested intersections in order to see reduced energy costs and maintenance costs at those intersections. Currently, the city has many 40 ft. lighting poles with 400 watt HPS bulbs, since they emit such a large amount of light. Since LEDs emit less, though better directed light, the team suggests that the city consider using 30 ft. or shorter light poles if they wish to expand the use of LED technology to light their streets and remaining intersections. The reason for this can be seen in the lighting footprints pictured above, where one can see the greatly reduced area of 2.5 foot candles or greater from the LED fixtures mounted at 40 ft. Using 30 ft. poles in future work will also save the city money by allowing LED technology to be more easily used on streets and intersections and by cutting down on costs for poles. The team also notes that there may be lighting companies that produce LED fixtures capable of adequately lighting streets at 40’ mounting heights; however at the time of writing this report LED Roadway Lighting produces no such fixture. The team also found that many intersections are not adequately lit with the current HPS lights. Should the funding become available, the team recommends that these signaled intersections be brought up to the lighting standards before the City expands the use of LED lighting into other areas of roadways.
6.3 Future Work
In the future the group cannot stress the importance of taking into account the current lighting technologies. The City must take their current infrastructure into account when planning future projects. This will allow the City to effectively light future developments and potentially save money with lowered cost of materials, such as those seen by installing shorter light poles. Due to the more controlled nature of LED lighting, when compared to HPS lighting, the LED fixtures must be thought out beforehand if the City wished to light itself in the best way possible. Points to stress in future projects include: the mounting height, the spacing between poles, and the quantity of poles in an intersection given the lighting technology proposed for the project. . The figures below demonstrate how adding 2 poles and rotating them into the intersection of Cerrillos Road and Paseo de Peralta would meet the City’s guidelines.
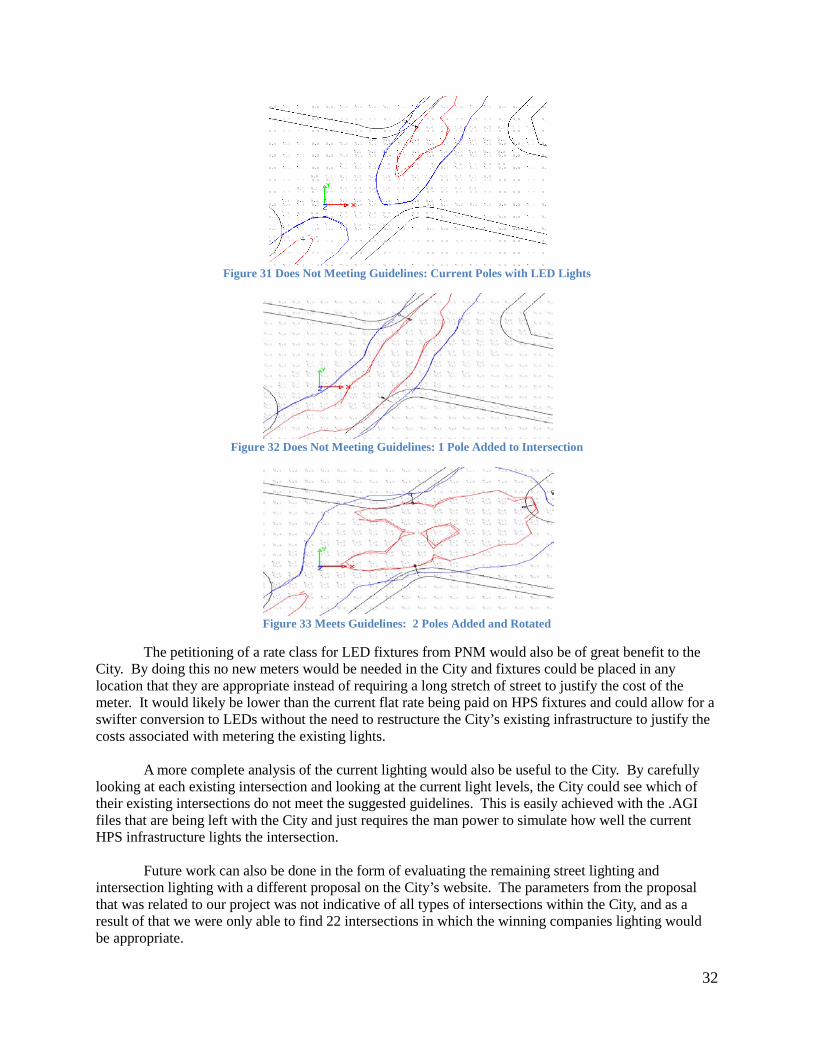
32
Figure 31 Does Not Meeting Guidelines: Current Poles with LED Lights
Figure 32 Does Not Meeting Guidelines: 1 Pole Added to Intersection
Figure 33 Meets Guidelines: 2 Poles Added and Rotated
The petitioning of a rate class for LED fixtures from PNM would also be of great benefit to the City. By doing this no new meters would be needed in the City and fixtures could be placed in any location that they are appropriate instead of requiring a long stretch of street to justify the cost of the meter. It would likely be lower than the current flat rate being paid on HPS fixtures and could allow for a swifter conversion to LEDs without the need to restructure the City’s existing infrastructure to justify the costs associated with metering the existing lights. A more complete analysis of the current lighting would also be useful to the City. By carefully looking at each existing intersection and looking at the current light levels, the City could see which of their existing intersections do not meet the suggested guidelines. This is easily achieved with the .AGI files that are being left with the City and just requires the man power to simulate how well the current HPS infrastructure lights the intersection. Future work can also be done in the form of evaluating the remaining street lighting and intersection lighting with a different proposal on the City’s website. The parameters from the proposal that was related to our project was not indicative of all types of intersections within the City, and as a result of that we were only able to find 22 intersections in which the winning companies lighting would be appropriate.
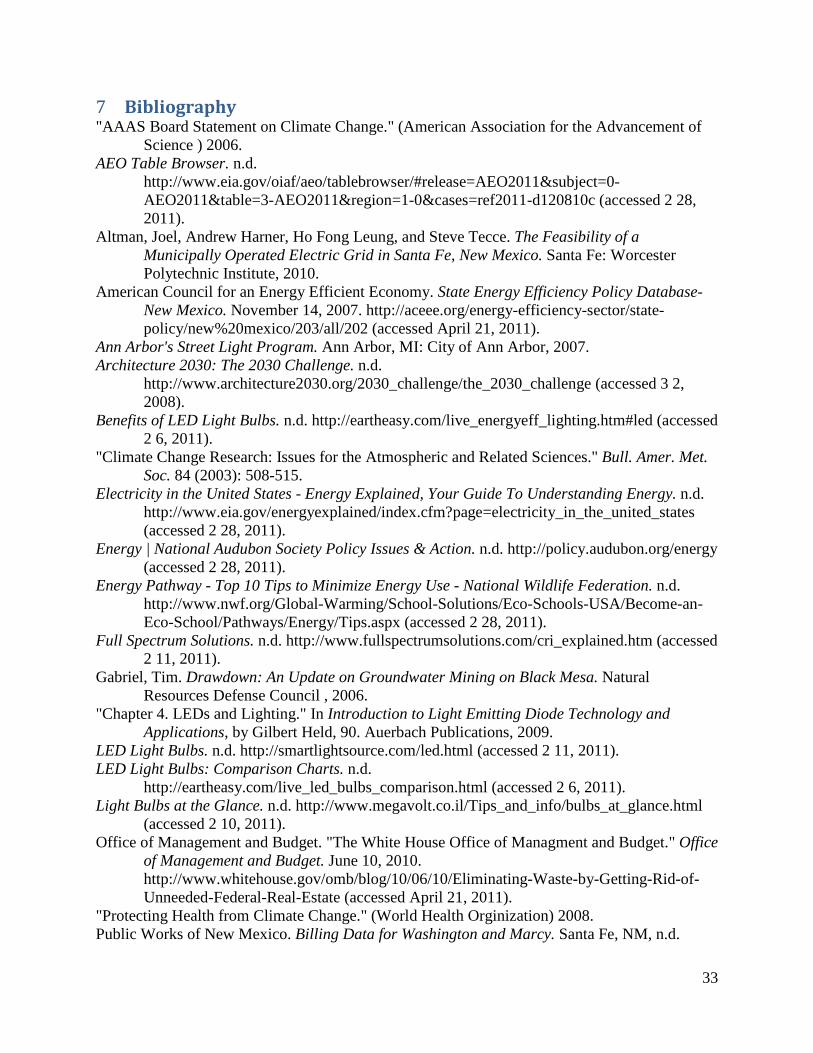
33
Bibliography 7"AAAS Board Statement on Climate Change." (American Association for the Advancement of
Science ) 2006. AEO Table Browser. n.d.
http://www.eia.gov/oiaf/aeo/tablebrowser/#release=AEO2011&subject=0-AEO2011&table=3-AEO2011®ion=1-0&cases=ref2011-d120810c (accessed 2 28, 2011).
Altman, Joel, Andrew Harner, Ho Fong Leung, and Steve Tecce. The Feasibility of a Municipally Operated Electric Grid in Santa Fe, New Mexico. Santa Fe: Worcester Polytechnic Institute, 2010.
American Council for an Energy Efficient Economy. State Energy Efficiency Policy Database- New Mexico. November 14, 2007. http://aceee.org/energy-efficiency-sector/state-policy/new%20mexico/203/all/202 (accessed April 21, 2011).
Ann Arbor's Street Light Program. Ann Arbor, MI: City of Ann Arbor, 2007. Architecture 2030: The 2030 Challenge. n.d.
http://www.architecture2030.org/2030_challenge/the_2030_challenge (accessed 3 2, 2008).
Benefits of LED Light Bulbs. n.d. http://eartheasy.com/live_energyeff_lighting.htm#led (accessed 2 6, 2011).
"Climate Change Research: Issues for the Atmospheric and Related Sciences." Bull. Amer. Met. Soc. 84 (2003): 508-515.
Electricity in the United States - Energy Explained, Your Guide To Understanding Energy. n.d. http://www.eia.gov/energyexplained/index.cfm?page=electricity_in_the_united_states (accessed 2 28, 2011).
Energy | National Audubon Society Policy Issues & Action. n.d. http://policy.audubon.org/energy (accessed 2 28, 2011).
Energy Pathway - Top 10 Tips to Minimize Energy Use - National Wildlife Federation. n.d. http://www.nwf.org/Global-Warming/School-Solutions/Eco-Schools-USA/Become-an-Eco-School/Pathways/Energy/Tips.aspx (accessed 2 28, 2011).
Full Spectrum Solutions. n.d. http://www.fullspectrumsolutions.com/cri_explained.htm (accessed 2 11, 2011).
Gabriel, Tim. Drawdown: An Update on Groundwater Mining on Black Mesa. Natural Resources Defense Council , 2006.
"Chapter 4. LEDs and Lighting." In Introduction to Light Emitting Diode Technology and Applications, by Gilbert Held, 90. Auerbach Publications, 2009.
LED Light Bulbs. n.d. http://smartlightsource.com/led.html (accessed 2 11, 2011). LED Light Bulbs: Comparison Charts. n.d.
http://eartheasy.com/live_led_bulbs_comparison.html (accessed 2 6, 2011). Light Bulbs at the Glance. n.d. http://www.megavolt.co.il/Tips_and_info/bulbs_at_glance.html
(accessed 2 10, 2011). Office of Management and Budget. "The White House Office of Managment and Budget." Office
of Management and Budget. June 10, 2010. http://www.whitehouse.gov/omb/blog/10/06/10/Eliminating-Waste-by-Getting-Rid-of-Unneeded-Federal-Real-Estate (accessed April 21, 2011).
"Protecting Health from Climate Change." (World Health Orginization) 2008. Public Works of New Mexico. Billing Data for Washington and Marcy. Santa Fe, NM, n.d.

34
Santa Fe, NM - Official Website - Clean Renewable Energy. n.d. http://www.santafenm.gov/index.aspx?NID=1364 (accessed 3 2, 2011).
Santa Fe, NM - Official Website - Ecological Adaptation. n.d. http://www.santafenm.gov/index.aspx?NID=1365 (accessed 3 2, 2011).
Santa Fe, NM - Official Website - Water Conservation. n.d. http://www.santafenm.gov/index.aspx?NID=1366 (accessed 3 2, 2011).
Search Award Recipient, LED street lighting. n.d. http://www.recovery.gov/espsearch/Pages/recipient.aspx?k=LED+street+lighting (accessed 3 3, 2011).
Sierra Club Conservation Policies - Energy Conservation and Renewables. n.d. http://www.sierraclub.org/policy/conservation/energycons.aspx (accessed 2 28, 2011).
Sustainable Santa Fe Plan. Santa Fe: City of Santa Fe, 2008. U.S. Department of Energy. Department of Energy Award Number DE-SC0002936. Award
Summary, Santa Fe, New Mexico: U.S. Department of Energy, 2009. U.S. Senate and House of Representatives. "US Government Printing Office." Public Law 111 -
5 - American Recovery and Reinvestment Act of 2009. February 19, 2009. http://www.gpo.gov/fdsys/pkg/PLAW-111publ5/pdf/PLAW-111publ5.pdf (accessed April 21, 2011).
Weatherization and Intergovernmental Program: Energy Efficiency and Conservation Block Grant Program. n.d. http://www1.eere.energy.gov/wip/eecbg.html (accessed 2 28, 2011).
White LED Lights with 135 Lumens per Watt About Ten Time Better than Incandescent. n.d. http://nextbigfuture.com/2010/08/white-led-lights-with-135-lumens-per.html (accessed 2 11, 2011).
Why LEDs can be 10 times as efficient as incandescents in some applications but not in general home lighting! n.d. http://members.misty.com/don/lede.html (accessed 2 10, 2011).
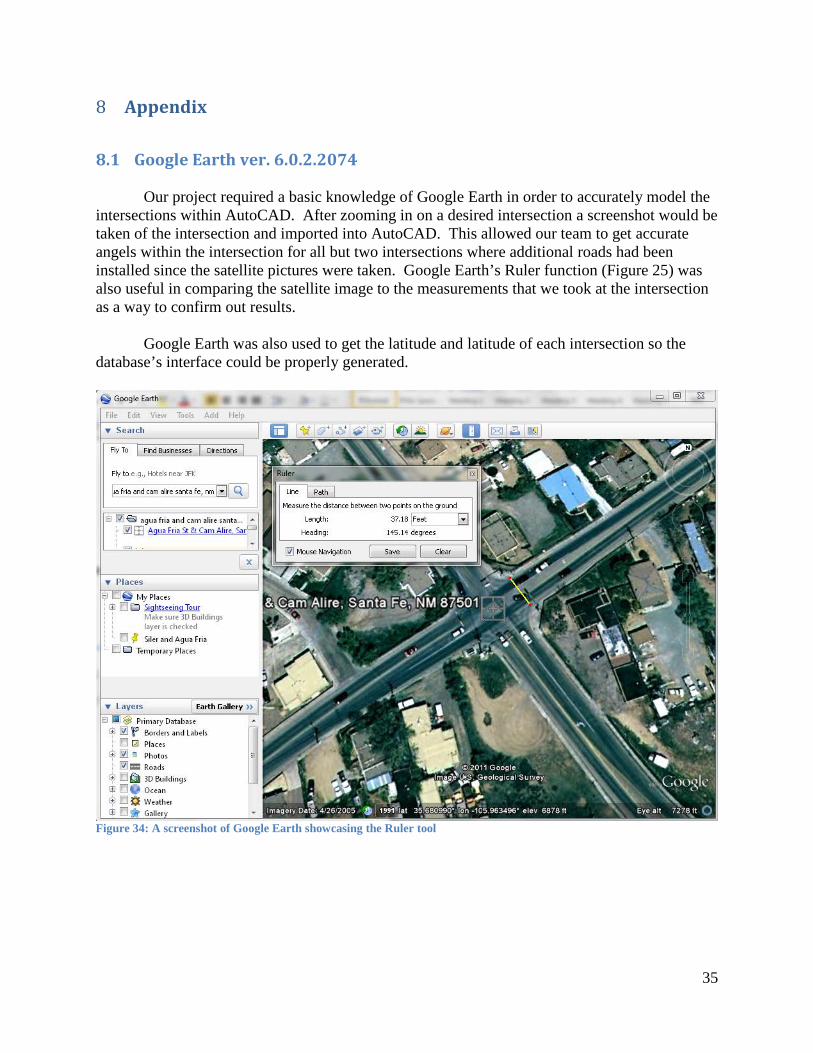
35
Appendix 8
8.1 Google Earth ver. 6.0.2.2074 Our project required a basic knowledge of Google Earth in order to accurately model the intersections within AutoCAD. After zooming in on a desired intersection a screenshot would be taken of the intersection and imported into AutoCAD. This allowed our team to get accurate angels within the intersection for all but two intersections where additional roads had been installed since the satellite pictures were taken. Google Earth’s Ruler function (Figure 25) was also useful in comparing the satellite image to the measurements that we took at the intersection as a way to confirm out results. Google Earth was also used to get the latitude and latitude of each intersection so the database’s interface could be properly generated.
Figure 34: A screenshot of Google Earth showcasing the Ruler tool
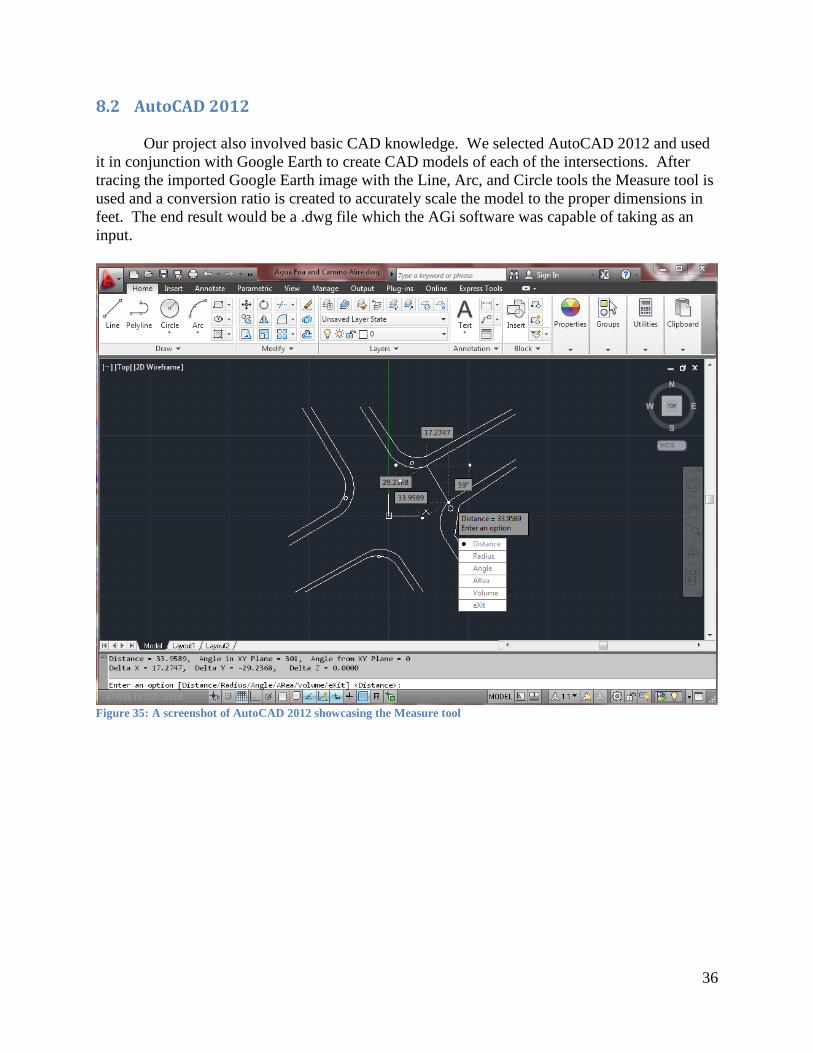
36
8.2 AutoCAD 2012 Our project also involved basic CAD knowledge. We selected AutoCAD 2012 and used it in conjunction with Google Earth to create CAD models of each of the intersections. After tracing the imported Google Earth image with the Line, Arc, and Circle tools the Measure tool is used and a conversion ratio is created to accurately scale the model to the proper dimensions in feet. The end result would be a .dwg file which the AGi software was capable of taking as an input.
Figure 35: A screenshot of AutoCAD 2012 showcasing the Measure tool
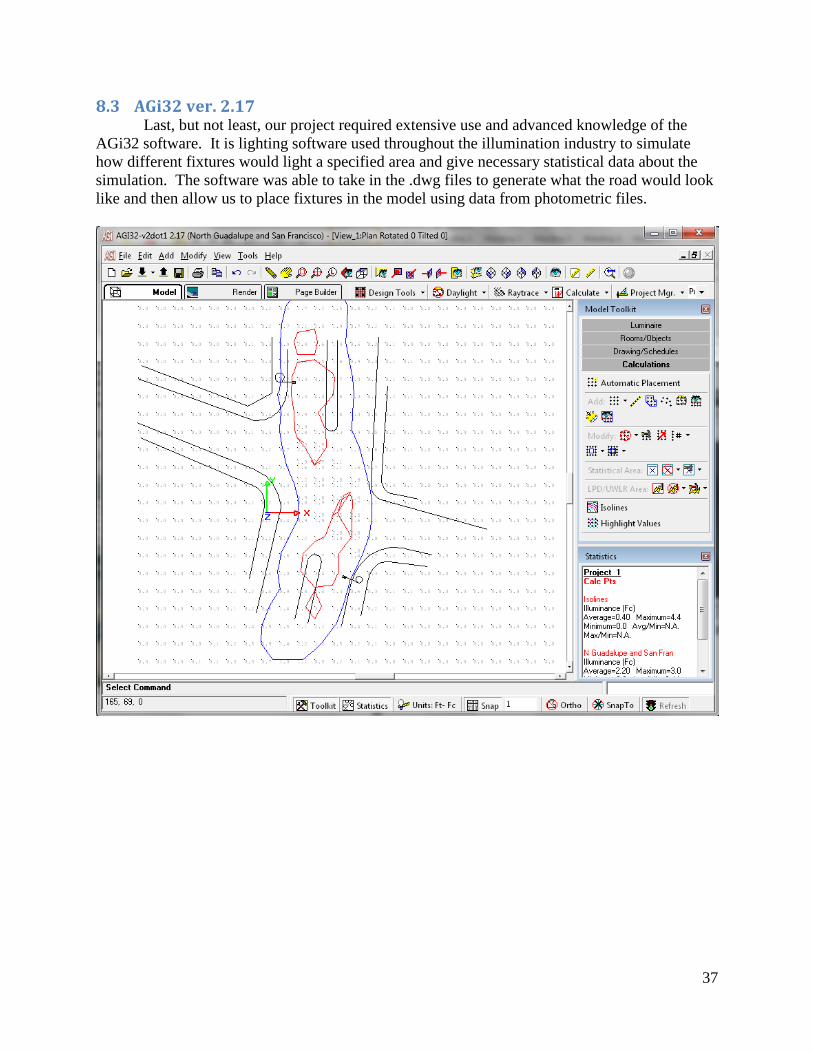
37
8.3 AGi32 ver. 2.17 Last, but not least, our project required extensive use and advanced knowledge of the AGi32 software. It is lighting software used throughout the illumination industry to simulate how different fixtures would light a specified area and give necessary statistical data about the simulation. The software was able to take in the .dwg files to generate what the road would look like and then allow us to place fixtures in the model using data from photometric files.
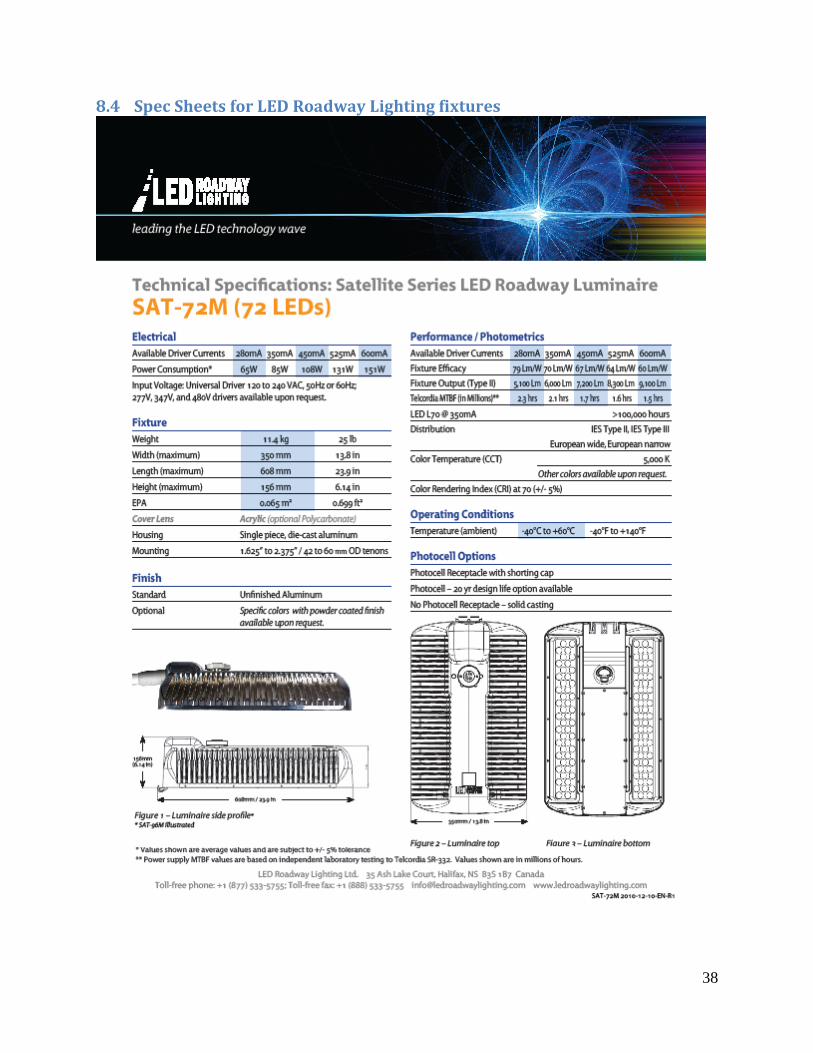
38
8.4 Spec Sheets for LED Roadway Lighting fixtures
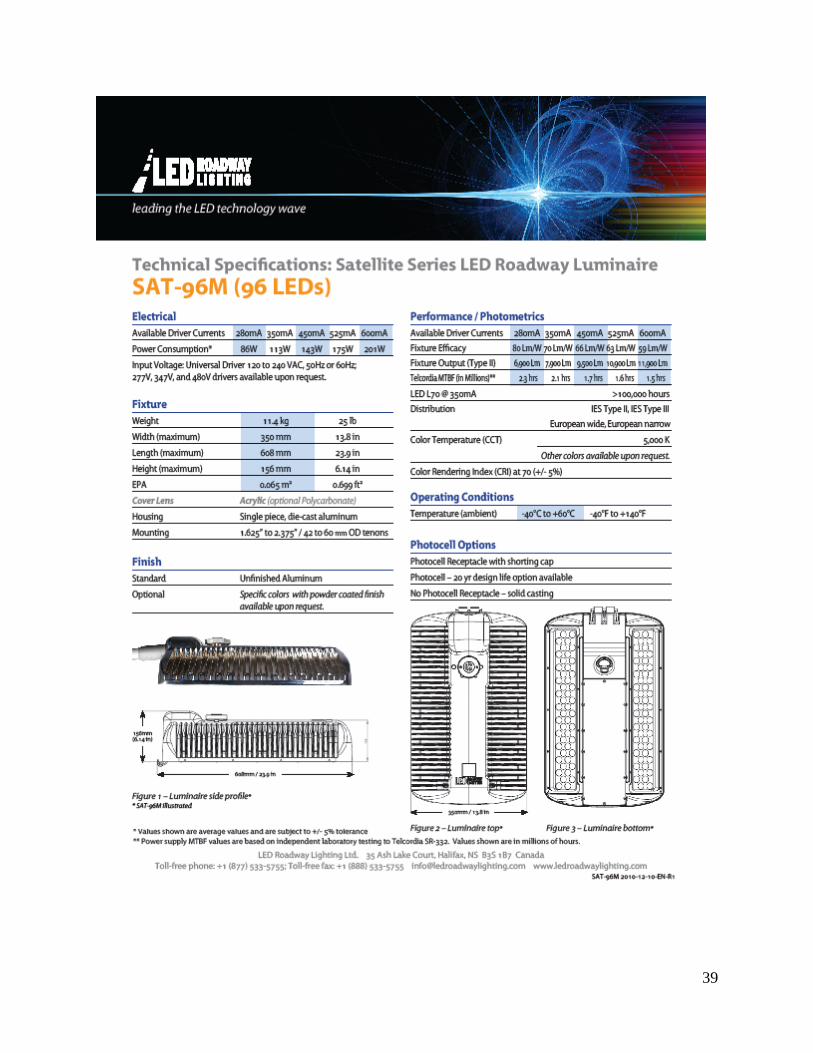
39
40
8.5 Google Maps API
The Google Maps API allowed us to link together Google Maps and Google Spreadsheet to create our database. There are a number of other applications of this powerful but we focused on the Javascript Map tool which allowed us to link the geocoded data from a spreadsheet we created and display it as a map.
8.6 Database Code The following code is used to create the interactive map interface to the database. It is coded specifically for our website and would require a different API key to be integrated with a different website. It links together the published spreadsheet that generates the map and links to the files related to the intersection and the master database. The only changes the City would have to make to the code would be to sign up for their own API key and then change the key located in the beginning of the <script/> tag in order to embed it themselves. <!DOCTYPE html PUBLIC "-//W3C//DTD XHTML 1.0 Strict//EN" "http://www.w3.org/TR/xhtml1/DTD/xhtml1-strict.dtd"><html xmlns="http://www.w3.org/1999/xhtml"><head> </head><body> <!-- ++Begin GSpreadsheets Map Wizard Generated Code++ --> <div style="width:925px; font-family:Arial, sans-serif; font-size:11px; border:1px solid black"> <table id="cm_mapTABLE"> <tbody> <tr id="cm_mapTR"> <td> <div id="cm_map" style="width:800px; height:500px"></div> </td> </tr> </tbody></table> </div> <script src="http://maps.google.com/maps?file=api&v=2&key= ABQIAAAA9iflDxZZsVDpqZTgulpsyxStT0PZ338lCUqg5rRoQIQvRtSN9RQoPGiZqx3tTpzGAQug1g6BW9PzLA" type="text/javascript"></script> <script type="text/javascript"> //<![CDATA[ var cm_map; var cm_mapMarkers = []; var cm_mapHTMLS = []; // Create a base icon for all of our markers that specifies the // shadow, icon dimensions, etc. var cm_baseIcon = new GIcon(); cm_baseIcon.shadow = "http://www.google.com/mapfiles/shadow50.png"; cm_baseIcon.iconSize = new GSize(20, 34); cm_baseIcon.shadowSize = new GSize(37, 34); cm_baseIcon.iconAnchor = new GPoint(9, 34); cm_baseIcon.infoWindowAnchor = new GPoint(9, 2); cm_baseIcon.infoShadowAnchor = new GPoint(18, 25);
41
// Change these parameters to customize map var param_wsId = "od6"; var param_ssKey = "0AmGzcwSP3tmQdDZmMUd2ckUwR3RYRmdNUGw5ZTRRRlE"; var param_useSidebar = true; var param_titleColumn = "title"; var param_descriptionColumn = "description"; var param_latColumn = "latitude"; var param_lngColumn = "longitude"; var param_rankColumn = "rank"; var param_iconType = "green"; var param_iconOverType = "orange"; /** * Loads map and calls function to load in worksheet data. */ function cm_load() { if (GBrowserIsCompatible()) { // create the map cm_map = new GMap2(document.getElementById("cm_map")); cm_map.addControl(new GLargeMapControl()); cm_map.addControl(new GMapTypeControl()); cm_map.setCenter(new GLatLng( 43.907787,-79.359741), 2); cm_getJSON(); } else { alert("Sorry, the Google Maps API is not compatible with this browser"); } } /** * Function called when marker on the map is clicked. * Opens an info window (bubble) above the marker. * @param {Number} markerNum Number of marker in global array */ function cm_markerClicked(markerNum) { cm_mapMarkers[markerNum].openInfoWindowHtml(cm_mapHTMLS[markerNum]); } /** * Function that sorts 2 worksheet rows from JSON feed * based on their rank column. Only called if column is defined. * @param {rowA} Object Represents row in JSON feed * @param {rowB} Object Represents row in JSON feed * @return {Number} Difference between row values */ function cm_sortRows(rowA, rowB) { var rowAValue = parseFloat(rowA["gsx$" + param_rankColumn].$t); var rowBValue = parseFloat(rowB["gsx$" + param_rankColumn].$t); return rowAValue - rowBValue; } /** * Called when JSON is loaded. Creates sidebar if param_sideBar is true. * Sorts rows if param_rankColumn is valid column. Iterates through worksheet rows, * creating marker and sidebar entries for each row. * @param {JSON} json Worksheet feed
42
*/ function cm_loadMapJSON(json) { var usingRank = false; if(param_useSidebar == true) { var sidebarTD = document.createElement("td"); sidebarTD.setAttribute("width","150"); sidebarTD.setAttribute("valign","top"); var sidebarDIV = document.createElement("div"); sidebarDIV.id = "cm_sidebarDIV"; sidebarDIV.style.overflow = "auto"; sidebarDIV.style.height = "500px"; sidebarDIV.style.fontSize = "11px"; sidebarDIV.style.color = "#000000"; sidebarTD.appendChild(sidebarDIV); document.getElementById("cm_mapTR").appendChild(sidebarTD); } var bounds = new GLatLngBounds(); if(json.feed.entry[0]["gsx$" + param_rankColumn]) { usingRank = true; json.feed.entry.sort(cm_sortRows); } for (var i = 0; i < json.feed.entry.length; i++) { var entry = json.feed.entry[i]; if(entry["gsx$" + param_latColumn]) { var lat = parseFloat(entry["gsx$" + param_latColumn].$t); var lng = parseFloat(entry["gsx$" + param_lngColumn].$t); var point = new GLatLng(lat,lng); var html = "<div style='font-size:12px'>"; html += "<strong>" + entry["gsx$"+param_titleColumn].$t + "</strong>"; var label = entry["gsx$"+param_titleColumn].$t; var rank = 0; if(usingRank && entry["gsx$" + param_rankColumn]) { rank = parseInt(entry["gsx$"+param_rankColumn].$t); } if(entry["gsx$" + param_descriptionColumn]) { html += "<br/>" + entry["gsx$"+param_descriptionColumn].$t; } html += "</div>"; // create the marker var marker = cm_createMarker(point,label,html,rank); cm_map.addOverlay(marker); cm_mapMarkers.push(marker); cm_mapHTMLS.push(html); bounds.extend(point); if(param_useSidebar == true) { var markerA = document.createElement("a"); markerA.setAttribute("href","javascript:cm_markerClicked('" + i +"')"); markerA.style.color = "#000000"; var sidebarText= "";
43
if(usingRank) { sidebarText += rank + ") "; } sidebarText += label; markerA.appendChild(document.createTextNode(sidebarText)); sidebarDIV.appendChild(markerA); sidebarDIV.appendChild(document.createElement("br")); sidebarDIV.appendChild(document.createElement("br")); } } } cm_map.setZoom(cm_map.getBoundsZoomLevel(bounds)); cm_map.setCenter(bounds.getCenter()); } /** * Creates marker with ranked Icon or blank icon, * depending if rank is defined. Assigns onclick function. * @param {GLatLng} point Point to create marker at * @param {String} title Tooltip title to display for marker * @param {String} html HTML to display in InfoWindow * @param {Number} rank Number rank of marker, used in creating icon * @return {GMarker} Marker created */ function cm_createMarker(point, title, html, rank) { var markerOpts = {}; var nIcon = new GIcon(cm_baseIcon); if(rank > 0 && rank < 100) { nIcon.imageOut = "http://gmaps-samples.googlecode.com/svn/trunk/" + "markers/" + param_iconType + "/marker" + rank + ".png"; nIcon.imageOver = "http://gmaps-samples.googlecode.com/svn/trunk/" + "markers/" + param_iconOverType + "/marker" + rank + ".png"; nIcon.image = nIcon.imageOut; } else { nIcon.imageOut = "http://gmaps-samples.googlecode.com/svn/trunk/" + "markers/" + param_iconType + "/blank.png"; nIcon.imageOver = "http://gmaps-samples.googlecode.com/svn/trunk/" + "markers/" + param_iconOverType + "/blank.png"; nIcon.image = nIcon.imageOut; } markerOpts.icon = nIcon; markerOpts.title = title; var marker = new GMarker(point, markerOpts); GEvent.addListener(marker, "click", function() { marker.openInfoWindowHtml(html); }); GEvent.addListener(marker, "mouseover", function() { marker.setImage(marker.getIcon().imageOver); }); GEvent.addListener(marker, "mouseout", function() { marker.setImage(marker.getIcon().imageOut); }); GEvent.addListener(marker, "infowindowopen", function() {
44
marker.setImage(marker.getIcon().imageOver); }); GEvent.addListener(marker, "infowindowclose", function() { marker.setImage(marker.getIcon().imageOut); }); return marker; } /** * Creates a script tag in the page that loads in the * JSON feed for the specified key/ID. * Once loaded, it calls cm_loadMapJSON. */ function cm_getJSON() { // Retrieve the JSON feed. var script = document.createElement('script'); script.setAttribute('src', 'http://spreadsheets.google.com/feeds/list' + '/' + param_ssKey + '/' + param_wsId + '/public/values' + '?alt=json-in-script&callback=cm_loadMapJSON'); script.setAttribute('id', 'jsonScript'); script.setAttribute('type', 'text/javascript'); document.documentElement.firstChild.appendChild(script); } setTimeout('cm_load()', 500); //]]> </script> </body> </html>
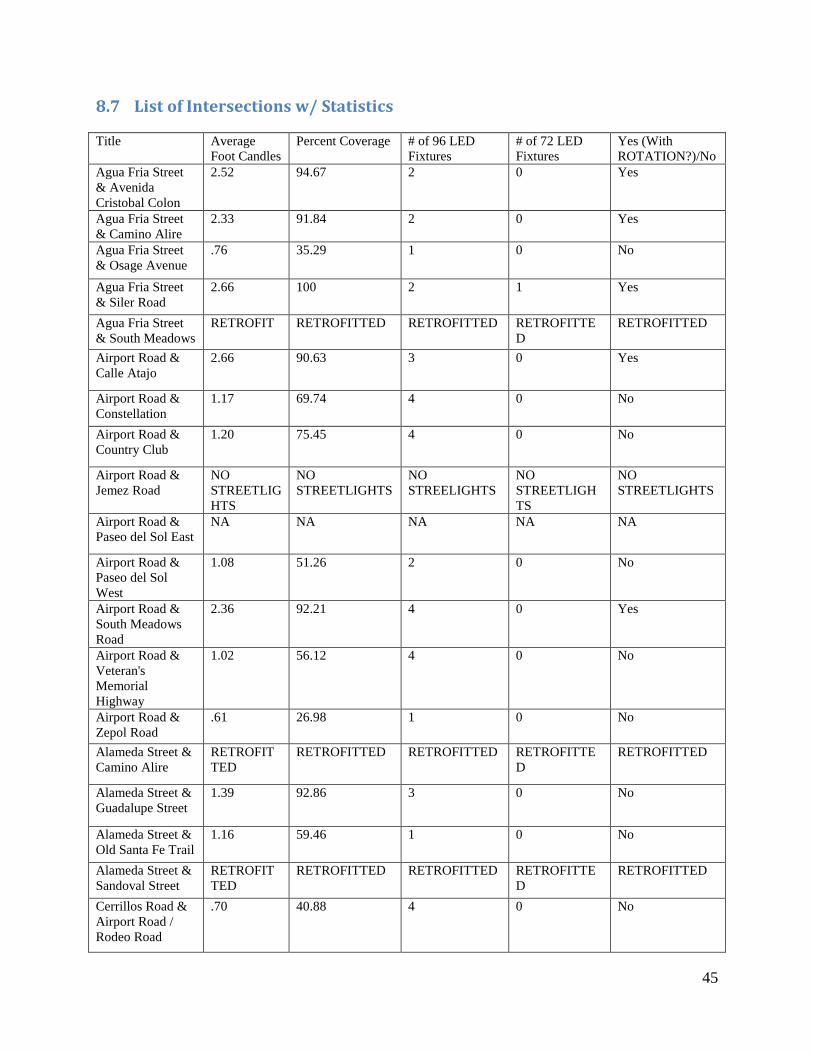
45
8.7 List of Intersections w/ Statistics
Title Average Foot Candles
Percent Coverage # of 96 LED Fixtures
# of 72 LED Fixtures
Yes (With ROTATION?)/No
Agua Fria Street & Avenida Cristobal Colon
2.52 94.67 2 0 Yes
Agua Fria Street & Camino Alire
2.33 91.84 2 0 Yes
Agua Fria Street & Osage Avenue
.76 35.29 1 0 No
Agua Fria Street & Siler Road
2.66 100 2 1 Yes
Agua Fria Street & South Meadows
RETROFIT RETROFITTED RETROFITTED RETROFITTED
RETROFITTED
Airport Road & Calle Atajo
2.66 90.63 3 0 Yes
Airport Road & Constellation
1.17 69.74 4 0 No
Airport Road & Country Club
1.20 75.45 4 0 No
Airport Road & Jemez Road
NO STREETLIGHTS
NO STREETLIGHTS
NO STREELIGHTS
NO STREETLIGHTS
NO STREETLIGHTS
Airport Road & Paseo del Sol East
NA NA NA NA NA
Airport Road & Paseo del Sol West
1.08 51.26 2 0 No
Airport Road & South Meadows Road
2.36 92.21 4 0 Yes
Airport Road & Veteran's Memorial Highway
1.02 56.12 4 0 No
Airport Road & Zepol Road
.61 26.98 1 0 No
Alameda Street & Camino Alire
RETROFITTED
RETROFITTED RETROFITTED RETROFITTED
RETROFITTED
Alameda Street & Guadalupe Street
1.39 92.86 3 0 No
Alameda Street & Old Santa Fe Trail
1.16 59.46 1 0 No
Alameda Street & Sandoval Street
RETROFITTED
RETROFITTED RETROFITTED RETROFITTED
RETROFITTED
Cerrillos Road & Airport Road / Rodeo Road
.70 40.88 4 0 No
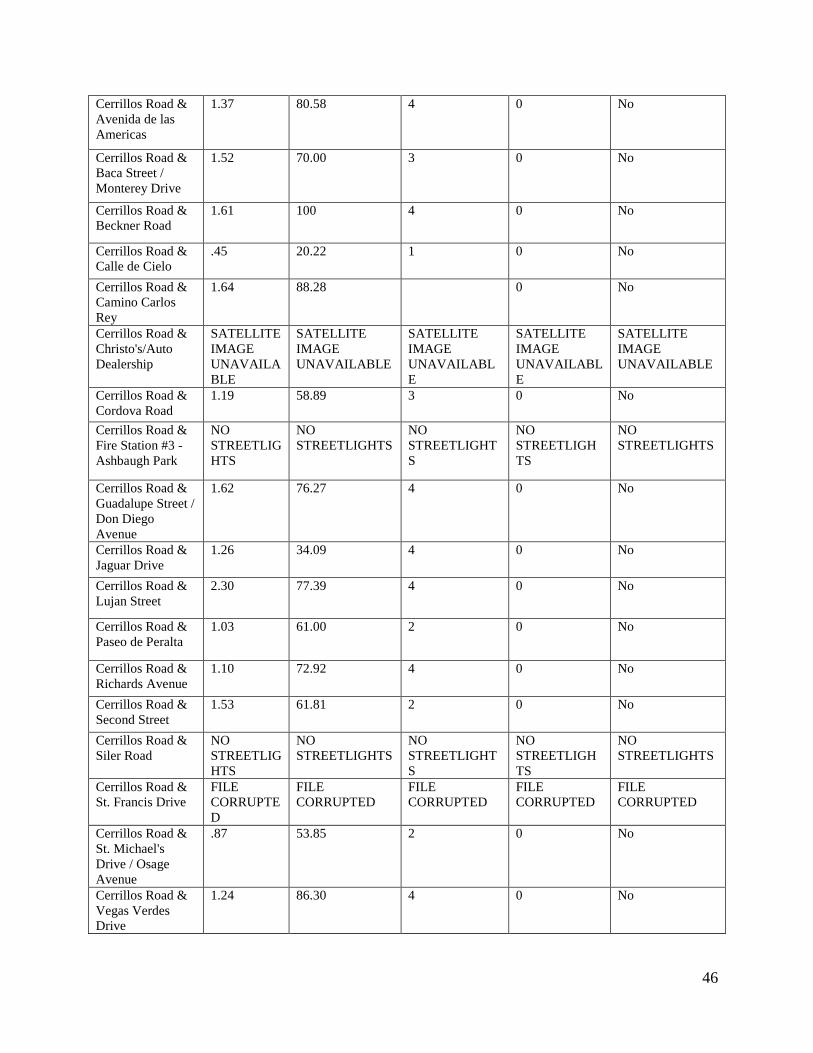
46
Cerrillos Road & Avenida de las Americas
1.37 80.58 4 0 No
Cerrillos Road & Baca Street / Monterey Drive
1.52 70.00 3 0 No
Cerrillos Road & Beckner Road
1.61 100 4 0 No
Cerrillos Road & Calle de Cielo
.45 20.22 1 0 No
Cerrillos Road & Camino Carlos Rey
1.64 88.28 0 No
Cerrillos Road & Christo's/Auto Dealership
SATELLITE IMAGE UNAVAILABLE
SATELLITE IMAGE UNAVAILABLE
SATELLITE IMAGE UNAVAILABLE
SATELLITE IMAGE UNAVAILABLE
SATELLITE IMAGE UNAVAILABLE
Cerrillos Road & Cordova Road
1.19 58.89 3 0 No
Cerrillos Road & Fire Station #3 - Ashbaugh Park
NO STREETLIGHTS
NO STREETLIGHTS
NO STREETLIGHTS
NO STREETLIGHTS
NO STREETLIGHTS
Cerrillos Road & Guadalupe Street / Don Diego Avenue
1.62 76.27 4 0 No
Cerrillos Road & Jaguar Drive
1.26 34.09 4 0 No
Cerrillos Road & Lujan Street
2.30 77.39 4 0 No
Cerrillos Road & Paseo de Peralta
1.03 61.00 2 0 No
Cerrillos Road & Richards Avenue
1.10 72.92 4 0 No
Cerrillos Road & Second Street
1.53 61.81 2 0 No
Cerrillos Road & Siler Road
NO STREETLIGHTS
NO STREETLIGHTS
NO STREETLIGHTS
NO STREETLIGHTS
NO STREETLIGHTS
Cerrillos Road & St. Francis Drive
FILE CORRUPTED
FILE CORRUPTED
FILE CORRUPTED
FILE CORRUPTED
FILE CORRUPTED
Cerrillos Road & St. Michael's Drive / Osage Avenue
.87 53.85 2 0 No
Cerrillos Road & Vegas Verdes Drive
1.24 86.30 4 0 No
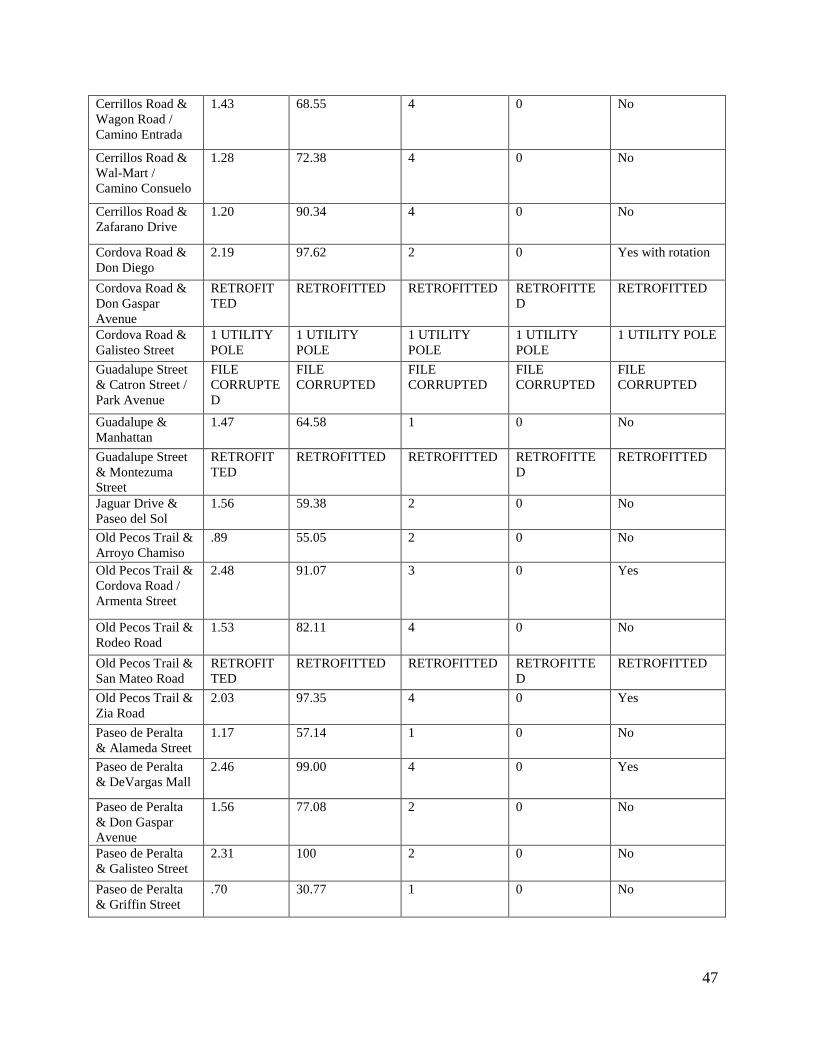
47
Cerrillos Road & Wagon Road / Camino Entrada
1.43 68.55 4 0 No
Cerrillos Road & Wal-Mart / Camino Consuelo
1.28 72.38 4 0 No
Cerrillos Road & Zafarano Drive
1.20 90.34 4 0 No
Cordova Road & Don Diego
2.19 97.62 2 0 Yes with rotation
Cordova Road & Don Gaspar Avenue
RETROFITTED
RETROFITTED RETROFITTED RETROFITTED
RETROFITTED
Cordova Road & Galisteo Street
1 UTILITY POLE
1 UTILITY POLE
1 UTILITY POLE
1 UTILITY POLE
1 UTILITY POLE
Guadalupe Street & Catron Street / Park Avenue
FILE CORRUPTED
FILE CORRUPTED
FILE CORRUPTED
FILE CORRUPTED
FILE CORRUPTED
Guadalupe & Manhattan
1.47 64.58 1 0 No
Guadalupe Street & Montezuma Street
RETROFITTED
RETROFITTED RETROFITTED RETROFITTED
RETROFITTED
Jaguar Drive & Paseo del Sol
1.56 59.38 2 0 No
Old Pecos Trail & Arroyo Chamiso
.89 55.05 2 0 No
Old Pecos Trail & Cordova Road / Armenta Street
2.48 91.07 3 0 Yes
Old Pecos Trail & Rodeo Road
1.53 82.11 4 0 No
Old Pecos Trail & San Mateo Road
RETROFITTED
RETROFITTED RETROFITTED RETROFITTED
RETROFITTED
Old Pecos Trail & Zia Road
2.03 97.35 4 0 Yes
Paseo de Peralta & Alameda Street
1.17 57.14 1 0 No
Paseo de Peralta & DeVargas Mall
2.46 99.00 4 0 Yes
Paseo de Peralta & Don Gaspar Avenue
1.56 77.08 2 0 No
Paseo de Peralta & Galisteo Street
2.31 100 2 0 No
Paseo de Peralta & Griffin Street
.70 30.77 1 0 No
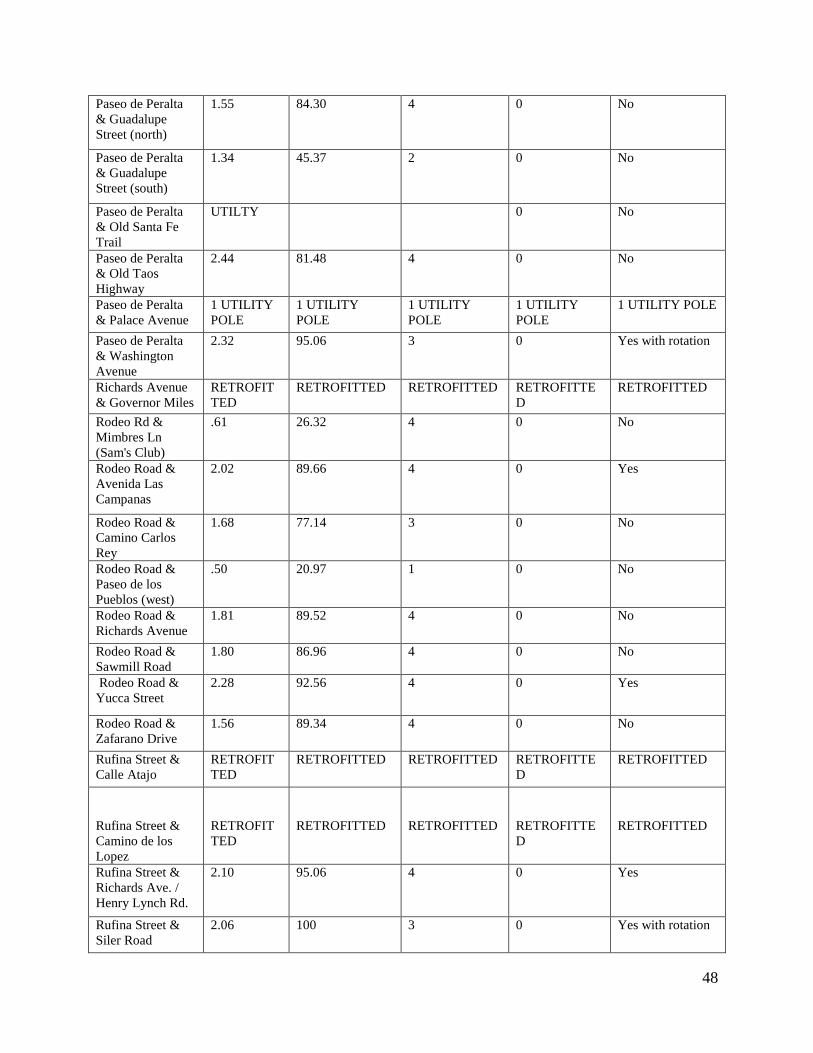
48
Paseo de Peralta & Guadalupe Street (north)
1.55 84.30 4 0 No
Paseo de Peralta & Guadalupe Street (south)
1.34 45.37 2 0 No
Paseo de Peralta & Old Santa Fe Trail
UTILTY 0 No
Paseo de Peralta & Old Taos Highway
2.44 81.48 4 0 No
Paseo de Peralta & Palace Avenue
1 UTILITY POLE
1 UTILITY POLE
1 UTILITY POLE
1 UTILITY POLE
1 UTILITY POLE
Paseo de Peralta & Washington Avenue
2.32 95.06 3 0 Yes with rotation
Richards Avenue & Governor Miles
RETROFITTED
RETROFITTED RETROFITTED RETROFITTED
RETROFITTED
Rodeo Rd & Mimbres Ln (Sam's Club)
.61 26.32 4 0 No
Rodeo Road & Avenida Las Campanas
2.02 89.66 4 0 Yes
Rodeo Road & Camino Carlos Rey
1.68 77.14 3 0 No
Rodeo Road & Paseo de los Pueblos (west)
.50 20.97 1 0 No
Rodeo Road & Richards Avenue
1.81 89.52 4 0 No
Rodeo Road & Sawmill Road
1.80 86.96 4 0 No
Rodeo Road & Yucca Street
2.28 92.56 4 0 Yes
Rodeo Road & Zafarano Drive
1.56 89.34 4 0 No
Rufina Street & Calle Atajo
RETROFITTED
RETROFITTED RETROFITTED RETROFITTED
RETROFITTED
Rufina Street & Camino de los Lopez
RETROFITTED
RETROFITTED
RETROFITTED
RETROFITTED
RETROFITTED
Rufina Street & Richards Ave. / Henry Lynch Rd.
2.10 95.06 4 0 Yes
Rufina Street & Siler Road
2.06 100 3 0 Yes with rotation
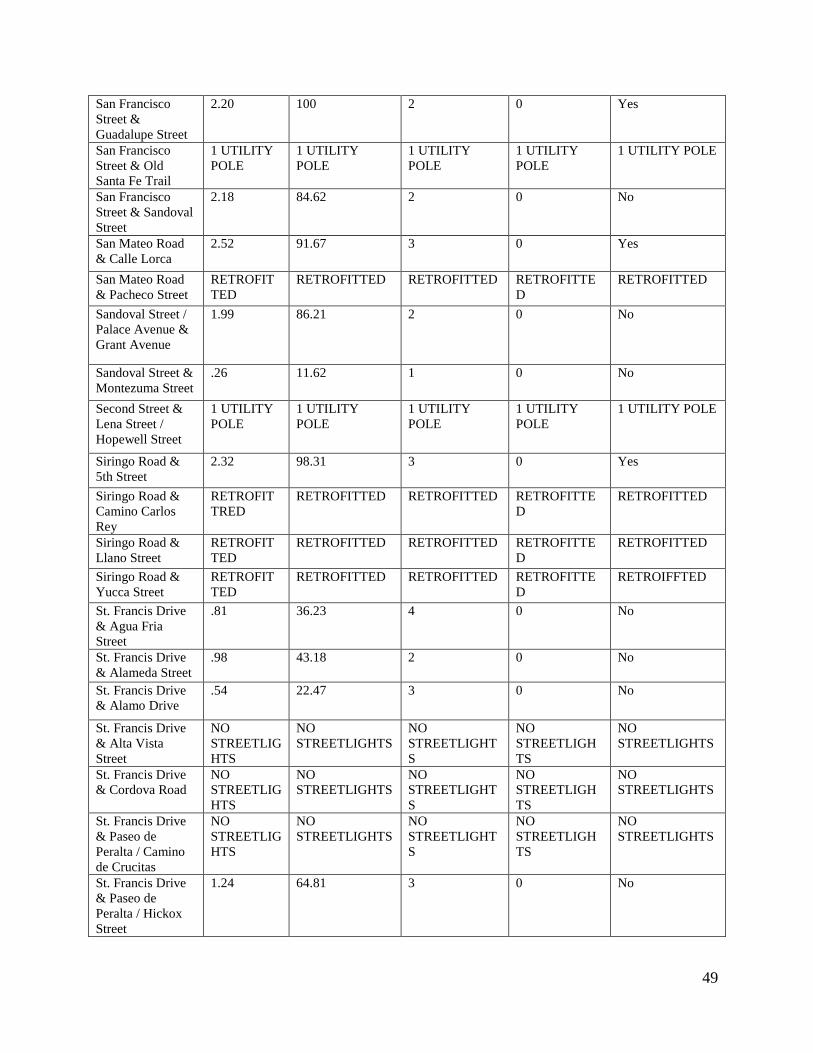
49
San Francisco Street & Guadalupe Street
2.20 100 2 0 Yes
San Francisco Street & Old Santa Fe Trail
1 UTILITY POLE
1 UTILITY POLE
1 UTILITY POLE
1 UTILITY POLE
1 UTILITY POLE
San Francisco Street & Sandoval Street
2.18 84.62 2 0 No
San Mateo Road & Calle Lorca
2.52 91.67 3 0 Yes
San Mateo Road & Pacheco Street
RETROFITTED
RETROFITTED RETROFITTED RETROFITTED
RETROFITTED
Sandoval Street / Palace Avenue & Grant Avenue
1.99 86.21 2 0 No
Sandoval Street & Montezuma Street
.26 11.62 1 0 No
Second Street & Lena Street / Hopewell Street
1 UTILITY POLE
1 UTILITY POLE
1 UTILITY POLE
1 UTILITY POLE
1 UTILITY POLE
Siringo Road & 5th Street
2.32 98.31 3 0 Yes
Siringo Road & Camino Carlos Rey
RETROFITTRED
RETROFITTED RETROFITTED RETROFITTED
RETROFITTED
Siringo Road & Llano Street
RETROFITTED
RETROFITTED RETROFITTED RETROFITTED
RETROFITTED
Siringo Road & Yucca Street
RETROFITTED
RETROFITTED RETROFITTED RETROFITTED
RETROIFFTED
St. Francis Drive & Agua Fria Street
.81 36.23 4 0 No
St. Francis Drive & Alameda Street
.98 43.18 2 0 No
St. Francis Drive & Alamo Drive
.54 22.47 3 0 No
St. Francis Drive & Alta Vista Street
NO STREETLIGHTS
NO STREETLIGHTS
NO STREETLIGHTS
NO STREETLIGHTS
NO STREETLIGHTS
St. Francis Drive & Cordova Road
NO STREETLIGHTS
NO STREETLIGHTS
NO STREETLIGHTS
NO STREETLIGHTS
NO STREETLIGHTS
St. Francis Drive & Paseo de Peralta / Camino de Crucitas
NO STREETLIGHTS
NO STREETLIGHTS
NO STREETLIGHTS
NO STREETLIGHTS
NO STREETLIGHTS
St. Francis Drive & Paseo de Peralta / Hickox Street
1.24 64.81 3 0 No
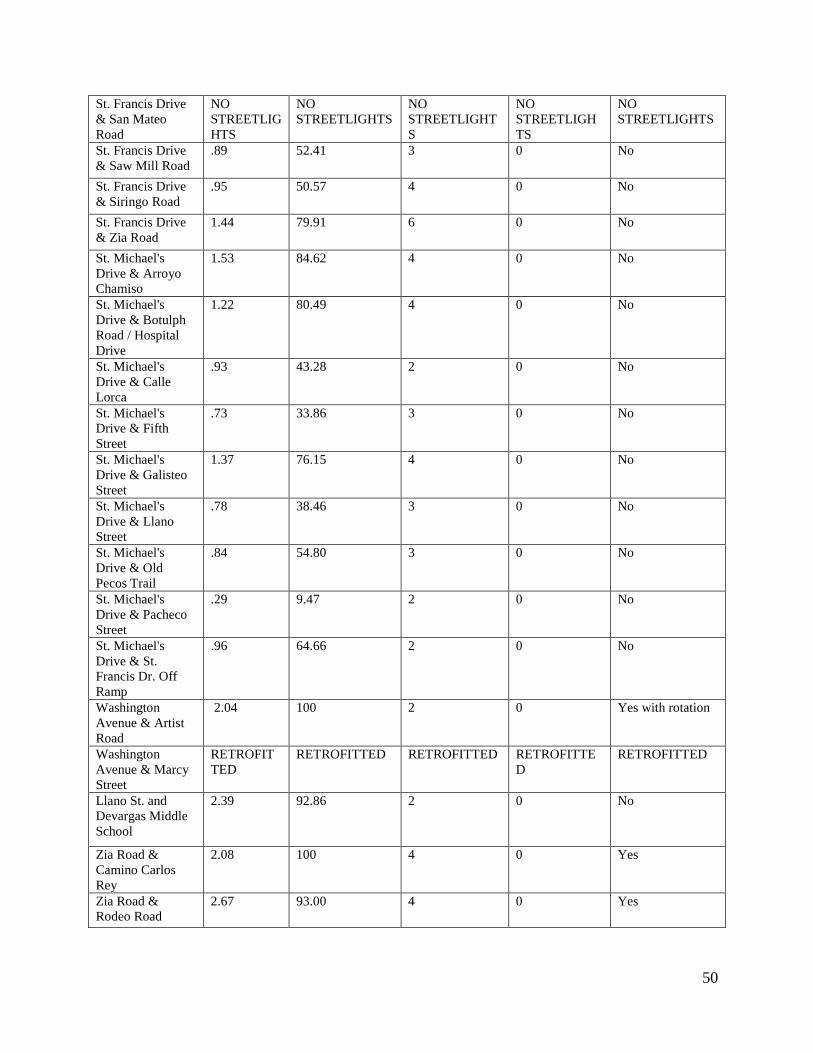
50
St. Francis Drive & San Mateo Road
NO STREETLIGHTS
NO STREETLIGHTS
NO STREETLIGHTS
NO STREETLIGHTS
NO STREETLIGHTS
St. Francis Drive & Saw Mill Road
.89 52.41 3 0 No
St. Francis Drive & Siringo Road
.95 50.57 4 0 No
St. Francis Drive & Zia Road
1.44 79.91 6 0 No
St. Michael's Drive & Arroyo Chamiso
1.53 84.62 4 0 No
St. Michael's Drive & Botulph Road / Hospital Drive
1.22 80.49 4 0 No
St. Michael's Drive & Calle Lorca
.93 43.28 2 0 No
St. Michael's Drive & Fifth Street
.73 33.86 3 0 No
St. Michael's Drive & Galisteo Street
1.37 76.15 4 0 No
St. Michael's Drive & Llano Street
.78 38.46 3 0 No
St. Michael's Drive & Old Pecos Trail
.84 54.80 3 0 No
St. Michael's Drive & Pacheco Street
.29 9.47 2 0 No
St. Michael's Drive & St. Francis Dr. Off Ramp
.96 64.66 2 0 No
Washington Avenue & Artist Road
2.04 100 2 0 Yes with rotation
Washington Avenue & Marcy Street
RETROFITTED
RETROFITTED RETROFITTED RETROFITTED
RETROFITTED
Llano St. and Devargas Middle School
2.39 92.86 2 0 No
Zia Road & Camino Carlos Rey
2.08 100 4 0 Yes
Zia Road & Rodeo Road
2.67 93.00 4 0 Yes

51
Zia Road & San Miguel Plaza
.79 45.67 2 0 No
Zia Road & Yucca Street
1.97 87.04 4 0 No
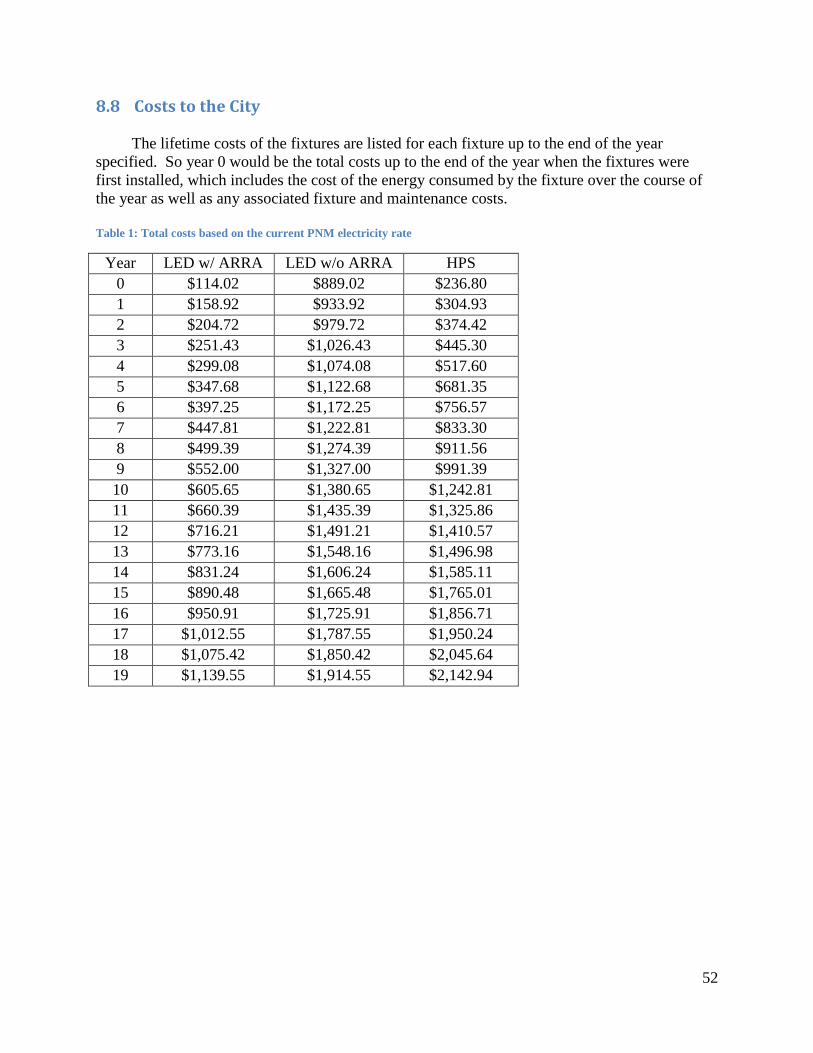
52
8.8 Costs to the City
The lifetime costs of the fixtures are listed for each fixture up to the end of the year specified. So year 0 would be the total costs up to the end of the year when the fixtures were first installed, which includes the cost of the energy consumed by the fixture over the course of the year as well as any associated fixture and maintenance costs.
Table 1: Total costs based on the current PNM electricity rate
Year LED w/ ARRA LED w/o ARRA HPS 0 $114.02 $889.02 $236.80 1 $158.92 $933.92 $304.93 2 $204.72 $979.72 $374.42 3 $251.43 $1,026.43 $445.30 4 $299.08 $1,074.08 $517.60 5 $347.68 $1,122.68 $681.35 6 $397.25 $1,172.25 $756.57 7 $447.81 $1,222.81 $833.30 8 $499.39 $1,274.39 $911.56 9 $552.00 $1,327.00 $991.39 10 $605.65 $1,380.65 $1,242.81 11 $660.39 $1,435.39 $1,325.86 12 $716.21 $1,491.21 $1,410.57 13 $773.16 $1,548.16 $1,496.98 14 $831.24 $1,606.24 $1,585.11 15 $890.48 $1,665.48 $1,765.01 16 $950.91 $1,725.91 $1,856.71 17 $1,012.55 $1,787.55 $1,950.24 18 $1,075.42 $1,850.42 $2,045.64 19 $1,139.55 $1,914.55 $2,142.94
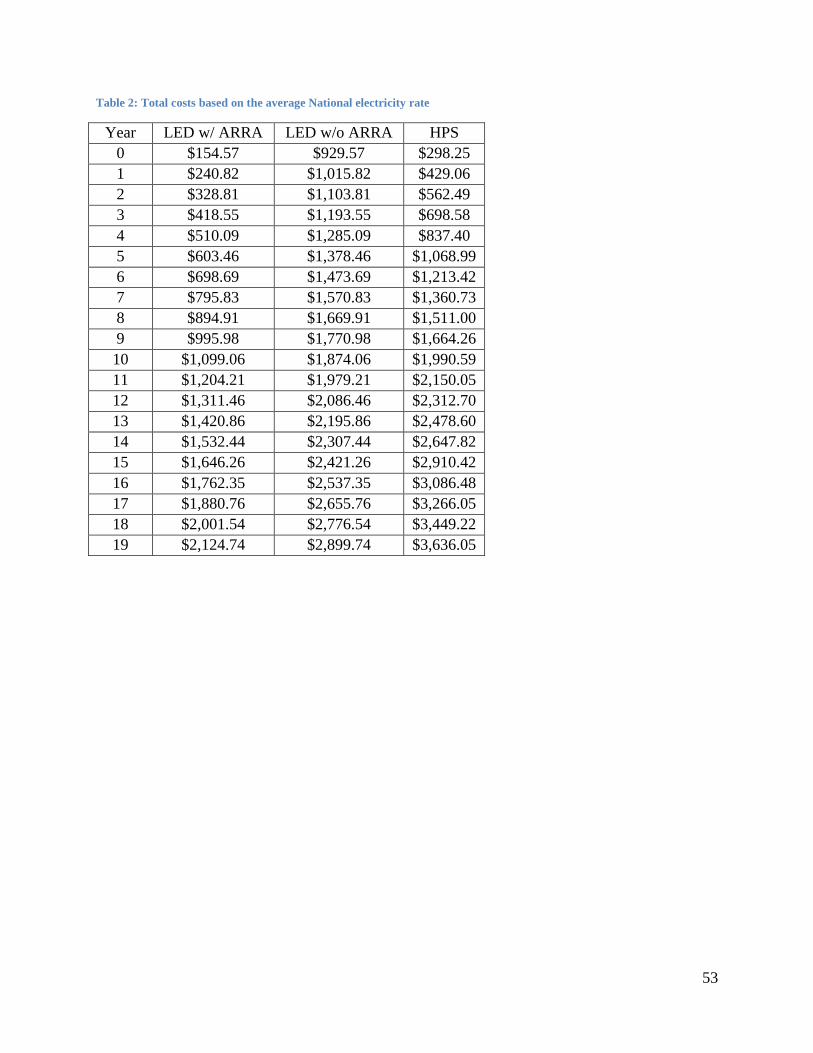
53
Table 2: Total costs based on the average National electricity rate
Year LED w/ ARRA LED w/o ARRA HPS 0 $154.57 $929.57 $298.25 1 $240.82 $1,015.82 $429.06 2 $328.81 $1,103.81 $562.49 3 $418.55 $1,193.55 $698.58 4 $510.09 $1,285.09 $837.40 5 $603.46 $1,378.46 $1,068.99 6 $698.69 $1,473.69 $1,213.42 7 $795.83 $1,570.83 $1,360.73 8 $894.91 $1,669.91 $1,511.00 9 $995.98 $1,770.98 $1,664.26 10 $1,099.06 $1,874.06 $1,990.59 11 $1,204.21 $1,979.21 $2,150.05 12 $1,311.46 $2,086.46 $2,312.70 13 $1,420.86 $2,195.86 $2,478.60 14 $1,532.44 $2,307.44 $2,647.82 15 $1,646.26 $2,421.26 $2,910.42 16 $1,762.35 $2,537.35 $3,086.48 17 $1,880.76 $2,655.76 $3,266.05 18 $2,001.54 $2,776.54 $3,449.22 19 $2,124.74 $2,899.74 $3,636.05
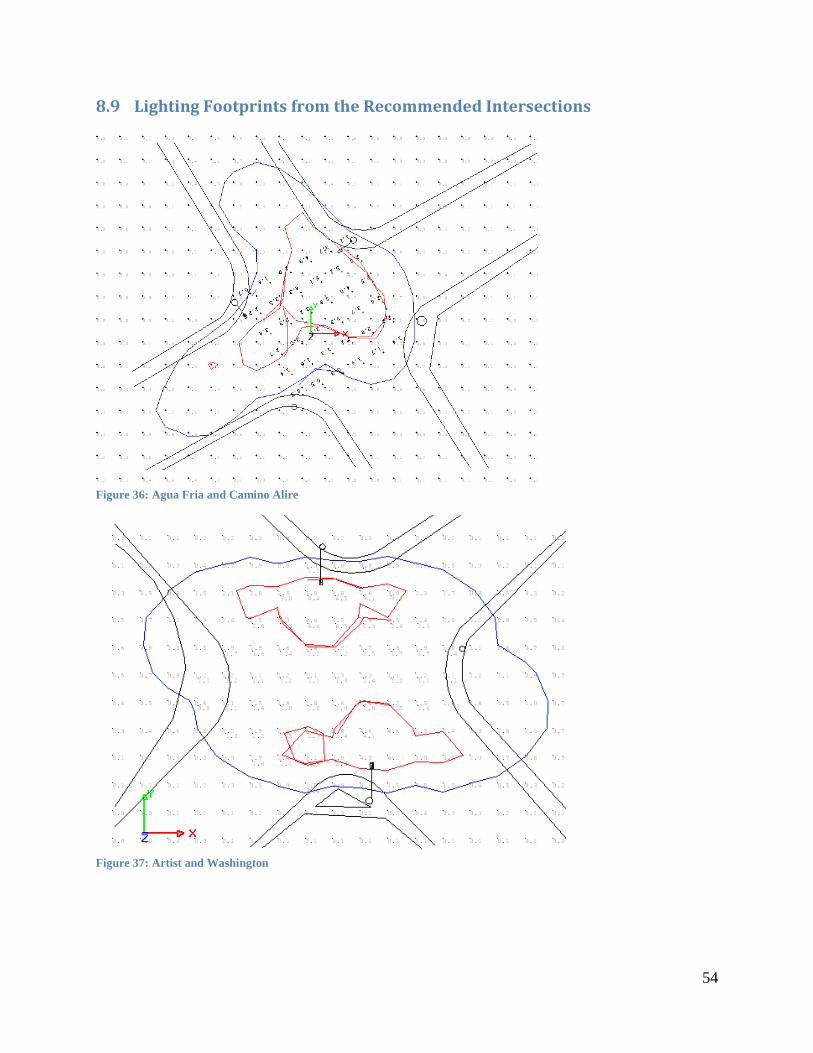
54
8.9 Lighting Footprints from the Recommended Intersections
Figure 36: Agua Fria and Camino Alire
Figure 37: Artist and Washington
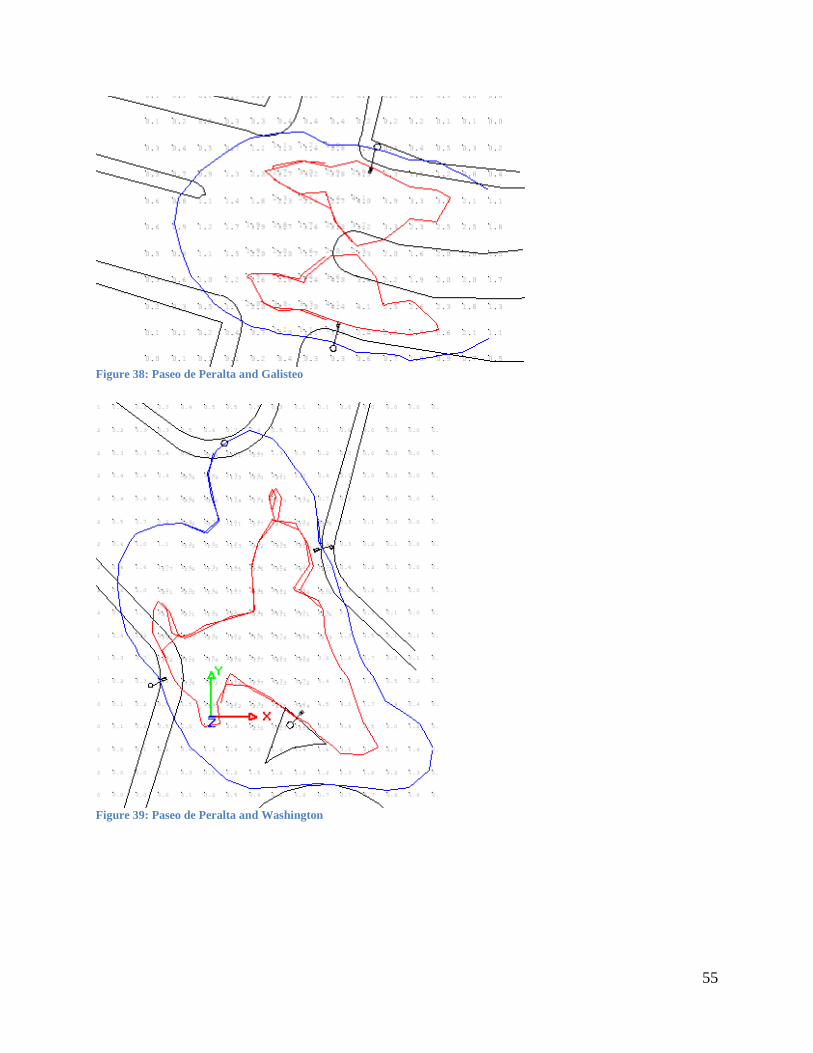
55
Figure 38: Paseo de Peralta and Galisteo
Figure 39: Paseo de Peralta and Washington
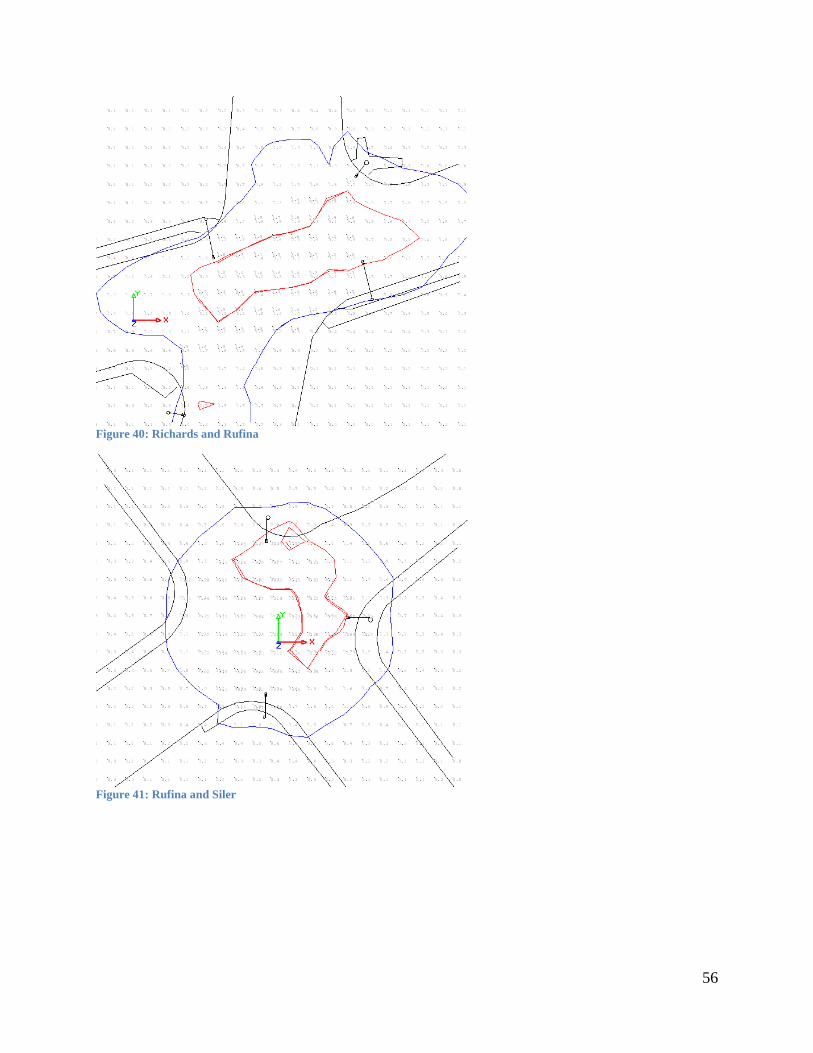
56
Figure 40: Richards and Rufina
Figure 41: Rufina and Siler
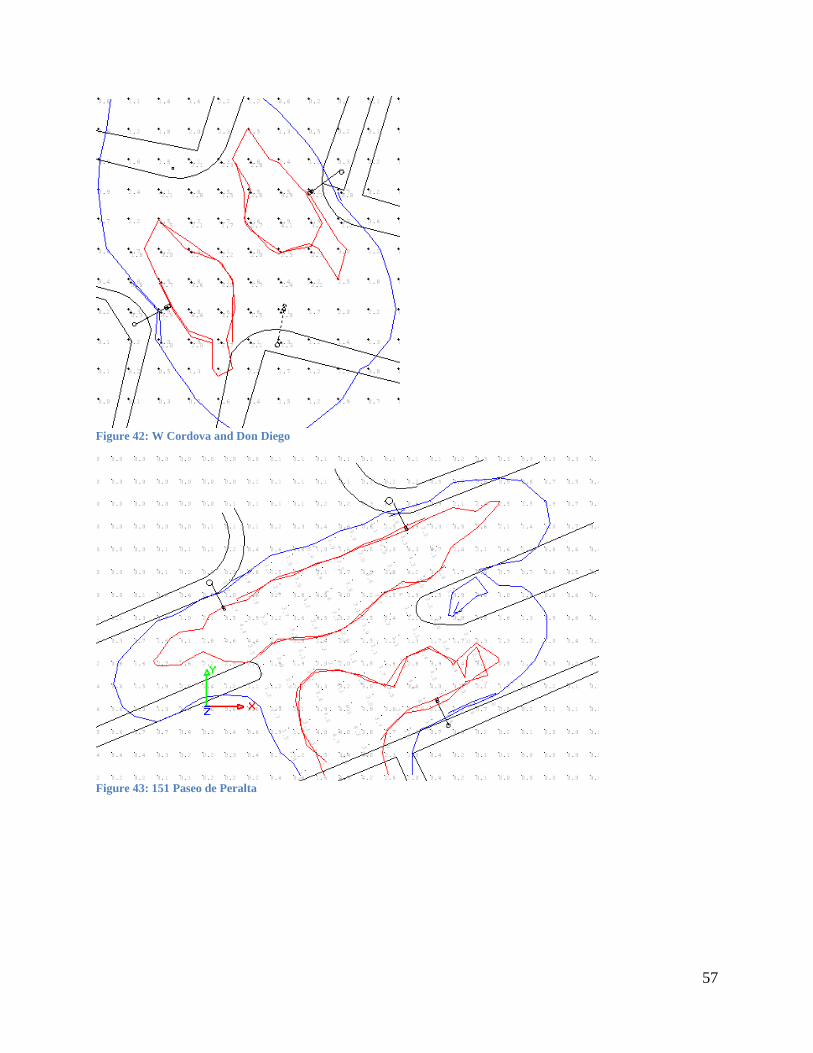
57
Figure 42: W Cordova and Don Diego
Figure 43: 151 Paseo de Peralta
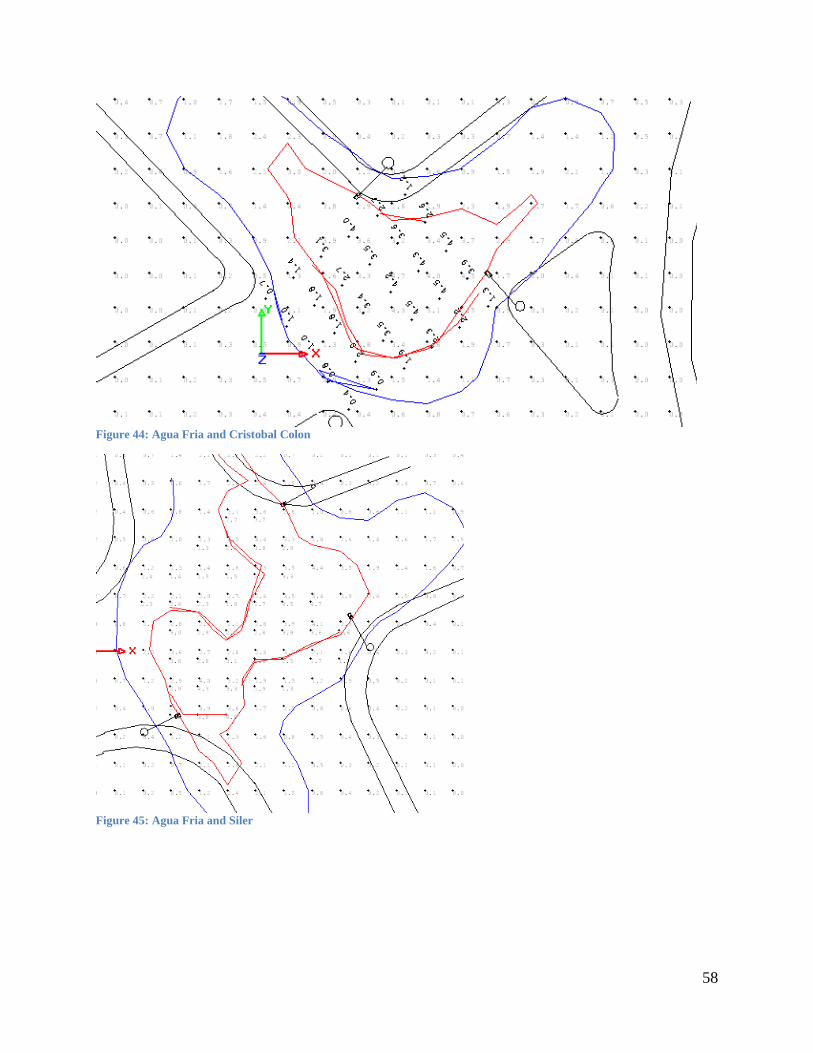
58
Figure 44: Agua Fria and Cristobal Colon
Figure 45: Agua Fria and Siler
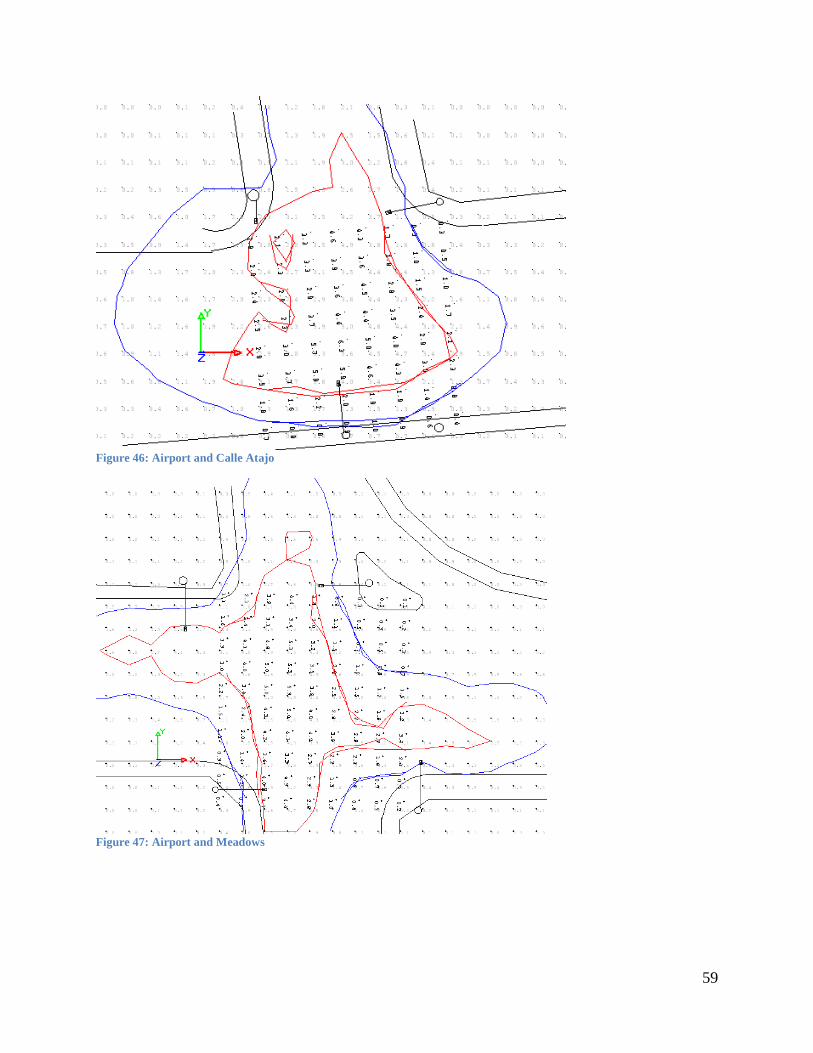
59
Figure 46: Airport and Calle Atajo
Figure 47: Airport and Meadows
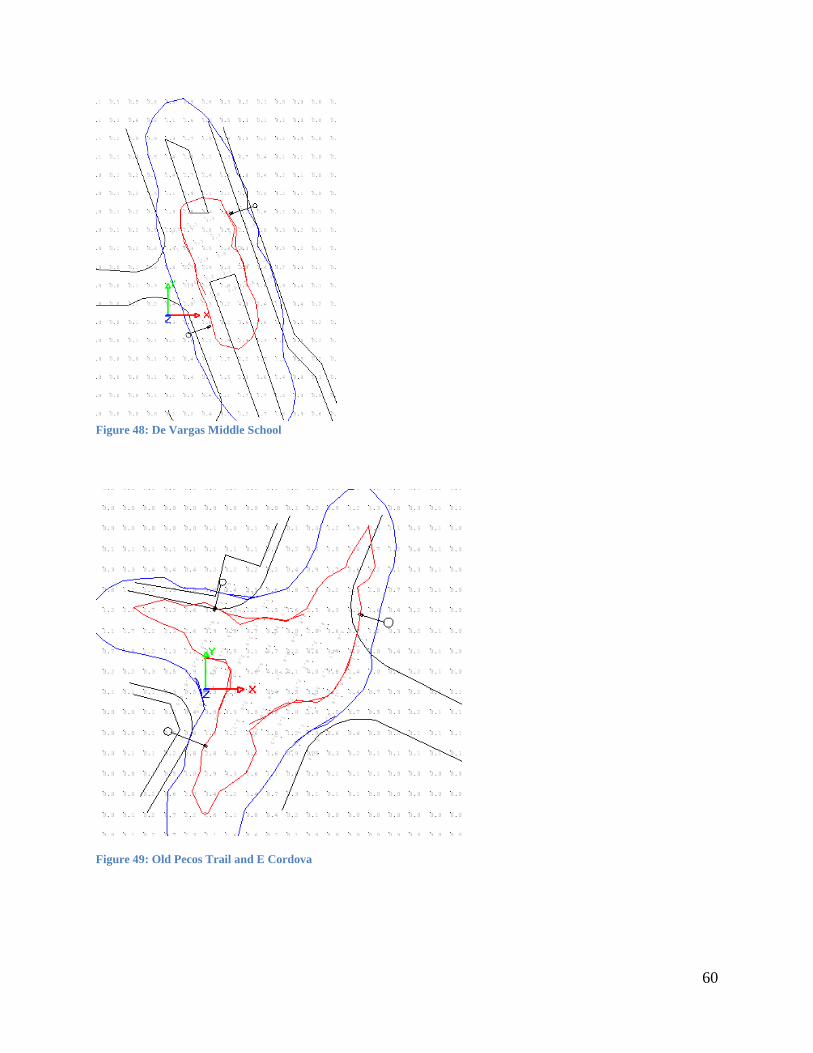
60
Figure 48: De Vargas Middle School
Figure 49: Old Pecos Trail and E Cordova
61
Figure 50: Old Pecos and Zia
Figure 51: Rodeo and Ave de las Campana
62
Figure 52: Rodeo and Yucca
Figure 53: Rodeo and Zia
63
Figure 54: Siringo and 5th
Figure 55:W San Mateo and Cll Corca
64
Figure 56: Zia and Camino Carlos Rey


![Santa Fe[1]](https://img.pdfslide.net/doc/110x75/55975ecf1a28ab961a8b4842/santa-fe1.jpg)