Embed Size (px)
Citation preview
Running Head: Limited English Proficient
Limited English Proficient Intervention: Effects of a Summer Program in Reading and Mathematics
Judi E. Vanderhaar
Marco A. Munoz
TABLE OF CONTENTS
Introduction………………………………………………………….………… 2
Program Description……………………………………..………….… 3 Program Goals & Objectives……………………………………….… 4
Evaluation Objectives & Questions…………………….…………..… 6
Evaluation Method…………………………………………………………….. 7
Evaluation Design…………………………………………..…………. 7 Measures…………………………………………………….…………. 8 Data Collection…………………………………..………….………… 9
Program Participants………………………………….……..…….…………. 9 Evaluation Results………………………………………………….…………. 11
Process…………………………………………………….…….…….. 11
Outcome…………………………………………………….….….….. 15
Cost Analysis………………………………………………..…………. 26 Discussion & Recommendations…………………………………….…..…… 27 References…………………………………………………………..…….…... 30
1
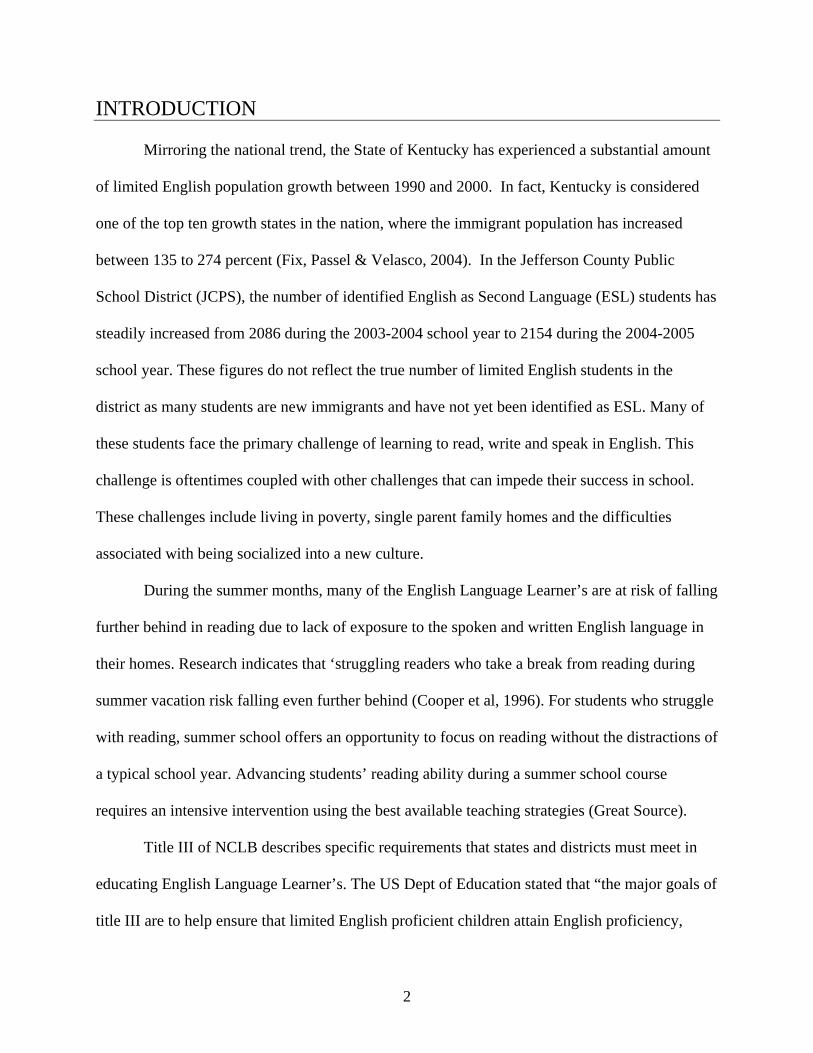
INTRODUCTION
Mirroring the national trend, the State of Kentucky has experienced a substantial amount
of limited English population growth between 1990 and 2000. In fact, Kentucky is considered
one of the top ten growth states in the nation, where the immigrant population has increased
between 135 to 274 percent (Fix, Passel & Velasco, 2004). In the Jefferson County Public
School District (JCPS), the number of identified English as Second Language (ESL) students has
steadily increased from 2086 during the 2003-2004 school year to 2154 during the 2004-2005
school year. These figures do not reflect the true number of limited English students in the
district as many students are new immigrants and have not yet been identified as ESL. Many of
these students face the primary challenge of learning to read, write and speak in English. This
challenge is oftentimes coupled with other challenges that can impede their success in school.
These challenges include living in poverty, single parent family homes and the difficulties
associated with being socialized into a new culture.
During the summer months, many of the English Language Learner’s are at risk of falling
further behind in reading due to lack of exposure to the spoken and written English language in
their homes. Research indicates that ‘struggling readers who take a break from reading during
summer vacation risk falling even further behind (Cooper et al, 1996). For students who struggle
with reading, summer school offers an opportunity to focus on reading without the distractions of
a typical school year. Advancing students’ reading ability during a summer school course
requires an intensive intervention using the best available teaching strategies (Great Source).
Title III of NCLB describes specific requirements that states and districts must meet in
educating English Language Learner’s. The US Dept of Education stated that “the major goals of
title III are to help ensure that limited English proficient children attain English proficiency,
2
develop high levels of academic competence in English and meet the same challenging state
academic content and student achievement standards” as all other students (Miller, 2003). In
accordance with the Federal requirements, JCPS strives to ensure that all of their ESL students
attain English proficiency by providing instruction during the regular school year, after school,
and summer school.
The ESL Summer Program utilized a reading and math program called Summer Success.
The program was chosen in light of the strong research base indicating that it is highly effective
in increasing both reading and math knowledge and skills. Further, the program includes a
structured instruction guide, high quality materials and assessment tools to measure student
progress.
Program Description
Summer Success Reading is a comprehensive program designed to help struggling learners
become fluent readers. The program is designed as a 6-week course that immerses students in
literature and gives them intensive instruction in the tools they need to become skilled readers.
The program components are rooted in scientifically based reading research that recommends
addressing several areas in multiple ways. These areas include (a) phonics awareness (b) phonics
(c) comprehension (d) fluency and (e) vocabulary. Thus, the program features five key elements
that help students build essential reading strategies:
1. Read Aloud begins the day with activities to build oral language skills and encourage
enjoyment of literature and language;
2. Read and Write Together provides planned, focused, shared reading opportunities that
promote student interaction with the text, the teacher and each other;
3
3. Read and Respond immerses students in reading, writing, listening, and speaking
activities through independent reading, paired reading, and small-group instruction.
4. Read and Explore Words focuses on strategies for reading, using and understanding new
words;
5. Assessment guidelines offer opportunities for teachers and students to assess student
understanding of the reading process. A test that assesses the fundamental program
components (a) phonological awareness (b) letter identification (c) oral reading and (d)
retelling are administered before and after the program.
The program teachers are supplied with a “kit” that included a multitude of materials to aide
in carrying out the program components. These materials include weekly lesson planners with
detailed implementation instructions and guidelines for assessing student progress, Student
Response Books, theme Magazines packed with engaging, highly-visual, readable articles in a
variety of genres, Read-Aloud Books, Double-sided Teaching Posters, and cardstock with punch-
out letters for word activities.
Although the primary focus of the summer program is reading, the program also provided
instruction to help build student’s confidence and proficiency in math. The math component
offers the opportunity for focused review and re-teaching of key math concepts and skills to help
prepare them for advancement to the next grade level. The five elements of the math component
include number names, games, practice, make & take, and assessment.
Program Goals & Objectives The overall goal of the ESL summer program is to help struggling Limited English
Proficiency students, acquire increased reading and math skills. With respect to reading, the
program provides concentrated instruction that develops student’s independence in decoding as
4
well as their ability to read fluently. The instruction also helps promote student’s independent
understanding and appreciation of books and stories. By immersing students in literature and
providing intensive instruction in the tools they need, the ESL summer programs strives to
accomplish the objective of helping students become skilled English readers.
With respect to math, the ESL Summer Program provides the opportunity for focused
review and re teaching of key math concepts and skills. By engaging in a variety of activities
that include both whole group instruction and individual practice to help students preview, learn
and review math topics, the ESL summer program endeavors to meet the objective of preparing
the participants for the next grade level in math.
5
EVALUATION OBJECTIVES AND QUESTIONS The objective of this evaluation was three fold. The first objective was to conduct a
process evaluation of the program. A process evaluation helps to understand program dynamics
and procedures. The overarching evaluation questions that guided the process study were the
following:
(a) What are the characteristics of the ESL summer program scope of services?
(b) What are the characteristics of the ESL summer program teachers and staff?
(c) What are the ESL summer program teacher’s impressions of the program with respect to
class size, attendance, site location, student behavior, program components/curriculum,
assessments, materials, teacher support, planning time and recommended improvements
for next year?
The second objective was to conduct an outcome evaluation. An outcome evaluation will
help determine the impact of the program on students as a result of participation in the program
(Fitzpatrick, Sanders & Worthen, 2004). Based on the goals and objectives of the program, the
overarching evaluation questions that guided the outcome study were the following:
(a) Are students participating in the program showing improvement on reading indicators
(i.e., phonological awareness, letter identification, oral reading, and retelling)?
(b) Does the program appear to differentially impact sub groups with respect to reading
indicator’s pretest percentage score range?
(c) Are students participating in the program showing improvement in math?
(d) Does the program appear to differentially impact sub groups with respect to math pretest
percentage score range?
6
The third objective is to conduct a cost analysis. The cost analysis will assist in determining
the cost effectiveness of the program in achieving the desired outcome of improving
participating students abilities in reading and math. The cost analysis questions include the
following:
(a) What is the total cost of program? (b) What is the source of funding?
(c) What is the total cost per student?
EVALUATION METHOD Design For the purpose of the evaluation, a mixed method descriptive design using pre and
posttest was utilized. This design helps to determine the impact of the program on reading and
math skills for participating students as well as aid in understanding program implementation
and dynamics. The quantitative component included the use of (a) descriptives to identify
participant characteristics and (b) Two-Related-Samples Nonparametric test. The test type used
in the nonparametric analysis is the Wilcoxon signed-rank test. The Wilcoxon signed-ranks
method tests the null hypothesis that two related means are the same. This is a useful test as it
considers information about both the sign and magnitude of the differences between paired
means from a matched sample and is appropriate to use with percentage scores.
The qualitative component consisted of a focus group conducted with the program
teachers. The focus group sought to determine the teacher’s impressions of the program with
respect to class size, attendance, site location, student behavior, program
components/curriculum, assessments, materials, teacher support, planning time and
recommended improvements for next year.
7
Measures
The assessment instruments that measured student’s knowledge in reading and math was
administered before and after participation in the ESL summer program. The content and length
of the assessments varied with respect to grade level. The Summer Success Reading Program
provided several different assessment techniques to help determine student success in the
program for both reading and math.
With respect to reading indicator assessments, Kindergarten and first grade pretest and
posttest each have two sections. Part (A) included phonological awareness and letter
identification to evaluate the student’s ability to discriminate and manipulate sounds and to
recognize and name the letters of the alphabet. Part (b) included wordless pictures reflecting the
child’s comprehension of the story structure and logical idea development as well as the extent to
which the child can verbalize information from a pictured sequence of events. For grades 2-8,
the reading assessments included the use of oral readings to evaluate student’s word
identification strategies with accompanying retellings that are used to determine the extent to
which the student understands and can verbalize important information. The percentage score for
phonological awareness ranged from a minimum of 10% to a maximum of 100%. The
percentage score for letter identification, oral reading, and retelling ranged from a minimum of
0% to a maximum of 100%.
The math assessments for all grade levels included 31 to 35 multiple-choice items. These
items assessed students understanding of key math concepts that were correlated to the grade
level core curriculum. The percentage score in math ranged from a minimum of 0% to a
maximum of 100%.
8
Data Collection
The program coordinator and program evaluators used different data sources to obtain
information for the purpose of the evaluation. First, the program coordinator provided individual
student data including identification number, language, ESL status, grade, school location and
outcome related measurements including pre and post assessment scores for reading indicators
and math. Second, the evaluators obtained student demographic characteristics using the
computerized database of the district. The evaluators also conducted a focus group with the ESL
summer program teachers to obtain qualitative information about the program.
PARTICIPANTS The ESL Summer Program served approximately 213 elementary, middle and high
school students from multiple school locations at the Americana and Lac Viet community
centers. Approximately 70% of participants were ESL students during the 2004-2005 school
year. The students participated in the program four days per week for six weeks during the
months of June and July.
As displayed in table 1, most of the students were in the elementary grades, are of
minority ethnicity, and live in single parent homes. Approximately half of the participants are
female and nine out of ten participants receive free/reduced lunch. While the primary languages
of participants include at least eight different foreign languages, the majority of the participant’s
primary language is Somolian, Spanish, or Vietnamese.
9
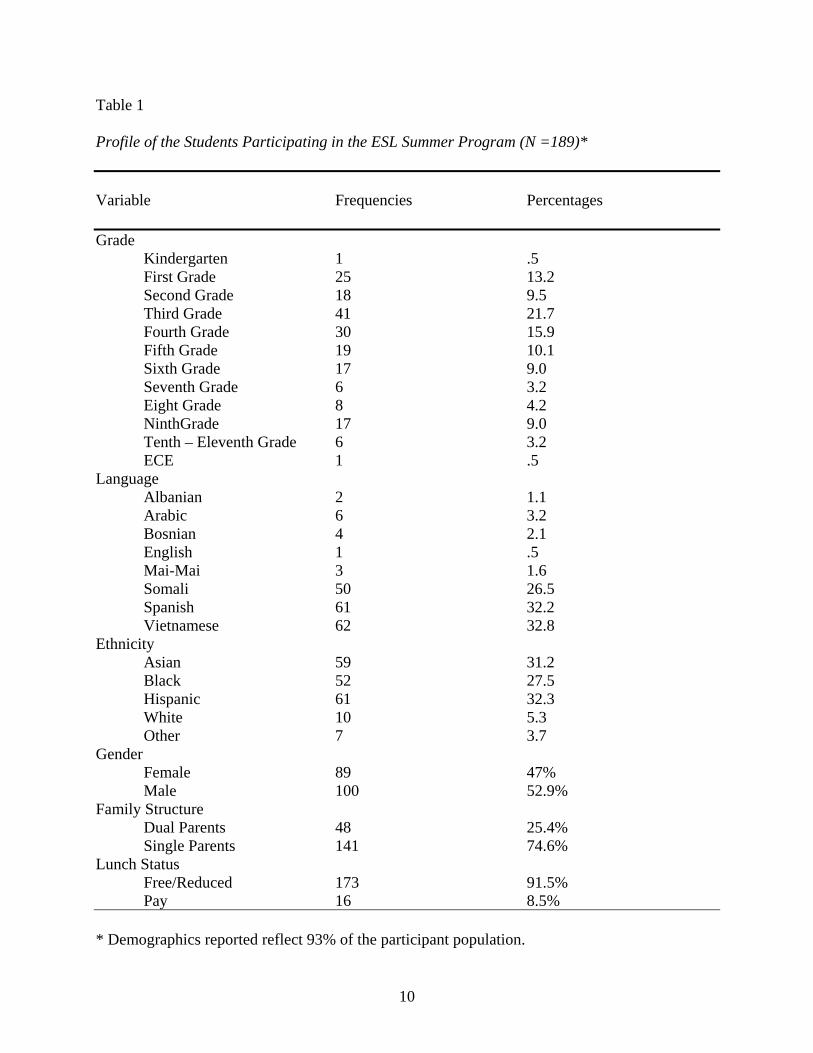
Table 1 Profile of the Students Participating in the ESL Summer Program (N =189)* Variable Frequencies Percentages Grade Kindergarten 1 .5 First Grade 25 13.2 Second Grade 18 9.5 Third Grade 41 21.7 Fourth Grade 30 15.9 Fifth Grade 19 10.1 Sixth Grade 17 9.0 Seventh Grade 6 3.2 Eight Grade 8 4.2 NinthGrade 17 9.0 Tenth – Eleventh Grade 6 3.2 ECE 1 .5 Language Albanian 2 1.1 Arabic 6 3.2 Bosnian 4 2.1 English 1 .5 Mai-Mai 3 1.6 Somali 50 26.5 Spanish 61 32.2 Vietnamese 62 32.8 Ethnicity Asian 59 31.2 Black 52 27.5 Hispanic 61 32.3
White 10 5.3 Other 7 3.7 Gender Female 89 47% Male 100 52.9% Family Structure Dual Parents 48 25.4% Single Parents 141 74.6% Lunch Status Free/Reduced 173 91.5% Pay 16 8.5% * Demographics reported reflect 93% of the participant population.
10
EVALUATION RESULTS Process
What are the characteristics of the ESL summer program scope of services?
The overall design of the ESL Summer Program is to provide intensive reading and math
instruction to those students in greatest need. Due to the various challenges faced by many of the
participants, including English language difficulties, lack of resources and loss of instructional
time during the summer, the ESL Summer program acts as a comprehensive intervention strategy
to socially and instructionally engage ESL students within a classroom setting for the purpose of
increasing knowledge, and skills, and abilities in reading and math.
The ESL summer program has thirteen primary staff members with an approximate budget of
$50,000. The funding for this program originates from the JCPS Title III funds. The program
utilizes the strategies and materials from the comprehensive, well researched, and highly
structured Summer Success reading and math program. By providing native language support
essential for success, the Bilingual Instructors work closely with the teachers and students to aid
in carrying out the activities and instruction of the program.
The ESL summer program is housed in two community centers that are equipped with
classrooms and a cafeteria. The program runs for six weeks, Monday through Thursday from
8:30-11:30am. Two hours is spent on reading instruction/activities and one hour is spent on math
instruction/activities. A free lunch is served each school day and one center provides swimming
activities after school on Wednesdays.
What are the characteristics of the ESL summer program teachers and staff?
The summer program is staffed by eight JCPS schoolteachers (six elementary, one high
and one middle school), one teacher assistant, and six Bilingual Associate Instructors (BLI) to
11
provide native language support (3 Spanish, 1 Somali and 1 Vietnamese). The program also
utilized one substitute BLI, three substitute teachers, and one retired teacher serving as a mentor
for new teachers. Five of the six teachers are White females and one teacher is a White male.
Four of the six BLI’s are Hispanic (two males and two females), one BLI is a Vietnamese female
and one is a Somali Male.
What are the ESL summer program teacher’s impressions?
In order to obtain a more comprehensive understanding of the program’s implementation
processes, and setting, a focus group was conducted with the teachers (N = 6) during the last
week of the program. The evaluators engaged in a semi-structured focus group with the teachers
at the program site to determine the teacher’s impressions of the program with respect to class
size, attendance, site location, student behavior, program components/curriculum, assessments,
materials, teacher support, planning time and recommended improvements for next year. The
following are the finding from the focus group:
Overall Impressions:
The teachers felt very positive about the program and gave it an overall rating of A. The
students were academically at-risk, but teachers were able to impact their learning in reading.
The teachers agreed that the focus should be only in reading.
Class Size:
Class size for the majority of teachers was described as a bit too large (i.e., 27-40 per
teacher), or not small enough to facilitate one-on-one instruction. The teachers suggested
reducing class size for next year. Also, many teachers expressed having difficulty teaching to the
large degree of variation in ability levels within their classes. For example, one teacher shared
12
that a few higher-level ability students dropped out because they became bored doing lower level
work done by their classmates.
Attendance:
Overall, the teacher’s impressions of attendance were positive. That is, while some
students were tardy, the majority of them attended regularly. Also, having the BAI call the
students at home was helpful in getting students to attend. There is always room for
improvement in attendance during a summer program.
Site Locations:
The teachers felt the program sites were in good locations in that facilitated good
attendance, as most students were able to walk to the sites. They also felt that the partnership
with Americana Community Center and LacViet Center was a positive asset.
Student Behavior:
Teachers shared that the students behaved very well overall. Teachers described students
as motivated and very respectful. Two teachers shared that students from Africa had a few more
challenges with respect to socialization skills due to differences in cultural norms. It might be
necessary to target the socialization dimension at the beginning of the program.
Program Components/Curriculum:
The teachers all agreed that there was not enough time to go through each component
daily, particularly with respect to math. The teachers suggested that due to lack of reading skills,
the math component was more difficult to facilitate and felt that this time would be better spent
on reading (e.g., guided reading, shared reading). Many of the teachers showed an interest in
adding guided reading to the curriculum, as they felt this would inevitable produce higher gains
13
in reading and would be reflected in assessment results. One of the first year teachers said she
enjoyed the structure that the curriculum offered.
Assessments:
Overall, the teachers felt that the assessments were too time consuming, as the reading
assessment required one on one time. They shared that the assessment took away from the
overall instruction time and suggested that (a) an assistant administer the tests so they can
continue teaching and/or (b) pre-tests are given by the student’s teacher and take place during
registration or on the first day. The teachers did share that they felt the content in the reading
assessment was appropriate and measured what was covered.
Materials/Supplies/Teacher Support/Planning Time:
The teachers were all in agreement that they had the necessary materials and supplies
during the program. They also felt positive about the amount and quality of the materials,
particularly the magazines and selection of books. The teachers shared that they all received a
good amount of support from facilitators/directors. With respect to planning time, the teachers
shared that planning time worked best when they were able to plan 30 min prior and 30 min post
program day.
Recommended Improvements:
Reduce class size to be able to provide more individualized instruction
Split classes according to reading/literacy ability levels rather than by grade
Conduct assessment on the first day and provide assistance to teachers for regular
assessments so they may continue instruction
Drop the math component and add guided reading (with centers) to enhance learning and
assessment gains
14
Offer more support/resources for African students to aide in socialization and literacy
Tie the after-school activities (i.e., swimming privilege) to attendance at school and
continue using BAI’s to assist in ensuring attendance by phone calls home
Ensure after school programs for these students and if possible add field trips to aid in
exposing them to the larger community
Explore the population of ESL students not being served (in Arcadia and Douglass Park)
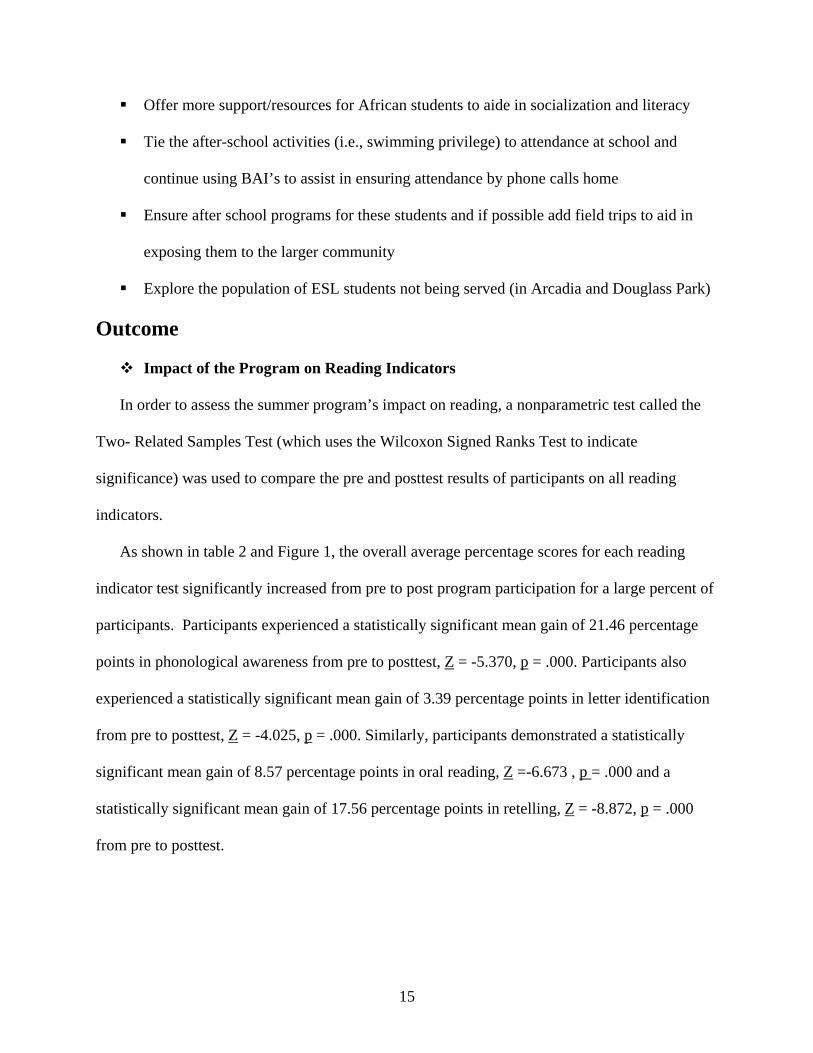
Outcome
Impact of the Program on Reading Indicators
In order to assess the summer program’s impact on reading, a nonparametric test called the
Two- Related Samples Test (which uses the Wilcoxon Signed Ranks Test to indicate
significance) was used to compare the pre and posttest results of participants on all reading
indicators.
As shown in table 2 and Figure 1, the overall average percentage scores for each reading
indicator test significantly increased from pre to post program participation for a large percent of
participants. Participants experienced a statistically significant mean gain of 21.46 percentage
points in phonological awareness from pre to posttest, Z = -5.370, p = .000. Participants also
experienced a statistically significant mean gain of 3.39 percentage points in letter identification
from pre to posttest, Z = -4.025, p = .000. Similarly, participants demonstrated a statistically
significant mean gain of 8.57 percentage points in oral reading, Z =-6.673 , p = .000 and a
statistically significant mean gain of 17.56 percentage points in retelling, Z = -8.872, p = .000
from pre to posttest.
15
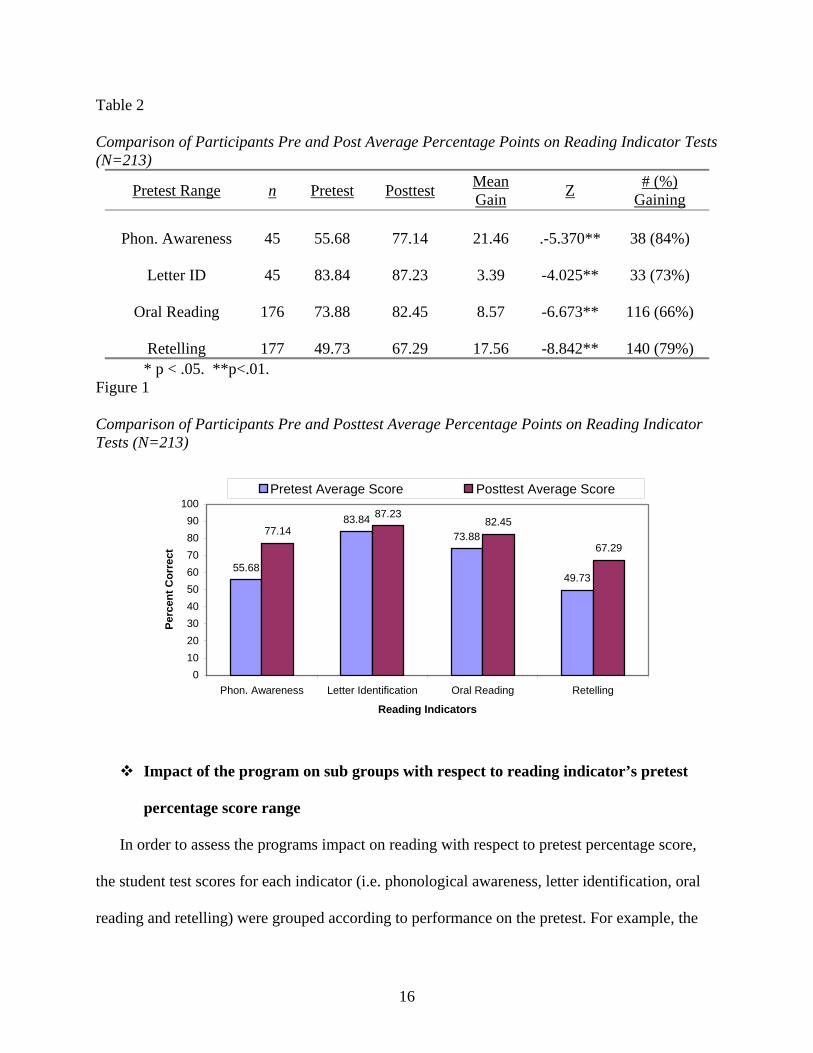
Table 2 Comparison of Participants Pre and Post Average Percentage Points on Reading Indicator Tests (N=213)
Pretest Range n Pretest Posttest Mean Gain Z # (%)
Gaining
Phon. Awareness
45 55.68 77.14 21.46 .-5.370** 38 (84%)
Letter ID 45 83.84 87.23 3.39 -4.025** 33 (73%)
Oral Reading
176 73.88 82.45 8.57 -6.673** 116 (66%)
Retelling 177 49.73 67.29 17.56 -8.842** 140 (79%) * p < .05. **p<.01. Figure 1 Comparison of Participants Pre and Posttest Average Percentage Points on Reading Indicator Tests (N=213)
55.68
83.8473.88
49.73
77.1487.23
82.45
67.29
0102030405060708090
100
Phon. Awareness Letter Identification Oral Reading Retelling
Reading Indicators
Perc
ent C
orre
ct
Pretest Average Score Posttest Average Score
Impact of the program on sub groups with respect to reading indicator’s pretest
percentage score range
In order to assess the programs impact on reading with respect to pretest percentage score,
the student test scores for each indicator (i.e. phonological awareness, letter identification, oral
reading and retelling) were grouped according to performance on the pretest. For example, the
16
scores of students who scored between 21-40% on the pretest were grouped with other students
in the same range. The posttest scores shown are the outcomes of the same group of students.
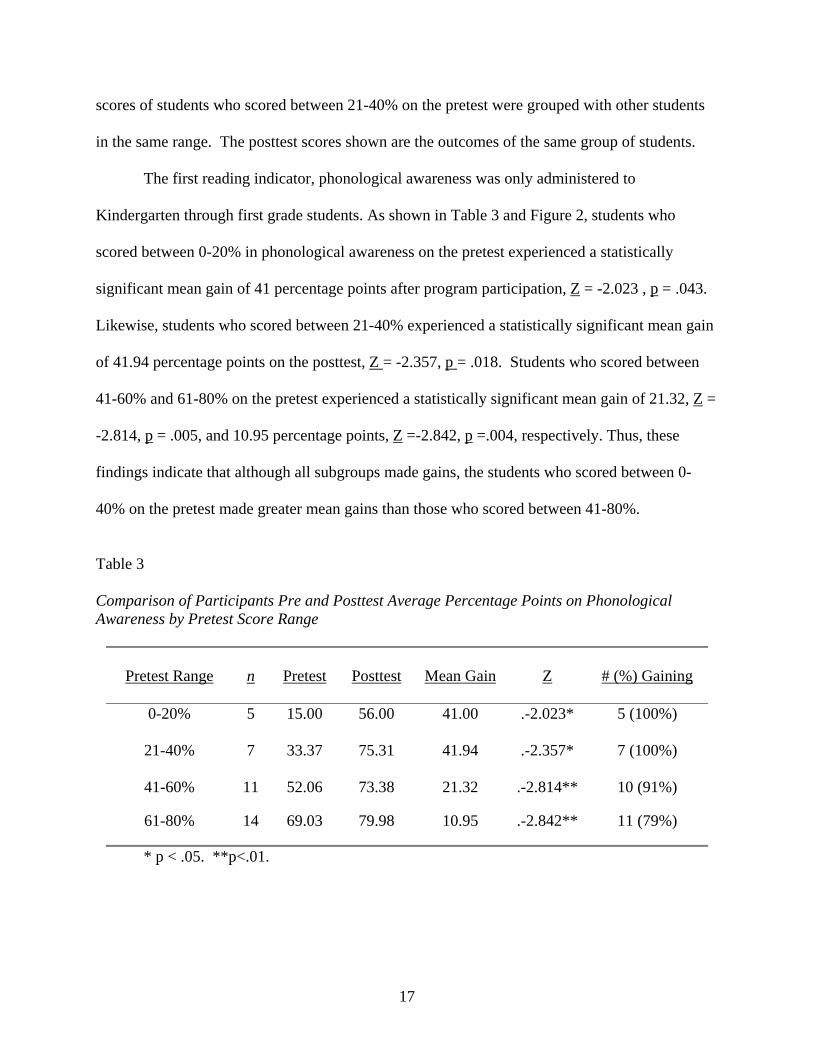
The first reading indicator, phonological awareness was only administered to
Kindergarten through first grade students. As shown in Table 3 and Figure 2, students who
scored between 0-20% in phonological awareness on the pretest experienced a statistically
significant mean gain of 41 percentage points after program participation, Z = -2.023 , p = .043.
Likewise, students who scored between 21-40% experienced a statistically significant mean gain
of 41.94 percentage points on the posttest, Z = -2.357, p = .018. Students who scored between
41-60% and 61-80% on the pretest experienced a statistically significant mean gain of 21.32, Z =
-2.814, p = .005, and 10.95 percentage points, Z =-2.842, p =.004, respectively. Thus, these
findings indicate that although all subgroups made gains, the students who scored between 0-
40% on the pretest made greater mean gains than those who scored between 41-80%.
Table 3 Comparison of Participants Pre and Posttest Average Percentage Points on Phonological Awareness by Pretest Score Range
Pretest Range n Pretest Posttest Mean Gain Z
# (%) Gaining
0-20% 5 15.00 56.00 41.00 .-2.023* 5 (100%)
21-40% 7
33.37
75.31
41.94
.-2.357*
7 (100%)
41-60%
11
52.06
73.38
21.32
.-2.814**
10 (91%)
61-80% 14 69.03 79.98 10.95 .-2.842** 11 (79%)
* p < .05. **p<.01.
17
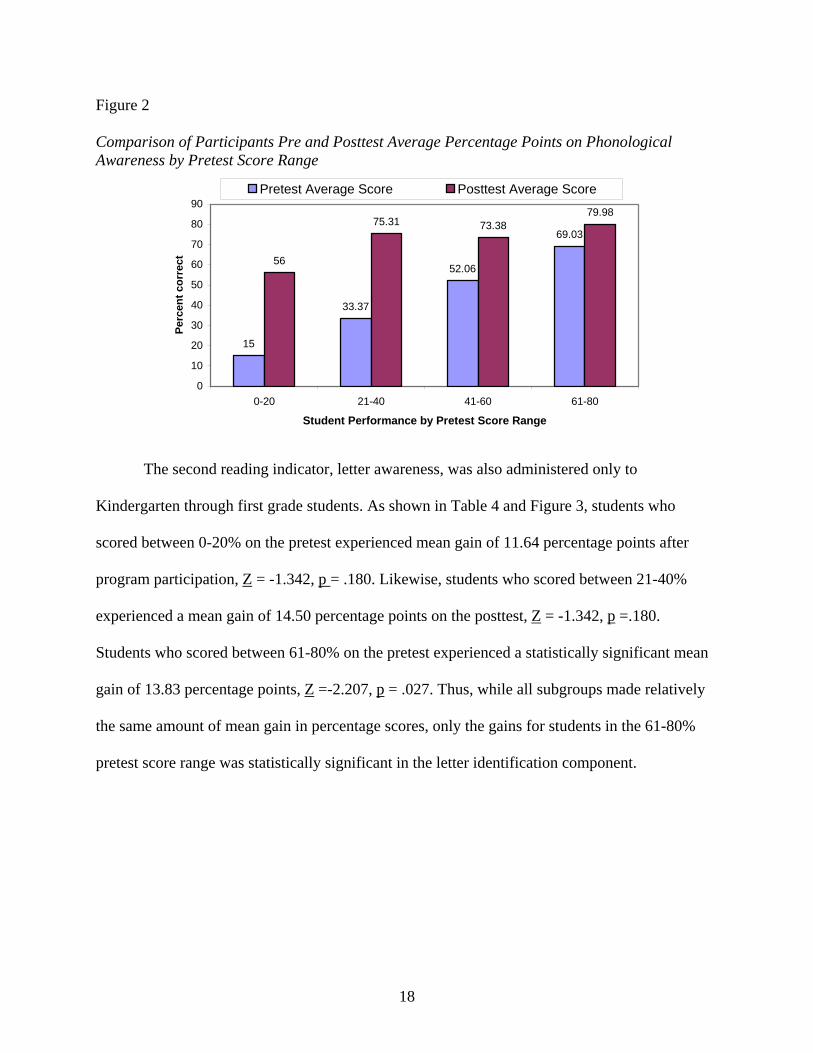
Figure 2 Comparison of Participants Pre and Posttest Average Percentage Points on Phonological Awareness by Pretest Score Range
15
33.37
52.06
69.03
56
75.31 73.3879.98
0
10
20
30
40
50
60
70
80
90
0-20 21-40 41-60 61-80
Student Performance by Pretest Score Range
Perc
ent c
orre
ctPretest Average Score Posttest Average Score
The second reading indicator, letter awareness, was also administered only to
Kindergarten through first grade students. As shown in Table 4 and Figure 3, students who
scored between 0-20% on the pretest experienced mean gain of 11.64 percentage points after
program participation, Z = -1.342, p = .180. Likewise, students who scored between 21-40%
experienced a mean gain of 14.50 percentage points on the posttest, Z = -1.342, p =.180.
Students who scored between 61-80% on the pretest experienced a statistically significant mean
gain of 13.83 percentage points, Z =-2.207, p = .027. Thus, while all subgroups made relatively
the same amount of mean gain in percentage scores, only the gains for students in the 61-80%
pretest score range was statistically significant in the letter identification component.
18
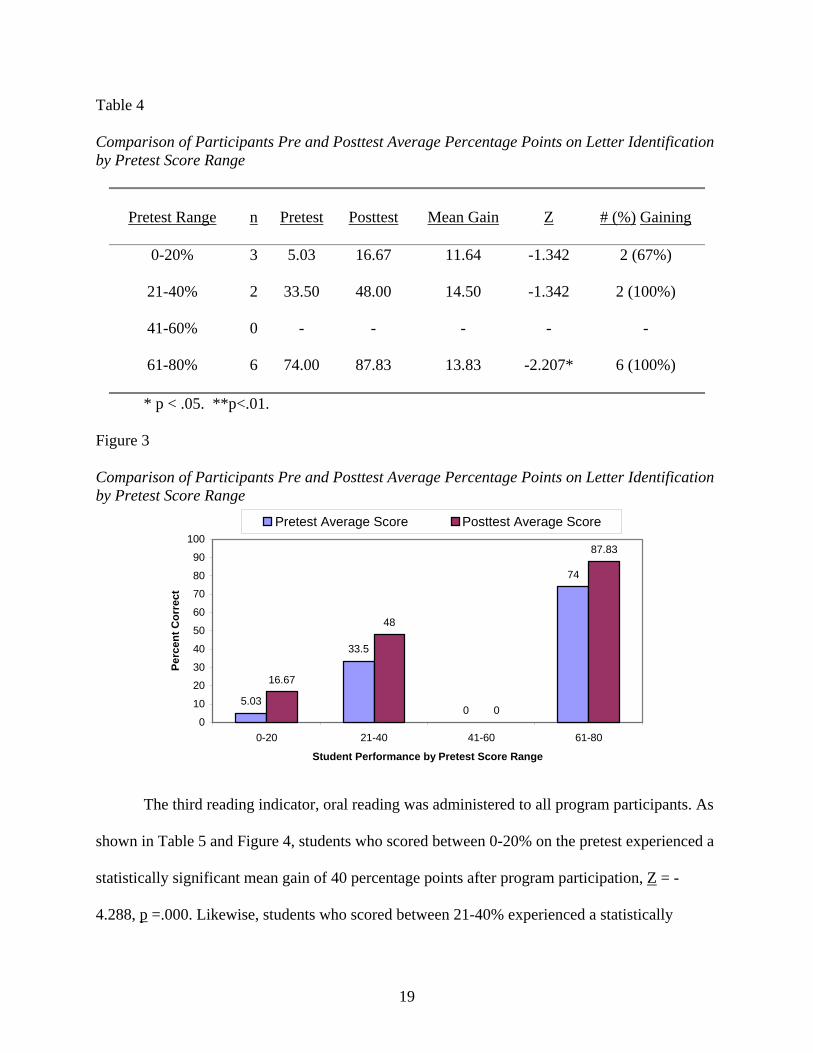
Table 4 Comparison of Participants Pre and Posttest Average Percentage Points on Letter Identification by Pretest Score Range
Pretest Range n Pretest Posttest Mean Gain
Z
# (%) Gaining
0-20% 3 5.03 16.67 11.64 -1.342 2 (67%)
21-40% 2
33.50
48.00
14.50
-1.342
2 (100%)
41-60%
0
-
-
-
-
-
61-80% 6 74.00 87.83 13.83 -2.207*
6 (100%)
* p < .05. **p<.01. Figure 3 Comparison of Participants Pre and Posttest Average Percentage Points on Letter Identification by Pretest Score Range
5.03
33.5
0
74
16.67
48
0
87.83
0
10
20
30
40
50
60
70
80
90
100
0-20 21-40 41-60 61-80
Student Performance by Pretest Score Range
Perc
ent C
orre
ct
Pretest Average Score Posttest Average Score
The third reading indicator, oral reading was administered to all program participants. As
shown in Table 5 and Figure 4, students who scored between 0-20% on the pretest experienced a
statistically significant mean gain of 40 percentage points after program participation, Z = -
4.288, p =.000. Likewise, students who scored between 21-40% experienced a statistically
19
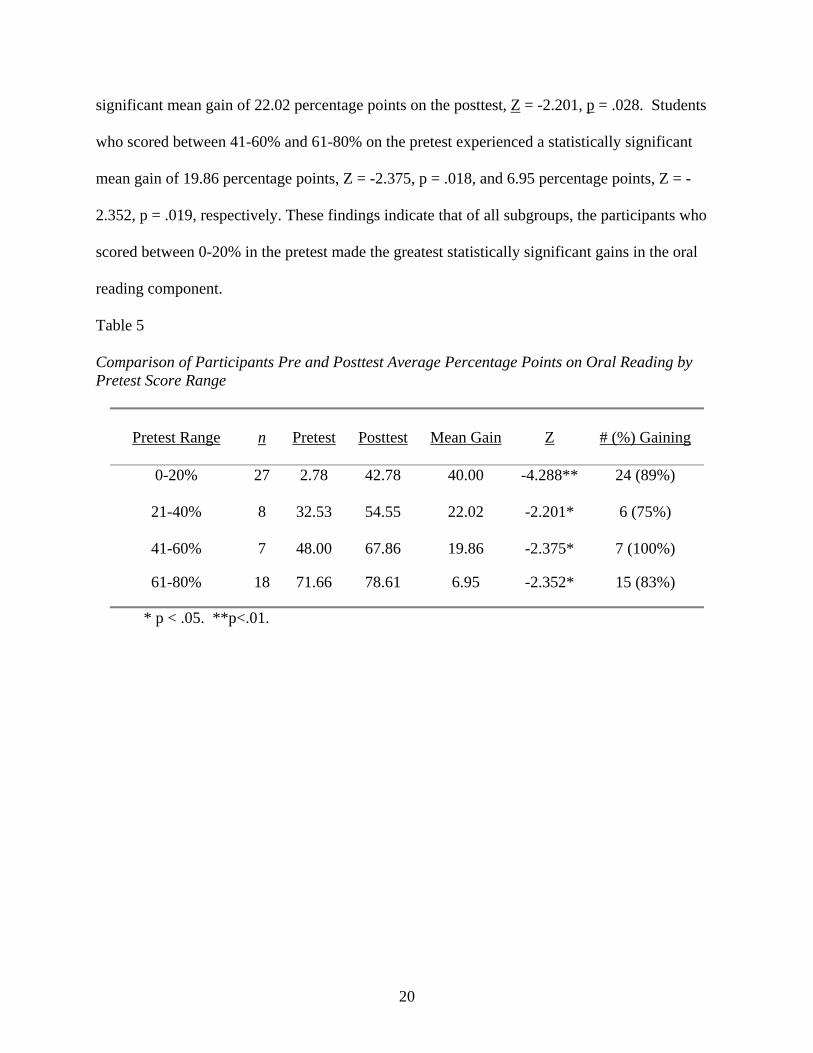
significant mean gain of 22.02 percentage points on the posttest, Z = -2.201, p = .028. Students
who scored between 41-60% and 61-80% on the pretest experienced a statistically significant
mean gain of 19.86 percentage points, Z = -2.375, p = .018, and 6.95 percentage points, Z = -
2.352, p = .019, respectively. These findings indicate that of all subgroups, the participants who
scored between 0-20% in the pretest made the greatest statistically significant gains in the oral
reading component.
Table 5 Comparison of Participants Pre and Posttest Average Percentage Points on Oral Reading by Pretest Score Range
Pretest Range n Pretest Posttest Mean Gain Z
# (%) Gaining
0-20% 27 2.78 42.78 40.00 -4.288** 24 (89%)
21-40% 8
32.53
54.55
22.02
-2.201*
6 (75%)
41-60%
7
48.00
67.86
19.86
-2.375*
7 (100%)
61-80% 18 71.66 78.61 6.95 -2.352* 15 (83%)
* p < .05. **p<.01.
20
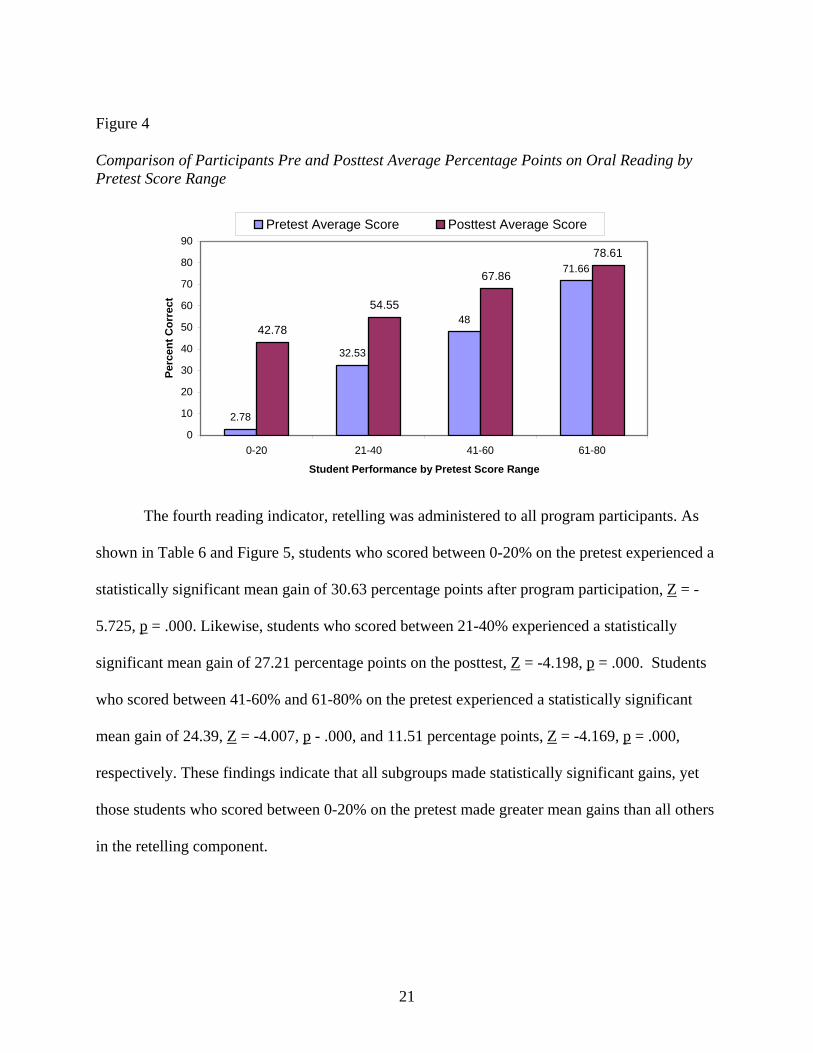
Figure 4 Comparison of Participants Pre and Posttest Average Percentage Points on Oral Reading by Pretest Score Range
2.78
32.53
48
71.66
42.78
54.55
67.86
78.61
0
10
20
30
40
50
60
70
80
90
0-20 21-40 41-60 61-80
Student Performance by Pretest Score Range
Perc
ent C
orre
ct
Pretest Average Score Posttest Average Score
The fourth reading indicator, retelling was administered to all program participants. As
shown in Table 6 and Figure 5, students who scored between 0-20% on the pretest experienced a
statistically significant mean gain of 30.63 percentage points after program participation, Z = -
5.725, p = .000. Likewise, students who scored between 21-40% experienced a statistically
significant mean gain of 27.21 percentage points on the posttest, Z = -4.198, p = .000. Students
who scored between 41-60% and 61-80% on the pretest experienced a statistically significant
mean gain of 24.39, Z = -4.007, p - .000, and 11.51 percentage points, Z = -4.169, p = .000,
respectively. These findings indicate that all subgroups made statistically significant gains, yet
those students who scored between 0-20% on the pretest made greater mean gains than all others
in the retelling component.
21
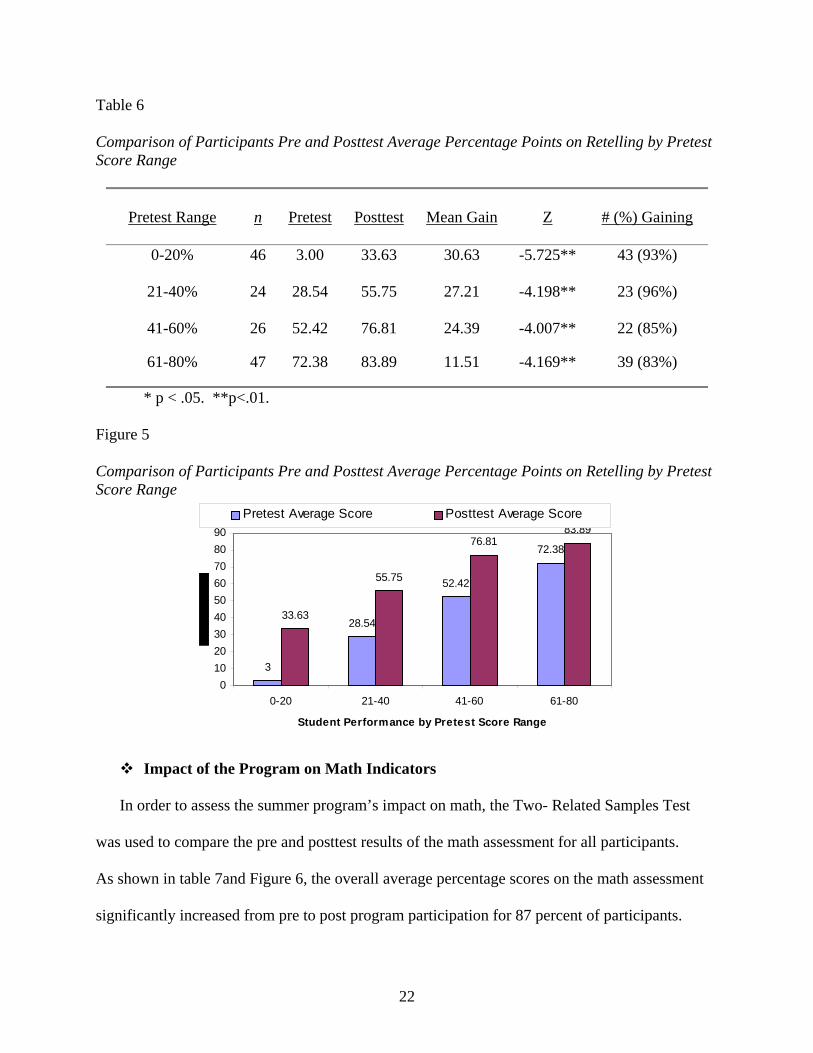
Table 6 Comparison of Participants Pre and Posttest Average Percentage Points on Retelling by Pretest Score Range
Pretest Range n Pretest Posttest Mean Gain Z
# (%) Gaining
0-20% 46 3.00 33.63 30.63 -5.725** 43 (93%)
21-40%
24
28.54
55.75
27.21
-4.198**
23 (96%)
41-60%
26
52.42
76.81
24.39
-4.007**
22 (85%)
61-80% 47 72.38 83.89 11.51 -4.169** 39 (83%)
* p < .05. **p<.01. Figure 5 Comparison of Participants Pre and Posttest Average Percentage Points on Retelling by Pretest Score Range
3
28.54
52.42
72.38
33.63
55.75
76.8183.89
0102030405060708090
0-20 21-40 41-60 61-80
Student Performance by Pretest Score Range
Pretest Average Score Posttest Average Score
Impact of the Program on Math Indicators In order to assess the summer program’s impact on math, the Two- Related Samples Test
was used to compare the pre and posttest results of the math assessment for all participants.
As shown in table 7and Figure 6, the overall average percentage scores on the math assessment
significantly increased from pre to post program participation for 87 percent of participants.
22
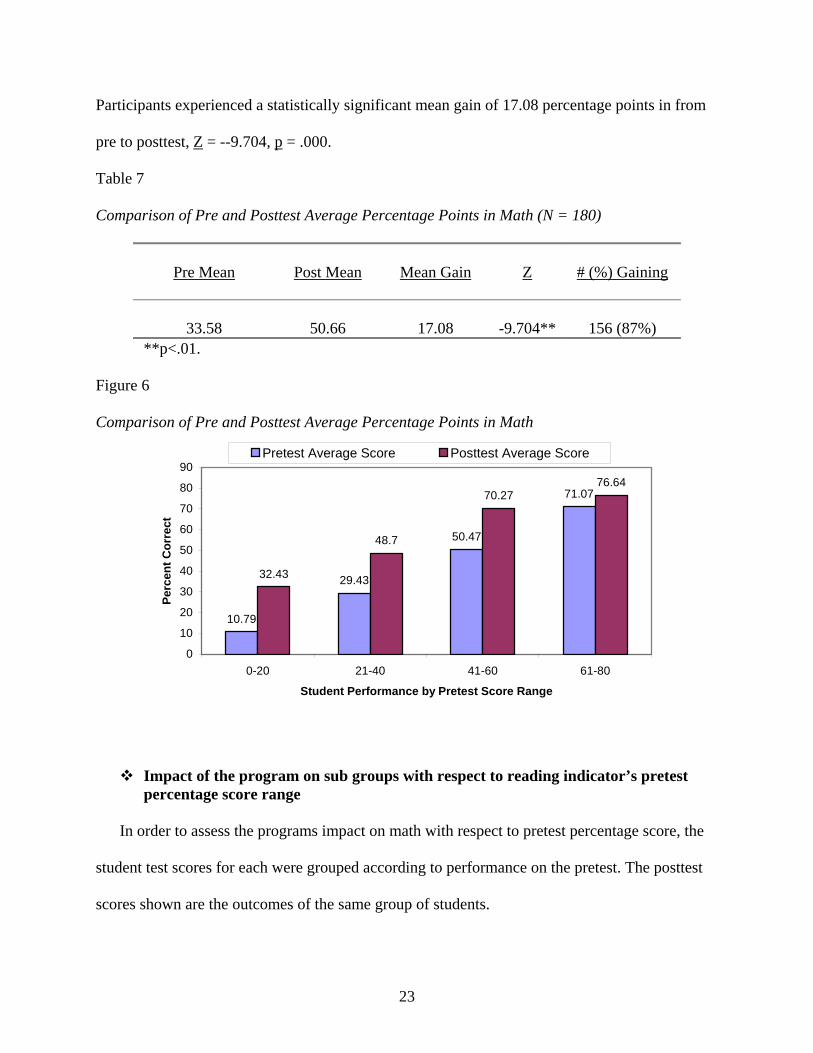
Participants experienced a statistically significant mean gain of 17.08 percentage points in from
pre to posttest, Z = --9.704, p = .000.
Table 7 Comparison of Pre and Posttest Average Percentage Points in Math (N = 180)
Pre Mean
Post Mean Mean Gain Z # (%) Gaining
33.58
50.66
17.08
-9.704**
156 (87%)
**p<.01. Figure 6 Comparison of Pre and Posttest Average Percentage Points in Math
10.79
29.43
50.47
71.07
32.43
48.7
70.2776.64
0
10
20
30
40
50
60
70
80
90
0-20 21-40 41-60 61-80
Student Performance by Pretest Score Range
Perc
ent C
orre
ct
Pretest Average Score Posttest Average Score
Impact of the program on sub groups with respect to reading indicator’s pretest percentage score range
In order to assess the programs impact on math with respect to pretest percentage score, the
student test scores for each were grouped according to performance on the pretest. The posttest
scores shown are the outcomes of the same group of students.
23
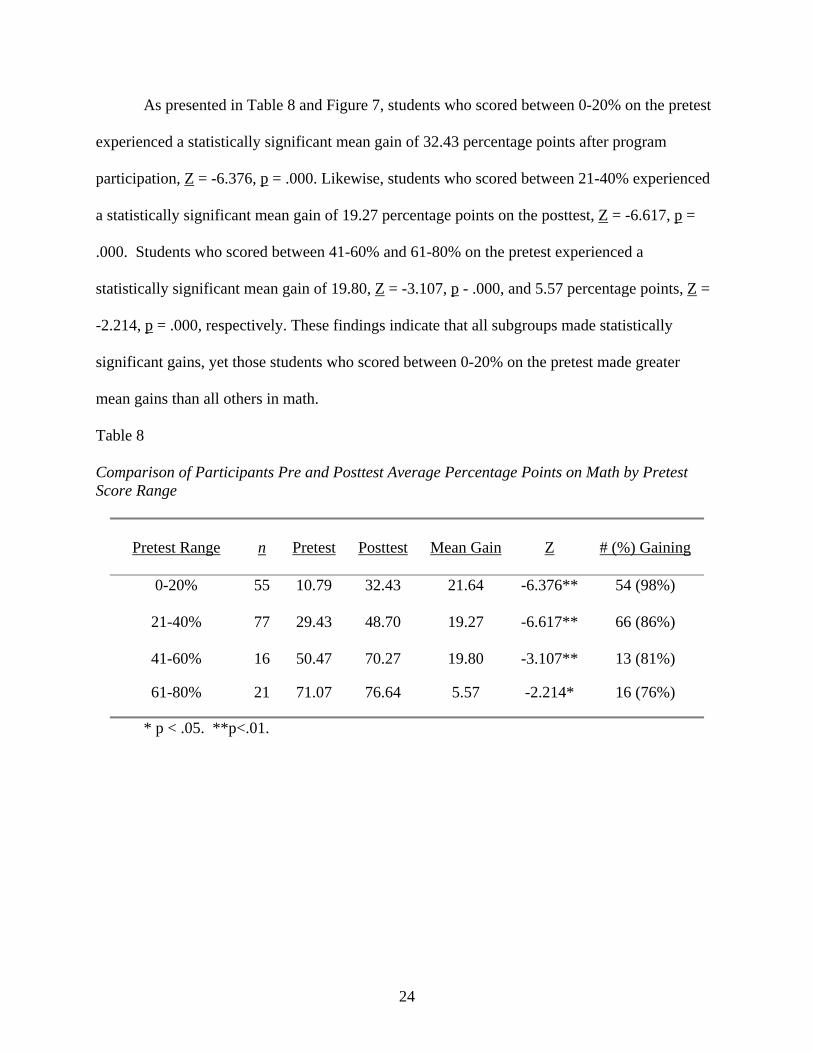
As presented in Table 8 and Figure 7, students who scored between 0-20% on the pretest
experienced a statistically significant mean gain of 32.43 percentage points after program
participation, Z = -6.376, p = .000. Likewise, students who scored between 21-40% experienced
a statistically significant mean gain of 19.27 percentage points on the posttest, Z = -6.617, p =
.000. Students who scored between 41-60% and 61-80% on the pretest experienced a
statistically significant mean gain of 19.80, Z = -3.107, p - .000, and 5.57 percentage points, Z =
-2.214, p = .000, respectively. These findings indicate that all subgroups made statistically
significant gains, yet those students who scored between 0-20% on the pretest made greater
mean gains than all others in math.
Table 8 Comparison of Participants Pre and Posttest Average Percentage Points on Math by Pretest Score Range
Pretest Range n Pretest Posttest Mean Gain Z
# (%) Gaining
0-20% 55 10.79 32.43 21.64 -6.376** 54 (98%)
21-40%
77
29.43
48.70
19.27
-6.617**
66 (86%)
41-60%
16
50.47
70.27
19.80
-3.107**
13 (81%)
61-80% 21 71.07 76.64 5.57 -2.214* 16 (76%)
* p < .05. **p<.01.
24
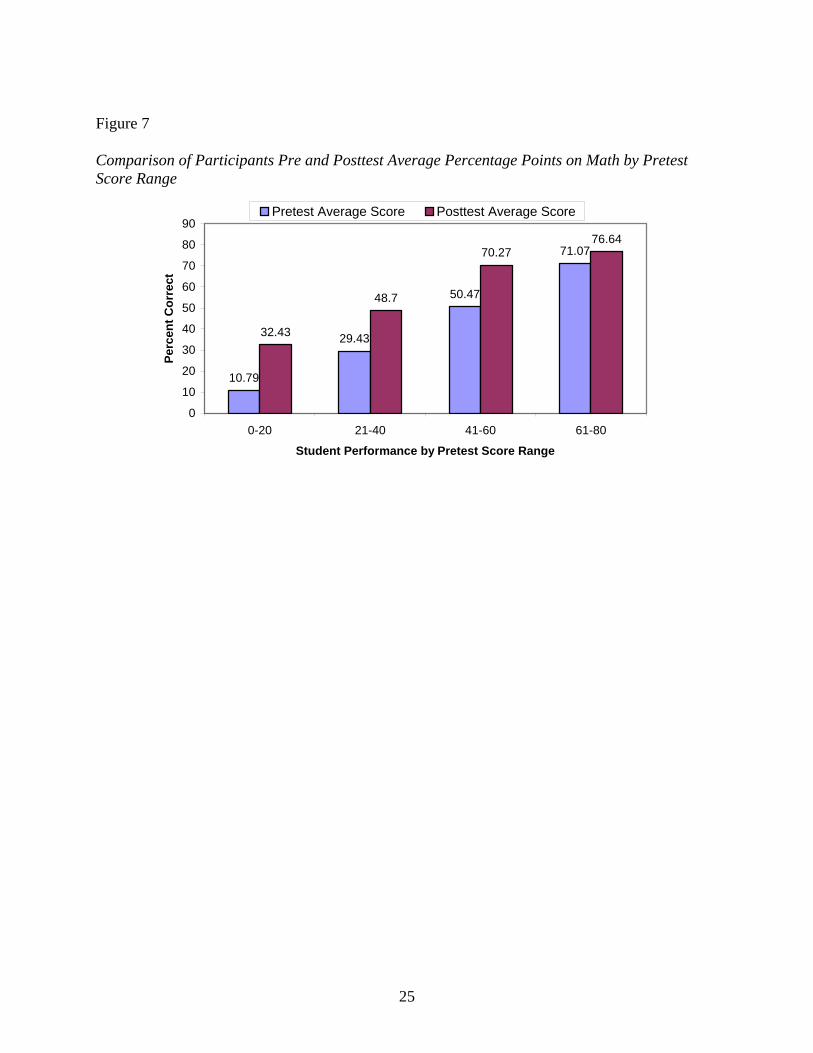
Figure 7 Comparison of Participants Pre and Posttest Average Percentage Points on Math by Pretest Score Range
10.79
29.43
50.47
71.07
32.43
48.7
70.2776.64
0
10
20
30
40
50
60
70
80
90
0-20 21-40 41-60 61-80
Student Performance by Pretest Score Range
Perc
ent C
orre
ct
Pretest Average Score Posttest Average Score
25
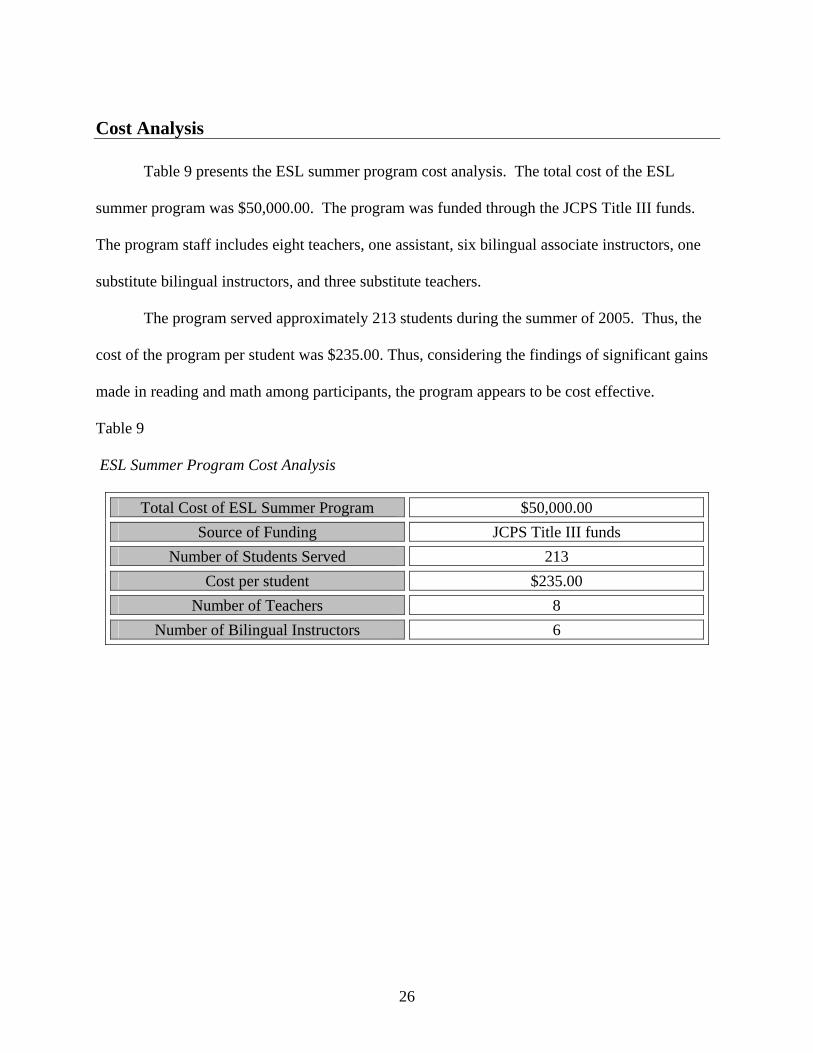
Cost Analysis Table 9 presents the ESL summer program cost analysis. The total cost of the ESL
summer program was $50,000.00. The program was funded through the JCPS Title III funds.
The program staff includes eight teachers, one assistant, six bilingual associate instructors, one
substitute bilingual instructors, and three substitute teachers.
The program served approximately 213 students during the summer of 2005. Thus, the
cost of the program per student was $235.00. Thus, considering the findings of significant gains
made in reading and math among participants, the program appears to be cost effective.
Table 9
ESL Summer Program Cost Analysis
Total Cost of ESL Summer Program $50,000.00 Source of Funding JCPS Title III funds
Number of Students Served 213 Cost per student $235.00
Number of Teachers 8 Number of Bilingual Instructors 6
26
DISCUSSION & RECOMMENDATIONS
Overall, the findings from this process/outcome evaluation reflect very positively on the
ESL Summer Program. The program is targeting students in all grade levels with high needs,
who face the primary challenge of acquiring, learning and comprehending the English Language.
Coupled with this primary challenge, most of the participants also live in single-family homes,
are poor, and are disconnected from their “home” culture. Thus, in addition to providing reading
and math instruction, the program also helps students gain the socialization skills necessary for
success in the classroom.
The ESL Summer Program participants demonstrated an overall statistically significant
increase in all reading indicator and math assessment scores from pretest to posttest. The
program appears to be working most effectively for students with the least amount of reading
and math skills, as measured by scores on pretest. Moreover, the positive feedback from the
teachers in the program regarding student behavior, materials, teacher support and site locations
all indicate that the program is immersed in a positive and supportive culture for both teachers
and students.
Recommendations
While the evaluation findings are positive, there is always room for improvement and thus,
several key recommendations have emerged from this evaluation. Fist, while the program
Summer Success is structured in such a way that allows for data driven measurement of results
through pre and posttests, the data reporting and data entry procedures were highly inconsistent
across sites and classrooms, with a good amount of missing data. In the future, all data should be
entered in a clearly systematic and standard manner. Thus, each teacher or assistant that will be
27
responsible for recording or entering data should be given the same clear guidelines as to
appropriate data format and entry. Further, raw numbers should always be used when recording
test scores and the assessment scale for each component should be clearly identifiable.
Second, information from the focus group and pretest data indicate that the classroom
grouping of students was more a function of grade level/age than ability level. Many of the
teachers suggested that they had a wide range of ability levels in their classrooms, which made it
more difficult to tailor group instruction. Also, according the pretest scores in both reading and
math, several students scored 100% yet were administered the posttest at the same level. So, the
program may want to consider grouping students according to reading ability/literacy level as
reflected by the pretest scores. In this respect, it would also be useful to conduct assessments on
the first day.
Third, with respect to assessments, it would be useful to conduct assessments on the first
day for grouping purposes. Further, due to the limited amount of instructional time during the
summer program and the time consuming nature of administering assessments, it may be helpful
to utilize the BLI’s and assistants to aid with the regular assessments as this would allow teachers
to continue instruction.
Fourth, many of the teachers suggested that having math as a secondary component in the
program was challenging and felt that the time would be better spent on additional
reading/literacy instruction. However, due to the positive gains made in math among a large
percent of participants coupled with the increasing primacy of math in the NCLB landscape, the
program should consider continuing with the math component. One possibility that may aid in
easing the math instruction component would be to instruct the students in math in the beginning
of the day, rather than at the end or rotate teachers who will focus only on math.
28

Finally, although many of the participants experienced gains in reading and math during
the summer program, the program may want to consider following up with the participants
during the regular school year. This would help determine the sustainability of gains made
during the summer program.
29
REFERENCES Cooper, H., Nye, B., Charlton, K., Lindsay, J., & Greenhouse, S. (1996). The effects of summer
vacation on achievement test scores: a narrative and meta-analytic review. Review of
Educational Research, 66, 227-268.
Fitzpatrick, J., Sanders, J., and Worthen, B (2004). Program Evaluation: Alternative approaches
and practical guidelines. Boston, MA: Pearson, Allyn and Bacon.
Fix, M, Passel, J & Velasco, J (2004) School Reform: The demographic imperative and
challenge. Conference paper, as retrieved from the World Wide Web at www.iza.org on
August 30, 2005.
Great Source. Summer Success: Reading. Research base and Program Efficacy, as retrieved
from the World Wide Web at www.greatsource.com .
Miller, Kirsten (2003). English Language Learners and the No Child Left Behind Act. Changing
Schools, Fall 2003. Mid-Continent Research for Education and Learning, Aurora, CO.
30