Embed Size (px)
Citation preview
Limited utility of residue masking for positive-selection
inference
Stephanie J. Spielman1∗, Eric T. Dawson1, and Claus O. Wilke1
Address:
1Department of Integrative Biology, Center for Computational Biology and Bioinformatics, and
Institute of Cellular and Molecular Biology. The University of Texas at Austin, Austin, TX 78712,
USA.
∗Corresponding author
Email: [email protected]
Manuscript type: Letter
Keywords: multiple sequence alignment, alignment filters, positive-selection inference, sequence
simulation
1
© The Author 2014. Published by Oxford University Press on behalf of the Society for Molecular Biology andEvolution. All rights reserved. For permissions, please e-mail: [email protected]
MBE Advance Access published June 3, 2014 at U
niversity of Sheffield on July 8, 2014http://m
be.oxfordjournals.org/D
ownloaded from
Abstract
Errors in multiple sequence alignments (MSAs) can reduce accuracy in positive-selection in-
ference. Therefore, it has been suggested to filter MSAs before conducting further analyses. One
widely-used filter, Guidance, allows users to remove MSA positions aligned with low confidence.
However, Guidance’s utility in positive-selection inference has been disputed in the literature.
We have conducted an extensive simulation-based study to characterize fully how Guidance
impacts positive-selection inference, specifically for protein-coding sequences of realistic diver-
gence levels. We also investigated whether novel scoring algorithms, which phylogenetically
corrected confidence scores, and a new gap-penalization score-normalization scheme improved
Guidance’s performance. We found that no filter, including original Guidance, consistently
benefitted positive-selection inferences. Moreover, all improvements detected were exceedingly
minimal, and in certain circumstances, Guidance-based filters worsened inferences.
Multiple sequence alignment (MSA) construction represents the most fundamental step in nearly
all molecular evolution analyses. Recently, several studies have shown that poor MSA quality can
hinder accuracy in positive-selection inference (Schneider et al. 2009; Fletcher and Yang 2010;
Markova-Raina and Petrov 2011). In response, some have advocated that users filter MSAs by
removing putatively poorly-aligned regions (Jordan and Goldman 2012; Privman et al. 2012), with
the goal of reducing noise and maximizing signal.
One widely-used filter, known as Guidance (Penn et al. 2010), derives a confidence score for each
MSA position by sampling guide tree variants during progressive alignment construction. Users
can then mask positions that score below a set threshold, thus removing potentially misleading
signal. Unfortunately, studies investigating Guidance’s utility in positive-selection inference have
produced conflicting findings. While one study (Privman et al. 2012) found that Guidance dra-
matically improved accuracy, a separate study (Jordan and Goldman 2012) found that Guidance
affected positive-selection inference only modestly. Both studies found that filtering was primarily
beneficial for highly diverged sequences, although it is unlikely that these high divergence levels were
representative of sequences used in typical positive-selection inference studies. Overall, Privman
et al. (2012) strongly advocated Guidance’s use, while Jordan and Goldman (2012) emphasized
relying primarily on robust MSA construction methods.
To reconcile these distinct recommendations, we have conducted an extensive simulation-based
study to elucidate how the Guidance filter affects positive-selection inference, particularly for se-
quences of realistic divergence levels. We additionally examined the potential benefits to modifying
the Guidance scoring scheme in several ways. First, we assessed whether two novel algorithms that
2
at University of Sheffield on July 8, 2014
http://mbe.oxfordjournals.org/
Dow
nloaded from
corrected Guidance scores for the sequences’ phylogenetic relationships could improve upon the
original Guidance algorithm. The first phylogenetically-corrected method incorporated a weight,
calculated by BranchManager (Stone and Sidow 2007), for each MSA sequence, and the second
method incorporated patristic distances (the sum of branch lengths between two taxa), calculated
through the Python library DendroPy (Sukumaran and Holder 2010). We refer to these meth-
ods, respectively, as BMweights and PDweights. We additionally tested a new gap-penalization
score-normalization scheme, which scaled a given residue’s score according to the number of gaps
in its column, thus capturing the inherent unreliability of residues in gappy regions. We refer to
filters using the gap-penalization scheme as GuidanceP, BMweightsP, and PDweightsP. To assess
the performance of these novel algorithms, we reimplemented the Guidance software (available at
https://github.com/sjspielman/alignment filtering).
We simulated protein-coding sequences using Indelible (Fletcher and Yang 2009) according to
two selective profiles: H1N1 influenza hemagluttinin (HA), which featured a mean dN/dS = 0.37,
and HIV-1 envelope protein subunit GP41, which featured a mean dN/dS = 0.89. We used these
selective profiles because, while both genes contain positively selected regions (Bush et al. 1999;
Frost et al. 2001; Bandawe et al. 2008; Meyer and Wilke 2012), most sites in HA are either under
strong purifying or positive selection, whereas relatively more sites in GP41 have dN/dS values near
1, making positive-selection inference more challenging. For each selective profile, we simulated 100
MSA replicates along each of four different gene trees consisting of 11, 26, 60, and 158 taxa, yielding
800 simulated MSAs in total. The first two trees were obtained from Spielman and Wilke (2013),
and the second two trees were obtained from Yang et al. (2011) and Betancur-R et al. (2013), as
deposited in TreeBASE (http://treebase.org). All sequences were simulated with a 5% indel rate,
as is typical of mammalian genomes (Cooper et al. 2004), and an average length of 400 codons.
We processed unaligned amino-acid sequences with our Guidance reimplementation using the
aligner MAFFT L-INS-I (linsi) (Katoh et al. 2002, 2005) and calculated confidence scores for all
inferred MSAs using each of the six scoring algorithms. We masked positions with scores below
0.5, the same threshold used by Jordan and Goldman (2012). A more stringent threshold (e.g., 0.9
as used by Privman et al. 2012) worsened selection inference in certain cases (see Supplementary
Material, Table S1).
We inferred positive selection using two methods: FUBAR (Murrell et al. 2013), implemented
in HyPhy (Kosakovsky Pond et al. 2005), and the standard PAML M8 model (Yang et al. 2000;
Yang 2007). Phylogenies used for positive-selection inference were constructed in RAxMLv7.3.0
3
at University of Sheffield on July 8, 2014
http://mbe.oxfordjournals.org/
Dow
nloaded from
using the “PROTGAMMAWAG” model (Stamatakis 2006). While we processed all MSAs with
FUBAR, we did not process the 158-sequence MSAs with PAML due to prohibitive runtimes. A
detailed description of all methods, including the Guidance software reimplementation, is available
in Supplementary Materials.
Guidance-based filters have a minimal effect on positive-selection inference
We first compared the resulting false positive rates (FPRs) and true positive rates (TPRs) of
positive-selection inference between each filtered MSA and its corresponding unfiltered MSA. For
this analysis, we considered sites as positively selected if the given inference method (i.e. FUBAR
or PAML) returned a posterior probability ≥ 0.90. Performance measures TPR and FPR were
calculated using the true dN/dS values assigned during simulation.
For each simulation set, we fit two mixed-effects models using the R package lme4 (Bates et al.
2012), with either TPR or FPR as the response, filtering algorithm (including no filtering) as a
fixed effect, and simulation count as a random effect. Table 1 summarizes results from these models
for the GP41 simulation sets. As we generally found that all filters within a given normalization
scheme performed similarly, Table 1 displays results for only Guidance and GuidanceP. Table S2
contains linear model results for all filtering algorithms and for both the HA and GP41 selective
profiles.
As Table 1 shows, unfiltered MSAs had exceedingly small FPRs. While MSA filtering, particu-
larly the gap-penalization algorithms, significantly decreased FPRs, the large percentage reductions
recovered corresponded to very few false positive sites. Indeed, for the GP41 158-sequence simu-
lation set, Guidance and GuidanceP removed, on average, only 0.61 and 1.14, respectively, false
positive sites from unfiltered MSAs. Thus, the actual number of false positives in our MSAs were
so low that the percentage changes shown in Table 1 do not accurately reflect the real-world impact
of Guidance-based MSA filtering on positive-selection inference.
In general, Guidance-based filtering only marginally affected TPR. While filtering significantly
increased TPR in a few cases, it also significantly decreased TPR in other cases, but all statistically
significant effects were of extremely small magnitudes. Moreover, GuidanceP provided both the
largest TPR increases and FPR decreases, while Guidance influenced mean TPR more modestly.
This result likely reflected the fact that gap-penalization algorithms masked more sites than did
algorithms using the original normalization scheme (Table S3).
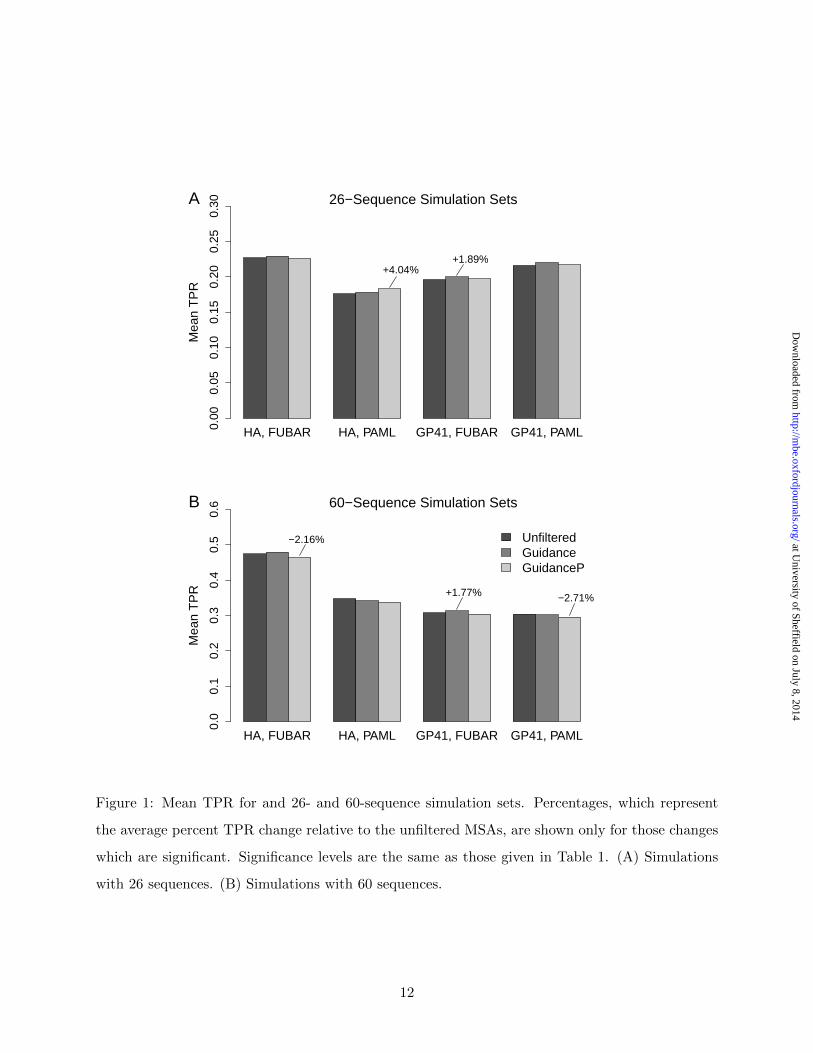
Inference methods responded inconsistently to MSA filtering. Figure 1 shows the TPR model
4
at University of Sheffield on July 8, 2014
http://mbe.oxfordjournals.org/
Dow
nloaded from
results for the 26- and 60-sequence simulation sets for both the HA and GP41 selective profiles.
In FUBAR analyses, filters performed similarly across simulation sets (Guidance mean TPR was
generally higher than were both unfiltered and GuidanceP mean TPRs), but this trend was mostly
statistically insignificant. In PAML analyses, however, filters did not behave consistently across
simulation conditions. For instance, the HA 26-sequence simulation set, when processed with
GuidanceP and PAML, exhibited the largest TPR improvement (4.04%) in this study. However,
for the GP41 60-sequence simulation set, processing MSAs with GuidanceP and PAML significantly
reduced mean TPR (-2.71%).
In sum, it was difficult to identify clear trends dictating whether filtering increased or decreased
TPR. However, we emphasize that, for both the HA and GP41 simulation sets of 158 taxa, all filters
significantly decreased FPR and increased TPR, on average, although all effect magnitudes were
minimal. As we did not analyze these data sets with PAML, we caution that this result may not
extrapolate to inference methods other than FUBAR. Additionally, all filters significantly reduced
TPR for the GP41 11-sequence simulation set as analyzed with PAML. Thus, we did recover a
slight trend suggesting that MSA filtering should be reserved for larger MSAs.
Guidance-based filters improve power under narrow conditions
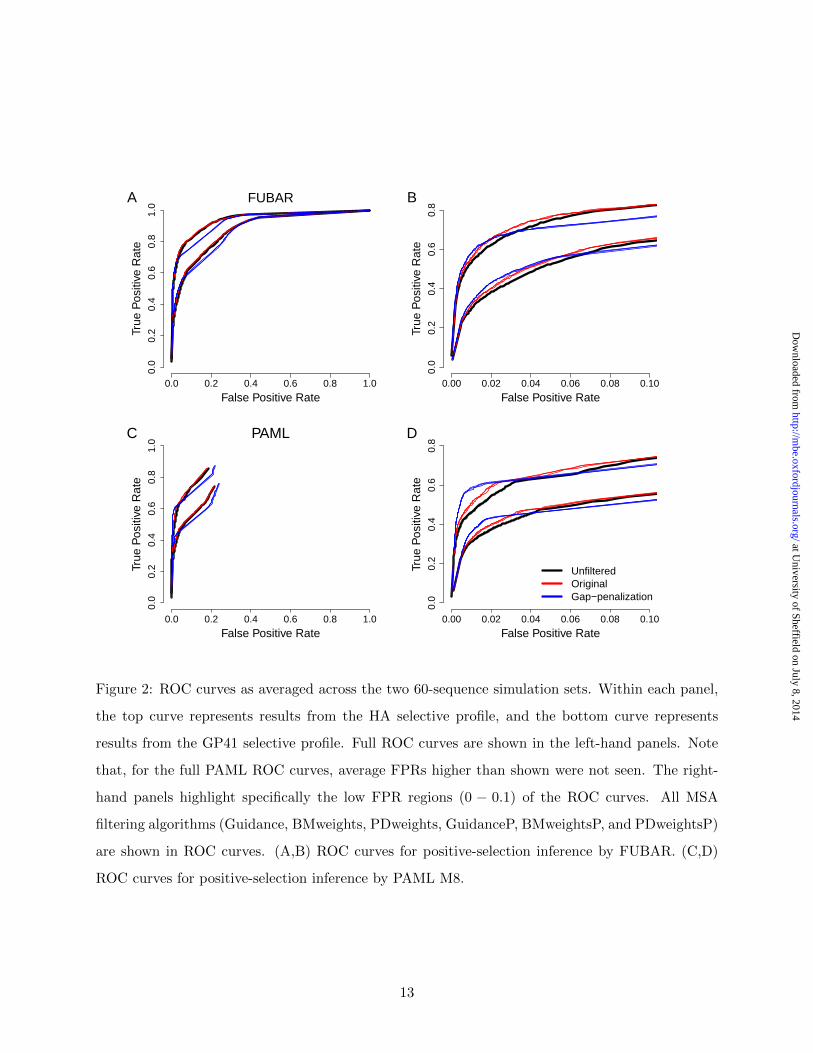
We additionally used receiver operating characteristic (ROC) curves to assess whether MSA filtering
influenced power in positive-selection inference. Importantly, this analysis did not restrict results
to those obtained from a single posterior probability threshold for calling positive-selected sites.
ROC curves for the HA and GP41 60-sequence simulation sets are shown in Figure 2.
Several trends emerged from Figure 2. First, power in positive-selection inference for HA
simulation sets was universally greater than for GP41 simulation sets. Given that the GP41 se-
quences featured a greater proportion of sites with dN/dS near 1 that were more difficult to
classify, this result was unsurprising. Second, as algorithms within a given normalization scheme
(original vs. gap-penalization) had nearly identical curves, this analysis confirmed that introduc-
ing phylogenetically-weighted scores did not strongly affect Guidance confidence scores. Finally,
across the entire span of the ROC curves (left-hand panels of Figure 2), the unfiltered and filtered
MSA curves were mostly indistinguishable, although MSAs filtered with gap-penalization algo-
rithms did, at certain FPR levels (roughly 0.1 − 0.3), perform worse than did both unfiltered and
Guidance-filtered MSAs.
However, filtering did somewhat increase power at very low FPR rates, as seen in the right-hand
5
at University of Sheffield on July 8, 2014
http://mbe.oxfordjournals.org/
Dow
nloaded from
panels of Figure 1, in particular when using PAML. These benefits, unfortunately, only existed at
FPR levels of roughly 1%− 4%, above which any improvements quickly dissipated. Outside of this
narrow FPR region, filtered MSAs either performed the same as or worse than unfiltered MSAs.
Importantly, when we identified positively-selected sites at a posterior probability ≥ 0.9, nearly all
recovered FPRs were, on average, far less than 1% (Table 1), and therefore below the region where
filtering increased power. Our low recovered FPRs explained why we did not detect substantial
increases in TPR in our regression models (Figure 1, Table 1, Table S1). Taken together, these
results demonstrated that Guidance-based filtering was not robust to varying FPR levels. ROC
curves for all other simulation sets yielded results broadly consistent with those described here
(Figures S1 and S2).
Discussion and Conclusions
The primary goal of MSA filtering is to remove excessive noise while preserving informative data.
We recovered few conditions for which filtering consistently achieved this goal. While Guidance-
based filtering was useful for FPR levels ranging from around 1% − 4%, this range was extremely
narrow, and it is impossible to know if any given real data set will actually fall in this range. More-
over, that the more statistically-controlled phylogenetically-corrected algorithms did not improve
upon the original Guidance algorithm indicated the minimal benefits that Guidance-based filtering
produced in the first place. The original Guidance did not prove to be a robust method, and the
phylogenetically-corrected scoring algorithms we implemented did not perform any better.
Our study focused primarily on divergence levels representative of realistic protein-coding data
typically used in positive-selection inference. Therefore, it is possible that Guidance would have
provided stronger benefits with highly diverged data (Jordan and Goldman 2012; Privman et al.
2012). However, as shown in Table S3, our MSAs contained gaps in up to 60% of columns, meaning
that constructing MSAs on our datasets was not a trivial task, and portions which were difficult
to align certainly existed.
In sum, two distinct conclusions may be drawn from our study. First, although Guidance
did not universally benefit positive-selection inference, it never entirely precluded the detection of
positively-selected sites. Therefore, filtering could be used as a conservative method in selection
inference, particularly if abundant false positives are expected. Second, all benefits that filtering
conferred were minimal, and filters behaved inconsistently across simulation sets and between the
inference methods. Given these observations, there is no guarantee that MSA filtering will help
6
at University of Sheffield on July 8, 2014
http://mbe.oxfordjournals.org/
Dow
nloaded from

or harm any given analysis. In fact, Guidance-based filters may inadvertently result in a loss of
power.
We conclude that, while potentially beneficial, Guidance-based filtering is not a particularly
reliable method for positive-selection inference, and therefore does not need to be a necessary com-
ponent of such studies. Furthermore, given that only the 158-sequence simulation sets consistently
featured both increased TPR and decreased FPR, we recommend that filtering be reserved for
relatively large (≥ 150 taxa) datasets. Moreover, we suggest that, when filtering, users employ
a lenient threshold (≤ 0.5) to preserve informative signal to the extent possible. Above all, we
advocate that users primarily focus on employing high-quality MSA inference [e.g. linsi (Katoh
et al. 2005) or PRANK (Loytynoja and Goldman 2008)] and positive-selection inference methods.
Supplementary Material
Supplementary Methods, Figures S1 and S2, and Tables S1, S2, and S3, are available at Molecular
Biology and Evolution online (http:// www.mbe.oxfordjournals.org/).
Acknowledgements
This work was supported in part by NIH grant R01 GM088344 to C.O.W., ARO grant W911NF-
12-1-0390 to C.O.W., and NSF Cooperative Agreement No. DBI-0939454 (BEACON Center). The
authors thank Eyal Privman for constructive discussion and Sergei Kosakovsky Pond for valuable
comments, for providing a GP41 alignment and phylogeny, and for help using FUBAR.
7
at University of Sheffield on July 8, 2014
http://mbe.oxfordjournals.org/
Dow
nloaded from
References
Bandawe G, Martin D, Treurnicht F, Mlisana K, Abdool Karim S, Williamson C, The CAPRISA
002 Acute Infection Study Team. 2008. Conserved positive selection signals in gp41 across
multiple subtypes and difference in selection signals detectable in GP41 sequences sampled during
acute and chronic HIV-1 subtype c infection. Virology Journal 5:141.
Bates D, Maechler M, Bolker B. 2012. lme4: Linear mixed-effects models using S4 classes. R
package version 0.999999-0.
Betancur-R R, Li C, Munroe T A, Ballesteros J A, Orti G. 2013. Addressing gene tree discordance
and non-stationarity to resolve a multi-locus phylogeny of the flatfishes (Teleostei: Pleuronecti-
formes). Systematic Biology 62(5):763–785.
Bush R, Bender C, Subbarao K, Cox N, Fitch W. 1999. Predicting the evolution of human influenza
a. Science 286:1921–1925.
Cooper G, Brudno M, Stone E, Dubchak I, Batzoglou S, Sidow A. 2004. Characterization of
evolutionary rates and constraints in three mammalian genomes. Genome Research 14:539 –
548.
Fletcher W, Yang Z. 2009. INDELible: A Flexible Simulator of Biological Sequence Evolution.
Molecular Biology and Evolution 26(8):1879–1888.
Fletcher W, Yang Z. 2010. The Effect of Insertions, Deletions, and Alignment Errors on the
Branch–Site Test of Positive Selection. Molecular Biology and Evolution 27(10):2257–2267.
Frost S, Gunthard H, Wong J, Havlir D, Richman D, Brown A. 2001. Evidence for positive selection
driving the evolution of HIV-1 env under potent antiviral therapy. Virology 282:250–258.
Hothorn T, Bretz F, Westfall P. 2008. Simultaneous inference in general parametric models. Bio-
metrical Journal 50(3):346–363.
Jordan G, Goldman N. 2012. The effects of alignment error and alignment filtering on the sitewise
detection of positive selection. Mol Biol Evol 29:1125–1139.
Katoh K, Kuma K I, Toh H, Miyata T. 2005. MAFFT version 5: improvement in accuracy of
multiple sequence alignment. Nucleic Acids Res 33:511–518.
8
at University of Sheffield on July 8, 2014
http://mbe.oxfordjournals.org/
Dow
nloaded from
Katoh K, Misawa K, Kuma K I, Miyata T. 2002. MAFFT: a novel method for rapid multiple
sequence alignment based on fast Fourier transform. Nucleic Acids Res 30:3059–3066.
Kosakovsky Pond S L, Frost S D W, Muse S V. 2005. HyPhy: hypothesis testing using phylogenies.
Bioinformatics 12:676–679.
Loytynoja A, Goldman N. 2008. Phylogeny–aware gap placement prevents errors in sequence
alignment and evolutionary analysis. Science 320:1632–1635.
Markova-Raina P, Petrov D. 2011. High sensitivity to aligner and high rate of false positives in the
estimates of positive selection in the 12 Drosophila genomes. Genome Research 21(6):863–874.
Meyer A G, Wilke C O. 2012. Integrating sequence variation and protein structure to identify sites
under selection. Mol Biol Evol 30:36–44.
Murrell B, Moola S, Mabona A, Weighill T, Scheward D, Kosakovsky Pond S L, Scheffler K. 2013.
FUBAR: A Fast, Unconstrained Bayesian AppRoximation for inferring selection. Molecular
Biology and Evolution 30:1196–1205.
Penn O, Privman E, Landan G, Graur D, Pupko T. 2010. An alignment confidence score capturing
robustness to guide tree uncertainty. Mol Biol Evol 27:1759–1767.
Privman E, Penn O, Pupko T. 2012. Improving the performance of positive selection inference by
filtering unreliable alignment regions. Mol Biol Evol 29:1–5.
Schneider A, Souvorov A, Sabath N, Landan G, Gonnet G H, Graur D. 2009. Estimates of positive
darwinian selection are inflated by errors in sequencing, annotation, and alignment. Genome
Biology and Evolution 1(0):114–118.
Spielman S J, Wilke C O. 2013. Membrane environment imposes unique selection pressures on
transmembrane domains of G protein–coupled receptors. Journal of Molecular Evolution 76:172–
182.
Stamatakis A. 2006. RAxML-VI-HPC: maximum likelihood-based phylogenetic analyses with thou-
sands of taxa and mixed models. Bioinformatics 22:21:2688–2690.
Stone E, Sidow A. 2007. Constructing a meaningful evolutionary average at the phylogenetic center
of mass. BMC Bioinformatics 8:222.
9
at University of Sheffield on July 8, 2014
http://mbe.oxfordjournals.org/
Dow
nloaded from
Sukumaran J, Holder M T. 2010. DendroPy: A python library for phylogenetic computing. Bioin-
formatics 26:1569–1571.
Yang Y, Maruyama S, Sekimoto H, Sakayama H, Nozaki H. 2011. An extended phylogenetic
analysis reveals ancient origin of “non-green” phosphoribulokinase genes from two lineages of
“green” secondary photosynthetic eukaryotes: Euglenophyta and Chlorarachniophyta. BMC
Research Notes 4:330.
Yang Z. 2007. PAML 4: Phylogenetic analysis by maximum likelihood. Molecular Biology and
Evolution 24:1586–1591.
Yang Z, Nielsen R, Goldman N, Pedersen A M K. 2000. Codon-substitution models for heteroge-
neous selection pressure at amino acid sites. Genetics 155:431–449.
10
at University of Sheffield on July 8, 2014
http://mbe.oxfordjournals.org/
Dow
nloaded from
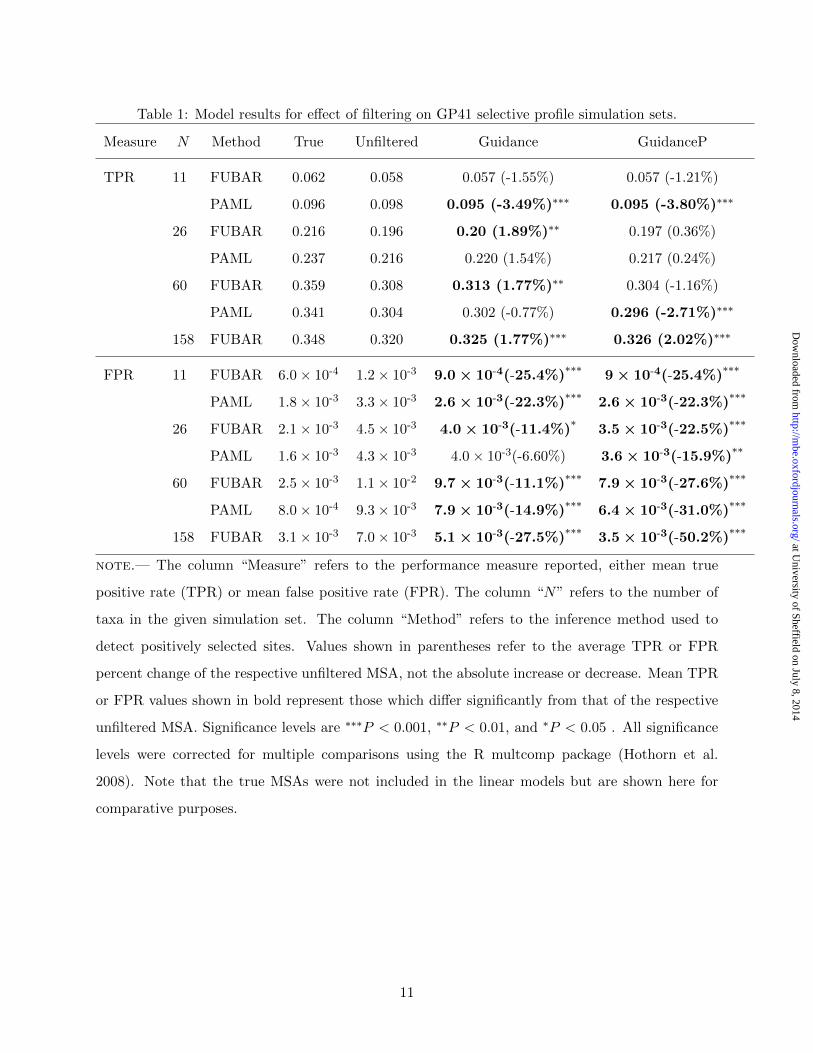
Table 1: Model results for effect of filtering on GP41 selective profile simulation sets.
Measure N Method True Unfiltered Guidance GuidanceP
TPR 11 FUBAR 0.062 0.058 0.057 (-1.55%) 0.057 (-1.21%)
PAML 0.096 0.098 0.095 (-3.49%)∗∗∗ 0.095 (-3.80%)∗∗∗
26 FUBAR 0.216 0.196 0.20 (1.89%)∗∗ 0.197 (0.36%)
PAML 0.237 0.216 0.220 (1.54%) 0.217 (0.24%)
60 FUBAR 0.359 0.308 0.313 (1.77%)∗∗ 0.304 (-1.16%)
PAML 0.341 0.304 0.302 (-0.77%) 0.296 (-2.71%)∗∗∗
158 FUBAR 0.348 0.320 0.325 (1.77%)∗∗∗ 0.326 (2.02%)∗∗∗
FPR 11 FUBAR 6.0 × 10⁻⁴ 1.2 × 10⁻³ 9.0 × 10⁻⁴(-25.4%)∗∗∗
9 × 10⁻⁴(-25.4%)∗∗∗
PAML 1.8 × 10⁻³ 3.3 × 10⁻³ 2.6 × 10⁻³(-22.3%)∗∗∗
2.6 × 10⁻³(-22.3%)∗∗∗
26 FUBAR 2.1 × 10⁻³ 4.5 × 10⁻³ 4.0 × 10⁻³(-11.4%)∗
3.5 × 10⁻³(-22.5%)∗∗∗
PAML 1.6 × 10⁻³ 4.3 × 10⁻³ 4.0 × 10⁻³(-6.60%) 3.6 × 10⁻³(-15.9%)∗∗
60 FUBAR 2.5 × 10⁻³ 1.1 × 10⁻² 9.7 × 10⁻³(-11.1%)∗∗∗
7.9 × 10⁻³(-27.6%)∗∗∗
PAML 8.0 × 10⁻⁴ 9.3 × 10⁻³ 7.9 × 10⁻³(-14.9%)∗∗∗
6.4 × 10⁻³(-31.0%)∗∗∗
158 FUBAR 3.1 × 10⁻³ 7.0 × 10⁻³ 5.1 × 10⁻³(-27.5%)∗∗∗
3.5 × 10⁻³(-50.2%)∗∗∗
note.— The column “Measure” refers to the performance measure reported, either mean true
positive rate (TPR) or mean false positive rate (FPR). The column “N” refers to the number of
taxa in the given simulation set. The column “Method” refers to the inference method used to
detect positively selected sites. Values shown in parentheses refer to the average TPR or FPR
percent change of the respective unfiltered MSA, not the absolute increase or decrease. Mean TPR
or FPR values shown in bold represent those which differ significantly from that of the respective
unfiltered MSA. Significance levels are ∗∗∗P < 0.001, ∗∗P < 0.01, and ∗P < 0.05 . All significance
levels were corrected for multiple comparisons using the R multcomp package (Hothorn et al.
2008). Note that the true MSAs were not included in the linear models but are shown here for
comparative purposes.
11
at University of Sheffield on July 8, 2014
http://mbe.oxfordjournals.org/
Dow
nloaded from
HA, FUBAR HA, PAML GP41, FUBAR GP41, PAML
Mea
n T
PR
0.00
0.05
0.10
0.15
0.20
0.25
0.30A 26−Sequence Simulation Sets
+4.04%+1.89%
HA, FUBAR HA, PAML GP41, FUBAR GP41, PAML
Mea
n T
PR
0.0
0.1
0.2
0.3
0.4
0.5
0.6B 60−Sequence Simulation Sets
−2.16%
+1.77% −2.71%
UnfilteredGuidanceGuidanceP
Figure 1: Mean TPR for and 26- and 60-sequence simulation sets. Percentages, which represent
the average percent TPR change relative to the unfiltered MSAs, are shown only for those changes
which are significant. Significance levels are the same as those given in Table 1. (A) Simulations
with 26 sequences. (B) Simulations with 60 sequences.
12
at University of Sheffield on July 8, 2014
http://mbe.oxfordjournals.org/
Dow
nloaded from
0.0 0.2 0.4 0.6 0.8 1.0
0.0
0.2
0.4
0.6
0.8
1.0
False Positive Rate
True
Pos
itive
Rat
e
A FUBAR
0.00 0.02 0.04 0.06 0.08 0.10
0.0
0.2
0.4
0.6
0.8
False Positive Rate
True
Pos
itive
Rat
e
B
0.0 0.2 0.4 0.6 0.8 1.0
0.0
0.2
0.4
0.6
0.8
1.0
False Positive Rate
True
Pos
itive
Rat
e
C PAML
0.00 0.02 0.04 0.06 0.08 0.10
0.0
0.2
0.4
0.6
0.8
False Positive Rate
True
Pos
itive
Rat
e
D
UnfilteredOriginalGap−penalization
Figure 2: ROC curves as averaged across the two 60-sequence simulation sets. Within each panel,
the top curve represents results from the HA selective profile, and the bottom curve represents
results from the GP41 selective profile. Full ROC curves are shown in the left-hand panels. Note
that, for the full PAML ROC curves, average FPRs higher than shown were not seen. The right-
hand panels highlight specifically the low FPR regions (0 − 0.1) of the ROC curves. All MSA
filtering algorithms (Guidance, BMweights, PDweights, GuidanceP, BMweightsP, and PDweightsP)
are shown in ROC curves. (A,B) ROC curves for positive-selection inference by FUBAR. (C,D)
ROC curves for positive-selection inference by PAML M8.
13
at University of Sheffield on July 8, 2014
http://mbe.oxfordjournals.org/
Dow
nloaded from