Embed Size (px)
Citation preview
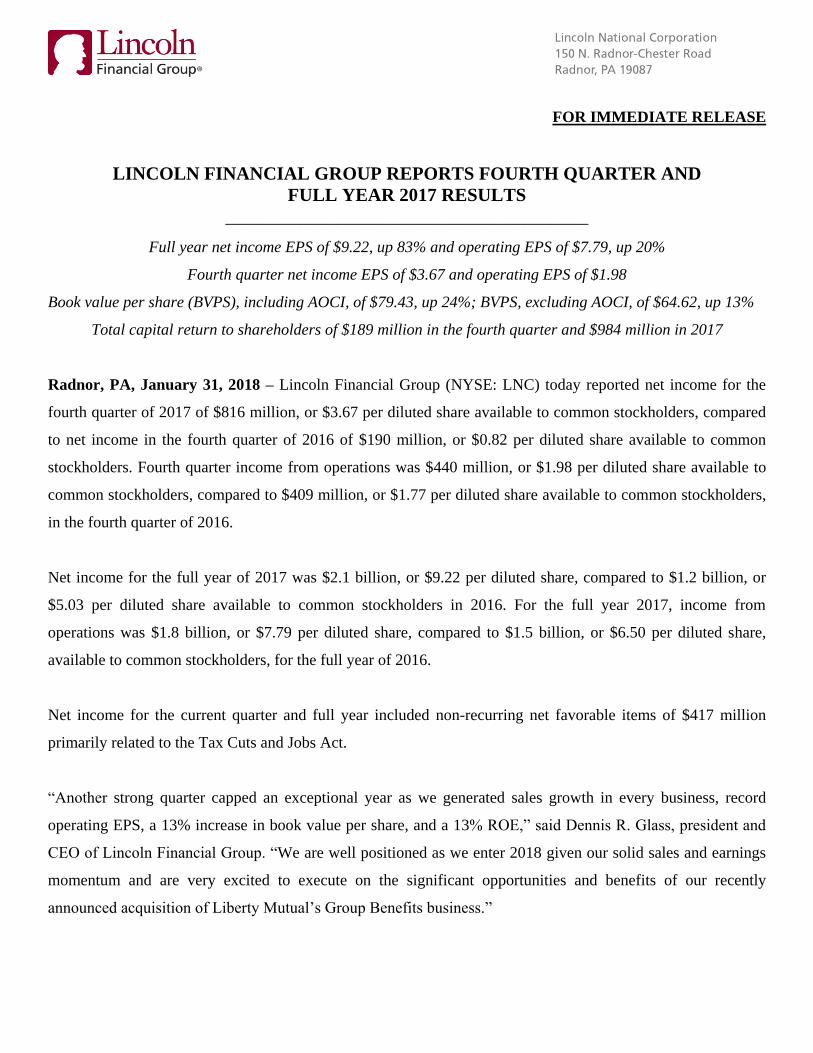
FOR IMMEDIATE RELEASE
LINCOLN FINANCIAL GROUP REPORTS FOURTH QUARTER AND
FULL YEAR 2017 RESULTS
_______________________________________
Full year net income EPS of $9.22, up 83% and operating EPS of $7.79, up 20%
Fourth quarter net income EPS of $3.67 and operating EPS of $1.98
Book value per share (BVPS), including AOCI, of $79.43, up 24%; BVPS, excluding AOCI, of $64.62, up 13%
Total capital return to shareholders of $189 million in the fourth quarter and $984 million in 2017
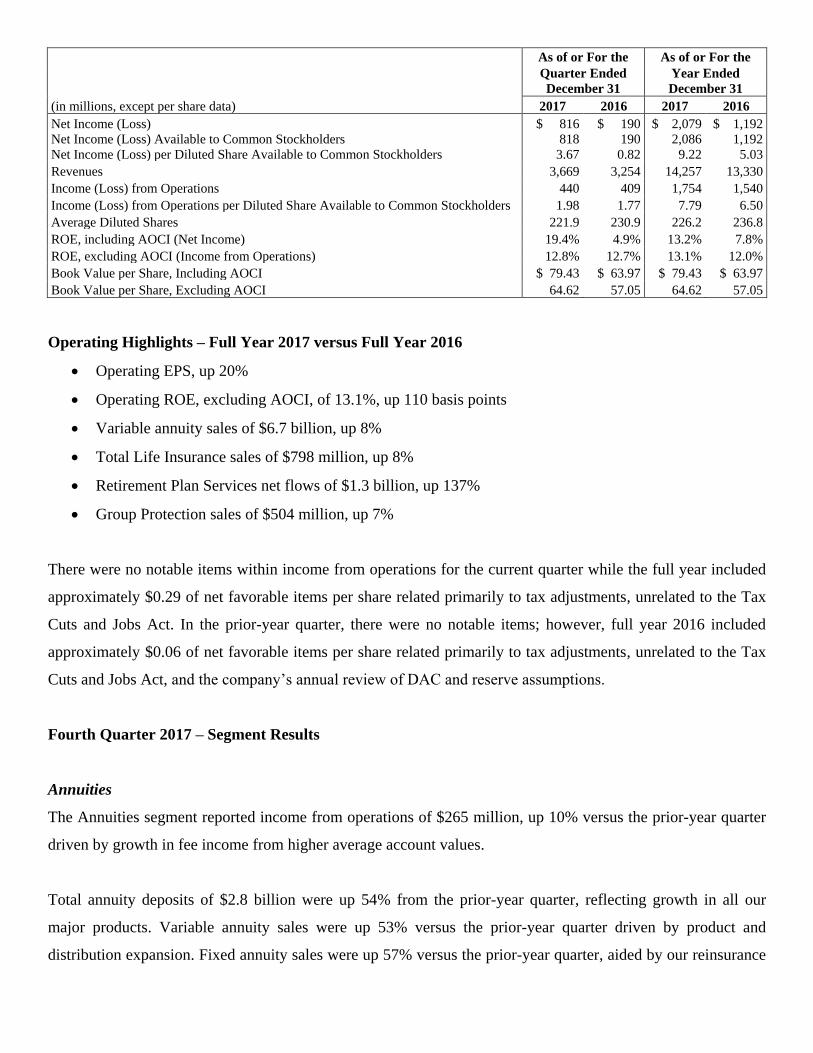
Radnor, PA, January 31, 2018 – Lincoln Financial Group (NYSE: LNC) today reported net income for the
fourth quarter of 2017 of $816 million, or $3.67 per diluted share available to common stockholders, compared
to net income in the fourth quarter of 2016 of $190 million, or $0.82 per diluted share available to common
stockholders. Fourth quarter income from operations was $440 million, or $1.98 per diluted share available to
common stockholders, compared to $409 million, or $1.77 per diluted share available to common stockholders,
in the fourth quarter of 2016.
Net income for the full year of 2017 was $2.1 billion, or $9.22 per diluted share, compared to $1.2 billion, or
$5.03 per diluted share available to common stockholders in 2016. For the full year 2017, income from
operations was $1.8 billion, or $7.79 per diluted share, compared to $1.5 billion, or $6.50 per diluted share,
available to common stockholders, for the full year of 2016.
Net income for the current quarter and full year included non-recurring net favorable items of $417 million
primarily related to the Tax Cuts and Jobs Act.
“Another strong quarter capped an exceptional year as we generated sales growth in every business, record
operating EPS, a 13% increase in book value per share, and a 13% ROE,” said Dennis R. Glass, president and
CEO of Lincoln Financial Group. “We are well positioned as we enter 2018 given our solid sales and earnings
momentum and are very excited to execute on the significant opportunities and benefits of our recently
announced acquisition of Liberty Mutual’s Group Benefits business.”
As of or For the As of or For the
Quarter Ended
December 31
Year Ended
December 31
(in millions, except per share data) 2017 2016 2017 2016
Net Income (Loss) $ 816 $ 190 $ 2,079 $ 1,192
Net Income (Loss) Available to Common Stockholders
Net Income (Loss) per Diluted Share Available to Common Stockholders
818
3.67
190
0.82
2,086
9.22
1,192
5.03
Revenues 3,669 3,254 14,257 13,330
Income (Loss) from Operations 440 409 1,754 1,540
Income (Loss) from Operations per Diluted Share Available to Common Stockholders 1.98 1.77 7.79 6.50
Average Diluted Shares 221.9 230.9 226.2 236.8
ROE, including AOCI (Net Income) 19.4% 4.9% 13.2% 7.8%
ROE, excluding AOCI (Income from Operations) 12.8% 12.7% 13.1% 12.0%
Book Value per Share, Including AOCI $ 79.43 $ 63.97 $ 79.43 $ 63.97
Book Value per Share, Excluding AOCI 64.62 57.05 64.62 57.05
Operating Highlights – Full Year 2017 versus Full Year 2016
• Operating EPS, up 20%
• Operating ROE, excluding AOCI, of 13.1%, up 110 basis points
• Variable annuity sales of $6.7 billion, up 8%
• Total Life Insurance sales of $798 million, up 8%
• Retirement Plan Services net flows of $1.3 billion, up 137%
• Group Protection sales of $504 million, up 7%
There were no notable items within income from operations for the current quarter while the full year included
approximately $0.29 of net favorable items per share related primarily to tax adjustments, unrelated to the Tax
Cuts and Jobs Act. In the prior-year quarter, there were no notable items; however, full year 2016 included
approximately $0.06 of net favorable items per share related primarily to tax adjustments, unrelated to the Tax
Cuts and Jobs Act, and the company’s annual review of DAC and reserve assumptions.
Fourth Quarter 2017 – Segment Results
Annuities
The Annuities segment reported income from operations of $265 million, up 10% versus the prior-year quarter
driven by growth in fee income from higher average account values.
Total annuity deposits of $2.8 billion were up 54% from the prior-year quarter, reflecting growth in all our
major products. Variable annuity sales were up 53% versus the prior-year quarter driven by product and
distribution expansion. Fixed annuity sales were up 57% versus the prior-year quarter, aided by our reinsurance
agreement. Net outflows improved to $414 million compared to outflows of $932 million in the prior-year
quarter. For the full year, variable annuity sales increased 8% while fixed annuity sales remained relatively flat.
Total average account values grew 9% to a record $135 billion as outflows were more than offset by favorable
equity market performance.
Retirement Plan Services
Retirement Plan Services reported income from operations of $41 million, up 21% compared to the prior-year
quarter. The increase in earnings is primarily due to growth in fee income driven by higher average account
values and expense ratio improvement.
Total deposits for the quarter of $2.4 billion were up 1% while deposits for the full year increased 12% to a
record $8.6 billion driven by a 29% increase in first-year sales and continued growth in recurring deposits.
Net flows totaled $412 million in the quarter, up 7% compared to the prior-year quarter. Positive net flows in
every quarter of 2017 resulted in $1.3 billion of annual net flows, more than double the prior year. When
combined with favorable equity market performance, average account values for the quarter increased 15% to
$66 billion.
Life Insurance
Life Insurance reported income from operations of $152 million versus $154 million in the prior-year quarter.
Both periods included favorable mortality, while the prior-year quarter had more favorable variable investment
income.
Total Life Insurance sales were $242 million, up 5% from the prior-year quarter driven by growth in Executive
Benefits, VUL, and Term. For the full year, sales increased 8% versus the prior year as MoneyGuard®, VUL,
and Term represented the largest percentage of sales.
Total Life Insurance in-force of $720 billion grew 4% over the prior-year quarter, and average account values of
$48 billion increased 7% over the prior-year quarter.
Group Protection
Group Protection income from operations was $20 million in the quarter, up 25% versus the prior-year period.
The increase in earnings was largely driven by improvement in the non-medical loss ratio. The total non-
medical loss ratio improved to 67.1% in the current quarter from 70.9% in the prior-year period. For the full
year, the total non-medical loss ratio improved 390 basis points to 66.9%, excluding the favorable impact of a
reserve refinement in the prior year.
Group Protection sales of $265 million in the fourth quarter were consistent with the prior-year quarter. Full
year sales of $504 million were up 7%, with growth across all product lines and in both employer and
employee-paid sales. Employee-paid sales were 47% of the total in 2017.
Non-medical earned premiums were $509 million in the fourth quarter, up 5% from the prior-year quarter,
driven by sales growth combined with improving persistency.
Other Operations
Other Operations reported a loss from operations of $38 million consistent with a loss of $37 million in the
prior-year quarter.
Realized Gains and Losses / Impacts to Net Income
Realized gains/losses and impacts to net income (after-tax) in the quarter included:
• A $1.3 billion benefit from the impact on our net deferred tax liability as a result of the Tax Cuts and Jobs
Act.
• A $905 million impairment of intangibles related to the Tax Cuts and Jobs Act and early adoption of GAAP
accounting changes to goodwill.
• A $23 million net loss from general account investments compared to a $10 million net loss in the prior-year
quarter.
• A $16 million variable annuity net derivative loss in the quarter compared to a $178 million net loss in the
prior-year quarter where more than half was associated with non-performance risk.
Unrealized Gains and Losses
The company reported a net unrealized gain of $7.8 billion, pre-tax, on its available-for-sale securities at
December 31, 2017. This compares to a net unrealized gain of $4.7 billion at December 31, 2016, with the year-
over-year increase primarily driven by tighter spreads.
Capital
During the quarter, the company repurchased 1.7 million shares of stock at a cost of $125 million. The quarter’s
average diluted share count of 221.9 million was down 4% from the fourth quarter of 2016, the result of
repurchasing 10.4 million shares of stock at a cost of $725 million since December 31, 2016.
Book Value
As of December 31, 2017, book value per share, including accumulated other comprehensive income (“AOCI”),
of $79.43 increased 24% from a year ago. Book value per share, excluding AOCI, of $64.62 increased 13%
from the prior-year period.
The tables attached to this release define and reconcile the non-GAAP measures income from operations,
operating return on equity (“ROE”) and book value per share, excluding AOCI to net income, ROE and book
value per share, including AOCI calculated in accordance with GAAP.
This press release may contain statements that are forward-looking, and actual results may differ materially,
especially given the current economic and capital market conditions. Please see the Forward Looking
Statements – Cautionary Language that follow for additional factors that may cause actual results to differ
materially from our current expectations.
For other financial information, please refer to the company’s fourth quarter 2017 statistical supplement
available on its website, www.lfg.com/earnings.
Lincoln Financial Group will discuss the company’s fourth quarter results with investors in a conference call
beginning at 10:00 a.m. Eastern Time on Thursday, February 1, 2018. Interested persons are invited to listen
through the internet. Please go to www.lfg.com/webcast at least fifteen minutes prior to the event to register,
download and install any necessary streaming media software. Interested persons may also listen to the call by
dialing the following numbers:
Dial: (866) 394-4575 (Domestic)
(678) 509-7536 (International)
Ask for the Lincoln National Conference Call.
Audio replay will begin by 1:00 p.m. Eastern Time on February 1, 2018, and it will remain available through
1:00 p.m. Eastern Time on February 8, 2018. To access the re-broadcast:
(855) 859-2056 (Domestic)
(404) 537-3406 (International)
Enter conference code: 7995468
A replay of the call will also be available by 1:00 p.m. Eastern Time on February 1, 2018 at
www.lfg.com/webcast.
About Lincoln Financial Group
Lincoln Financial Group provides advice and solutions that help empower people to take charge of their
financial lives with confidence and optimism. Today, more than 17 million customers trust our retirement,
insurance and wealth protection expertise to help address their lifestyle, savings and income goals, as well as to
guard against long-term care expenses. Headquartered in Radnor, Pennsylvania, Lincoln Financial Group is the
marketing name for Lincoln National Corporation (NYSE:LNC) and its affiliates. The company had $253
billion in assets under management as of December 31, 2017. Lincoln Financial Group is a committed corporate
citizen and was named one of the Forbes Best Employers for 2017, is a member of the Dow Jones Sustainability
Index North America, and received a perfect score of 100 percent on the 2018 Corporate Equality Index. Learn
more at: www.LincolnFinancial.com. Follow us on Facebook, Twitter, LinkedIn, and Instagram. Sign up for
email alerts at http://newsroom.lfg.com.
Contacts: Chris Giovanni Scott Sloat
(484) 583-1793 (484) 583-1625
Investor Relations Media Relations
Explanatory Notes on Use of Non-GAAP Measures
Management believes that income from operations, operating return on equity and operating revenues better explain the results of the
company’s ongoing businesses in a manner that allows for a better understanding of the underlying trends in the company’s current
business because the excluded items are unpredictable and not necessarily indicative of current operating fundamentals or future
performance of the business segments, and, in most instances, decisions regarding these items do not necessarily relate to the
operations of the individual segments. Management also believes that using book value excluding accumulated other comprehensive
income (AOCI) enables investors to analyze the amount of our net worth that is primarily attributable to our business operations. Book
value per share excluding AOCI is useful to investors because it eliminates the effect of items that can fluctuate significantly from
period to period, primarily based on changes in interest rates.
For the historical periods, reconciliations of non-GAAP measures used in this press release to the most directly comparable GAAP
measure may be included in this Appendix to the press release and/or are included in the Statistical Reports for the corresponding
periods contained in the Earnings section of the Investor Relations page on our website: www.lfg.com/investor.
Definitions of Non-GAAP Measures Used in this Press Release
Income (loss) from operations, operating revenues and operating return on equity (including and excluding average goodwill within
average equity), excluding AOCI, using annualized income (loss) from operations are financial measures we use to evaluate and
assess our results. Income (loss) from operations, operating revenues and operating return on equity (“ROE”), as used in the earnings
release, are non-GAAP financial measures and do not replace GAAP revenues, net income (loss) and ROE, the most directly
comparable GAAP measures.
Income (Loss) from Operations
We exclude the after-tax effects of the following items from GAAP net income (loss) to arrive at income (loss) from operations:
• Realized gains and losses associated with the following ("excluded realized gain (loss)"):
o Sale or disposal of securities;
o Impairments of securities;
o Change in the fair value of derivative investments, embedded derivatives within certain reinsurance arrangements and
our trading securities;
o Change in the fair value of the derivatives we own to hedge our guaranteed death benefit ("GDB") riders within our
variable annuities, which is referred to as "GDB derivatives results";
o Change in the fair value of the embedded derivatives of our guaranteed living benefit (“GLB”) riders within our
variable annuities accounted for under the Derivatives and Hedging and the Fair Value Measurements and
Disclosures Topics of the Financial Accounting Standards Board (“FASB”) Accounting Standards Codification
(“ASC”) (“embedded derivative reserves”), net of the change in the fair value of the derivatives we own to hedge the
changes in the embedded derivative reserves, the net of which is referred to as “GLB net derivative results”;
o Changes in the fair value of the embedded derivative liabilities related to index call options we may purchase in the
future to hedge contract holder index allocations applicable to future reset periods for our indexed annuity products
accounted for under the Derivatives and Hedging and the Fair Value Measurements and Disclosures Topics of the
FASB ASC (“indexed annuity forward-starting option”);
• Change in reserves accounted for under the Financial Services - Insurance - Claim Costs and Liabilities for Future Policy
Benefits Subtopic of the FASB ASC resulting from benefit ratio unlocking on our GDB and GLB riders ("benefit ratio
unlocking");
• Income (loss) from reserve changes (net of related amortization) on business sold through reinsurance;
• Gain (loss) on early extinguishment of debt;
• Losses from the impairment of intangible assets;
• Income (loss) from discontinued operations;
• Acquisition and integration costs related to mergers and acquisitions; and
• Income (loss) from the initial adoption of new accounting standards, regulations and policy changes including the net impact
from the Tax Cuts and Jobs Act.
Operating Revenues
Operating revenues represent GAAP revenues excluding the pre-tax effects of the following items, as applicable:
• Excluded realized gain (loss);
• Amortization of deferred front-end loads (“DFEL”) arising from changes in GDB and GLB benefit ratio unlocking;
• Amortization of deferred gains arising from the reserve charges on business sold through reinsurance;
• Revenue adjustments from the initial adoption of new accounting standards.
Operating Return on Equity
Return on equity measures how efficiently we generate profits from the resources provided by our net assets.
• It is calculated by dividing annualized income (loss) from operations by average equity, excluding accumulated other
comprehensive income (loss) ("AOCI").
• Management evaluates return on equity by both including and excluding average goodwill within average equity.
Definition of Notable Items
Income (loss) from operations, excluding notable items is a non-GAAP measure that excludes items which, in management’s view, do
not reflect the company’s normal, ongoing operations.
• We believe highlighting notable items included in income (loss) from operations enables investors to better understand the
fundamental trends in its results of operations and financial condition.
Book Value Per Share Excluding AOCI
Book value per share excluding AOCI is calculated based upon a non-GAAP financial measure.
• It is calculated by dividing (a) stockholders' equity excluding AOCI by (b) common shares outstanding.
• We provide book value per share excluding AOCI to enable investors to analyze the amount of our net worth that is primarily
attributable to our business operations.
• Management believes book value per share excluding AOCI is useful to investors because it eliminates the effect of items
that can fluctuate significantly from period to period, primarily based on changes in interest rates.
• Book value per share is the most directly comparable GAAP measure.
Special Note
Sales
Sales as reported consist of the following:
• MoneyGuard® – 15% of total expected premium deposits;
• Universal life (UL), indexed universal life (IUL), variable universal life (VUL) – first-year commissionable premiums plus
5% of excess premiums received;
• Executive Benefits – single premium bank-owned UL and VUL, 15% of single premium deposits, and corporate-owned UL
and VUL, first-year commissionable premiums plus 5% of excess premium received;
• Term – 100% of annualized first-year premiums;
• Annuities – deposits from new and existing customers; and
• Group Protection – annualized first-year premiums from new policies.
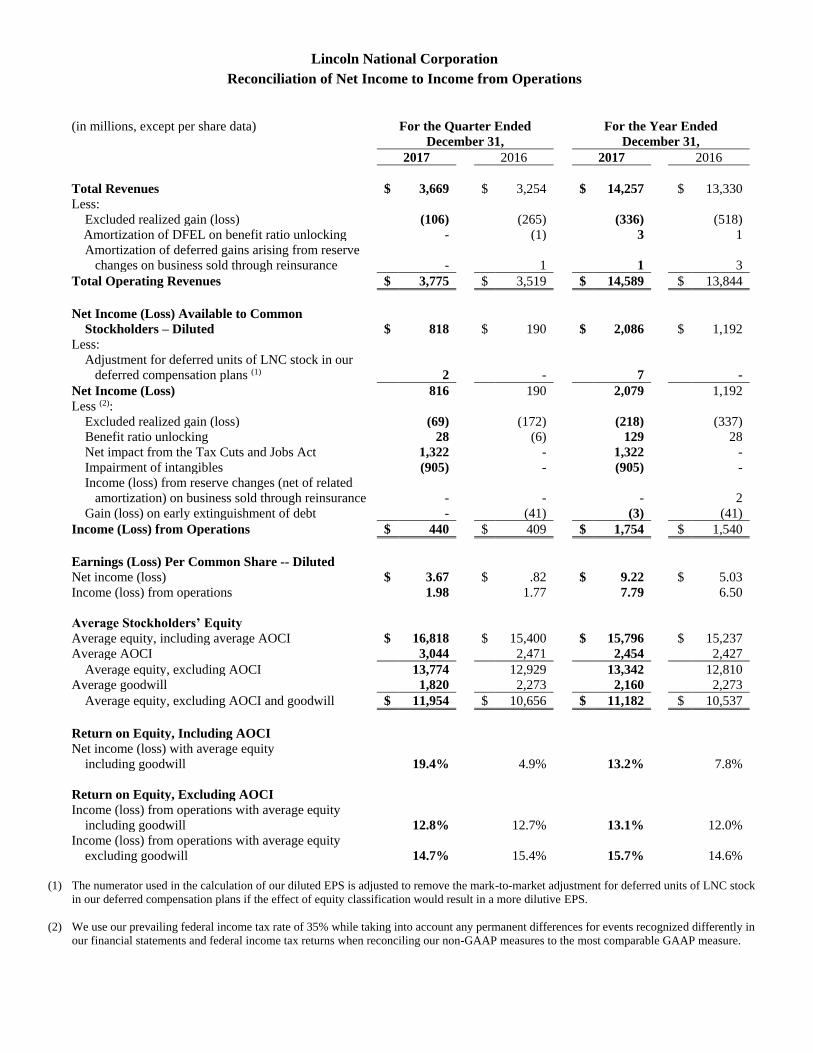
Lincoln National Corporation
Reconciliation of Net Income to Income from Operations
(in millions, except per share data) For the Quarter Ended For the Year Ended
December 31, December 31,
2017 2016 2017 2016
Total Revenues $ 3,669 $ 3,254 $ 14,257 $ 13,330
Less:
Excluded realized gain (loss) (106) (265) (336) (518)
Amortization of DFEL on benefit ratio unlocking - (1) 3 1
Amortization of deferred gains arising from reserve
changes on business sold through reinsurance
-
1
1
3
Total Operating Revenues $ 3,775 $ 3,519 $ 14,589 $ 13,844
Net Income (Loss) Available to Common
Stockholders – Diluted
$
818
$
190
$
2,086
$
1,192
Less:
Adjustment for deferred units of LNC stock in our
deferred compensation plans (1)
2
-
7
-
Net Income (Loss) 816 190 2,079 1,192
Less (2):
Excluded realized gain (loss) (69) (172) (218) (337)
Benefit ratio unlocking 28 (6) 129 28
Net impact from the Tax Cuts and Jobs Act 1,322 - 1,322 -
Impairment of intangibles (905) - (905) -
Income (loss) from reserve changes (net of related
amortization) on business sold through reinsurance
-
-
-
2
Gain (loss) on early extinguishment of debt - (41) (3) (41)
Income (Loss) from Operations $ 440 $ 409 $ 1,754 $ 1,540
Earnings (Loss) Per Common Share -- Diluted
Net income (loss) $ 3.67 $ .82 $ 9.22 $ 5.03
Income (loss) from operations 1.98 1.77 7.79 6.50
Average Stockholders’ Equity
Average equity, including average AOCI $ 16,818 $ 15,400 $ 15,796 $ 15,237
Average AOCI 3,044 2,471 2,454 2,427
Average equity, excluding AOCI 13,774 12,929 13,342 12,810
Average goodwill 1,820 2,273 2,160 2,273
Average equity, excluding AOCI and goodwill $ 11,954 $ 10,656 $ 11,182 $ 10,537
Return on Equity, Including AOCI
Net income (loss) with average equity
including goodwill
19.4%
4.9%
13.2%
7.8%
Return on Equity, Excluding AOCI
Income (loss) from operations with average equity
including goodwill
12.8%
12.7%
13.1%
12.0%
Income (loss) from operations with average equity
excluding goodwill
14.7%
15.4%
15.7%
14.6%
(1) The numerator used in the calculation of our diluted EPS is adjusted to remove the mark-to-market adjustment for deferred units of LNC stock
in our deferred compensation plans if the effect of equity classification would result in a more dilutive EPS.
(2) We use our prevailing federal income tax rate of 35% while taking into account any permanent differences for events recognized differently in
our financial statements and federal income tax returns when reconciling our non-GAAP measures to the most comparable GAAP measure.
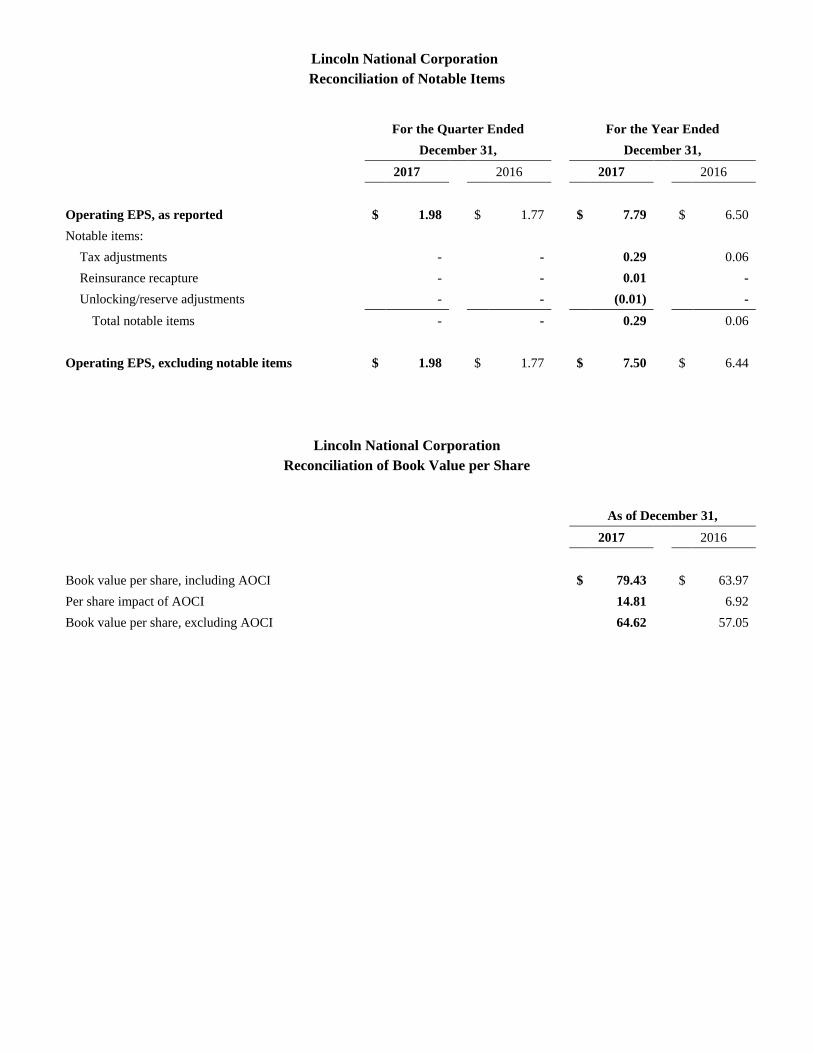
Lincoln National Corporation
Reconciliation of Notable Items
For the Quarter Ended For the Year Ended
December 31, December 31,
2017 2016 2017 2016
Operating EPS, as reported $ 1.98 $ 1.77 $ 7.79 $ 6.50
Notable items:
Tax adjustments - - 0.29 0.06
Reinsurance recapture - - 0.01 -
Unlocking/reserve adjustments - - (0.01) -
Total notable items - - 0.29 0.06
Operating EPS, excluding notable items $ 1.98 $ 1.77 $ 7.50 $ 6.44
Lincoln National Corporation
Reconciliation of Book Value per Share
As of December 31,
2017 2016
Book value per share, including AOCI $ 79.43 $ 63.97
Per share impact of AOCI 14.81 6.92
Book value per share, excluding AOCI 64.62 57.05
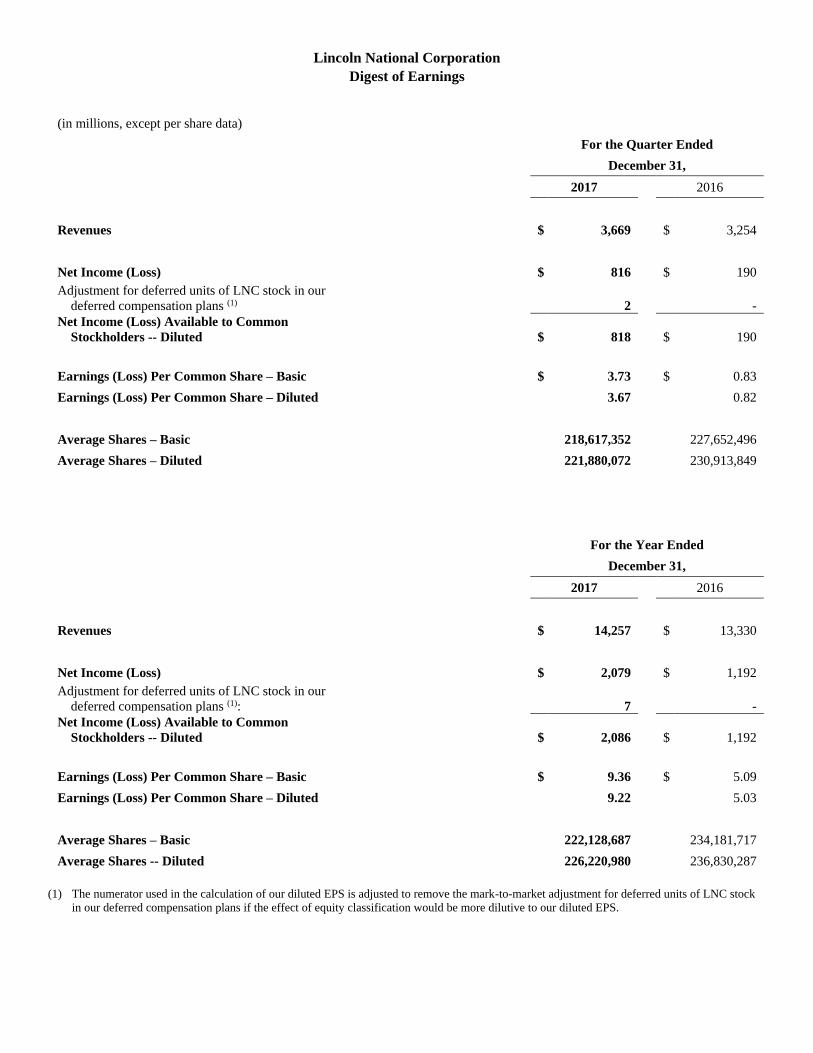
Lincoln National Corporation
Digest of Earnings
(in millions, except per share data)
For the Quarter Ended
December 31,
2017 2016
Revenues $ 3,669 $ 3,254
Net Income (Loss) $ 816 $ 190
Adjustment for deferred units of LNC stock in our
deferred compensation plans (1)
2
-
Net Income (Loss) Available to Common
Stockholders -- Diluted
$
818
$
190
Earnings (Loss) Per Common Share – Basic $ 3.73 $ 0.83
Earnings (Loss) Per Common Share – Diluted 3.67 0.82
Average Shares – Basic 218,617,352 227,652,496
Average Shares – Diluted 221,880,072 230,913,849
For the Year Ended
December 31,
2017 2016
Revenues $ 14,257 $ 13,330
Net Income (Loss) $ 2,079 $ 1,192
Adjustment for deferred units of LNC stock in our
deferred compensation plans (1):
7
-
Net Income (Loss) Available to Common
Stockholders -- Diluted
$
2,086
$
1,192
Earnings (Loss) Per Common Share – Basic $ 9.36 $ 5.09
Earnings (Loss) Per Common Share – Diluted 9.22 5.03
Average Shares – Basic 222,128,687 234,181,717
Average Shares -- Diluted 226,220,980 236,830,287
(1) The numerator used in the calculation of our diluted EPS is adjusted to remove the mark-to-market adjustment for deferred units of LNC stock
in our deferred compensation plans if the effect of equity classification would be more dilutive to our diluted EPS.
Forward Looking Statements — Cautionary Language
Certain statements made in this press release and in other written or oral statements made by Lincoln or on Lincoln's behalf are "forward-looking statements" within the
meaning of the Private Securities Litigation Reform Act of 1995 (“PSLRA”). A forward-looking statement is a statement that is not a historical fact and, without
limitation, includes any statement that may predict, forecast, indicate or imply future results, performance or achievements, and may contain words like: "believe,"
"anticipate," "expect," "estimate," "project," "will," "shall" and other words or phrases with similar meaning in connection with a discussion of future operating or
financial performance. In particular, these include statements relating to future actions, trends in Lincoln's businesses, prospective services or products, future
performance or financial results, and the outcome of contingencies, such as legal proceedings. Lincoln claims the protection afforded by the safe harbor for forward-
looking statements provided by the PSLRA.
Forward-looking statements involve risks and uncertainties that may cause actual results to differ materially from the results contained in the forward-looking
statements. Risks and uncertainties that may cause actual results to vary materially, some of which are described within the forward-looking statements, include, among
others:
• Deterioration in general economic and business conditions that may affect account values, investment results, guaranteed benefit liabilities, premium levels,
claims experience and the level of pension benefit costs, funding and investment results;
• Adverse global capital and credit market conditions could affect our ability to raise capital, if necessary, and may cause us to realize impairments on
investments and certain intangible assets, including goodwill and the valuation allowance against deferred tax assets, which may reduce future earnings
and/or affect our financial condition and ability to raise additional capital or refinance existing debt as it matures;
• Because of our holding company structure, the inability of our subsidiaries to pay dividends to the holding company in sufficient amounts could harm the
holding company’s ability to meet its obligations;
• Legislative, regulatory or tax changes, both domestic and foreign, that affect: the cost of, or demand for, our subsidiaries' products; the required amount of
reserves and/or surplus; our ability to conduct business and our captive reinsurance arrangements, as well as restrictions on revenue sharing and 12b-1
payments; the impact of recently enacted U.S. Federal tax reform legislation on our business, earnings and capital; and the effect of the Department of
Labor’s (“DOL”) regulation defining fiduciary;
• Actions taken by reinsurers to raise rates on in-force business;
• Declines in or sustained low interest rates causing a reduction in investment income, the interest margins of our businesses, estimated gross profits and
demand for our products;
• Rapidly increasing interest rates causing contract holders to surrender life insurance and annuity policies, thereby causing realized investment losses, and
reduced hedge performance related to variable annuities;
• Uncertainty about the effect of continuing promulgation and implementation of rules and regulations under the Dodd-Frank Wall Street Reform and
Consumer Protection Act on us, the economy and the financial services sector in particular;
• The initiation of legal or regulatory proceedings against us, and the outcome of any legal or regulatory proceedings, such as: adverse actions related to
present or past business practices common in businesses in which we compete; adverse decisions in significant actions including, but not limited to, actions
brought by federal and state authorities and class action cases; new decisions that result in changes in law; and unexpected trial court rulings;
• A decline in the equity markets causing a reduction in the sales of our subsidiaries' products; a reduction of asset-based fees that our subsidiaries charge on
various investment and insurance products; an acceleration of the net amortization of deferred acquisition costs ("DAC"), value of business acquired
("VOBA"), deferred sales inducements ("DSI") and deferred front-end loads ("DFEL"); and an increase in liabilities related to guaranteed benefit features of
our subsidiaries' variable annuity products;
• Ineffectiveness of our risk management policies and procedures, including various hedging strategies used to offset the effect of changes in the value of
liabilities due to changes in the level and volatility of the equity markets and interest rates;
• A deviation in actual experience regarding future persistency, mortality, morbidity, interest rates or equity market returns from the assumptions used in
pricing our subsidiaries' products, in establishing related insurance reserves and in the net amortization of DAC, VOBA, DSI and DFEL, which may reduce
future earnings;
• Changes in accounting principles generally accepted in the United States ("GAAP"), that may result in unanticipated changes to our net income;
• Lowering of one or more of our debt ratings issued by nationally recognized statistical rating organizations and the adverse effect such action may have on
our ability to raise capital and on our liquidity and financial condition;
• Lowering of one or more of the insurer financial strength ratings of our insurance subsidiaries and the adverse effect such action may have on the premium
writings, policy retention, profitability of our insurance subsidiaries and liquidity;
• Significant credit, accounting, fraud, corporate governance or other issues that may adversely affect the value of certain investments in our portfolios, as well
as counterparties to which we are exposed to credit risk requiring that we realize losses on investments;
• Inability to protect our intellectual property rights or claims of infringement of the intellectual property rights of others;
• Interruption in telecommunication, information technology or other operational systems, or failure to safeguard the confidentiality or privacy of sensitive
data on such systems from cyberattacks or other breaches of our data security systems;
• The effect of acquisitions and divestitures, restructurings, product withdrawals and other unusual items, including the successful implementation of
integration strategies or the achievement of anticipated synergies and operational efficiencies related to an acquisition;
• The adequacy and collectability of reinsurance that we have purchased;
• Acts of terrorism, a pandemic, war or other man-made and natural catastrophes that may adversely affect our businesses and the cost and availability of
reinsurance;
• Competitive conditions, including pricing pressures, new product offerings and the emergence of new competitors, that may affect the level of premiums and
fees that our subsidiaries can charge for their products;
• The unknown effect on our subsidiaries' businesses resulting from evolving market preferences and the changing demographics of our client base; and
• The unanticipated loss of key management, financial planners or wholesalers.
The risks included here are not exhaustive. Our annual report on Form 10-K, quarterly reports on Form 10-Q, current reports on Form 8-K and other documents filed
with the Securities and Exchange Commission (“SEC”) include additional factors that could affect our businesses and financial performance. Moreover, we operate in a
rapidly changing and competitive environment. New risk factors emerge from time to time, and it is not possible for management to predict all such risk factors.
Further, it is not possible to assess the effect of all risk factors on our businesses or the extent to which any factor, or combination of factors, may cause actual results to
differ materially from those contained in any forward-looking statements. Given these risks and uncertainties, investors should not place undue reliance on forward-
looking statements as a prediction of actual results. In addition, Lincoln disclaims any obligation to update any forward-looking statements to reflect events or
circumstances that occur after the date of this press release.
The reporting of Risk Based Capital (“RBC”) measures is not intended for the purpose of ranking any insurance company or for use in connection with any marketing,
advertising or promotional activities.