Embed Size (px)
Citation preview
Linking intellectual capital andintellectual property to company
performanceLaury Bollen, Philip Vergauwen and Stephanie Schnieders
Accounting and Information Management Department,Faculty of Economics and Business Administration, Universiteit Maastricht,
Maastricht, The Netherlands
Abstract
Purpose – The purpose of this paper is to link empirically the value of intellectual capital andintellectual property to firm performance.
Design/methodology/approach – Survey data from managers in the (German) pharmaceuticalindustry is used to conduct a regression analysis focusing on the correlation between human,structural and relational capital, intellectual property and firm performance.
Findings – The results of the study show that including intellectual property in models linkingintellectual capital to firm performance enhances the statistical validity of such models and theirrelevance for management.
Practical implications – Intellectual capital is an important source of an organization’s economicwealth and is therefore to be taken into serious consideration when formulating the firm’s strategy.This strategy formulation process can be enhanced by fully integrating intellectual property andintellectual capital into management models, as shown in this paper.
Originality/value – This empirical paper builds on and extends the Bontis research on therelationship between intellectual capital and firm performance. Contrary to Bontis the authors includeintellectual property into the intellectual capital framework and focus on the role of intellectualproperty in the relationship between intellectual capital and firm performance.
Keywords Intellectual capital, Intellectual property, Company performance
Paper type Research paper
1. IntroductionIt is often argued that companies in today’s new economy do not primarily invest infixed assets, but in intangibles, since these are today’s value drivers (Daum, 2001).Among these intangible assets intellectual capital (IC) plays an important role. Due tothe investments in IC, its volume necessarily increases and the measurement of ICbecomes an important topic given the direct and indirect advantages that can begained from it. Such advantages may include the added value of the knowledge that isprocessed, the learning process included in the measurement of IC (Roos and Roos,1997), its strategic power (Bontis, 2001), the optimal exploitation of limited resourcesand its usage as a motivational factor (Edvinsson, 1997). Exploiting these advantagesof IC measurement purportedly give companies an edge in a tight competition on themarket, which should be reflected in enhanced firm performance.
The measurement of IC is both difficult and expensive due to information collection,processing and dissemination costs (Revsine et al., 1999). Although a large number ofIC measurement methods have been developed, including market capitalizationmethods (e.g. Tobin’s Q), return-on-assets methods (e.g. economic value added or
The Emerald Research Register for this journal is available at The current issue and full text archive of this journal is available at
www.emeraldinsight.com/researchregister www.emeraldinsight.com/0025-1747.htm
LinkingIC and IP
1161
Management DecisionVol. 43 No. 9, 2005
pp. 1161-1185q Emerald Group Publishing Limited
0025-1747DOI 10.1108/00251740510626254
EVAq), direct methods (e.g. technology broker method) and scorecard methods (e.g.intangible asset monitor), few of these methods provide opportunities for empiricallylinking the value of IC to firm performance (see, e.g. Bontis (2001) for an elaboratediscussion).
Bontis (1998) provides a conceptual basis for IC measurement and for theinterconnecting IC and firm performance. Bontis (1998) explicitly excludes intellectualproperty (IP) when defining IC. As a result, when linking IC to firm performance, therole of IP is not considered in any of the models developed. In this paper we introduceIP as part of the relationship between IC and company performance for three reasons.First, IP can be regarded as the more “tangible” part of IC, as IP consists of patents,copyrights, trademarks, etc . . . that can be more easily valued than the more intangibleIC assets. Indeed, studies such as, e.g. Smith and Hansen (2002), but also “professionalreports” by, e.g. PriceWaterhouseCoopers and Morgan Stanley show that companiesuse generic and widely recognized and accepted IP valuation methods(PriceWaterhouseCoopers and Morgan Stanley, 2003, 2004). Smith and Hansen(2002) further argue that these valuation methods and performance measurementsoften are used rather independent of the firm’s strategy. A second reason for includingIP into our analysis therefore is to explicate the link between IP on the one side andhuman, structural and relational capital on the other side. In doing so, IP strategiesbecome more visibly embedded in the companies overall strategic decision-makingprocess. In other words, IP and IC are to be associated with the most intangibledimensions of the whole organization, such that the implications of the maxim “whatgets measured, gets managed” are fully captured (Roslender and Fincham, 2001;Nerdrum and Erikson, 2001). A third reason for including IP is that IP from aconceptual and a managerial point of view is a relevant part of a company’s IC. Smithand Hansen (2002) argue that IP is strategic to the extent that it is part of a company’schosen capabilities, i.e. to the extent that it is part of either the know-what or know-howaspect of core capability. In this sense, strategic IP management is the way to leverageintellect and to lead the company to increased overall performance (Quinn et al., 1996)and, therefore, is intrinsically linked with IC. Companies, however, often treat all oftheir IP and IC alike, failing to distinguish the strategically crucial intangibles fromother assets and failing to understand the links between these strategic intangibles andits (future) IP (see also PriceWaterhouseCopers and Morgan Stanley, 2004, p. 35.)
The remainder of this article is organized as follows. Sections 2 and 3 briefly focuson the theoretical foundations IC in this context and discuss the role of IP and elaborateon this paper’s main hypothesis. Section 4 presents the research method whereassections 5 and 6 outline and discuss the results of the survey research. Section 7concludes the article with a discussion of the results and some general conclusions andan agenda for further research.
2. Theoretical foundations of IC measurementUntil the 1980s, and in line with neo-classical thinking, business economics focused onthe competitive advantage of firms given a certain environment. As resources wereassumed to be evenly distributed within industries and freely accessible by firms, theresources inside the firm only played an inferior role (Roos and Roos, 1997). During the1980s the resource-based view of the firm gained importance: managers no longerreally “believed” in perfect competition, and became more convinced that firms need
MD43,9
1162
access to differentiated and – if possible – unique resources, capabilities, andendowments in order to create and sustain a competitive advantage. As resources wereassumed to be sticky, it followed that companies could not that easily acquire newones. Consequently, companies were assumed to optimize the exploitation of existingresources in order to gain a strategic advantage (see also Llewlyn, 2003; Canibano andSanchez, 2003). Questions such as “Which are my most important intangibles? Whichearn most money and which keep most of my competitors at bay?” increasinglybecame priority questions triggering attention at boardroom meetings(PriceWaterhouseCopers and Morgan Stanley, 2004).
Next to the resource-based view, the (re)organization of companies became a majorissue, specifically the transformation from vertical organizational structures to globalmatrix structures: significant investments in structural capital were made, in order toenable companies to optimize their resources, to consolidate business processes, tosupply major customers worldwide and to exchange knowledge and best practices(Daum, 2001).
During the time when the resource-based view of companies gained awareness andcompanies were subsequently restructured, Sveiby published The Know-howCompany in which he describes how non-traditional knowledge companies shouldmanage their knowledge (see Sullivan, 2000). Simultaneously, Skandia AFS, followedby a large number of Swedish companies introduces such measures and in 1993 theSwedish Council of Service Industries adopted it as their standard recommendation forannual reports (Sullivan, 2000).
Edvinsson combined Sveiby’s work with Kaplan and Norton’s Balance Score Card(Sveiby, 2001), relabeled the term “intangible assets” as “intellectual capital” andpublished Skandia’s first annual report supplement in 1995 with the title VisualizingIntellectual capital in Skandia (see Sullivan, 2000; Sveiby, 2001). Since then, othercompanies, such as Dow-Chemicals, CIBC, Hewlett-Packard and Canon, have followedthe example of Skandia (Roos and Roos, 1997), as they became aware of the importanceof, e.g. leadership and human capital developments as antecedents of increasing thepotential of organizational culture to serve as a major source of sustained competitiveadvantage (Bontis and Fitz-enz, 2002; Hall, 1992).
Finally the introduction of the phenomenon “New Economy” played a major role inthe development of IC (Daum, 2001). Companies in the New Economy intensively useinnovative technologies in the form of computers, telecommunications, and theinternet, to produce, sell and distribute goods and services. At the same time, a shiftfrom global matrix-structured companies to e-business-network-structures is takinglace. With respect to this issue, three major publications were made in the same year,being Intellectual Capital by Stewart (1997), a paper by Edvinsson and Malone (1997)with the same title and The New Organizational Wealth by Sveiby (1997). The essenceof these three publications is that a shift from the investment in fixed assets tointangibles has occurred. As a result, next to financial capital, intangibles have becomeimportant value drivers. Proof for the growing importance of the role of IC in today’seconomy is the fact that several interest groups are currently working on the topic ofIC, considering its different aspects and developing IC statements for companies,among them the German Schmalenbach-Gesellschaft fur Betriebswirtschaft eV (2003).
The growing interest in IC has revealed a certain level of disagreement on thedefinition on IC and, more specifically, on the components of IC. In this context, the
LinkingIC and IP
1163
relationship between IC and IP is particularly complex as some authors explicitlyexclude IP in their discussions on IC (e.g. Bontis, 1998), whereas others tend to a moreintegrative view favoring a more cohesive approach to IC and IP (e.g. Smith andHansen, 2002; Lynn, 1998). Given the focus of our research, the opposing views on thelink between IC and IP will be discussed in the remainder of this section.
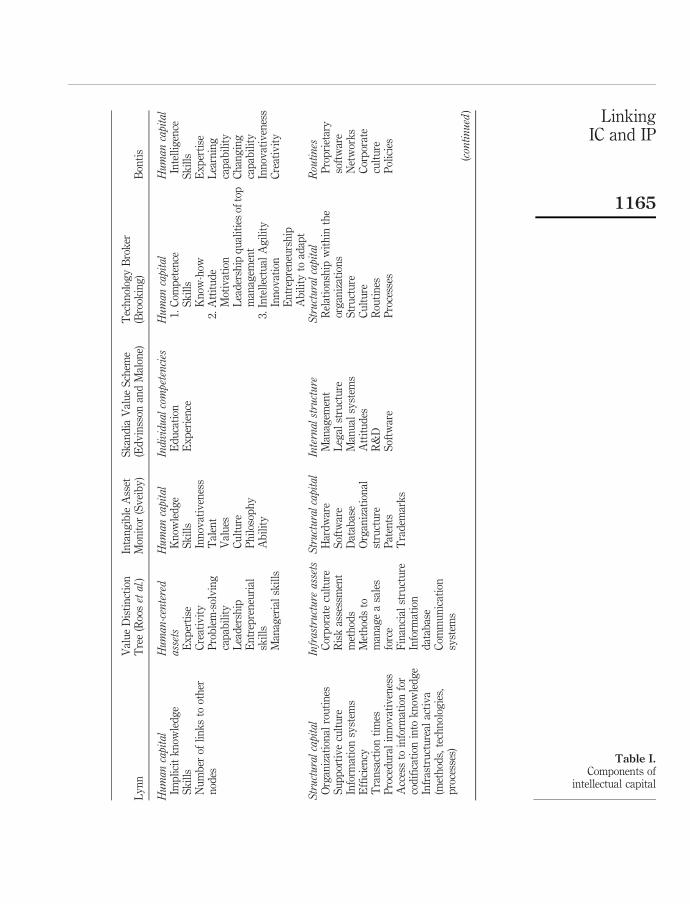
Bontis et al. (1999) summarize the definitions of IC by Bontis (1998), Edvinsson andMalone (1997), and Roos and Roos (1997) and concludes that IC is the collection ofintangible resources and their flows, where intangible resources contribute to the valuecreating process of the company and are under the control of the company. Since thevalue creating process differs among companies and therefore also the resourcesneeded for production, it follows that IC is context-specific and thus differs amongcompanies. Lynn (1998) defines IC as the wealth of ideas and the ability to innovate,both being factors that determine the future of the organization. These definitionsprovide a foundation for understanding IC. However, they do not offer practicalclassification schemes of IC, which are necessary to identify, classify and measureindividual assets. The following economists and practitioners have defined suchclusters: Brooking (1996), Edvinsson and Malone (1997), Sveiby (1997), Bontis (1998),Roos and Roos (1997) and Lynn (1998). For an overview, see Table I.
Bontis (1998) uses a definition of IC that only partly overlaps with that of Lynn(1998). Bontis (1998) divides IC into human, structural and customer capital.
Human capital (HC) comprises the organization’s members’ individual tacitknowledge. These are skills which cannot be articulated that are necessary to performtheir functions, which exist inside the employees. The connection of the nodes implies aflow of information from one person to another. Bontis (1998) defines HC as individualtacit knowledge. Lynn (1998) identifies HC as the raw intelligence, skills and expertiseof the human actors in the organizations. Given the fact that HC is linked to individualwithin an organization, HC cannot be owned by the company (Edvinsson and Malone,1997).
Structural capital (SC) comprises mechanisms and structures, which help supportemployees. In fact, they are the organizational routines and turn individual humanassets into group assets. Edvinsson and Malone (1997) define SC as everything that“supports employees’ productivity” or “everything that gets left behind at the officewhen employees go home”. In contrast to HC, SC can be owned by the company andtherefore can be traded. Bontis (1998) states that SC comprises mechanisms andstructures of the organization that support employees in their performance, whence,also overall business performance. Lynn (1998), who uses the term routines instead ofSC, mentions that SC consists of “systems” that program intellectual efforts in order toprovide more routine means of replicating them.
Customer capital (CC) mainly comprises knowledge of marketing channels andcustomer relationships. Bontis (1998) states that knowledge of marketing channels andcustomer relationships play a major role. In addition, other aspects relating to suppliersand competitors contribute to relationship capital.
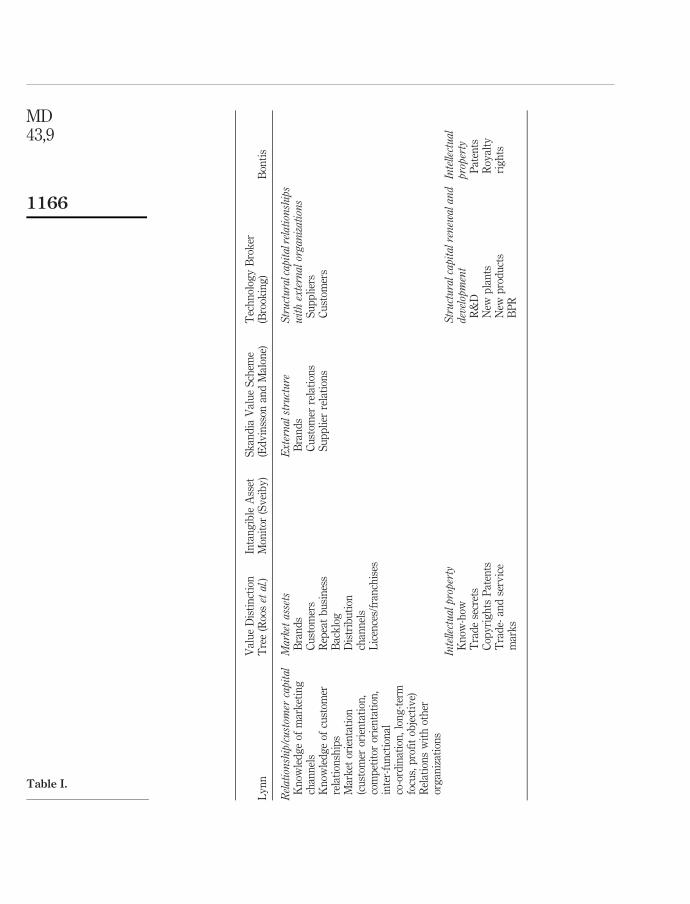
CC is not part of the structure that is used by Lynn (1998). In his view, the final partof IC is IP, which is the most tangible element of IC and the one most widely embracedby management and shareholders, since methods for its measurement are included inthe accounting rules. Lynn (1998) defines IP as items that have been sold. Brooking(1996) states that IP are “legal mechanisms for protecting corporate assets and
MD43,9
1164
Ly
nn
Val
ue
Dis
tin
ctio
nT
ree
(Roo
set
al.)
Inta
ng
ible
Ass
etM
onit
or(S
vei
by
)S
kan
dia
Val
ue
Sch
eme
(Ed
vin
sson
and
Mal
one)
Tec
hn
olog
yB
rok
er(B
rook
ing
)B
onti
s
Humancapital
Imp
lici
tk
now
led
ge
Sk
ills
Nu
mb
erof
lin
ks
toot
her
nod
es
Human-centered
assets
Ex
per
tise
Cre
ativ
ity
Pro
ble
m-s
olv
ing
cap
abil
ity
Lea
der
ship
En
trep
ren
euri
alsk
ills
Man
ager
ial
skil
ls
Humancapital
Kn
owle
dg
eS
kil
lsIn
nov
ativ
enes
sT
alen
tV
alu
esC
ult
ure
Ph
ilos
oph
yA
bil
ity
Individualcompetencies
Ed
uca
tion
Ex
per
ien
ce
Humancapital
1.C
omp
eten
ceS
kil
lsK
now
-how
2.A
ttit
ud
eM
otiv
atio
nL
ead
ersh
ipq
ual
itie
sof
top
man
agem
ent
3.In
tell
ectu
alA
gil
ity
Inn
ovat
ion
En
trep
ren
eurs
hip
Ab
ilit
yto
adap
t
Humancapital
Inte
llig
ence
Sk
ills
Ex
per
tise
Lea
rnin
gca
pab
ilit
yC
han
gin
gca
pab
ilit
yIn
nov
ativ
enes
sC
reat
ivit
y
Structuralcapital
Org
aniz
atio
nal
rou
tin
esS
up
por
tiv
ecu
ltu
reIn
form
atio
nsy
stem
sE
ffici
ency
Tra
nsa
ctio
nti
mes
Pro
ced
ura
lin
nov
ativ
enes
sA
cces
sto
info
rmat
ion
for
cod
ifica
tion
into
kn
owle
dg
eIn
fras
tru
ctu
real
acti
va
(met
hod
s,te
chn
olog
ies,
pro
cess
es)
Infrastructure
assets
Cor
por
ate
cult
ure
Ris
kas
sess
men
tm
eth
ods
Met
hod
sto
man
age
asa
les
forc
eF
inan
cial
stru
ctu
reIn
form
atio
nd
atab
ase
Com
mu
nic
atio
nsy
stem
s
Structuralcapital
Har
dw
are
Sof
twar
eD
atab
ase
Org
aniz
atio
nal
stru
ctu
reP
aten
tsT
rad
emar
ks
Internalstructure
Man
agem
ent
Leg
alst
ruct
ure
Man
ual
syst
ems
Att
itu
des
R&
DS
oftw
are
Structuralcapital
Rel
atio
nsh
ipw
ith
inth
eor
gan
izat
ion
sS
tru
ctu
reC
ult
ure
Rou
tin
esP
roce
sses
Routines
Pro
pri
etar
yso
ftw
are
Net
wor
ks
Cor
por
ate
cult
ure
Pol
icie
s
(continued
)
Table I.Components of
intellectual capital
LinkingIC and IP
1165
Ly
nn
Val
ue
Dis
tin
ctio
nT
ree
(Roo
set
al.)
Inta
ng
ible
Ass
etM
onit
or(S
vei
by
)S
kan
dia
Val
ue
Sch
eme
(Ed
vin
sson
and
Mal
one)
Tec
hn
olog
yB
rok
er(B
rook
ing
)B
onti
s
Relationship/custom
ercapital
Kn
owle
dg
eof
mar
ket
ing
chan
nel
sK
now
led
ge
ofcu
stom
erre
lati
onsh
ips
Mar
ket
orie
nta
tion
(cu
stom
eror
ien
tati
on,
com
pet
itor
orie
nta
tion
,in
ter-
fun
ctio
nal
co-o
rdin
atio
n,
lon
g-t
erm
focu
s,p
rofi
tob
ject
ive)
Rel
atio
ns
wit
hot
her
org
aniz
atio
ns
Market
assets
Bra
nd
sC
ust
omer
sR
epea
tb
usi
nes
sB
ack
log
Dis
trib
uti
onch
ann
els
Lic
ence
s/fr
anch
ises
Externalstructure
Bra
nd
sC
ust
omer
rela
tion
sS
up
pli
erre
lati
ons
Structuralcapitalrelationships
withexternalorganizations
Su
pp
lier
sC
ust
omer
s
Intellectualproperty
Kn
ow-h
owT
rad
ese
cret
sC
opy
rig
hts
Pat
ents
Tra
de-
and
serv
ice
mar
ks
Structuralcapitalrenew
aland
development
R&
DN
ewp
lan
tsN
ewp
rod
uct
sB
PR
Intellectual
property
Pat
ents
Roy
alty
rig
hts
Table I.
MD43,9
1166
infrastructure assets”. Bontis, on the other hand, explicitly excludes IP when definingIC. In fact, within the IC literature the relationship between IC and IP, or, alternatively,the role IP plays in the discussion of IC, remains “problematic”. At the one end of thespectrum, there are scholars who do not include IP into the definition of IC. They do soon the basis of the argument that IP includes much more “tangibles” such as patents,copy rights, trademarks, etc. As such, they adhere to the definition of IC as part of thecompany’s intangibles assets. Adherents of this “school” are Bontis et al. (1999), Bontis(2001), Roos et al. (1998) and Nerdrum and Erikson (2001).
On the other hand, a number of “more integrative” scholars who focus onperformance measurement, performance management and performance reporting,argue that it is ineffective to exclude IP metrics and IP performance from thediscussion of how a company should manage its IC-assets. Proponents of this view areBrennan and Connell (2000), Quinn et al. (1996), Smith and Hansen (2002) and Lev(2001). From a managerial point of view, an “academic” or even “semantic” discussiondoes not contribute to the debate of how a company could increase its performance. IfIP and IP-management leverages company performance, it cannot be ignored in thecontext of IC.
The research presented here introduces IP as a separate element in modelsoriginally developed by scholars who clearly separate IP from IC, in order toinvestigate the effect of introducing IP as an “interface” between (the relationshipsbetween) IC-components and overall company performance. In doing so, this studyaims to enhance our understanding of the importance of IP and IP management inrelation to company performance.
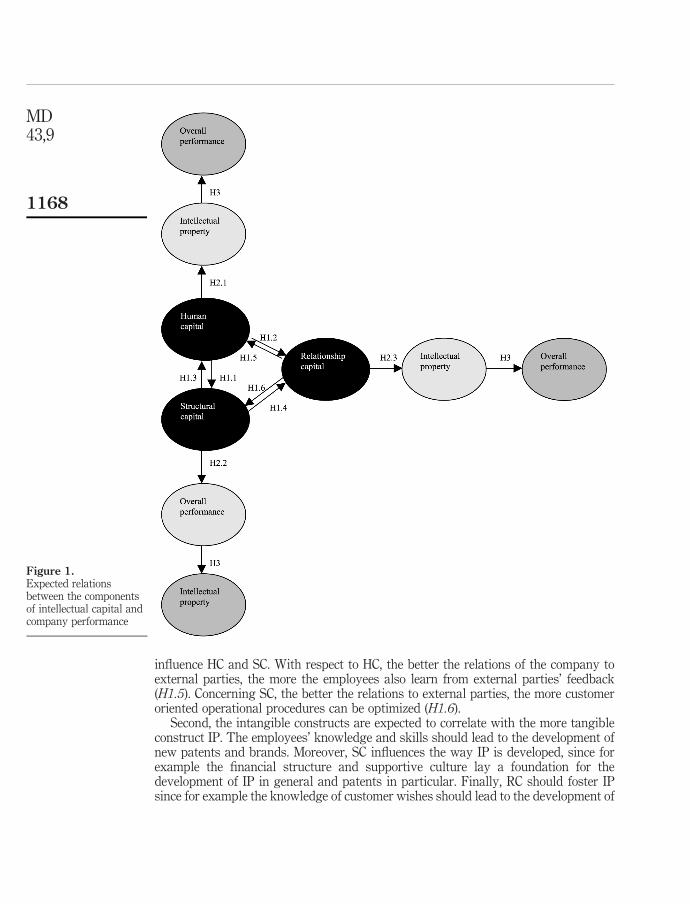
3. HypothesisThe development of hypothesis presented in this section is partly based on Bontis(1998). In that study, the relationship between HC, SC, RC and firm performance isexplored. The results indicate that each of the three elements of IC is relatedindividually to firm performance, but also there are links between the various elementsof IC that influence their relationship with firm performance. For example, the studyindicates that although there is a direct relationship between human capital and firmperformance, HC in itself has little value without the supportive structure of anorganization (i.e. SC). In the following discussion, H1 relates to the relation between thevarious elements of IC, as demonstrated by Bontis (1998), whereas H2 and H3 focus onthe role of IP, an element that was not included in the models developed by Bontis(1998). Figure 1 visualizes the set of hypotheses tested in this study.
First, it is expected that the more intangible components HC, SC and RC enhanceeach other. HC is necessary in order to form SC and RC. The more knowledge and skillsthe employees possess the more they see the need for SC and RC and the more theycontribute positively to its development. Hence, H1.1 predicts a relation between HCand SC, H1.2 between HC and RC. SC is expected to correlate with HC and RC. First,without the corresponding corporate culture, the HC cannot be exploited perfectly andalso not be protected against loss – e.g. due to notice of dismissal (Stoi, 2003). AlsoBontis (1998) and Edvinsson and Malone (1997) state that SC has an impact on HC. Inaddition, without the corresponding processes – e.g. the order processing – no loyalcustomer base (RC) can be established (Stoi, 2003). Therefore a dependence of HC onSC, as stated in H1.3, and of RC on SC (H1.4) is expected. Moreover RC is expected to
LinkingIC and IP
1167
influence HC and SC. With respect to HC, the better the relations of the company toexternal parties, the more the employees also learn from external parties’ feedback(H1.5). Concerning SC, the better the relations to external parties, the more customeroriented operational procedures can be optimized (H1.6).
Second, the intangible constructs are expected to correlate with the more tangibleconstruct IP. The employees’ knowledge and skills should lead to the development ofnew patents and brands. Moreover, SC influences the way IP is developed, since forexample the financial structure and supportive culture lay a foundation for thedevelopment of IP in general and patents in particular. Finally, RC should foster IPsince for example the knowledge of customer wishes should lead to the development of
Figure 1.Expected relationsbetween the componentsof intellectual capital andcompany performance
MD43,9
1168
patents and trademarks. It follows that a significant relationship between HC and IP(H2.1), between SC and IP (H2.2) and between RC and IP (H2.3) is expected.
Finally, a positive correlation between IC and company performance is predicted. IPdirectly influences, among others, sales and market leadership. Therefore a relationbetween IP and company performance is expected (H3). Yet, a direct link between themore intangible components and company performance is not predicted. The reason isthat the influence of IP on company performance is expected to take the impact of themore intangible factors already into account, making a direct link between the moreintangible components on company performance irrelevant.
4. Research design4.1. Research methodFor the measurement of IC, “direct” IC and scorecard methods are chosen. AlthoughSveiby (2002) stresses the fact that direct IC methods and scorecard methods lead tocontext and company specific measurement tool-kits, we assume that companieswithin the same industry have similar needs, structures, etc. and that, as aconsequence, a conceptual measurement tool can therefore be developed and applied toan entire industry. Individual companies will, of course, “adapted” the“industry-relevant” scorecard to their own (idiosyncratic) needs, but important forour research purposes is the relevance and usefulness of such a measurement tool for awhole range of companies. The choice for a sample of companies within the knowledgeintensive pharmaceutical industry – in which such a tool is a priori expected to berelevant for management – increases the external validity of our research.
The direct IC measurement and scorecard methods used in this article refer to theTechnology Broker (Brooking, 1996), Skandia Navigator (Edvinsson and Malone(1997)), the “Intangible Asset Monitor” (Sveiby (1997), the Value Distinction TreeMethod (Roos and Roos (1997)) and both the methods as presented by Bontis (1998) andby Lynn (1998).
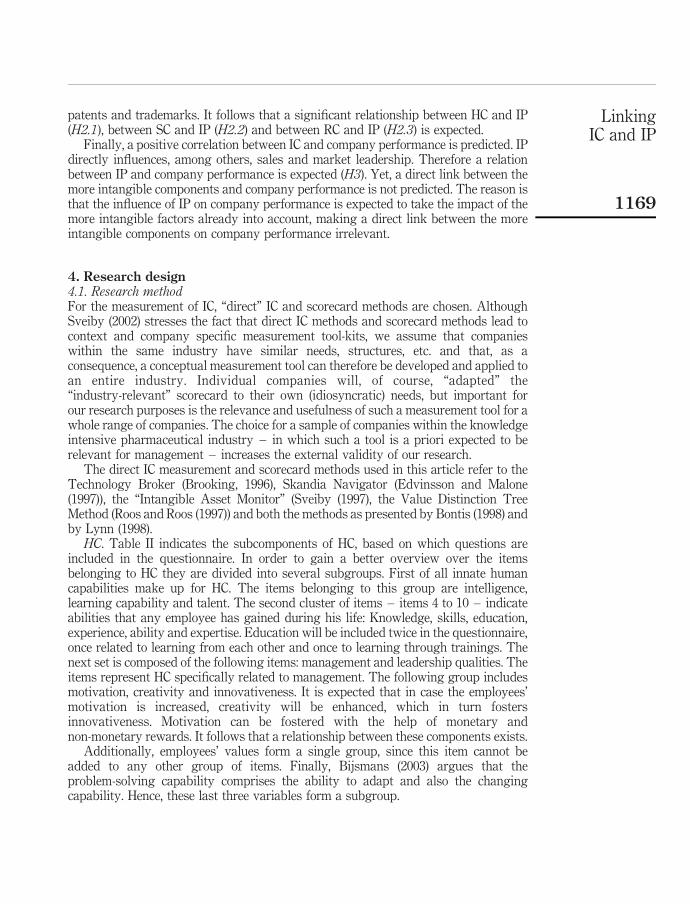
HC. Table II indicates the subcomponents of HC, based on which questions areincluded in the questionnaire. In order to gain a better overview over the itemsbelonging to HC they are divided into several subgroups. First of all innate humancapabilities make up for HC. The items belonging to this group are intelligence,learning capability and talent. The second cluster of items – items 4 to 10 – indicateabilities that any employee has gained during his life: Knowledge, skills, education,experience, ability and expertise. Education will be included twice in the questionnaire,once related to learning from each other and once to learning through trainings. Thenext set is composed of the following items: management and leadership qualities. Theitems represent HC specifically related to management. The following group includesmotivation, creativity and innovativeness. It is expected that in case the employees’motivation is increased, creativity will be enhanced, which in turn fostersinnovativeness. Motivation can be fostered with the help of monetary andnon-monetary rewards. It follows that a relationship between these components exists.
Additionally, employees’ values form a single group, since this item cannot beadded to any other group of items. Finally, Bijsmans (2003) argues that theproblem-solving capability comprises the ability to adapt and also the changingcapability. Hence, these last three variables form a subgroup.
LinkingIC and IP
1169
Hu
man
cap
ital
Bon
tis
(199
8)T
ech
nol
ogy
Bro
ker
(Bro
okin
g,
1996
)S
kan
dia
Val
ue
Sch
eme
(Ed
vin
sson
and
Mal
one,
1997
)In
tan
gib
leA
sset
Mon
itor
(Sv
eib
y,
1997
)V
alu
eD
isti
nct
ion
Tre
e(R
oos
and
Roo
s,19
97)
Ly
nn
(199
8)
1In
tell
igen
ce2
Tal
ent
3L
earn
ing
cap
abil
ity
4Im
pli
cit
kn
owle
dg
eK
now
-how
Kn
owle
dg
eK
now
-how
5S
kil
lsS
kil
lsS
kil
lsS
kil
ls6
Ed
uca
tion
(fro
mem
plo
yee
s)7
Ed
uca
tion
(th
rou
gh
trai
nin
gs)
8 9A
bil
ity
Ex
per
tise
10E
xp
erti
seE
xp
erie
nce
11L
ead
ersh
ipM
anag
emen
t12
Man
ager
ial
skil
lsL
ead
ersh
ipq
ual
itie
sof
top
man
agem
ent
13In
nov
ativ
enes
sIn
nov
ativ
enes
sIn
nov
ativ
enes
s14
Cre
ativ
ity
Cre
ativ
ity
15M
otiv
atio
n(fi
nan
cial
ince
nti
ve)
16M
otiv
atio
n(n
on-fi
nan
cial
ince
nti
ve)
17V
alu
es18
Pro
ble
mso
lvin
gca
pab
ilit
y19
Ab
ilit
yto
adap
t20
Ch
ang
ing
cap
abil
ity
Table II.Items related to humancapital
MD43,9
1170
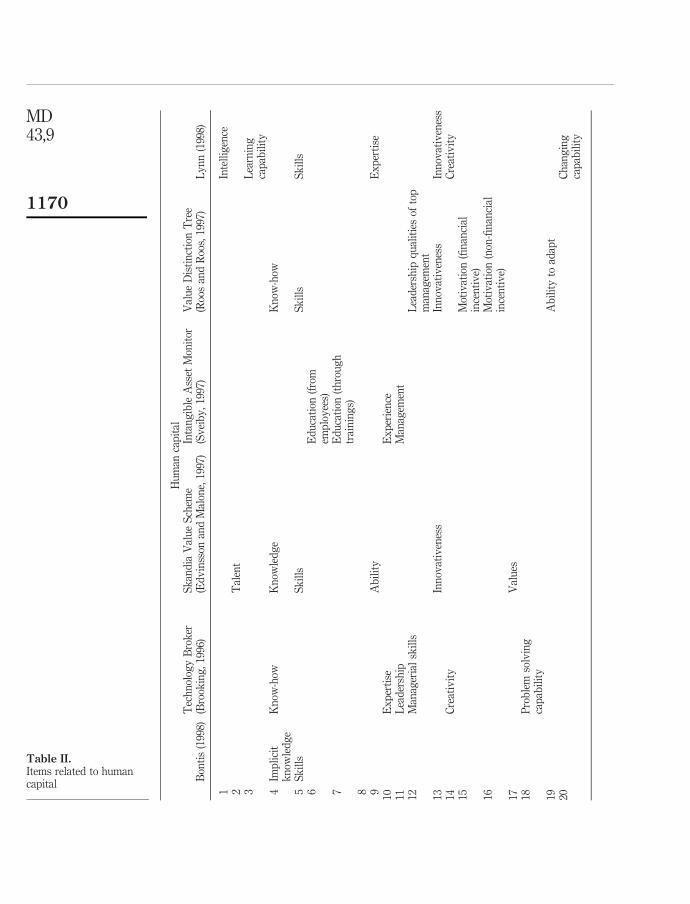
SC. The second cluster of variables can be headed structural capital. Table III indicatesthe items belonging to SC. Again they are summarized in groups in order to gain abetter overview.
The first group of subcomponents deals with what Bontis (1998) calls“infrastructural assets”. They comprise technologies, methods and processes. Hence,methods, manual systems, processes and policies are included in this group ofsubcomponents. The following subgroup of components can be headed with“systems”. This collection is composed of databases, access to information forcodification into knowledge, hardware, software and communication systems. Thenext group portrays organizational culture and is divided into a supporting CC ingeneral and a positive atmosphere in particular. Another group of items represents thestructures in a company and comprises financial structure, organizational structureand networks. The last group of SC represents the result of all the other groups.Organizational routines should be the result of the items in the other subgroups of SC,leading finally to a decrease in transaction times and an increase in efficiency andprocedural innovativeness. Organizational routines are included twice in thequestionnaire, once with respect to efficiency and once with respect to quality of thework.
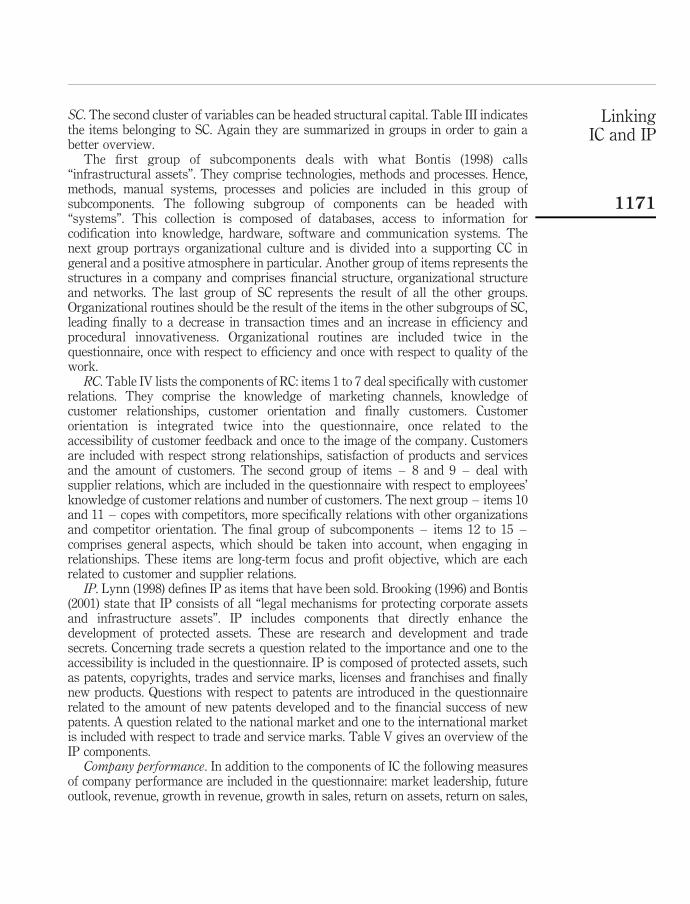
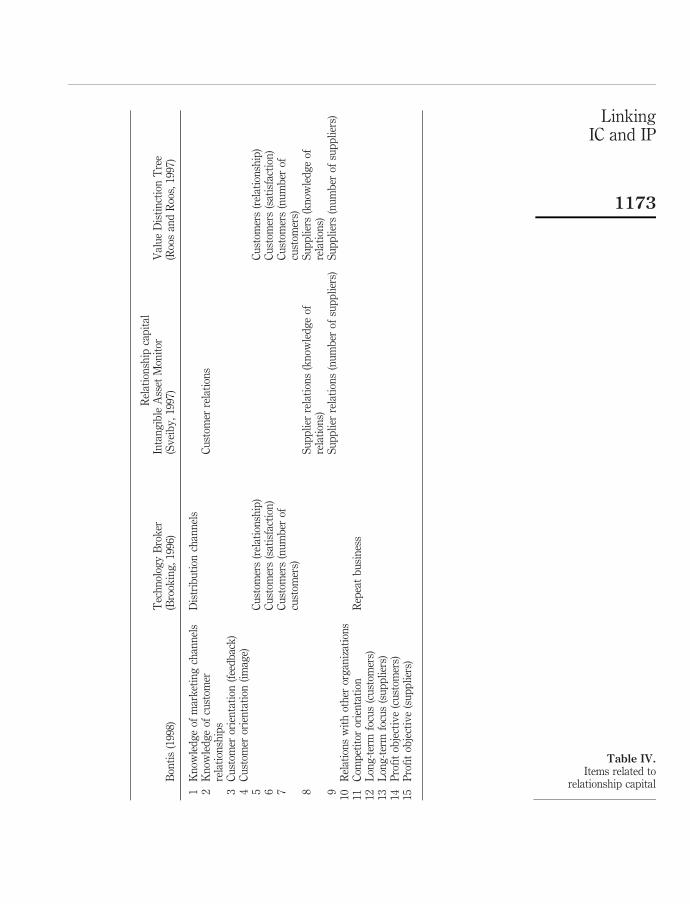
RC. Table IV lists the components of RC: items 1 to 7 deal specifically with customerrelations. They comprise the knowledge of marketing channels, knowledge ofcustomer relationships, customer orientation and finally customers. Customerorientation is integrated twice into the questionnaire, once related to theaccessibility of customer feedback and once to the image of the company. Customersare included with respect strong relationships, satisfaction of products and servicesand the amount of customers. The second group of items – 8 and 9 – deal withsupplier relations, which are included in the questionnaire with respect to employees’knowledge of customer relations and number of customers. The next group – items 10and 11 – copes with competitors, more specifically relations with other organizationsand competitor orientation. The final group of subcomponents – items 12 to 15 –comprises general aspects, which should be taken into account, when engaging inrelationships. These items are long-term focus and profit objective, which are eachrelated to customer and supplier relations.
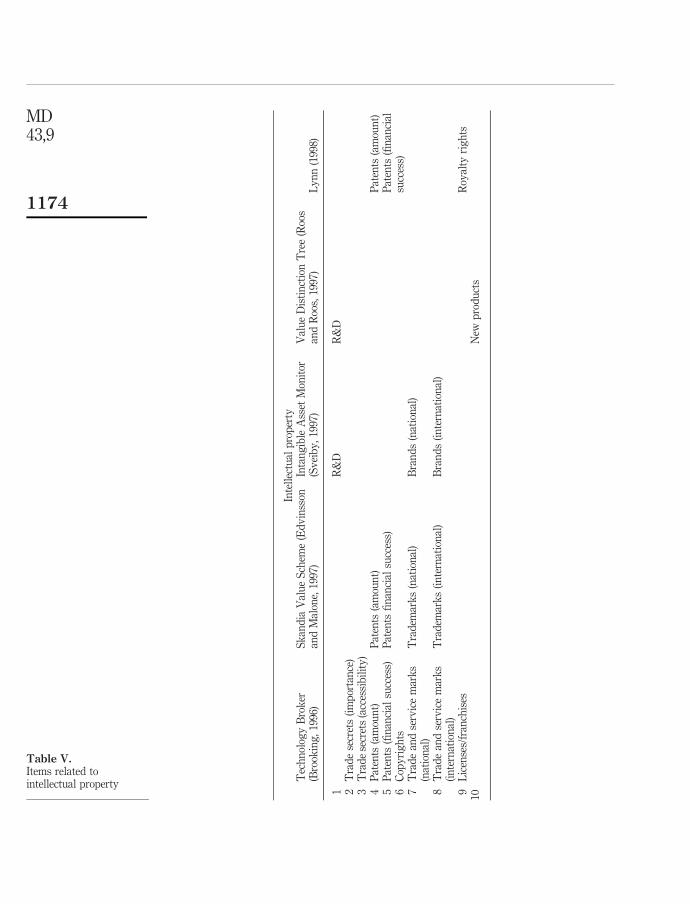
IP. Lynn (1998) defines IP as items that have been sold. Brooking (1996) and Bontis(2001) state that IP consists of all “legal mechanisms for protecting corporate assetsand infrastructure assets”. IP includes components that directly enhance thedevelopment of protected assets. These are research and development and tradesecrets. Concerning trade secrets a question related to the importance and one to theaccessibility is included in the questionnaire. IP is composed of protected assets, suchas patents, copyrights, trades and service marks, licenses and franchises and finallynew products. Questions with respect to patents are introduced in the questionnairerelated to the amount of new patents developed and to the financial success of newpatents. A question related to the national market and one to the international marketis included with respect to trade and service marks. Table V gives an overview of theIP components.
Company performance. In addition to the components of IC the following measuresof company performance are included in the questionnaire: market leadership, futureoutlook, revenue, growth in revenue, growth in sales, return on assets, return on sales,
LinkingIC and IP
1171
Str
uct
ura
lca
pit
al
Bon
tis
(199
8)T
ech
nol
ogy
Bro
ker
(Bro
okin
g,
1996
)
Sk
and
iaV
alu
eS
chem
e(E
dv
inss
onan
dM
alon
e,19
97)
Inta
ng
ible
Ass
etM
onit
or(S
vei
by
,19
97)
Val
ue
Dis
tin
ctio
nT
ree
(Roo
san
dR
oos,
1997
)L
yn
n(1
998)
1In
fras
tru
ctu
ral
acti
va
(tec
hn
olog
ies,
pro
cess
es,
met
hod
s)
(Ris
kas
sess
men
t)m
eth
ods
2P
roce
sses
3M
anu
alsy
stem
s4
Pol
icie
s5
Info
rmat
ion
syst
ems
Info
rmat
ion
dat
abas
eD
atab
ase
6A
cces
sto
info
rmat
ion
for
cod
ifica
tion
into
kn
owle
dg
e7
Har
dw
are
8S
oftw
are
Sof
twar
eP
rop
riet
ary
soft
war
e9
Com
mu
nic
atio
nsy
stem
s10
Su
pp
orti
ve
cult
ure
(pos
itiv
eat
mos
ph
ere)
Cor
por
ate
cult
ure
(pos
itiv
eat
mos
ph
ere)
Cu
ltu
re(p
osit
ive
atm
osp
her
e)C
ult
ure
(pos
itiv
eat
mos
ph
ere)
Cor
por
ate
cult
ure
(pos
itiv
eat
mos
ph
ere)
11S
up
por
tiv
ecu
ltu
re(g
ener
al)
Cor
por
ate
cult
ure
(gen
eral
)C
ult
ure
(gen
eral
)C
ult
ure
(gen
eral
)C
orp
orat
ecu
ltu
re(g
ener
al)
12O
rgan
izat
ion
alst
ruct
ure
Str
uct
ure
13F
inan
cial
stru
ctu
re14
Net
wor
ks
15T
ran
sact
ion
tim
es16
Effi
cien
cy17
Pro
ced
ura
lin
nov
ativ
enes
s18
Org
aniz
atio
nal
rou
tin
es(e
ffici
ency
)R
outi
nes
(effi
cien
cy)
19O
rgan
izat
ion
alro
uti
nes
(qu
alit
y)
Rou
tin
es(q
ual
ity
)
Table III.Items related to structuralcapital
MD43,9
1172
Rel
atio
nsh
ipca
pit
al
Bon
tis
(199
8)T
ech
nol
ogy
Bro
ker
(Bro
okin
g,
1996
)In
tan
gib
leA
sset
Mon
itor
(Sv
eib
y,
1997
)V
alu
eD
isti
nct
ion
Tre
e(R
oos
and
Roo
s,19
97)
1K
now
led
ge
ofm
ark
etin
gch
ann
els
Dis
trib
uti
onch
ann
els
2K
now
led
ge
ofcu
stom
erre
lati
onsh
ips
Cu
stom
erre
lati
ons
3C
ust
omer
orie
nta
tion
(fee
db
ack
)4
Cu
stom
eror
ien
tati
on(i
mag
e)5
Cu
stom
ers
(rel
atio
nsh
ip)
Cu
stom
ers
(rel
atio
nsh
ip)
6C
ust
omer
s(s
atis
fact
ion
)C
ust
omer
s(s
atis
fact
ion
)7
Cu
stom
ers
(nu
mb
erof
cust
omer
s)C
ust
omer
s(n
um
ber
ofcu
stom
ers)
8S
up
pli
erre
lati
ons
(kn
owle
dg
eof
rela
tion
s)S
up
pli
ers
(kn
owle
dg
eof
rela
tion
s)9
Su
pp
lier
rela
tion
s(n
um
ber
ofsu
pp
lier
s)S
up
pli
ers
(nu
mb
erof
sup
pli
ers)
10R
elat
ion
sw
ith
oth
eror
gan
izat
ion
s11
Com
pet
itor
orie
nta
tion
Rep
eat
bu
sin
ess
12L
ong
-ter
mfo
cus
(cu
stom
ers)
13L
ong
-ter
mfo
cus
(su
pp
lier
s)14
Pro
fit
obje
ctiv
e(c
ust
omer
s)15
Pro
fit
obje
ctiv
e(s
up
pli
ers)
Table IV.Items related to
relationship capital
LinkingIC and IP
1173
Inte
llec
tual
pro
per
tyT
ech
nol
ogy
Bro
ker
(Bro
okin
g,
1996
)S
kan
dia
Val
ue
Sch
eme
(Ed
vin
sson
and
Mal
one,
1997
)In
tan
gib
leA
sset
Mon
itor
(Sv
eib
y,
1997
)V
alu
eD
isti
nct
ion
Tre
e(R
oos
and
Roo
s,19
97)
Ly
nn
(199
8)
1R
&D
R&
D2
Tra
de
secr
ets
(im
por
tan
ce)
3T
rad
ese
cret
s(a
cces
sib
ilit
y)
4P
aten
ts(a
mou
nt)
Pat
ents
(am
oun
t)P
aten
ts(a
mou
nt)
5P
aten
ts(fi
nan
cial
succ
ess)
Pat
ents
fin
anci
alsu
cces
s)P
aten
ts(fi
nan
cial
succ
ess)
6C
opy
rig
hts
7T
rad
ean
dse
rvic
em
ark
s(n
atio
nal
)T
rad
emar
ks
(nat
ion
al)
Bra
nd
s(n
atio
nal
)
8T
rad
ean
dse
rvic
em
ark
s(i
nte
rnat
ion
al)
Tra
dem
ark
s(i
nte
rnat
ion
al)
Bra
nd
s(i
nte
rnat
ion
al)
9L
icen
ses/
fran
chis
esR
oyal
tyri
gh
ts10
New
pro
du
cts
Table V.Items related tointellectual property
MD43,9
1174
success of the introduction of new products on the market and overall performance.Again, these items can be answered based on a five point Likert-type scale.
Hence, the composition of the questionnaire leads to the following components andvariables, which will be tested in section 5: the independent constructs HC, SC, RC andIC with 20, 19, 15 and ten variables respectively and the dependent construct companyperformance with nine variables.
4.2. Sample designThe German pharmaceutical industry as a highly innovative, although competitivebranch of high-tech industry is the perfect choice for a detailed study of IC. On the onehand this is because IC in form of employees’ skills and good networks are absolutelynecessary for such highly innovative companies in order to gain a competitive edge. Onthe other hand, pharmaceutical companies dispose of a mixture of more tangible formsof IC like patents and brand names and less tangible ones like employees’ skills. This isnot the case for example dot.com companies, where less tangible components prevail.Hence, when analyzing IC in the pharmaceutical industry more tangible as well as lesstangible components of IC can be taken into consideration.
The nature of the questions that are part of the questionnaire used in our study,requires a research design that is not limited to one single questionnaire per company,since the answer to most of the questions is not clear-cut and therefore may depend onthe perception of the person sampled. Hence, in order to increase the internal validity ofthe research, the questionnaires were sent to multiple people of the same company. Aconsequence of this approach is that the number of companies involved in the study islimited, since for each firm that is part of the study a high level of participation isrequired to ensure sufficient responses per firm. Five pharmaceutical companies, withheadquarters in Germany, listed on the German stock exchange and included in theDAX or MDAX were chosen to participate in the research. Questionnaires were sent todifferent managers of the same company including top, middle and lower management.Moreover, managers being responsible for different departments within the companieshave been selected, namely: marketing, purchasing, accounting, managementaccounting, communication, human resource, production, sales, research anddevelopment, internal audit, and logistics. In total 300 questionnaires were mailed,which could be answered anonymously.
5. ResultsThis section deals with the statistical analysis of the questionnaires. The results aretested for normality and reliability. Scales of the variables are formed. Finally, aregression analysis is performed in order to find significant relations between thecomponents of IC.
5.1. Response analysisIn total 41 questionnaires were returned, resulting in a response rate of 14 percent.Multiple responses were received from all firms involved in the study. A first step inthe analysis of the data is to test for normality. This is important, since the underlyingassumption of several statistic tests is the one of normality. In the case at hand theKolmogorov-Smirnov Test with Lillifor’s correction is applied. In contrast to theChi-square test, the Kolmogorov-Smirnov test is more appropriate to smaller samples,
LinkingIC and IP
1175
since it can better detect non-normally distributed data in that case (Bleymuller et al.,1998). Further, in contrast to a “normal” Kolmogorov-Smirnov Test, the Lillifor’scorrection does not assume that the population parameters (mean and standarddeviation) are known. Since only a small sample exists, and the population parametersare not known, the Kolmogorov-Smirnov Test with Lillifor’s Correction is used.
Every dependent and independent variable is tested for normality. If thesignificance level is greater than 5 percent, normality is assumed. However, this is notthe case for any of the variables. It follows, that none of them is normally distributed.Hence, for the following analyses only non-parametric tests are used.
5.2. Reliability testIn a second step the reliability of the measures used in the questionnaire is calculated.The aim is to find out, how well the set of questions relating to each of the componentsof IC, are able to measure this component. For this analysis, the Cronbach’s alphastatistic is used, which calculates the correlation of an item with the sum of the otheritems of the component. An alpha value above 90 percent indicates very highreliability. A value between 75 percent and 90 percent indicates a useful reliability anda value below 75 percent indicates low reliability.
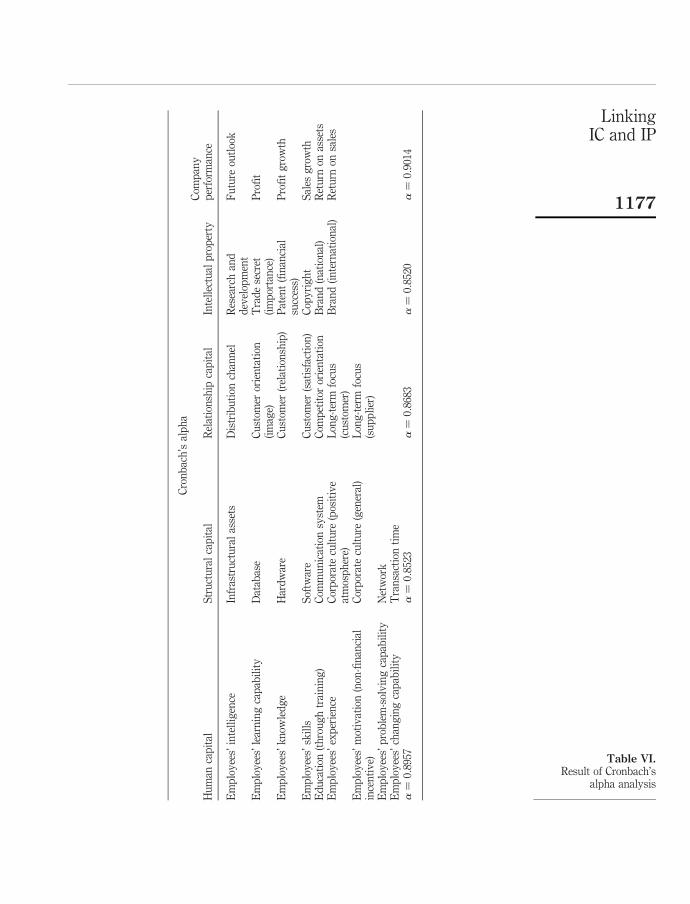
Including all items used in the questionnaire, the alpha values for the constructsused in this study are the following: human capital 85.78 percent; structural capital84.52 percent; relationship capital 77.62 percent, IP 77.96 percent and companyperformance 85.88 percent. After exclusion of the variables with a non-significant(value of corrected item total correlation below 0.5) or negative correlations, the valuesof Cronbach’s alpha increased to: HC 89.7 percent; SC 85.23 percent; RC 86.83 percent,IP 85.20 percent and company performance 90.14 percent. The variables indicated inTable VI all contributed positively and significantly to the Cronbach’s alpha of theindividual component and are therefore the input to further statistical analysis.
Construction of scale valuesThe variables that remain after the reliability analysis have to be reduced andsummarized in order to make interpretation of the regression analysis easier (Bontis,1998). This is done by building scale values. In order to construct scale values, thefollowing procedure is applied. For the construction of the scale value for HC, the meanof the variables measuring HC and remaining after the reliability analysis is taken[1].The same procedure is applied for the calculation of the scales SC, RC, IP and companyperformance. This results in five new variables (scales), each composed of 41observations. These scales are the input to the regression analysis described in thefollowing section.
Factor analysis with varimax rotation would have been another method for thesummarization of data. The difference to the method applied is the following: Whenbuilding scales based on the mean of the original variables, the weights assigned to thevariables are equal. When summarizing variables, however, with the help of factoranalysis the weights assigned to the variables vary. Yet, factor analysis cannot beapplied in the case at hand, since the relation of observations to the number ofvariables that are to be summarized into factors is too low. A minimum of fiveobservations per variable would have been required. Since this prerequisite is not
MD43,9
1176
Cro
nb
ach
’sal
ph
a
Hu
man
cap
ital
Str
uct
ura
lca
pit
alR
elat
ion
ship
cap
ital
Inte
llec
tual
pro
per
tyC
omp
any
per
form
ance
Em
plo
yee
s’in
tell
igen
ceIn
fras
tru
ctu
ral
asse
tsD
istr
ibu
tion
chan
nel
Res
earc
han
dd
evel
opm
ent
Fu
ture
outl
ook
Em
plo
yee
s’le
arn
ing
cap
abil
ity
Dat
abas
eC
ust
omer
orie
nta
tion
(im
age)
Tra
de
secr
et(i
mp
orta
nce
)P
rofi
t
Em
plo
yee
s’k
now
led
ge
Har
dw
are
Cu
stom
er(r
elat
ion
ship
)P
aten
t(fi
nan
cial
succ
ess)
Pro
fit
gro
wth
Em
plo
yee
s’sk
ills
Sof
twar
eC
ust
omer
(sat
isfa
ctio
n)
Cop
yri
gh
tS
ales
gro
wth
Ed
uca
tion
(th
rou
gh
trai
nin
g)
Com
mu
nic
atio
nsy
stem
Com
pet
itor
orie
nta
tion
Bra
nd
(nat
ion
al)
Ret
urn
onas
sets
Em
plo
yee
s’ex
per
ien
ceC
orp
orat
ecu
ltu
re(p
osit
ive
atm
osp
her
e)L
ong
-ter
mfo
cus
(cu
stom
er)
Bra
nd
(in
tern
atio
nal
)R
etu
rnon
sale
s
Em
plo
yee
s’m
otiv
atio
n(n
on-fi
nan
cial
ince
nti
ve)
Cor
por
ate
cult
ure
(gen
eral
)L
ong
-ter
mfo
cus
(su
pp
lier
)E
mp
loy
ees’
pro
ble
m-s
olv
ing
cap
abil
ity
Net
wor
kE
mp
loy
ees’
chan
gin
gca
pab
ilit
yT
ran
sact
ion
tim
ea¼
0:89
57a¼
0:85
23a¼
0:86
83a¼
0:85
20a¼
0:90
14
Table VI.Result of Cronbach’s
alpha analysis
LinkingIC and IP
1177
fulfilled, the results of the regression analysis would not have been stable in case of theapplication of factor analysis.
Regression resultsRegression analysis is used to analyze the statistical relationship between the scales forHC, SC, RC, and IP, which were constructed in the preceding section, and companyperformance. Regression analysis is robust against non-normality and thereforeapplicable in the case at hand. The coefficient of determination (R 2) indicates thegoodness of fit of the model. The higher the two indicators, the better the independentvariable(s) explain(s) the variation in the dependent variable. The t-value indicates thesignificance of the relationships found (see Figure 2).
In a first step, the relationships between the independent scales for HC, SC, RC andIC and the dependent scale for company performance is tested, using a series ofmultiple regressions. All possible combinations of the independent factors[2] areregressed against the individual company performance variables[3], as well as theoverall scale for company performance. Satisfying results in terms of R 2 and t-valuesare found for the following regressions:
. intellectual property/market leadership (R 2 ¼ 22:6 percent, t ¼ 3:335 significantat a ¼ 0:1 percent;
. intellectual property/future outlook (R 2 ¼ 17:4 percent, t ¼ 2:869 significant ata ¼ 0:5 percent);
. intellectual property/overall performance (R 2 ¼ 8:9 percent, t ¼ 1:929significant at a ¼ 5 percent); and
. intellectual property/success of new products (R 2 ¼ 6:7 percent, t ¼ 1:649significant at a ¼ 10 percent).
For the remaining company performance variables no significant relations with any ofthe independent scales were found. Also, for the scale relating to company performanceas defined in the preceding section, no significant relationships are detected.
Since all significant relationships found in the previous analysis solely relate to thescale for IP, in a second step each of the scales for HC, SC and RC are regressed againstthe scale for IP. This analysis should provide further insight into the relationshipbetween HC, SP and RC on the one hand and IP on the other hand. The bestrelationship in terms of R 2 (23.2 percent) and t-value (3.437 significant at a ¼ 1percent) is found for the relation between SC and IP. However, also between RC and IP(R 2 ¼ 19:2 percent, t ¼ 3:043 significant at a ¼ 5 percent) and HC and IP (R 2 ¼ 11:6percent, t ¼ 2:237 significant at a ¼ 2:5 percent) significant relations were detected.
In a third step the relationship between HC, SC and RC is analyzed. In thisregression analysis, the scale structural capital is taken as the dependent variable andthe scales human capital and relationship capital are used as independent ones. Againa significant relationship is detected (R 2 ¼ 53; 5 percent, thuman capital ¼ 2:237significant at a ¼ 2:5 percent, trelationship capital ¼ 2:347 significant at a ¼ 2:5 percent).
Also the following regressions lead to statistically significant results: SC and RC onHC (R 2 ¼ 52:2 percent, tstructural capital ¼ 3:38 significant at a ¼ 0:1 percent,trelationship capital ¼ 2; 082 significant at a ¼ 2:5 percent) and human capital andstructural capital on relationship capital (R 2 ¼ 45:5 percent, thuman capital ¼ 2:082
MD43,9
1178
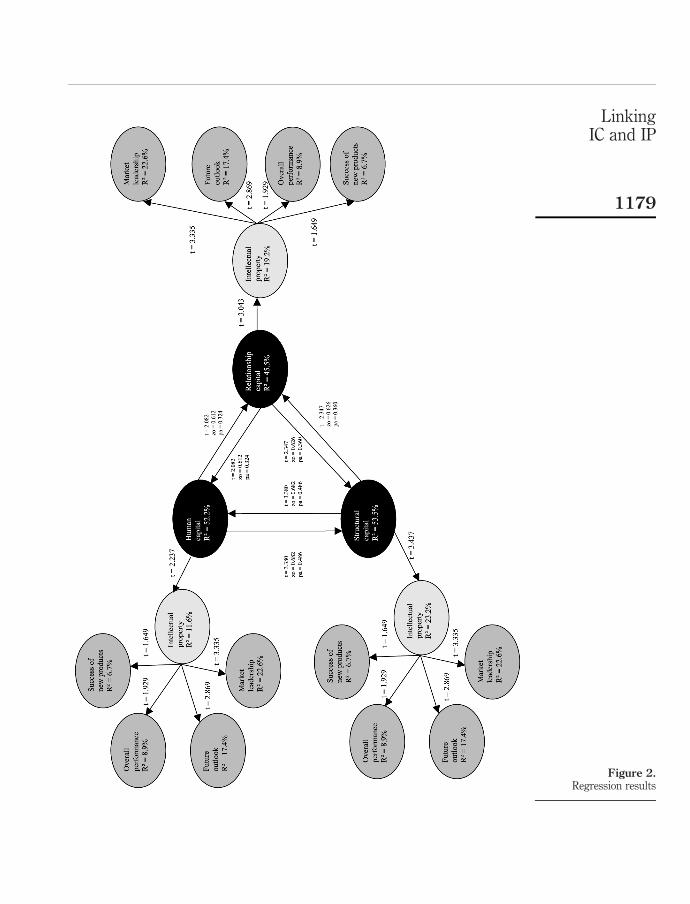
Figure 2.Regression results
LinkingIC and IP
1179
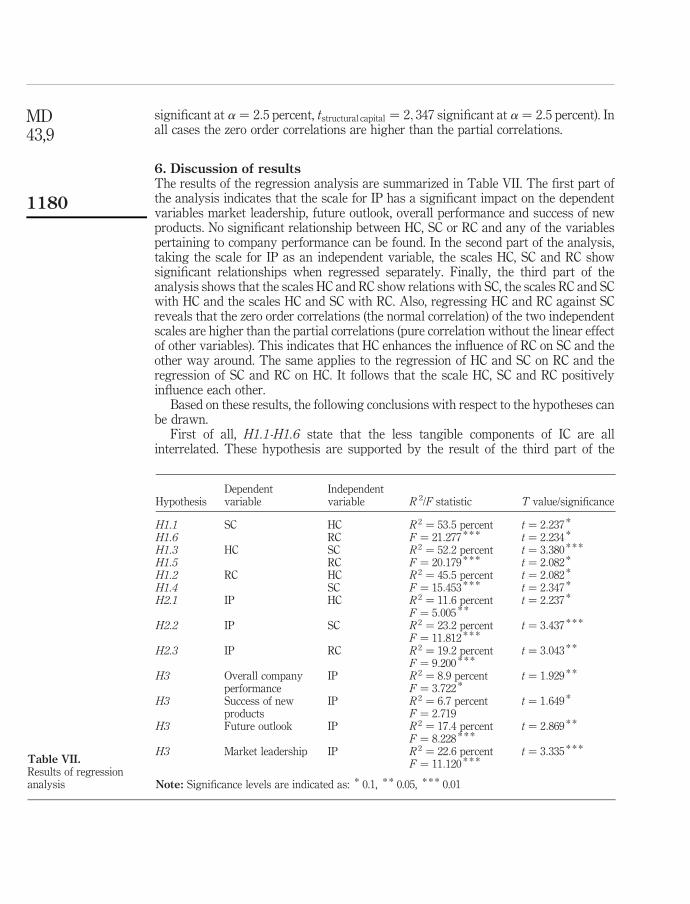
significant at a ¼ 2:5 percent, tstructural capital ¼ 2; 347 significant at a ¼ 2:5 percent). Inall cases the zero order correlations are higher than the partial correlations.
6. Discussion of resultsThe results of the regression analysis are summarized in Table VII. The first part ofthe analysis indicates that the scale for IP has a significant impact on the dependentvariables market leadership, future outlook, overall performance and success of newproducts. No significant relationship between HC, SC or RC and any of the variablespertaining to company performance can be found. In the second part of the analysis,taking the scale for IP as an independent variable, the scales HC, SC and RC showsignificant relationships when regressed separately. Finally, the third part of theanalysis shows that the scales HC and RC show relations with SC, the scales RC and SCwith HC and the scales HC and SC with RC. Also, regressing HC and RC against SCreveals that the zero order correlations (the normal correlation) of the two independentscales are higher than the partial correlations (pure correlation without the linear effectof other variables). This indicates that HC enhances the influence of RC on SC and theother way around. The same applies to the regression of HC and SC on RC and theregression of SC and RC on HC. It follows that the scale HC, SC and RC positivelyinfluence each other.
Based on these results, the following conclusions with respect to the hypotheses canbe drawn.
First of all, H1.1-H1.6 state that the less tangible components of IC are allinterrelated. These hypothesis are supported by the result of the third part of the
HypothesisDependentvariable
Independentvariable R 2/F statistic T value/significance
H1.1 SC HC R 2 ¼ 53:5 percent t ¼ 2:237 *
H1.6 RC F ¼ 21:277 * * * t ¼ 2:234 *
H1.3 HC SC R 2 ¼ 52:2 percent t ¼ 3:380 * * *
H1.5 RC F ¼ 20:179 * * * t ¼ 2:082 *
H1.2 RC HC R 2 ¼ 45:5 percent t ¼ 2:082 *
H1.4 SC F ¼ 15:453 * * * t ¼ 2:347 *
H2.1 IP HC R 2 ¼ 11:6 percent t ¼ 2:237 *
F ¼ 5:005 * *
H2.2 IP SC R 2 ¼ 23:2 percent t ¼ 3:437 * * *
F ¼ 11:812 * * *
H2.3 IP RC R 2 ¼ 19:2 percent t ¼ 3:043 * *
F ¼ 9:200 * * *
H3 Overall companyperformance
IP R 2 ¼ 8:9 percentF ¼ 3:722 *
t ¼ 1:929 * *
H3 Success of newproducts
IP R 2 ¼ 6:7 percent t ¼ 1:649 *
F ¼ 2:719H3 Future outlook IP R 2 ¼ 17:4 percent t ¼ 2:869 * *
F ¼ 8:228 * * *
H3 Market leadership IP R 2 ¼ 22:6 percent t ¼ 3:335 * * *
F ¼ 11:120 * * *
Note: Significance levels are indicated as: * 0.1, * * 0.05, * * * 0.01
Table VII.Results of regressionanalysis
MD43,9
1180
regression analysis. When regressing HC and RC against SC significant relations arefound. The comparison of zero order correlations to partial correlations indicate theinterdependence between the two independent factors. The same results are foundwhen regressing HC and SC against RC and SC and RC against HC.
H2.1-H2.3 predict a significant relationship between HC and IP, SC and IP and RCand IC. Also these hypotheses are supported by the second part of the regressionresults.
H3 states that there is a positive relationship between IP and company performance.Based on the first part of the regression analysis, a direct connection between the scaleIP and individual variables assigned to company performance can be detected.Significant relationships exist for market leadership, future outlook, overallperformance and success of new products. These results provide general support forH3. It should be mentioned, however, that no significant relationship between IP andthe overall scale for company performance is found.
Finally it was predicted that no significant relations between the less tangiblecomponents of IC and company performance subsist. This hypothesis is also supportedby the first part of the regression analysis. It follows that a useful distinction can bemade between the less tangible components of IC and the more tangible component.Whereas IP reveals a direct link to variables measuring company performance, HC, SCand RC have an indirect link to variables measuring company performance with IP asan intermediary.
Three limitations of the research persist. From a total sample of 300, 41 responseswere useful for the analysis. Although the sample size is sufficient for the statisticaltests applied, the results reported here should only be considered a trend. In order toreceive more reliable results a higher response rate would have been necessary. Itshould also be reminded that the research design focused on multiple responses perfirm to increase the internal validity of the research. However, as a result of thisapproach the number of firms included in the study is limited which may have anadverse effect on the external validity of the research.
The R 2 values of the regression including IC and success of new products andoverall performance respectively are fairly low. This result indicates that there areother variables that may predict company performance which are not part of thisstudy. Also, these results may be related to the sample size. Nevertheless significantrelations between IP and success of new products and IC and overall performance weredetected.
Another problem of the research lies in the way answers to the questions could beprovided, which relates to the use of a Likert-type scale in the questionnaire. Thegeneral way of reaction of the respondents influences the results, meaning that somepeople tend to give extreme answers whereas others prefer cautious answers.
7. ConclusionsAnalyzing the role of IC, this research paper concentrated on the role of IP in therelationship between IC and firm performance, based on an empirical analysis. Theresearch was aimed at pointing out that IP is an important asset of companies and wasmeant to increase the awareness among management for IC in general and for certainparts of IC in particular.
LinkingIC and IP
1181
Similar research was presented by Bontis (1998, 2002), Yet, his questionnaireanalysis was a pilot study using students as respondents, and the analysis of theannual reports only applied to Canadian companies. Since the outcomes of theseanalyses are highly content specific and therefore not readily applicable to otherindustries, doing such a research in another economic setting focusing on a highlycompetitive research-intensive industry like the pharmaceutical industry was highlyvaluable to verify the important role of IC found. The pharmaceutical industry waschosen because it combined all relevant four components of IC, HC, SC, RC and IP, thelatter not always being present in other IC-intensive industries, making thepharmaceutical industry a perfect example for analyzing the interlude of allcomponents.
A questionnaire based on the insights gained from an analysis of the measurementmethods as well as on knowledge about the specific industry was developed for thepharmaceutical industry. The questionnaire included questions related to allcomponents of IC as well as company performance. Statistical analysis showed thefollowing results. HC has a significant influence on the company performanceindicators market leadership, future outlook, overall performance and success of newproducts. In addition HC, SC and RC have a significant influence on IP and, therefore,with IP as an intermediary an indirect influence on company performance. It followedthat in order to enhance company performance, companies have to focus on the itemsincluded in these variables.
In addition, the less tangible components of IC strengthen each other, meaning thatwhen improving one of the components the other two components are improved aswell. Hence, the correlations between these items have to be well understood bymanagement in order to gain the most from investments.
Overall it could be stated that pharmaceutical companies have to understand thecorrelations between the components of IC and set a focus on the individual itemsincluded, which means the increase of employees’ awareness of important items andthe measurement of items in order to determine whether they are satisfyinglydeveloped.
The results of our study have several practical implications. This study showsthat there is a link between IP and company performance in case of thepharmaceutical industry. Yet, it also reveals that IP is a kind of “interface” linkingHC/SC/RC components overall company performance. Therefore, IC as a whole, i.e.including IP, and not solely IP has a positive impact on company performance.Based on these results, it follows that the optimal procedure for pharmaceuticalcompanies is to focus on all four components of IC in order to increase companyperformance. This is especially the case, since HC, SC and RC enhance each other(e.g. in case SC is improved, IC and RC are positively influenced which in turn allpositively contribute to IP).
In order to focus on HC, SC, RC and IP, firms should assign importance to thoseaspects included in the scales for each of these components (see Table VI). For HC thismeans that employees have to be intelligent, they have to learn quickly, they have tohave knowledge, skills and experience. Also, they have to be able to solve problems inan adequate manner and to adapt to different situations. In addition they have toreceive trainings and be motivated. Concerning SC it means that sufficient“infrastructural assets” in the form of technologies, presses and methods have to
MD43,9
1182
exist. A database, hardware, software, communication systems and networks have tosubsist. The corporate culture has to be supportive in general and positive in particularand transaction times have to be small. With respect to RC, a sufficient number ofdistribution channels have to exist, the customers’ image of the company is ofimportance, customers have to be satisfied in order to increase retention rates and tobuild long-term relationships. Also supplier relationships have to be based on the longterm. Finally the business of competitors has to be analyzed. Focusing on IP meansinvestment in R&D, taking care of trade secrets, development of patents that arefinancially successful, development of copyrights and national and internationalawareness of the brand name.
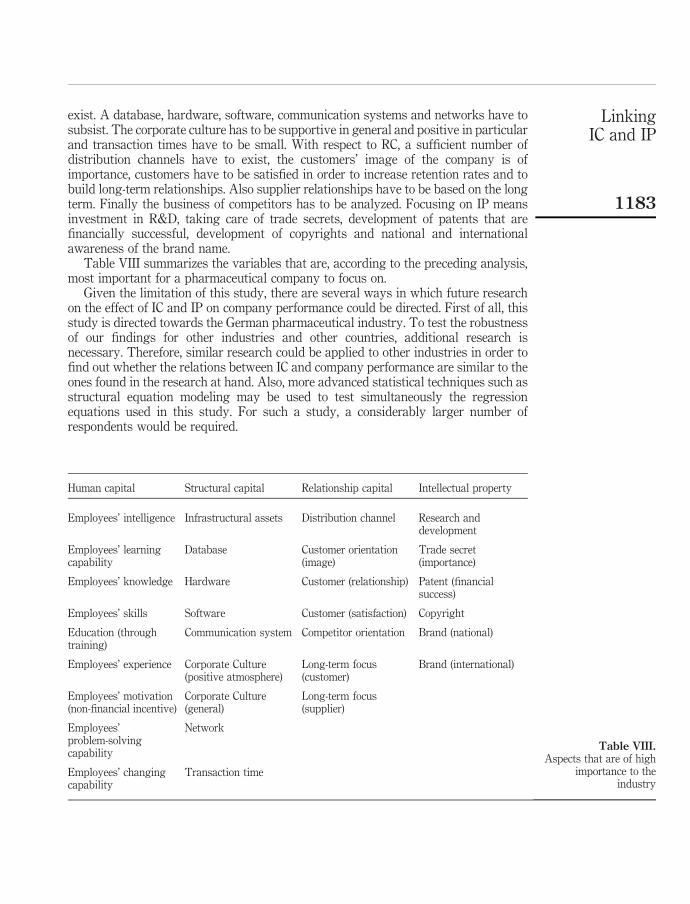
Table VIII summarizes the variables that are, according to the preceding analysis,most important for a pharmaceutical company to focus on.
Given the limitation of this study, there are several ways in which future researchon the effect of IC and IP on company performance could be directed. First of all, thisstudy is directed towards the German pharmaceutical industry. To test the robustnessof our findings for other industries and other countries, additional research isnecessary. Therefore, similar research could be applied to other industries in order tofind out whether the relations between IC and company performance are similar to theones found in the research at hand. Also, more advanced statistical techniques such asstructural equation modeling may be used to test simultaneously the regressionequations used in this study. For such a study, a considerably larger number ofrespondents would be required.
Human capital Structural capital Relationship capital Intellectual property
Employees’ intelligence Infrastructural assets Distribution channel Research anddevelopment
Employees’ learningcapability
Database Customer orientation(image)
Trade secret(importance)
Employees’ knowledge Hardware Customer (relationship) Patent (financialsuccess)
Employees’ skills Software Customer (satisfaction) Copyright
Education (throughtraining)
Communication system Competitor orientation Brand (national)
Employees’ experience Corporate Culture(positive atmosphere)
Long-term focus(customer)
Brand (international)
Employees’ motivation(non-financial incentive)
Corporate Culture(general)
Long-term focus(supplier)
Employees’problem-solvingcapability
Network
Employees’ changingcapability
Transaction time
Table VIII.Aspects that are of high
importance to theindustry
LinkingIC and IP
1183
Notes
1. Observation 1 scale value human capital ¼ Mean (observation 1 employees’ intelligence þobservation 1 employees’ learning capability þ . . .þ observation 1 employees’ changingcapability) . . .
Observation 41 scale value human capital ¼ mean (observation 41 employees’intelligence þ observation 41employees’ learning capability þ . . .þ observation 41employees’ changing capability).
2. The following combinations of dependent factors are regressed against the dependent one:HC; SC; RC; IP; HC and SC; HC and RC; HC and IP; SC and RC; SC and IP; RC and IP; HC, SCand RC; HC, SC and IP; SC,RC and IP.
3. “Market leadership”, “future outlook”, “profit”, “profit growth”, “sales growth”, “return onassets”, “return on sales”, “success of new products”, “overall performance”
References
Bijsmans, W. (2003), “De ‘Intellectuele’ Universiteit: Ontwikkeling van universiteit enmedewerkers door integratie van intellectueel kapitaal en human resourcesmanagement”, Docotoraalscriptie, Faculteit der Economische Wetenschappen enBedrijfskunde, Universiteit Maastricht, Maastricht.
Bleymuller, J., Gehlert, G. and Gulicher, H. (1998), Statistik fur Wirtschaftswissenschaftler, VahlenVerlag, Munchen.
Bontis, N. (1998), “Intellectual capital: an exploratory study that develops measures and models”,Management Decision, Vol. 36 No. 2, pp. 63-76.
Bontis, N. (2001), “Assessing knowledge assets: a review of the models used to measureintellectual capital”, International Journal of Management Reviews, Vol. 3 No. 1, pp. 41-60.
Bontis, N. (2002), “Intellectual capital disclosure in Canadian corporations.”, available at: www.business.mcmaster.ca/mktg/nbontos/research.htm (accessed April 11, 2003).
Bontis, N. and Fitz-enz, J. (2002), “Intellectual capital ROI: a causal map of human capitalantecedents and consequents”, Journal of Intellectual Capital, Vol. 3 No. 3, pp. 223-47.
Bontis, N., Dragonetti, N.C., Jacobsen, K. and Roos, G. (1999), “The knowledge toolbox: A reviewof the tools available to measure and manage intangible resources”, EuropeanManagement Journal, Vol. 17 No. 4, pp. 391-402.
Brennan, N. and Connell, B. (2000), “Current issues and policy implications”, Journal ofIntellectual Capital, Vol. 1 No. 3, pp. 206-40.
Brooking, A. (1996), Intellectual Capital: Core assets for the Third Millennium Enterprise,Thomson Business Press, London.
Canibano, L. and Sanchez, M.P. (2003), “Measurement, management and reporting onintangibles: state-of-the-art”, paper presented at the American Accounting Association2003 Annual Meeting, Honolulu, HI, August 3-6.
Daum, J.H. (2001), “Werttreiber Intangible Assets: Brauchen wir ein neues Rechnungswesen undControlling? Ein Ansatz fur ein verbessertes Managementsystem”, available at: www.juergendaum.de (accessed April 11, 2003).
Edvinsson, L. (1997), “Developing intellectual capital at Skandia”, Long Range Planning, Vol. 20No. 3, pp. 366-73.
Edvinsson, L. and Malone, M.S. (1997), Intellectual Capital: Realizing Your Company’s True Valueby Finding Its Hidden Brainpower, Harper Business, New York, NY.
Hall, R. (1992), “The strategic analysis of intangible resources”, Strategic Management Journal,Vol. 13, pp. 135-44.
MD43,9
1184
Lev, B. (2001), Intangible Assets: Management, Measurement and Reporting, The BrookingInstitution, Washington, DC.
Llewlyn, S. (2003), “What counts as “theory” in qualitative management and accountingresearch?”, Journal of Intellectual Capital, Vol. 16 No. 4, pp. 662-708.
Lynn, B.E. (1998), “Performance evaluation in the new economy: bringing the measurement andevaluation of intellectual capital into the management planning and control system”,International Journal of Technology Management, Vol. 16 Nos 1/2/3.
Nerdrum, L. and Erikson, T. (2001), “IC: a human capital perspective”, Journal of IntellectualCapital, Vol. 2 No. 2, pp. 127-35.
PriceWaterhouseCoopers and Morgan Stanley (2003), PriceWaterhouseCoopers and MorganStanley Building Enforcing Intellectual Property Value: An International Guide for theBoardroom, Globe White Page, London, 422 pp..
PriceWaterhouseCoopers and Morgan Stanley (2004), IP Value 2004: Building and EnforcingIntellectual Property An International Guide for the Boardroom, Globe White Papers,London, 456 pp..
Quinn, J., Anderson, P. and Finkelstein, S. (1996), “Managing professional intellect: making themost of the best”, Harvard Business Review, March-April.
Revsine, L., Collins, D.W. and Johnson, W.B. (1999), Financial Reporting and Analysis,Prentice-Hall, Upper Saddle River, NJ.
Roos, G. and Roos, J. (1997), “Measuring your company’s intellectual performance”, Long RangePlanning, Vol. 30 No. 3, pp. 413-26.
Roos, J., Roos, G., Dragonetti, N.C. and Edvinsson, L. (1998), IC: Navigating in the New BusinessLandscape, New York University Press, New York, NY.
Roslender, R. and Fincham, R. (2001), “Thinking critically about intellectual capital accounting”,Journal of Intellectual Capital, Vol. 14 No. 4, pp. 383-98.
Schmalenbach-Gesellschaft fur Betriebswirtschaft eV (2003), “Freiwillige externeBerichterstattung uber immaterielle Werte”, Der Betrieb, Vol. 23 No. 6.
Smith, M. and Hansen, F. (2002), “Managing IP: a strategic point of view”, Journal of IntellectualCapital, Vol. 3 No. 4, pp. 366-74.
Stewart, T.A. (1997), Intellectual Capital: The NewWealth of Organizations, Doubleday/Currency,New York, NY.
Stoi, R. (2003), “Controlling von Intangibles, Identifikation und Steuerung der immateriellenWerttreiber”, Controlling, Nos 3/4.
Sullivan, P. (2000), “A brief history of the ICM movement”, available at: http://sveiby.com/articles/icmmovement.htm (April 16, 2003).
Sveiby, K.E. (1997), The New Organizational Wealth: Managing andMeasuring Knowledge-basedAssets, Barrett-Kohler, San Francisco, CA.
Sveiby, K.E. (2001), “Intellectual capital and knowledge management”, available at: http://sveiby.com/articles/intellectualcapital.htm (accessed July 4, 2003).
Sveiby, K.E. (2002), “Methods for measuring intangible assets”, available at: http://sveiby.com/articles/IntangibleMethods.htm (accessed April 16, 2003).
LinkingIC and IP
1185


![winprotocoldoc.blob.core.windows.net... · Web view[MS-OLEPS]: Object Linking and Embedding (OLE) Property Set Data Structures. Intellectual Property Rights Notice for Open Specifications](https://img.pdfslide.net/doc/110x75/5a9b38327f8b9aba4a8dc948/viewms-oleps-object-linking-and-embedding-ole-property-set-data-structures.jpg)


![Microsoft - Introduction... · Web view[MS-OLEPS]: Object Linking and Embedding (OLE) Property Set Data Structures Intellectual Property Rights Notice for Open Specifications Documentation](https://img.pdfslide.net/doc/110x75/5f220a32e7092046033ad02b/microsoft-introduction-web-view-ms-oleps-object-linking-and-embedding.jpg)