Embed Size (px)
Citation preview
Linking qualitative survey responses with quantitative data
Methodology, quality and data analysis from the matching of the ECB/EC Survey on Access to Finance of Enterprises and the Amadeus database
Katarzyna Bańkowska1, Małgorzata Osiewicz, Sébastien Pérez-Duarte
Abstract
Timely, comparable, and good quality information on micro, small and medium-sized enterprises (SMEs) is scarce. Business surveys partially fill this gap by providing timely and harmonised data. However, there are some limitations when a survey is conducted via telephone, given the restricted length of interview and respondent’s difficulties in answering questions related to the accounting concepts or statistical classifications. In this respect business registers containing financial information – even though the timeliness is less than optimal – are valuable enhancements to qualitative surveys.
This paper presents the results from the matching of the European Commission & ECB Survey on Access to Finance of Enterprises (SAFE) with Bureau van Dijk’s Amadeus database. First, we describe the linking methodology, which preserves confidentiality of the respondents, and identify the most effective matching variables. Then, we examine the quality of the matching, highlighting varying success rates depending on the firm characteristics like size, sector and age. Finally, we also inspect the bias that may occur in the SAFE aggregated results when using the effectively matched sample.
Keywords: Business Registers, Small and Medium-Sized Enterprises, Record Linking, Survey Data
JEL classification: C81, C83
1 Corresponding author: [email protected]. All authors are from the European Central Bank
Linking qualitative survey responses with quantitative data 1
Contents
1 Introduction ....................................................................................................................................... 2
2 Description of the data and matching methodology ....................................................... 4
2.1 Datasets .................................................................................................................................... 4
2.1.1 The ECB-EC SAFE ................................................................................................ 4
2.1.2 Amadeus ................................................................................................................ 4
2.2 The matching methodology ............................................................................................. 5
3 Matching of the SAFE respondents .......................................................................................... 7
3.1 Overall outcome and quality of the matching process ......................................... 7
3.2 Detailed analysis of the matching .................................................................................. 7
4 Analysis of the matched data ................................................................................................... 10
4.1 Cross-validation of enterprise characteristics in SAFE and Amadeus dataset ..................................................................................................................................... 10
4.2 Availability of financial information in Amadeus.................................................... 12
4.2.1 Relative and effective availability within the matched enterprises12
4.3 Impact of matching process on SAFE estimates .................................................... 17
4.3.1 Variation in the effective availability leads to a biased sample ..... 17
4.3.2 Can weights correct the bias? ...................................................................... 19
4.4 Comparison with Amadeus estimates ........................................................................ 23
5 Conclusion ........................................................................................................................................ 24
6 References ........................................................................................................................................ 25
1 Introduction
The information about how firms perceive their access to finance is very important for central banks, in particular, in an environment of impaired credit transmission. Small and young enterprises are by nature riskier and thus are relatively more affected by limited access to external financing (see Ferrando, Griesshaber 2011). Given that firms with less than 250 employees account for 99.8% of all firms in the
2 Linking qualitative survey responses with quantitative data
euro area and that they create 69%2 of jobs it is of high importance to analyse their financial situation in a timely manner.
The European Commission and the European Central Bank Survey on Access to Finance of Enterprises (SAFE) is a qualitative telephone survey conducted to collect timely information about the financing conditions for micro, small and medium enterprises, with a limited number of large companies also included for comparison purposes.3
The information collected from the survey has proven to be very useful in itself for the short-term and structural analysis of financial constraints. However, more analytical uses of the data require quantitative information about the enterprises, which would enable to measure the link between the opinion of the companies and their financial situation, in terms of turnover, indebtedness, profit developments, etc. Given the restricted length of the interview and respondents’ difficulties in answering on the phone questions related to quantitative accounting elements, it is not feasible to collect this information from the company from the survey. Consequently, an alternative solution was needed: matching the results of the survey responses with individual financial information from the business register. The simplest approach would have been to use the same register as the one used for the sample that is Dun & Bradstreet (D&B). However, D&B does not have available a sufficient number of balance sheet and income account elements, whereas Bureau van Dijk’s Amadeus database has the required information and covers a significant fraction of the population of enterprises. The exercise is thus a triple match, between the firms sampled from D&B, the firms participating in the survey, and the firms available in Amadeus.
Any attempt to match multiple and distinct databases will lead to some non-coverage error, arising from a variety of causes. The more different are the databases, and the more likely it is that many of the observations will either not be matched, or the quality of the match will be uncertain. An aggravating factor is the lack of a common and unique identifier shared by the different databases, which has to be circumvented by less reliable or imperfect solutions, requiring in turn an assessment of the correctness of the match.
Being able to cope with some non-matching error is in any case needed, but the statistician producing the matched data and the analyst using it first need to be convinced of the overall quality of the match and the biases or discrepancies introduced into the data by the matching process.
An additional cause of concern is the imperfect nature of the business registers and the measurement error in the survey itself. Business registers do not necessarily contain all enterprises, and even if they do, balance sheet or profit and loss statements are missing for some of them. The information on the company size, the sector, the address might be outdated or incorrect. Survey respondents may, intentionally or not, provide the inaccurate answers to the questions in the survey, including the demographic characteristics like size and sector of the enterprise.
2 Eurostat, Structural Business Statistics, reference year 2011. 3 Firms are classified in the SAFE by the number of employees. Micro firms have 1 to 9 employees, small
firms 10 to 49, medium-size firms 50 to 249 and large firms 250 or more.
Linking qualitative survey responses with quantitative data 3
When crossing the survey and the register data, it is not an easy task to determine which piece of information reflects the true state of the company.
Finally, in some countries, business registers are of high quality and cover all non-financial corporations. In other countries, information is partial and does not cover all types of firms; particularly smaller firms may be exempted from reporting annual accounts and thus may not be included in the registers. The matched data may therefore not be a “faithful” image of the enterprise population in the same way that the initial stratified random sample was. Analysts should therefore be aware of this issue and should have the means to at least estimate the effect of the matching on their results.
In the paper we present the analysis based on the enterprises that participated in SAFE at least ones between 3rd and 10th survey round (September 2010 to March 2014). While the 10th wave is the last available, the first two waves of the survey were conducted by another survey company and the enterprises that took part only in those early waves were not included in the matching exercise.
The objective of this paper is to present the methodology and the quality assessment of this matching. In section 2, we describe the datasets used and the methodology of the match. The outcome of the matching process is presented in section 3, while in section 4 we analyse the results of the matching, both within the matched data, with the main SAFE dataset, and with the Amadeus dataset itself. The last section concludes the paper.
2 Description of the data and matching methodology
2.1 Datasets
2.1.1 The ECB-EC SAFE
The Survey on Access to Finance of Enterprises (SAFE) is a qualitative telephone survey conducted for the European Commission and the European Central Bank to assess the developments of the financing conditions of firms. A subset of the survey is run by the ECB every six months in the euro area countries. A more comprehensive version of the survey with an extended questionnaire is run every year starting in 2013 (from 2009 to 2013, every two years), together with the European Commission. The survey is conducted by an external company with the sample drawn from D&B.
2.1.2 Amadeus
Amadeus is a proprietary database maintained by Bureau van Dijk (BvD) of comparable financial information for public and private companies in Europe. It contains balance sheet and profit and loss account information on 21 million companies, combining different information providers. Not all enterprises are covered by Amadeus, and even when companies are covered, financial information might not be present (see ECB 2013, p. 115 and onwards).
4 Linking qualitative survey responses with quantitative data
2.2 The matching methodology
For the business register to be suitable for the purpose of enriching the SAFE data it must cover with sufficient quality all euro area countries and enterprises of all sizes. While there are several databases on firm-level information, they are often specific to listed companies, the largest firms or to particular sectors. The selected provider – the Amadeus database of BvD – attempts to cover all firms, from micro to large.
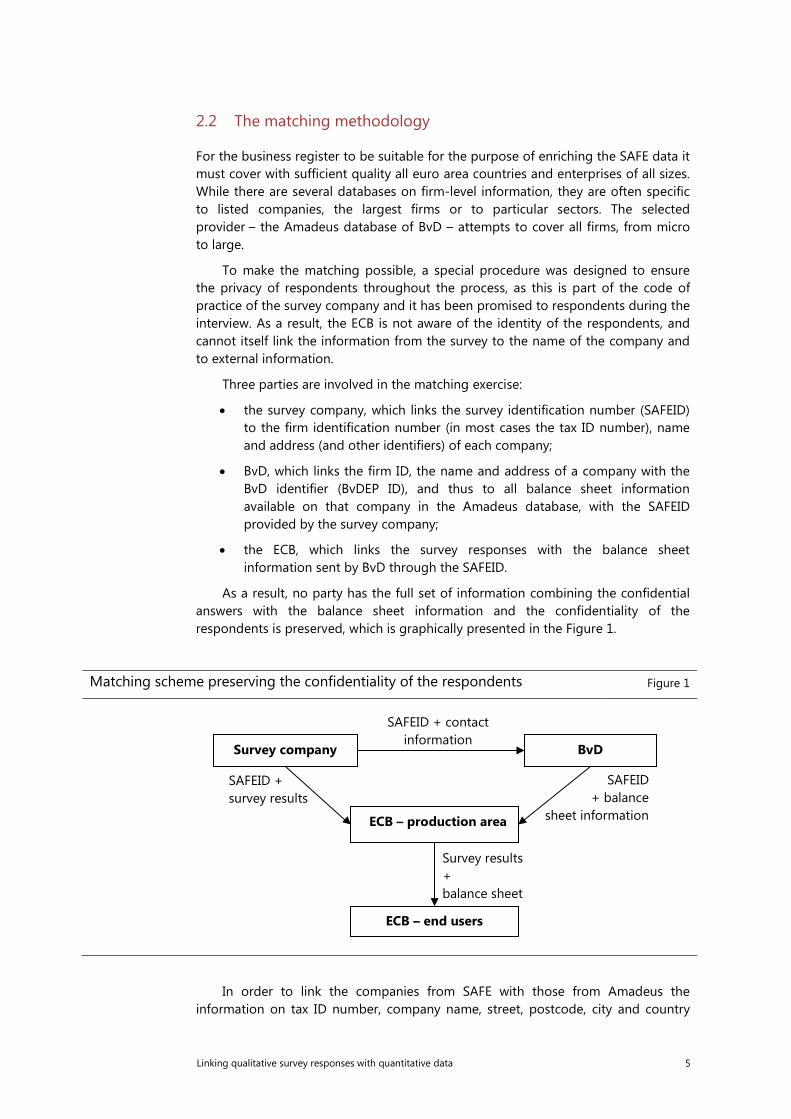
To make the matching possible, a special procedure was designed to ensure the privacy of respondents throughout the process, as this is part of the code of practice of the survey company and it has been promised to respondents during the interview. As a result, the ECB is not aware of the identity of the respondents, and cannot itself link the information from the survey to the name of the company and to external information.
Three parties are involved in the matching exercise:
• the survey company, which links the survey identification number (SAFEID) to the firm identification number (in most cases the tax ID number), name and address (and other identifiers) of each company;
• BvD, which links the firm ID, the name and address of a company with the BvD identifier (BvDEP ID), and thus to all balance sheet information available on that company in the Amadeus database, with the SAFEID provided by the survey company;
• the ECB, which links the survey responses with the balance sheet information sent by BvD through the SAFEID.
As a result, no party has the full set of information combining the confidential answers with the balance sheet information and the confidentiality of the respondents is preserved, which is graphically presented in the Figure 1.
Matching scheme preserving the confidentiality of the respondents Figure 1
In order to link the companies from SAFE with those from Amadeus the information on tax ID number, company name, street, postcode, city and country
Survey company BvD
ECB – production area
ECB – end users
SAFEID + contact information
SAFEID + survey results
SAFEID + balance
sheet information
Survey results + balance sheet
Linking qualitative survey responses with quantitative data 5
are used. The variable ‘outcome’ identifies which information contributed to the successful match with the following categories:
1: unique match based on the tax ID number
2: unique match based on the company name, address, postcode, city and country
3: unique match based on the company name, postcode, city and country
4: unique match based on the company name and country
8: several matches based on one of the criteria, but no unique match
9: no match at all
The BvD uses the proprietary matching algorithm CINS (Company Identification Number Search) that is a mixture of exact matching (in case the company can be identified on the basis of the tax identification) and approximate matching, when the match is achieved on the basis of other information which may deviate to certain extent between two sources, such as combination of company name, address, postal code.
It should be noted that the concept is different from statistical matching, that aims at linking units which are similar with regard to certain characteristics and do not need to come from overlapping datasets. In case of SAFE dataset, this could be achieved by assigning the financial values from a donor company or averaging the values of companies in the same country, sector and size. Such attempts were undertaken for the SAFE dataset, where notably Amadeus database served as a population source for donor companies (see Ferrando, Mulier 2013). However, in this paper ‘matching’ refers to ‘record linking’ (following Eurostat 2013), where the aim is to connect the identical units from overlapping sources.
To link the records, the BvD matching algorithm first searches for potential candidates companies, which are later evaluated on the basis of similarity to the record in the source dataset. In the initial step, two datasets are ‘normalized’ by detecting and unifying references to legal forms, applying lowercase operator, replacing punctuation signs by a blank, converting synonyms to a simple form using synonyms dictionaries and skipping non-relevant words. The normalization rules are tailored to the specificities of the field (name, street, postcode, city, country, phone and fax, web and email, identification numbers) and may vary by country. Importantly, the BvD matching software supports local characters such as Hungarian, German or Polish and applies transliteration converting text into common and comparable script enabling cross-alphabet matching.
In the second step, the procedure applies so called n-grams, i.e. splitting text into a contiguous sequence of n characters. For matching of the SAFE, the BvD matching algorithm uses 3-grams, e.g. for “McDonald's Corporation” those are: MCD, CDO, DON, ONA, NAL, ALD, LDS, DSC, SCO, COR, ORP, RPO, POR, ORA, RAT, ATI, TIO, ION. Then the n-grams in both datasets are matched, but only the most relevant are selected and n-grams with many occurrences have lower weight in the comparison. On this basis, a proximity measure for each field from two sources is computed for given record. Then a weighted average is calculated for each record, where the weight is based on the probability of finding a company in the BvD database corresponding to the criterion being searched, i.e. the more occurrences are found, the less the field is significant. Finally, the accuracy is translated into the
6 Linking qualitative survey responses with quantitative data
percentage matching score: A (excellent match - score at least 95%), B (good – score between 85 and 95%), C (fair - score between 75 and 85%), D (weak - score between 60 and 75%) and E (poor – score below 60%). Then the matching can result in: i) uniquely matched companies, ii) multiple matches of a SAFE respondent to two or more records from Amadeus, and iii) respondents not matched at all. A multiple match is considered as a single match, if among the multiple records there is only one with a high score of “excellent” or “good”. In other cases the outcome is considered as no match.
3 Matching of the SAFE respondents
3.1 Overall outcome and quality of the matching process
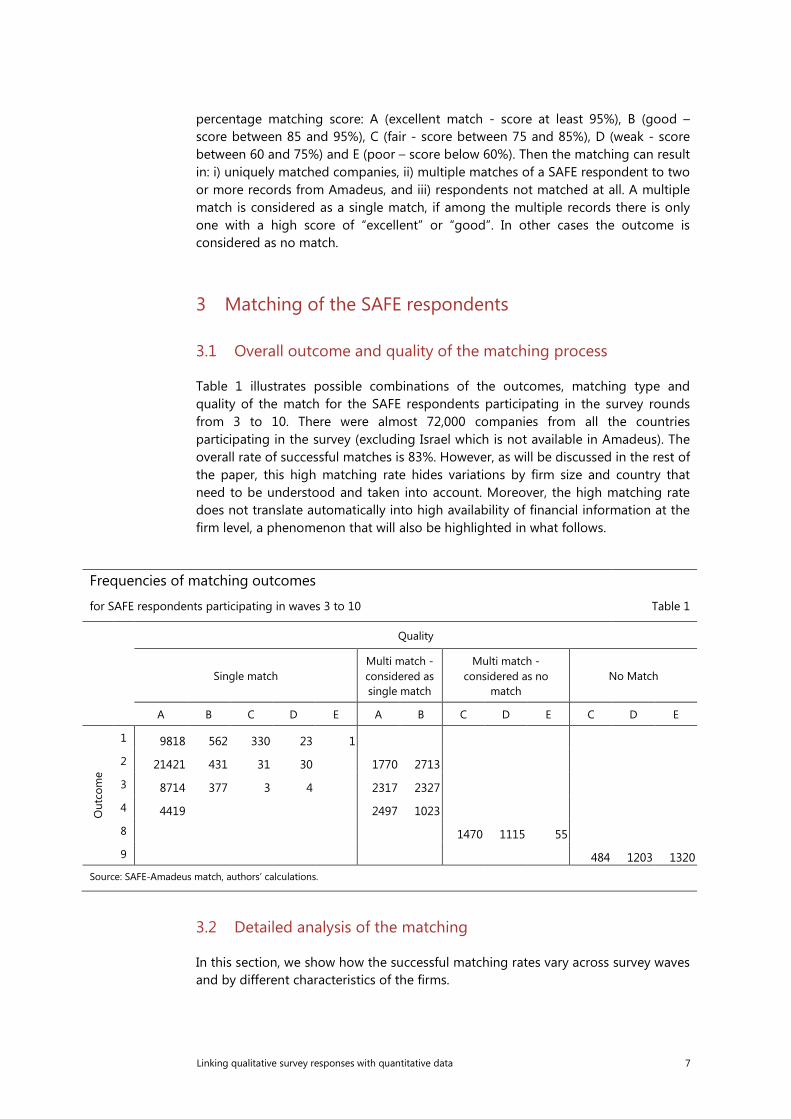
Table 1 illustrates possible combinations of the outcomes, matching type and quality of the match for the SAFE respondents participating in the survey rounds from 3 to 10. There were almost 72,000 companies from all the countries participating in the survey (excluding Israel which is not available in Amadeus). The overall rate of successful matches is 83%. However, as will be discussed in the rest of the paper, this high matching rate hides variations by firm size and country that need to be understood and taken into account. Moreover, the high matching rate does not translate automatically into high availability of financial information at the firm level, a phenomenon that will also be highlighted in what follows.
Frequencies of matching outcomes
for SAFE respondents participating in waves 3 to 10 Table 1
Quality
Single match
Multi match - considered as single match
Multi match - considered as no
match No Match
A B C D E A B C D E C D E
Out
com
e
1 9818 562 330 23 1 2 21421 431 31 30
1770 2713
3 8714 377 3 4
2317 2327 4 4419
2497 1023
8
1470 1115 55
9
484 1203 1320
Source: SAFE-Amadeus match, authors’ calculations.
3.2 Detailed analysis of the matching
In this section, we show how the successful matching rates vary across survey waves and by different characteristics of the firms.
Linking qualitative survey responses with quantitative data 7
The overall matching rate does not differ significantly across waves (Table 2). The tax ID, which is the best way to identify uniquely an enterprise, is available for the SAFE respondents only from wave 9 onwards. This is reflected in higher frequency of “single matches” counterbalanced by a drop in the category “multiple match - considered as single match” in the last two waves.
The number of pure “no matches” has stayed stable overall, with only a small drop in the last two waves. The overall single matching rate has increased from around 80% in the first waves to 87% in the last ones, as the availability of firm identifiers common to both the sample and Amadeus has increased.
Matching rates (%)
by type of match across waves Table 2
Wave
Type of match 3 4 5 6 7 8 9 10
Single match 51 52 61 69 64 64 77 75
Multi match - considered as single match 30 27 21 15 17 21 9 12
Multi match - considered as no match 7 8 11 5 4 3 5 3
No match 12 13 7 12 15 12 9 10
Source: SAFE-Amadeus match, authors’ calculations.
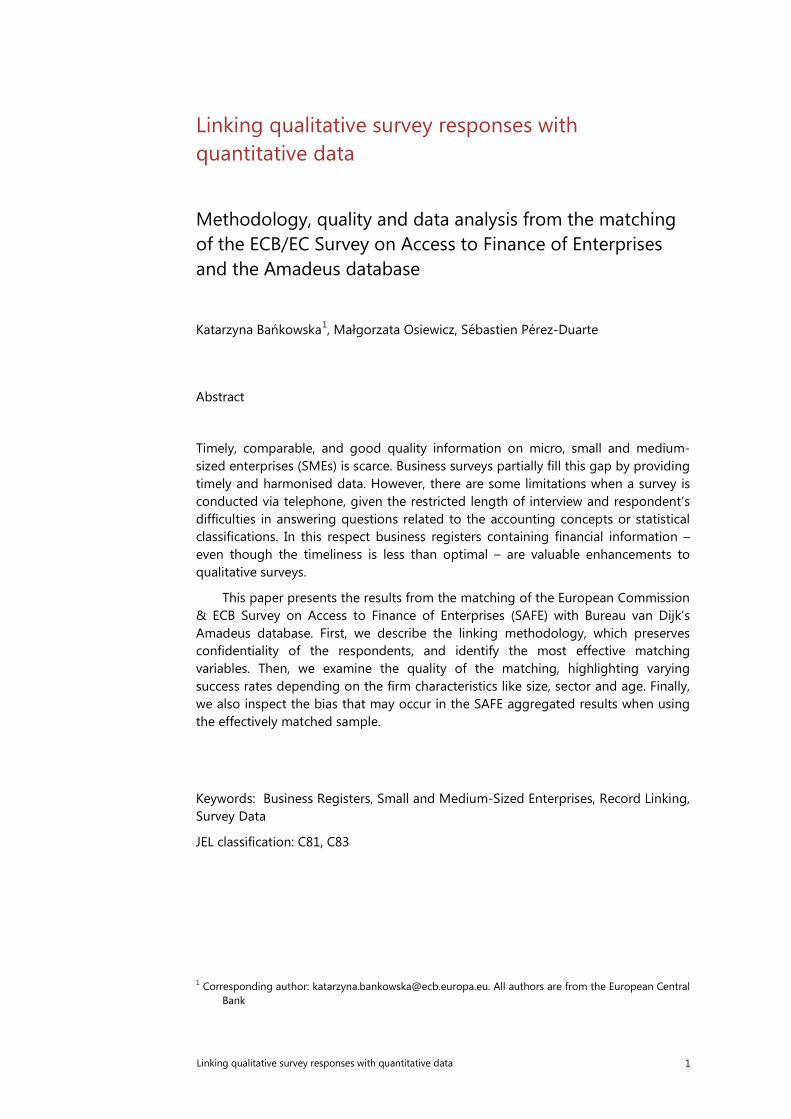
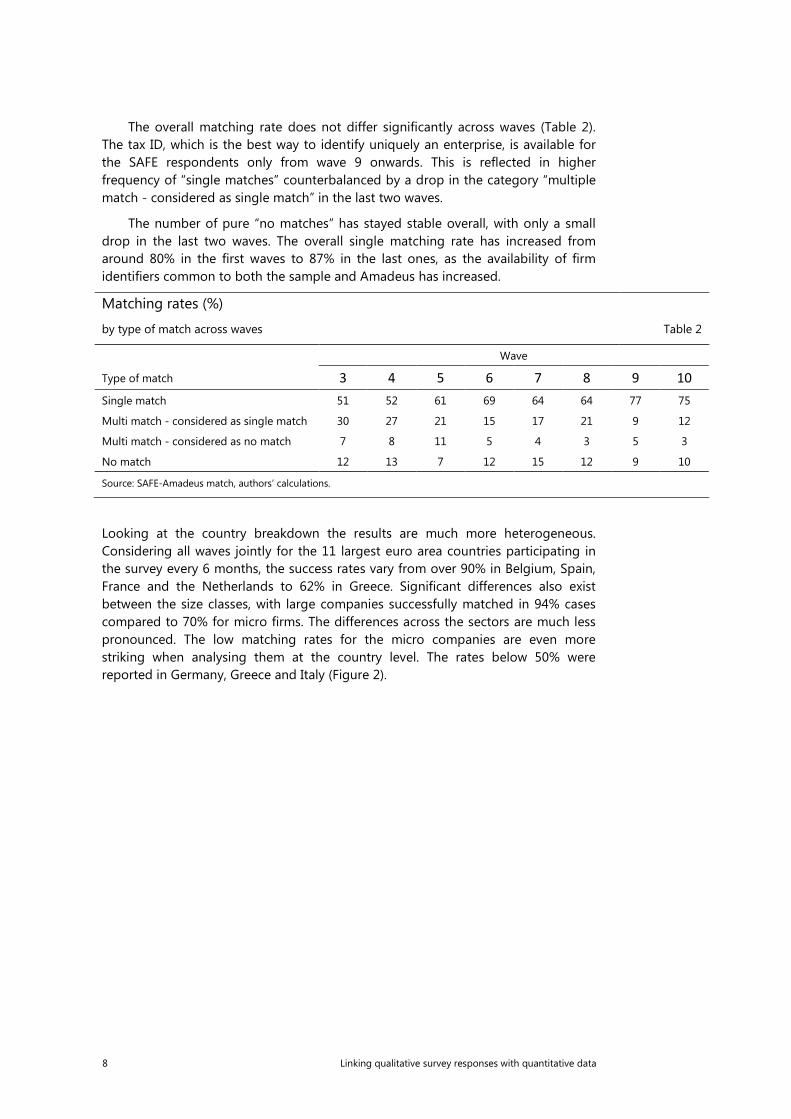
Looking at the country breakdown the results are much more heterogeneous. Considering all waves jointly for the 11 largest euro area countries participating in the survey every 6 months, the success rates vary from over 90% in Belgium, Spain, France and the Netherlands to 62% in Greece. Significant differences also exist between the size classes, with large companies successfully matched in 94% cases compared to 70% for micro firms. The differences across the sectors are much less pronounced. The low matching rates for the micro companies are even more striking when analysing them at the country level. The rates below 50% were reported in Germany, Greece and Italy (Figure 2).
8 Linking qualitative survey responses with quantitative data
Matching rates by country, enterprise size and sector
Euro area, 11 largest countries, waves 3 to 10 Figure 2
Source: SAFE-Amadeus match, authors’ calculations.
40% 50% 60% 70% 80% 90% 100%
ATBEDEESFI
FRGRIEIT
NLPT
MicroSmall
MediumLarge
IndustryConstruction
TradeServices
30%
40%
50%
60%
70%
80%
90%
100%
AT BE DE ES FI FR GR IE IT NL PT
micro small medium large
Linking qualitative survey responses with quantitative data 9
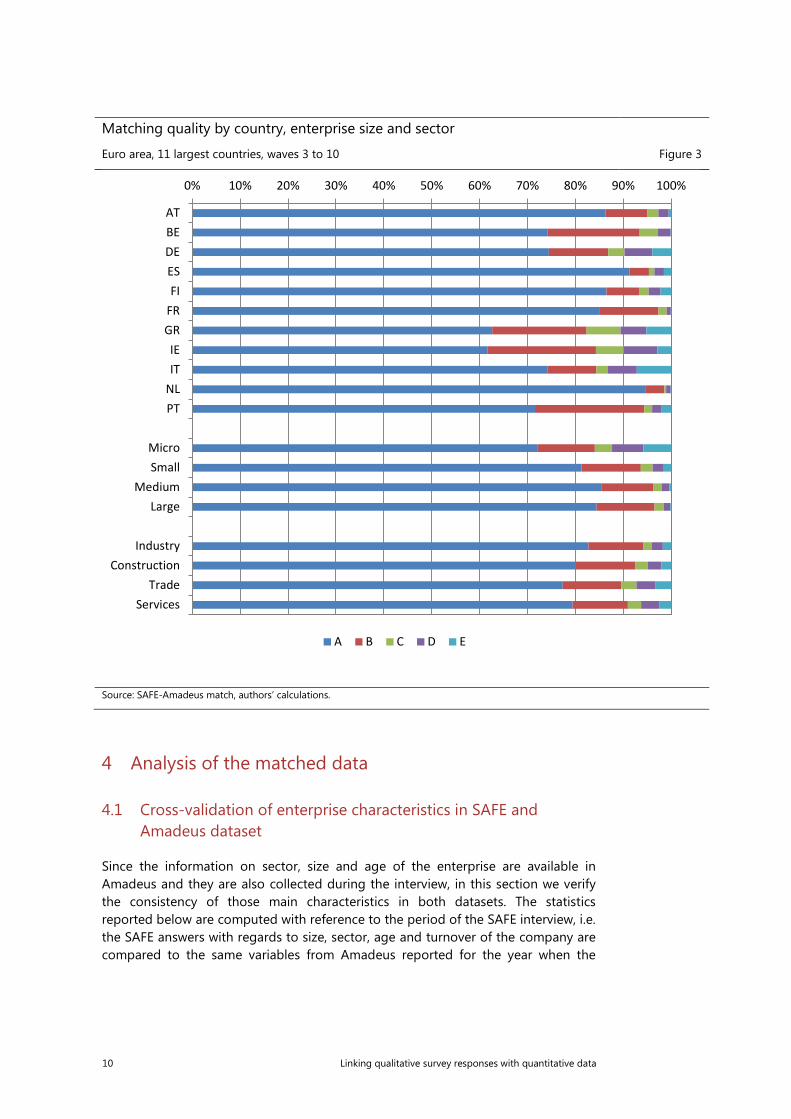
Matching quality by country, enterprise size and sector
Euro area, 11 largest countries, waves 3 to 10 Figure 3
Source: SAFE-Amadeus match, authors’ calculations.
4 Analysis of the matched data
4.1 Cross-validation of enterprise characteristics in SAFE and Amadeus dataset
Since the information on sector, size and age of the enterprise are available in Amadeus and they are also collected during the interview, in this section we verify the consistency of those main characteristics in both datasets. The statistics reported below are computed with reference to the period of the SAFE interview, i.e. the SAFE answers with regards to size, sector, age and turnover of the company are compared to the same variables from Amadeus reported for the year when the
0% 10% 20% 30% 40% 50% 60% 70% 80% 90% 100%
ATBEDEESFI
FRGRIEIT
NLPT
MicroSmall
MediumLarge
IndustryConstruction
TradeServices
A B C D E
10 Linking qualitative survey responses with quantitative data
particular company was interviewed4. Consequently, the panellists are included as many times as they participated in the survey.
Sector information from Amadeus database is reported at the two digit level according to NACE Rev. 2 which was aggregated into the categories used in SAFE. The sectors are aligned in 72% of cases and there were a few instances only when it was not available in Amadeus. Concerning the size of the enterprises, measured by the number of employees and grouped into four classes, the categories overlap in 53% of cases with high percentage of companies with missing information in Amadeus. Excluding the records with the missing size, the same size classes were reported for 82% of companies.
Regarding the age, in 86% of instances the information is consistent between both sources. Most of the companies surveyed in SAFE are older than 10 years and for those the information coincides in 93% of cases. However, the younger the company and the smaller the brackets, the lower the consistency between two sources. It is also noticeable, that the respondents, who could not specify the year of incorporation during the interview belong mostly to the companies classified as older than 10 years in Amadeus. This can stem from the fact that the respondents might not be familiar with the details of setting-up the company which was created more than a decade before, especially if they have joined the company relatively recently.
As for the turnover, the variable available from Amadeus is originally continuous whereas in SAFE this information is collected in four brackets. For the non-missing observations, the categories overlap in 51% of the cases, while for as many as 38% of the companies the information is not available in Amadeus.
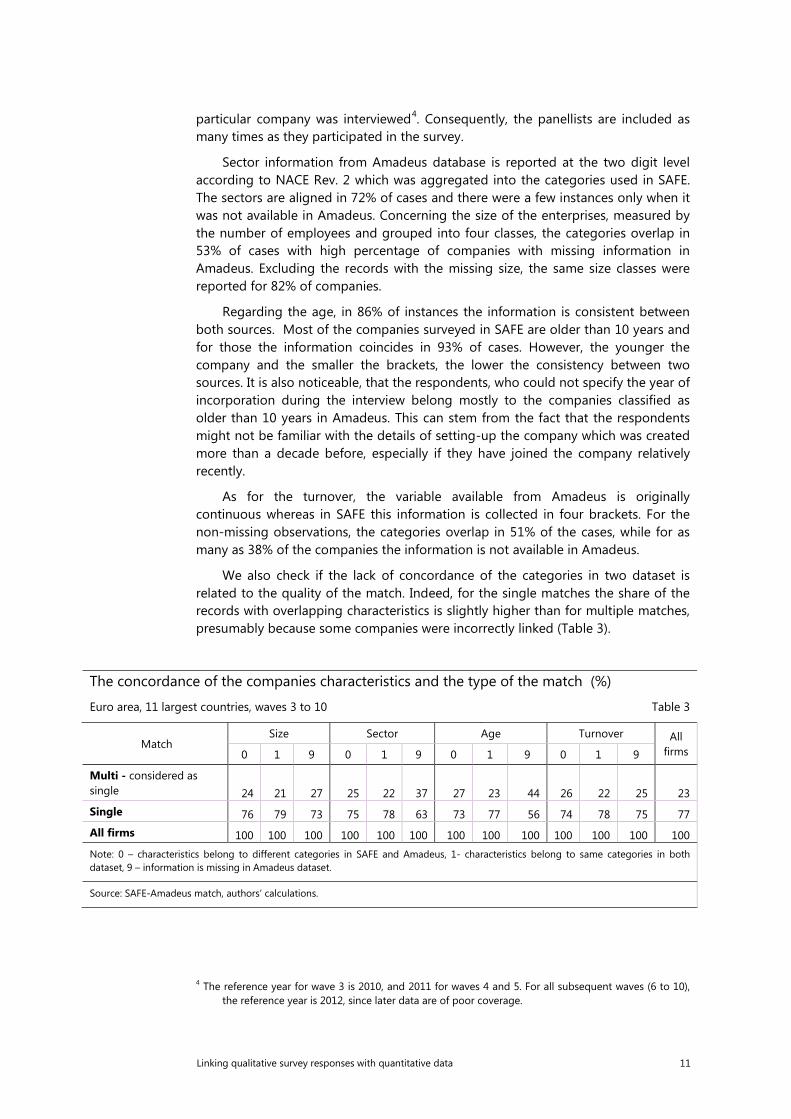
We also check if the lack of concordance of the categories in two dataset is related to the quality of the match. Indeed, for the single matches the share of the records with overlapping characteristics is slightly higher than for multiple matches, presumably because some companies were incorrectly linked (Table 3).
The concordance of the companies characteristics and the type of the match (%)
Euro area, 11 largest countries, waves 3 to 10 Table 3
Match Size Sector Age Turnover All
firms 0 1 9 0 1 9 0 1 9 0 1 9
Multi - considered as single 24 21 27 25 22 37 27 23 44 26 22 25 23 Single 76 79 73 75 78 63 73 77 56 74 78 75 77 All firms 100 100 100 100 100 100 100 100 100 100 100 100 100 Note: 0 – characteristics belong to different categories in SAFE and Amadeus, 1- characteristics belong to same categories in both dataset, 9 – information is missing in Amadeus dataset.
Source: SAFE-Amadeus match, authors’ calculations.
4 The reference year for wave 3 is 2010, and 2011 for waves 4 and 5. For all subsequent waves (6 to 10), the reference year is 2012, since later data are of poor coverage.
Linking qualitative survey responses with quantitative data 11
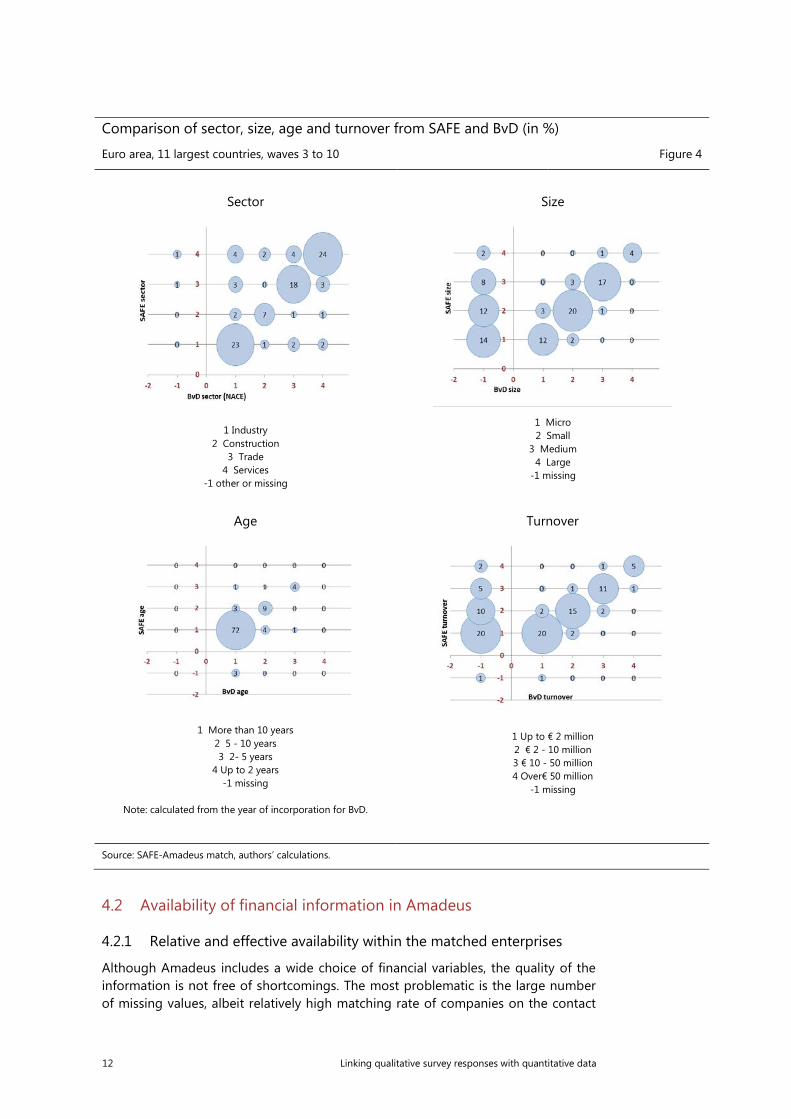
Comparison of sector, size, age and turnover from SAFE and BvD (in %)
Euro area, 11 largest countries, waves 3 to 10 Figure 4
Sector
1 Industry
2 Construction 3 Trade
4 Services -1 other or missing
Size
1 Micro 2 Small
3 Medium 4 Large
-1 missing
Age
1 More than 10 years
2 5 - 10 years 3 2- 5 years
4 Up to 2 years -1 missing
Note: calculated from the year of incorporation for BvD.
Turnover
1 Up to € 2 million 2 € 2 - 10 million 3 € 10 - 50 million 4 Over€ 50 million
-1 missing
Source: SAFE-Amadeus match, authors’ calculations.
4.2 Availability of financial information in Amadeus
4.2.1 Relative and effective availability within the matched enterprises
Although Amadeus includes a wide choice of financial variables, the quality of the information is not free of shortcomings. The most problematic is the large number of missing values, albeit relatively high matching rate of companies on the contact
12 Linking qualitative survey responses with quantitative data
information. In this section we present the availability of various financial variables over time, by country and size class.
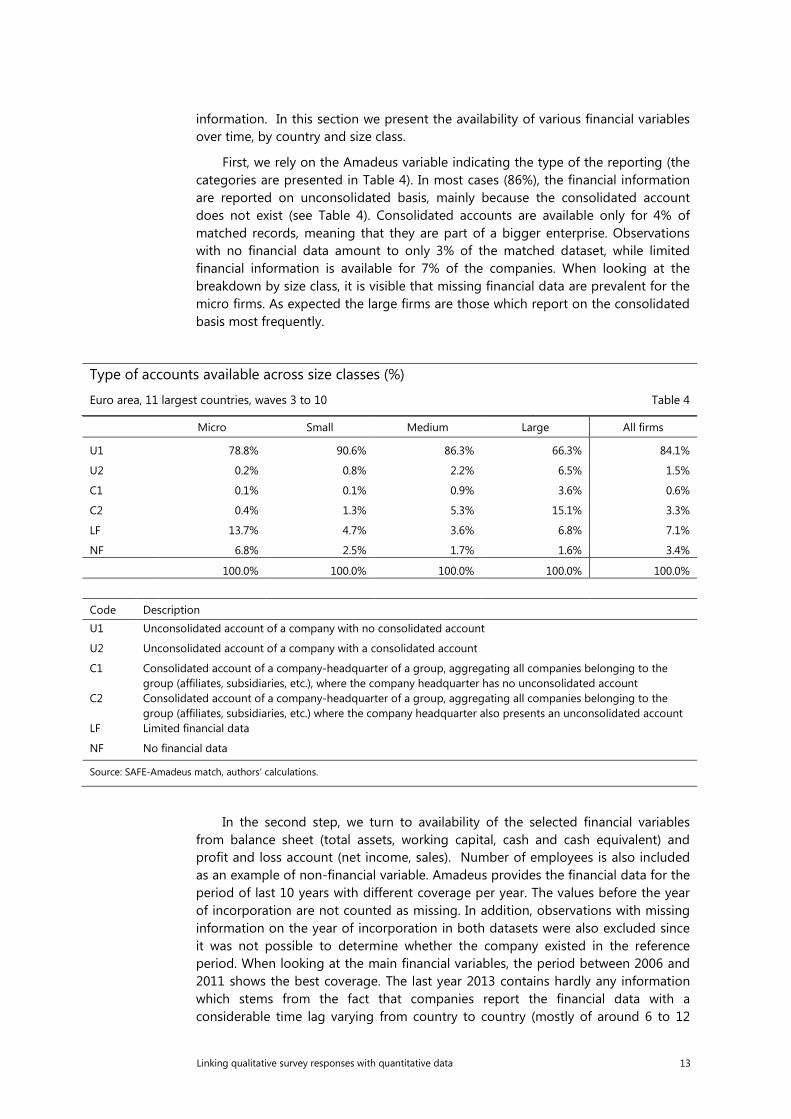
First, we rely on the Amadeus variable indicating the type of the reporting (the categories are presented in Table 4). In most cases (86%), the financial information are reported on unconsolidated basis, mainly because the consolidated account does not exist (see Table 4). Consolidated accounts are available only for 4% of matched records, meaning that they are part of a bigger enterprise. Observations with no financial data amount to only 3% of the matched dataset, while limited financial information is available for 7% of the companies. When looking at the breakdown by size class, it is visible that missing financial data are prevalent for the micro firms. As expected the large firms are those which report on the consolidated basis most frequently.
Type of accounts available across size classes (%)
Euro area, 11 largest countries, waves 3 to 10 Table 4
Micro Small Medium Large All firms
U1 78.8% 90.6% 86.3% 66.3% 84.1%
U2 0.2% 0.8% 2.2% 6.5% 1.5%
C1 0.1% 0.1% 0.9% 3.6% 0.6%
C2 0.4% 1.3% 5.3% 15.1% 3.3%
LF 13.7% 4.7% 3.6% 6.8% 7.1%
NF 6.8% 2.5% 1.7% 1.6% 3.4%
100.0% 100.0% 100.0% 100.0% 100.0%
Code Description
U1 Unconsolidated account of a company with no consolidated account
U2 Unconsolidated account of a company with a consolidated account
C1 Consolidated account of a company-headquarter of a group, aggregating all companies belonging to the group (affiliates, subsidiaries, etc.), where the company headquarter has no unconsolidated account
C2 Consolidated account of a company-headquarter of a group, aggregating all companies belonging to the group (affiliates, subsidiaries, etc.) where the company headquarter also presents an unconsolidated account
LF Limited financial data
NF No financial data
Source: SAFE-Amadeus match, authors’ calculations.
In the second step, we turn to availability of the selected financial variables from balance sheet (total assets, working capital, cash and cash equivalent) and profit and loss account (net income, sales). Number of employees is also included as an example of non-financial variable. Amadeus provides the financial data for the period of last 10 years with different coverage per year. The values before the year of incorporation are not counted as missing. In addition, observations with missing information on the year of incorporation in both datasets were also excluded since it was not possible to determine whether the company existed in the reference period. When looking at the main financial variables, the period between 2006 and 2011 shows the best coverage. The last year 2013 contains hardly any information which stems from the fact that companies report the financial data with a considerable time lag varying from country to country (mostly of around 6 to 12
Linking qualitative survey responses with quantitative data 13
months). In addition, up to 3 months are necessary for the data to be incorporated in the final Amadeus database5.
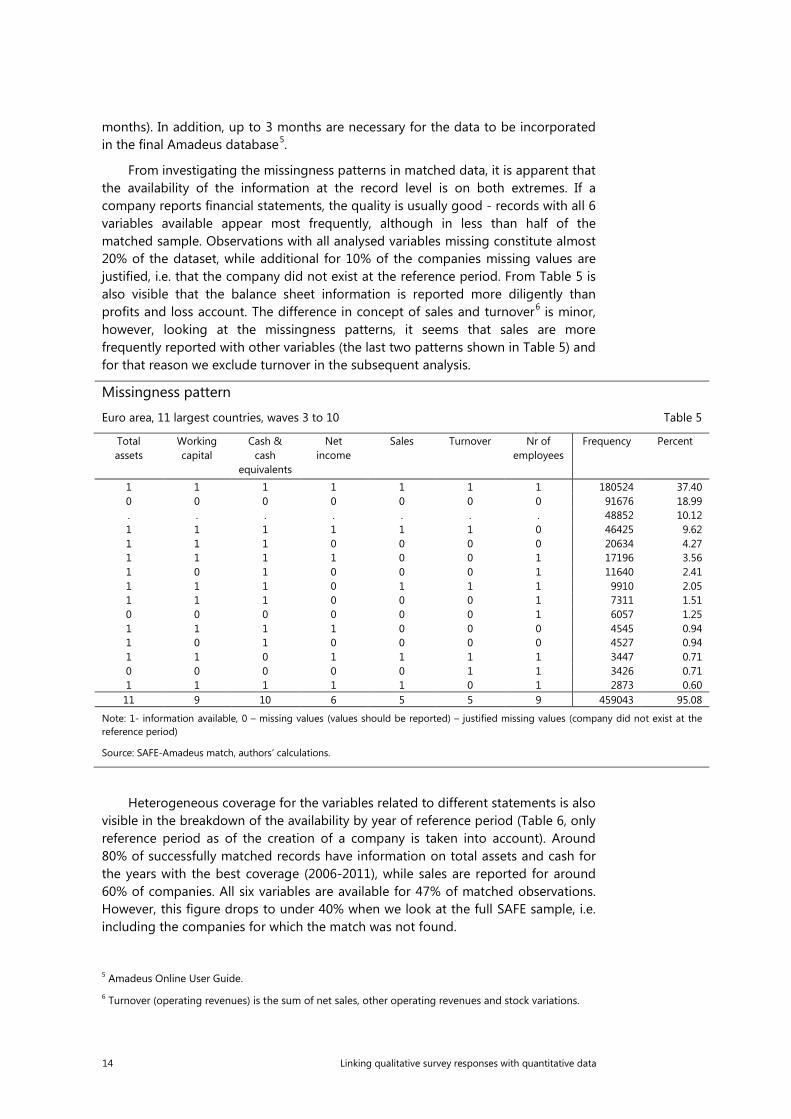
From investigating the missingness patterns in matched data, it is apparent that the availability of the information at the record level is on both extremes. If a company reports financial statements, the quality is usually good - records with all 6 variables available appear most frequently, although in less than half of the matched sample. Observations with all analysed variables missing constitute almost 20% of the dataset, while additional for 10% of the companies missing values are justified, i.e. that the company did not exist at the reference period. From Table 5 is also visible that the balance sheet information is reported more diligently than profits and loss account. The difference in concept of sales and turnover6 is minor, however, looking at the missingness patterns, it seems that sales are more frequently reported with other variables (the last two patterns shown in Table 5) and for that reason we exclude turnover in the subsequent analysis.
Missingness pattern
Euro area, 11 largest countries, waves 3 to 10 Table 5 Total assets
Working capital
Cash & cash
equivalents
Net income
Sales Turnover Nr of employees
Frequency Percent
1 1 1 1 1 1 1 180524 37.40 0 0 0 0 0 0 0 91676 18.99 . . . . . . . 48852 10.12 1 1 1 1 1 1 0 46425 9.62 1 1 1 0 0 0 0 20634 4.27 1 1 1 1 0 0 1 17196 3.56 1 0 1 0 0 0 1 11640 2.41 1 1 1 0 1 1 1 9910 2.05 1 1 1 0 0 0 1 7311 1.51 0 0 0 0 0 0 1 6057 1.25 1 1 1 1 0 0 0 4545 0.94 1 0 1 0 0 0 0 4527 0.94 1 1 0 1 1 1 1 3447 0.71 0 0 0 0 0 1 1 3426 0.71 1 1 1 1 1 0 1 2873 0.60 11 9 10 6 5 5 9 459043 95.08
Note: 1- information available, 0 – missing values (values should be reported) – justified missing values (company did not exist at the reference period)
Source: SAFE-Amadeus match, authors’ calculations.
Heterogeneous coverage for the variables related to different statements is also visible in the breakdown of the availability by year of reference period (Table 6, only reference period as of the creation of a company is taken into account). Around 80% of successfully matched records have information on total assets and cash for the years with the best coverage (2006-2011), while sales are reported for around 60% of companies. All six variables are available for 47% of matched observations. However, this figure drops to under 40% when we look at the full SAFE sample, i.e. including the companies for which the match was not found.
5 Amadeus Online User Guide. 6 Turnover (operating revenues) is the sum of net sales, other operating revenues and stock variations.
14 Linking qualitative survey responses with quantitative data
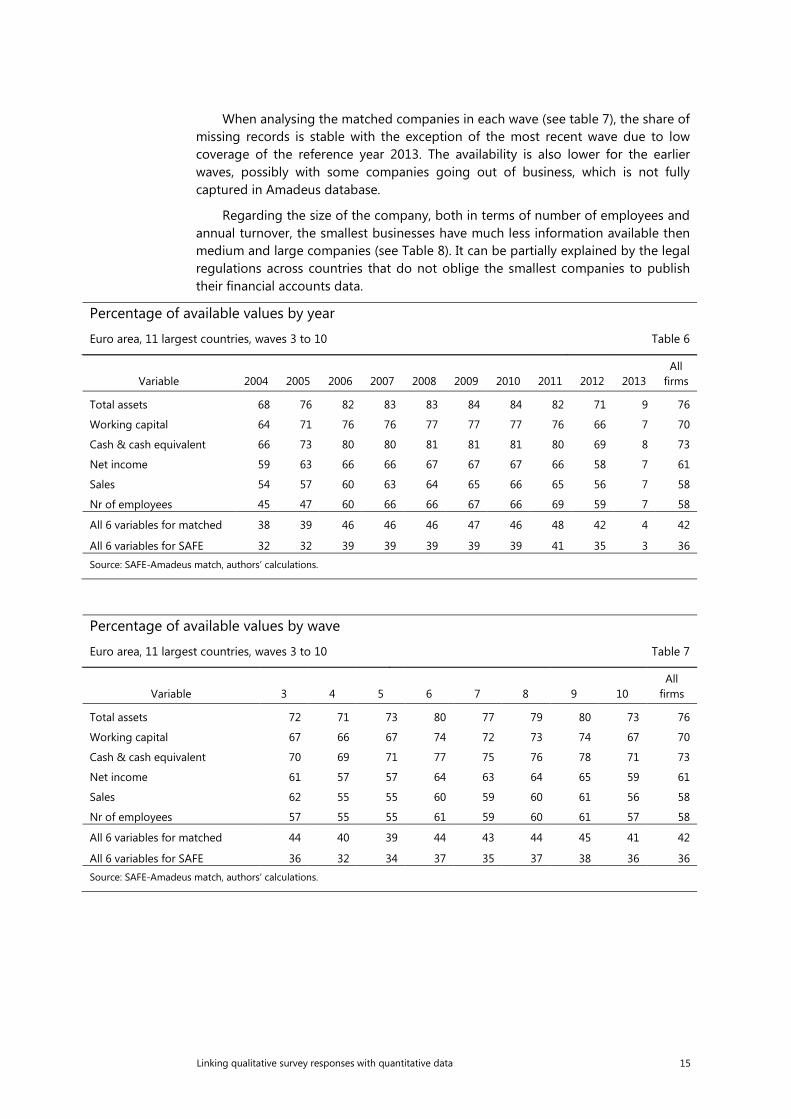
When analysing the matched companies in each wave (see table 7), the share of missing records is stable with the exception of the most recent wave due to low coverage of the reference year 2013. The availability is also lower for the earlier waves, possibly with some companies going out of business, which is not fully captured in Amadeus database.
Regarding the size of the company, both in terms of number of employees and annual turnover, the smallest businesses have much less information available then medium and large companies (see Table 8). It can be partially explained by the legal regulations across countries that do not oblige the smallest companies to publish their financial accounts data.
Percentage of available values by year
Euro area, 11 largest countries, waves 3 to 10 Table 6
Variable 2004 2005 2006 2007 2008 2009 2010 2011 2012 2013 All
firms
Total assets 68 76 82 83 83 84 84 82 71 9 76
Working capital 64 71 76 76 77 77 77 76 66 7 70
Cash & cash equivalent 66 73 80 80 81 81 81 80 69 8 73
Net income 59 63 66 66 67 67 67 66 58 7 61
Sales 54 57 60 63 64 65 66 65 56 7 58
Nr of employees 45 47 60 66 66 67 66 69 59 7 58
All 6 variables for matched 38 39 46 46 46 47 46 48 42 4 42
All 6 variables for SAFE 32 32 39 39 39 39 39 41 35 3 36 Source: SAFE-Amadeus match, authors’ calculations.
Percentage of available values by wave
Euro area, 11 largest countries, waves 3 to 10 Table 7
Variable 3 4 5 6 7 8 9 10 All
firms
Total assets 72 71 73 80 77 79 80 73 76
Working capital 67 66 67 74 72 73 74 67 70
Cash & cash equivalent 70 69 71 77 75 76 78 71 73
Net income 61 57 57 64 63 64 65 59 61
Sales 62 55 55 60 59 60 61 56 58
Nr of employees 57 55 55 61 59 60 61 57 58
All 6 variables for matched 44 40 39 44 43 44 45 41 42
All 6 variables for SAFE 36 32 34 37 35 37 38 36 36 Source: SAFE-Amadeus match, authors’ calculations.
Linking qualitative survey responses with quantitative data 15
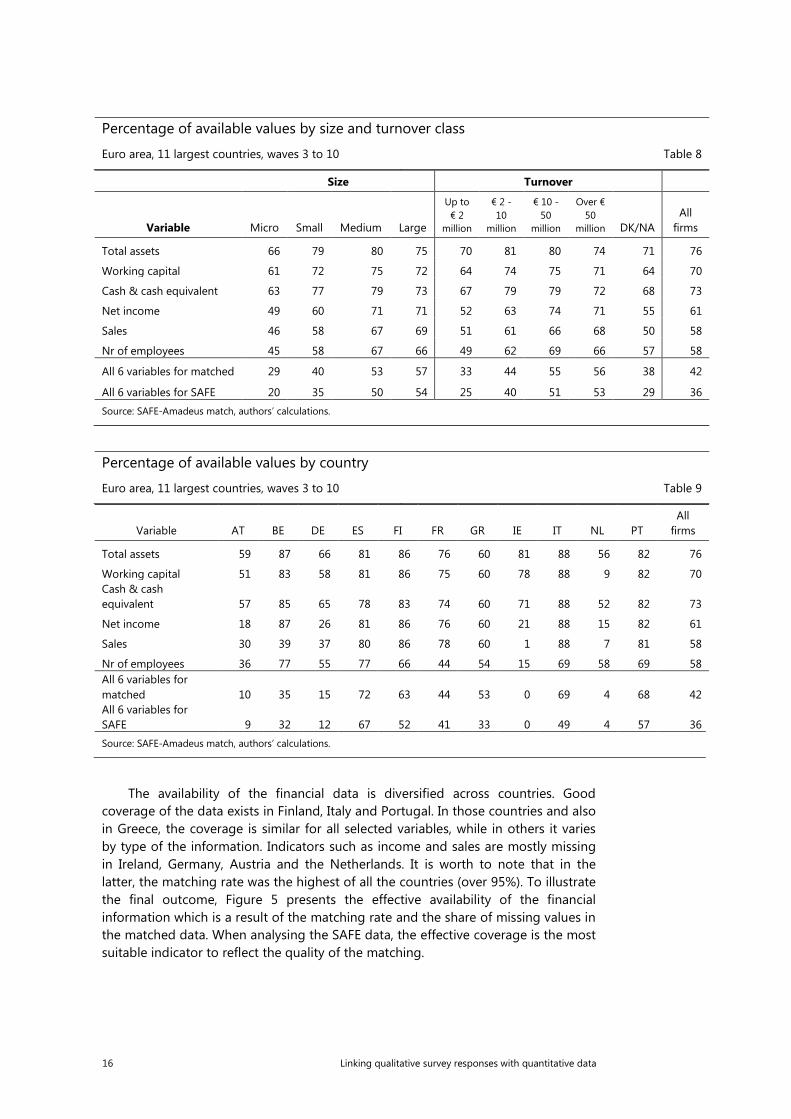
Percentage of available values by size and turnover class
Euro area, 11 largest countries, waves 3 to 10 Table 8
Size Turnover
Variable Micro Small Medium Large
Up to € 2
million
€ 2 - 10
million
€ 10 - 50
million
Over € 50
million DK/NA All
firms
Total assets 66 79 80 75 70 81 80 74 71 76
Working capital 61 72 75 72 64 74 75 71 64 70
Cash & cash equivalent 63 77 79 73 67 79 79 72 68 73
Net income 49 60 71 71 52 63 74 71 55 61
Sales 46 58 67 69 51 61 66 68 50 58
Nr of employees 45 58 67 66 49 62 69 66 57 58
All 6 variables for matched 29 40 53 57 33 44 55 56 38 42
All 6 variables for SAFE 20 35 50 54 25 40 51 53 29 36 Source: SAFE-Amadeus match, authors’ calculations.
Percentage of available values by country
Euro area, 11 largest countries, waves 3 to 10 Table 9
Variable AT BE DE ES FI FR GR IE IT NL PT All
firms
Total assets 59 87 66 81 86 76 60 81 88 56 82 76
Working capital 51 83 58 81 86 75 60 78 88 9 82 70 Cash & cash equivalent 57 85 65 78 83 74 60 71 88 52 82 73
Net income 18 87 26 81 86 76 60 21 88 15 82 61
Sales 30 39 37 80 86 78 60 1 88 7 81 58
Nr of employees 36 77 55 77 66 44 54 15 69 58 69 58 All 6 variables for matched 10 35 15 72 63 44 53 0 69 4 68 42 All 6 variables for SAFE 9 32 12 67 52 41 33 0 49 4 57 36 Source: SAFE-Amadeus match, authors’ calculations.
The availability of the financial data is diversified across countries. Good coverage of the data exists in Finland, Italy and Portugal. In those countries and also in Greece, the coverage is similar for all selected variables, while in others it varies by type of the information. Indicators such as income and sales are mostly missing in Ireland, Germany, Austria and the Netherlands. It is worth to note that in the latter, the matching rate was the highest of all the countries (over 95%). To illustrate the final outcome, Figure 5 presents the effective availability of the financial information which is a result of the matching rate and the share of missing values in the matched data. When analysing the SAFE data, the effective coverage is the most suitable indicator to reflect the quality of the matching.
16 Linking qualitative survey responses with quantitative data
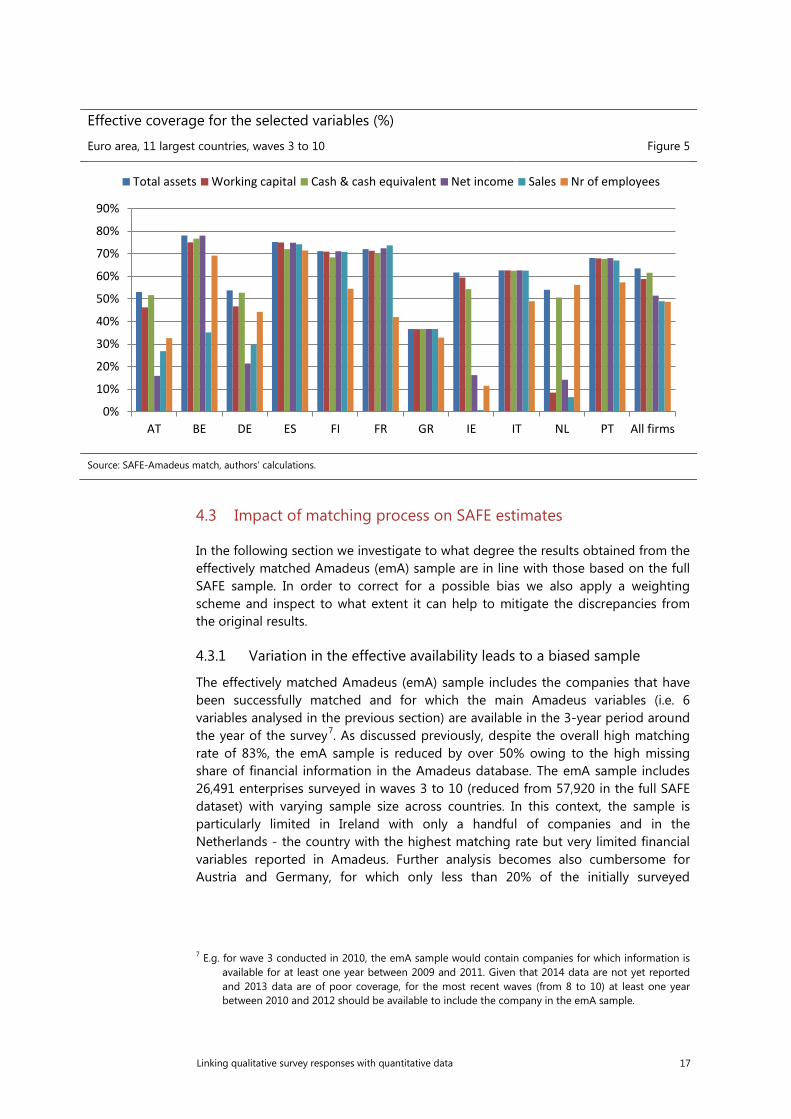
Effective coverage for the selected variables (%)
Euro area, 11 largest countries, waves 3 to 10 Figure 5
Source: SAFE-Amadeus match, authors’ calculations.
4.3 Impact of matching process on SAFE estimates
In the following section we investigate to what degree the results obtained from the effectively matched Amadeus (emA) sample are in line with those based on the full SAFE sample. In order to correct for a possible bias we also apply a weighting scheme and inspect to what extent it can help to mitigate the discrepancies from the original results.
4.3.1 Variation in the effective availability leads to a biased sample
The effectively matched Amadeus (emA) sample includes the companies that have been successfully matched and for which the main Amadeus variables (i.e. 6 variables analysed in the previous section) are available in the 3-year period around the year of the survey7. As discussed previously, despite the overall high matching rate of 83%, the emA sample is reduced by over 50% owing to the high missing share of financial information in the Amadeus database. The emA sample includes 26,491 enterprises surveyed in waves 3 to 10 (reduced from 57,920 in the full SAFE dataset) with varying sample size across countries. In this context, the sample is particularly limited in Ireland with only a handful of companies and in the Netherlands - the country with the highest matching rate but very limited financial variables reported in Amadeus. Further analysis becomes also cumbersome for Austria and Germany, for which only less than 20% of the initially surveyed
7 E.g. for wave 3 conducted in 2010, the emA sample would contain companies for which information is available for at least one year between 2009 and 2011. Given that 2014 data are not yet reported and 2013 data are of poor coverage, for the most recent waves (from 8 to 10) at least one year between 2010 and 2012 should be available to include the company in the emA sample.
0%
10%
20%
30%
40%
50%
60%
70%
80%
90%
AT BE DE ES FI FR GR IE IT NL PT All firms
Total assets Working capital Cash & cash equivalent Net income Sales Nr of employees
Linking qualitative survey responses with quantitative data 17
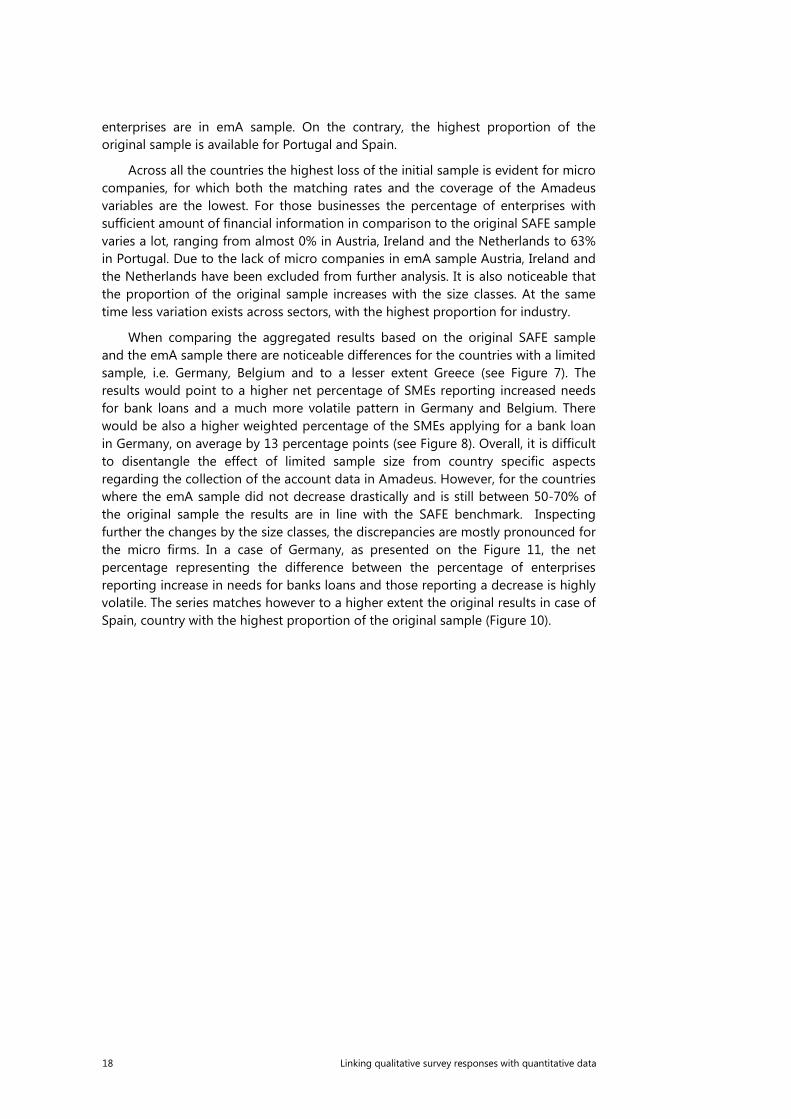
enterprises are in emA sample. On the contrary, the highest proportion of the original sample is available for Portugal and Spain.
Across all the countries the highest loss of the initial sample is evident for micro companies, for which both the matching rates and the coverage of the Amadeus variables are the lowest. For those businesses the percentage of enterprises with sufficient amount of financial information in comparison to the original SAFE sample varies a lot, ranging from almost 0% in Austria, Ireland and the Netherlands to 63% in Portugal. Due to the lack of micro companies in emA sample Austria, Ireland and the Netherlands have been excluded from further analysis. It is also noticeable that the proportion of the original sample increases with the size classes. At the same time less variation exists across sectors, with the highest proportion for industry.
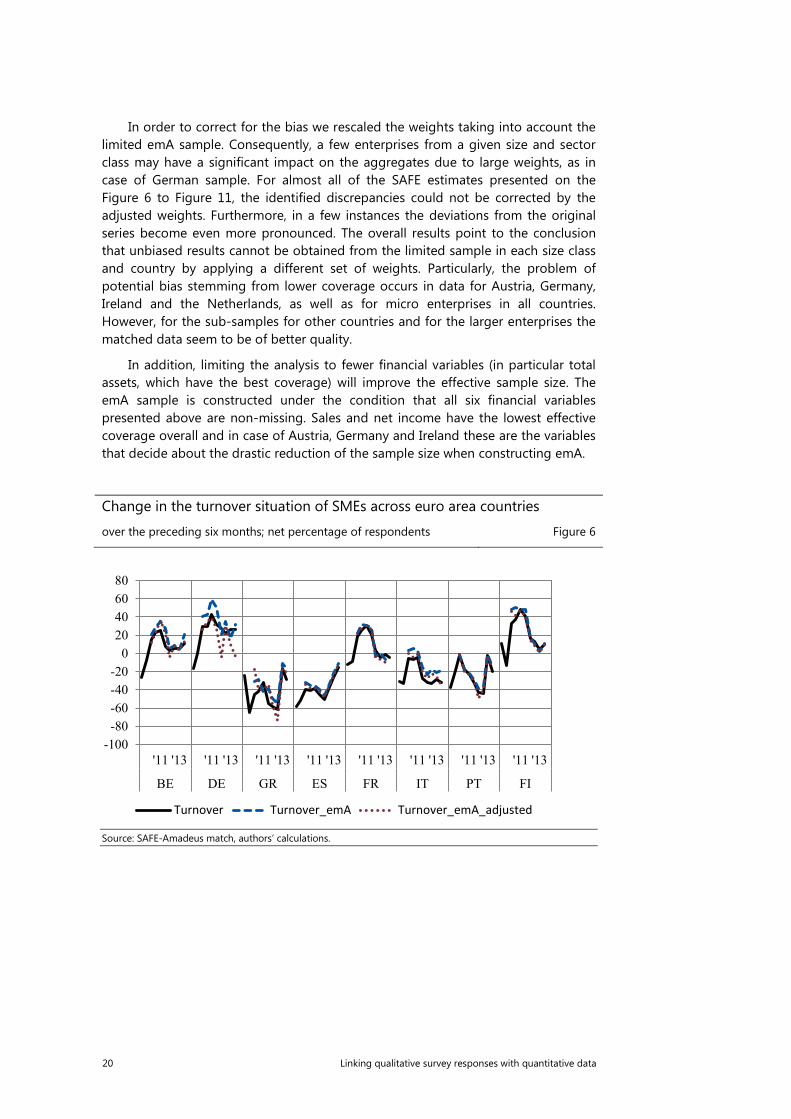
When comparing the aggregated results based on the original SAFE sample and the emA sample there are noticeable differences for the countries with a limited sample, i.e. Germany, Belgium and to a lesser extent Greece (see Figure 7). The results would point to a higher net percentage of SMEs reporting increased needs for bank loans and a much more volatile pattern in Germany and Belgium. There would be also a higher weighted percentage of the SMEs applying for a bank loan in Germany, on average by 13 percentage points (see Figure 8). Overall, it is difficult to disentangle the effect of limited sample size from country specific aspects regarding the collection of the account data in Amadeus. However, for the countries where the emA sample did not decrease drastically and is still between 50-70% of the original sample the results are in line with the SAFE benchmark. Inspecting further the changes by the size classes, the discrepancies are mostly pronounced for the micro firms. In a case of Germany, as presented on the Figure 11, the net percentage representing the difference between the percentage of enterprises reporting increase in needs for banks loans and those reporting a decrease is highly volatile. The series matches however to a higher extent the original results in case of Spain, country with the highest proportion of the original sample (Figure 10).
18 Linking qualitative survey responses with quantitative data
Comparison of original SAFE sample and effectively matched Amadeus sample by size and sector
Table 10
SAFE sample Effectively matched sample (% of the SAFE sample)
Micro Small Medium Large All firms Micro Small Medium Large All firms
AT 1,290 1,314 859 246 3,709 0.2% 5% 51% 54% 17%
BE 1,450 1,481 662 137 3,730 12% 35% 76% 77% 35%
DE 2,412 2,475 2,343 784 8,014 3% 12% 31% 45% 18%
ES 2,428 2,474 2,356 748 8,006 57% 85% 90% 90% 79%
FI 1,432 1,430 626 115 3,603 49% 76% 88% 86% 67%
FR 2,394 2,444 2,385 801 8,024 40% 53% 62% 59% 53%
GR 1,460 1,459 656 125 3,700 19% 51% 64% 71% 41%
IE 1,430 1,429 625 118 3,602 0.0% 0% 0% 4% 0.2%
IT 2,394 2,434 2,439 738 8,005 34% 73% 89% 90% 68%
NL 1,339 1,325 852 246 3,762 0.1% 3% 15% 35% 7%
PT 1,338 1,341 850 236 3,765 63% 86% 88% 87% 78%
Total 19,367 19,606 14,653 4,294 57,920 27% 46% 63% 67% 46%
SAFE sample Effectively matched sample (% of the SAFE sample)
Industry
Construction
Trade Services All
sectors Industry
Construction
Trade Services All
sectors
AT 875 336 927 1,571 3,709 34% 13% 17% 9% 17%
BE 740 464 1,119 1,407 3,730 51% 31% 34% 29% 35%
DE 2,449 787 1,470 3,308 8,014 27% 21% 16% 12% 18%
ES 1,886 971 1,911 3,238 8,006 86% 78% 74% 77% 79%
FI 781 545 579 1,698 3,603 80% 65% 67% 63% 67%
FR 2,125 728 2,518 2,653 8,024 57% 53% 51% 51% 53%
GR 647 337 2,092 624 3,700 51% 38% 36% 52% 41%
IE 745 350 1,335 1,172 3,602 1% 0% 0% 0% 0%
IT 3,842 528 1,676 1,959 8,005 78% 59% 59% 57% 68%
NL 599 391 948 1,824 3,762 14% 4% 7% 5% 7%
PT 942 468 1,065 1,290 3,765 86% 72% 75% 79% 78%
Total 15,631 5,905 15,640 20,744 57,920 58% 45% 41% 40% 46%
Source: SAFE-Amadeus match, authors’ calculations.
4.3.2 Can weights correct the bias?
The original SAFE results are obtained by aggregating the raw data and applying the weights to restore the proportions of the population of enterprises, with regard to company size and economic activity in each country. Those weights are estimated based on the number of persons employed available from Eurostat’s Structural Business Statistics (SBS) using raking method that aims to match the marginal distributions of the population (i.e. margins on size and sector classes) and minimises the distance between the initial and final weights.
Linking qualitative survey responses with quantitative data 19
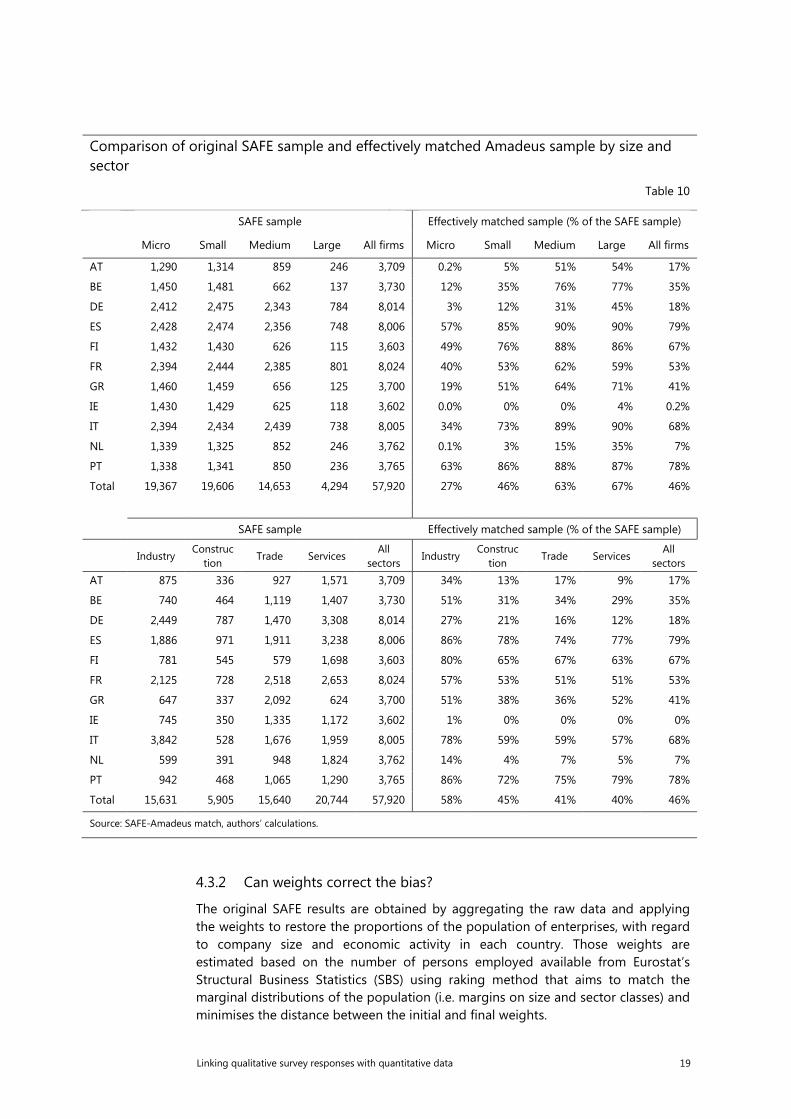
In order to correct for the bias we rescaled the weights taking into account the limited emA sample. Consequently, a few enterprises from a given size and sector class may have a significant impact on the aggregates due to large weights, as in case of German sample. For almost all of the SAFE estimates presented on the Figure 6 to Figure 11, the identified discrepancies could not be corrected by the adjusted weights. Furthermore, in a few instances the deviations from the original series become even more pronounced. The overall results point to the conclusion that unbiased results cannot be obtained from the limited sample in each size class and country by applying a different set of weights. Particularly, the problem of potential bias stemming from lower coverage occurs in data for Austria, Germany, Ireland and the Netherlands, as well as for micro enterprises in all countries. However, for the sub-samples for other countries and for the larger enterprises the matched data seem to be of better quality.
In addition, limiting the analysis to fewer financial variables (in particular total assets, which have the best coverage) will improve the effective sample size. The emA sample is constructed under the condition that all six financial variables presented above are non-missing. Sales and net income have the lowest effective coverage overall and in case of Austria, Germany and Ireland these are the variables that decide about the drastic reduction of the sample size when constructing emA.
Change in the turnover situation of SMEs across euro area countries
over the preceding six months; net percentage of respondents Figure 6
Source: SAFE-Amadeus match, authors’ calculations.
-100-80-60-40-20
020406080
'11 '13 '11 '13 '11 '13 '11 '13 '11 '13 '11 '13 '11 '13 '11 '13
BE DE GR ES FR IT PT FI
Turnover Turnover_emA Turnover_emA_adjusted
20 Linking qualitative survey responses with quantitative data
Change in needs for bank loans of SMEs across euro area countries
over the preceding six months; net percentage of respondents Figure 7
Source: SAFE-Amadeus match, authors’ calculations.
Applications for bank loans by SMEs across euro area countries
over the preceding six months; weighted percentage of respondents Figure 8
Source: SAFE-Amadeus match, authors’ calculations.
-10
0
10
20
30
40
50
'11 '13 '11 '13 '11 '13 '11 '13 '11 '13 '11 '13 '11 '13 '11 '13
BE DE GR ES FR IT PT FI
Bank loans Bank loans_emA Bank loans_emA_adjusted
0
10
20
30
40
50
60
'11 '13 '11 '13 '11 '13 '11 '13 '11 '13 '11 '13 '11 '13 '11 '13
BE DE GR ES FR IT PT FI
Bank loans Bank loans_emA Bank loans_emA_adjusted
Linking qualitative survey responses with quantitative data 21
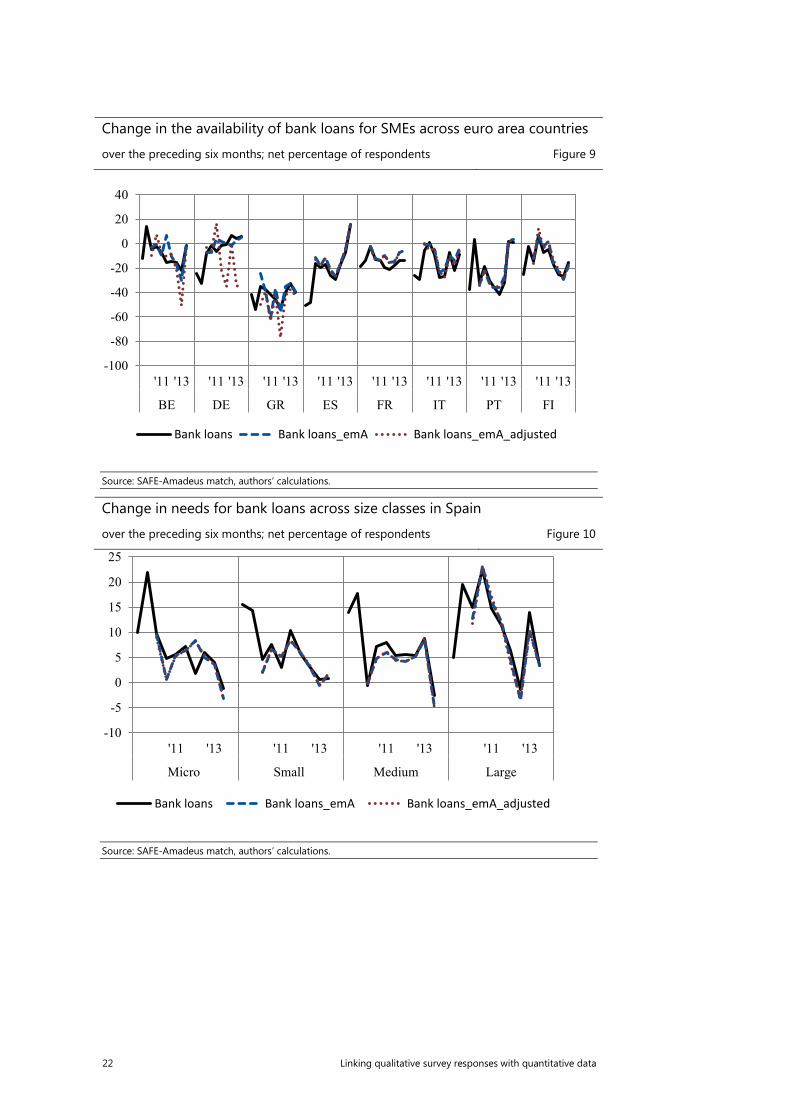
Change in the availability of bank loans for SMEs across euro area countries
over the preceding six months; net percentage of respondents Figure 9
Source: SAFE-Amadeus match, authors’ calculations.
Change in needs for bank loans across size classes in Spain
over the preceding six months; net percentage of respondents Figure 10
Source: SAFE-Amadeus match, authors’ calculations.
-100
-80
-60
-40
-20
0
20
40
'11 '13 '11 '13 '11 '13 '11 '13 '11 '13 '11 '13 '11 '13 '11 '13
BE DE GR ES FR IT PT FI
Bank loans Bank loans_emA Bank loans_emA_adjusted
-10
-5
0
5
10
15
20
25
'11 '13 '11 '13 '11 '13 '11 '13
Micro Small Medium Large
Bank loans Bank loans_emA Bank loans_emA_adjusted
22 Linking qualitative survey responses with quantitative data
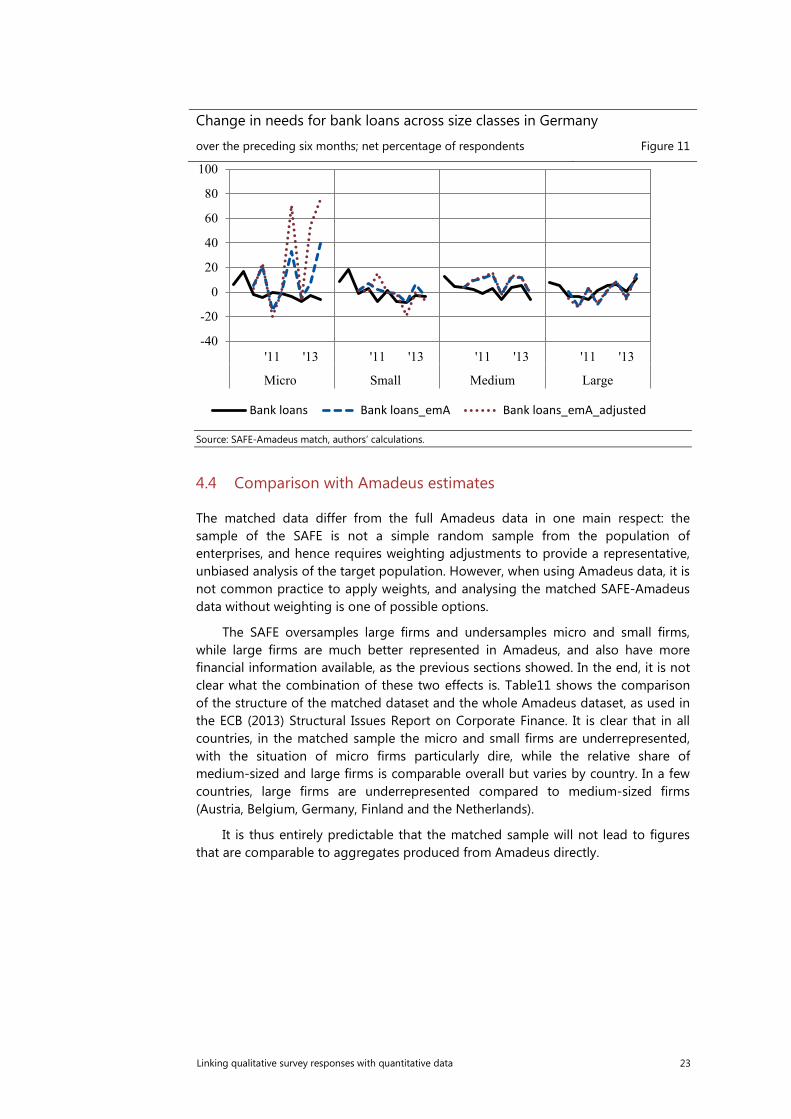
Change in needs for bank loans across size classes in Germany
over the preceding six months; net percentage of respondents Figure 11
Source: SAFE-Amadeus match, authors’ calculations.
4.4 Comparison with Amadeus estimates
The matched data differ from the full Amadeus data in one main respect: the sample of the SAFE is not a simple random sample from the population of enterprises, and hence requires weighting adjustments to provide a representative, unbiased analysis of the target population. However, when using Amadeus data, it is not common practice to apply weights, and analysing the matched SAFE-Amadeus data without weighting is one of possible options.
The SAFE oversamples large firms and undersamples micro and small firms, while large firms are much better represented in Amadeus, and also have more financial information available, as the previous sections showed. In the end, it is not clear what the combination of these two effects is. Table11 shows the comparison of the structure of the matched dataset and the whole Amadeus dataset, as used in the ECB (2013) Structural Issues Report on Corporate Finance. It is clear that in all countries, in the matched sample the micro and small firms are underrepresented, with the situation of micro firms particularly dire, while the relative share of medium-sized and large firms is comparable overall but varies by country. In a few countries, large firms are underrepresented compared to medium-sized firms (Austria, Belgium, Germany, Finland and the Netherlands).
It is thus entirely predictable that the matched sample will not lead to figures that are comparable to aggregates produced from Amadeus directly.
-40
-20
0
20
40
60
80
100
'11 '13 '11 '13 '11 '13 '11 '13
Micro Small Medium Large
Bank loans Bank loans_emA Bank loans_emA_adjusted
Linking qualitative survey responses with quantitative data 23
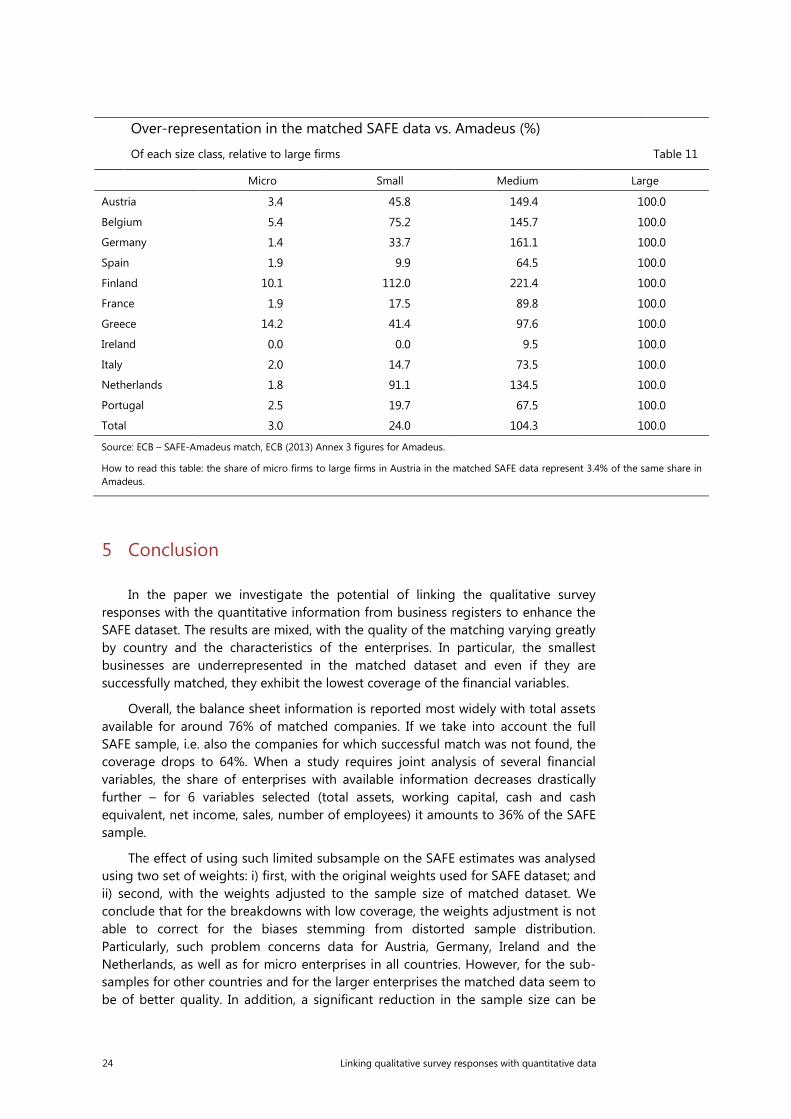
Over-representation in the matched SAFE data vs. Amadeus (%)
Of each size class, relative to large firms Table 11
Micro Small Medium Large
Austria 3.4 45.8 149.4 100.0
Belgium 5.4 75.2 145.7 100.0
Germany 1.4 33.7 161.1 100.0
Spain 1.9 9.9 64.5 100.0
Finland 10.1 112.0 221.4 100.0
France 1.9 17.5 89.8 100.0
Greece 14.2 41.4 97.6 100.0
Ireland 0.0 0.0 9.5 100.0
Italy 2.0 14.7 73.5 100.0
Netherlands 1.8 91.1 134.5 100.0
Portugal 2.5 19.7 67.5 100.0
Total 3.0 24.0 104.3 100.0
Source: ECB – SAFE-Amadeus match, ECB (2013) Annex 3 figures for Amadeus.
How to read this table: the share of micro firms to large firms in Austria in the matched SAFE data represent 3.4% of the same share in Amadeus.
5 Conclusion
In the paper we investigate the potential of linking the qualitative survey responses with the quantitative information from business registers to enhance the SAFE dataset. The results are mixed, with the quality of the matching varying greatly by country and the characteristics of the enterprises. In particular, the smallest businesses are underrepresented in the matched dataset and even if they are successfully matched, they exhibit the lowest coverage of the financial variables.
Overall, the balance sheet information is reported most widely with total assets available for around 76% of matched companies. If we take into account the full SAFE sample, i.e. also the companies for which successful match was not found, the coverage drops to 64%. When a study requires joint analysis of several financial variables, the share of enterprises with available information decreases drastically further – for 6 variables selected (total assets, working capital, cash and cash equivalent, net income, sales, number of employees) it amounts to 36% of the SAFE sample.
The effect of using such limited subsample on the SAFE estimates was analysed using two set of weights: i) first, with the original weights used for SAFE dataset; and ii) second, with the weights adjusted to the sample size of matched dataset. We conclude that for the breakdowns with low coverage, the weights adjustment is not able to correct for the biases stemming from distorted sample distribution. Particularly, such problem concerns data for Austria, Germany, Ireland and the Netherlands, as well as for micro enterprises in all countries. However, for the sub-samples for other countries and for the larger enterprises the matched data seem to be of better quality. In addition, a significant reduction in the sample size can be
24 Linking qualitative survey responses with quantitative data
avoided by selecting smaller subset of required financial variables. A biased sample is particularly problematic, if one attempts to construct aggregates from the matched dataset. It does not, however, prevent the successful testing of certain hypotheses at the micro level – if the user is aware of the possible distortions in the sample distribution, he or she can construct the hypothesis testing so as to overcome this.
This paper presents first main findings on the quality of the matched SAFE dataset and this assessment will continue. The quality of matching might increase due to improved availability of the company tax identification number, which was not provided in the earlier waves of the SAFE. On the other hand, unfortunately a higher coverage of enterprises population in the Amadeus database cannot be expected, in particular for smaller businesses, since this group is more and more often exempted from the reporting or provided simplified and limited financial statements. However, given recent interest of policy makers in the situation of SMEs, new sources of data could become available in the future or current sources, such as business registers, can be improved with regard to quality and scope. The development in this area will be followed and investigated from the angle of enhancing the qualitative SAFE dataset with financial information, especially for micro enterprises.
At the same time, other methods of data matching can be explored. Currently, the record linking is performed by the provider of the register data. Effectiveness of other algorithms to link records can be explored, e.g. the method of probabilistic linking as described by Fellegi and Sunter. Another possible solution is the statistical matching, where the linked units do not need to be identical but only similar with regard to certain characteristics. However, given the wide scope of such methods, we leave it for future research.
6 References
European Central Bank (2013), Corporate finance and economic activity in the euro area, Structural Issues Report 2013, ECB Occasional Paper Series No. 151.
Eurostat (2013), Statistical matching: a model based approach for data integration, Methodologies and Working Papers.
Fellegi, Ivan P and Sunter Alan B, A Theory for Record Linkage. (December, 1969). Journal of the American Statistical Association, Vol. 64, No. 328.
Ferrando, Annalisa and Griesshaber, Nicolas, Financing obstacles among euro area firms: Who suffers the most? (February, 2011). ECB Working Paper No. 1293.
Ferrando, Annalisa and Mulier, Klaas, Firms' Financing Constraints: Do Perceptions Match the Actual Situation? (August 5, 2013). ECB Working Paper No. 1577.
Linking qualitative survey responses with quantitative data 25