Embed Size (px)
Citation preview
Managing Children with Advanced HIV disease
Lisa Frigati Tygerberg Hospital, Stellenbosch University
•
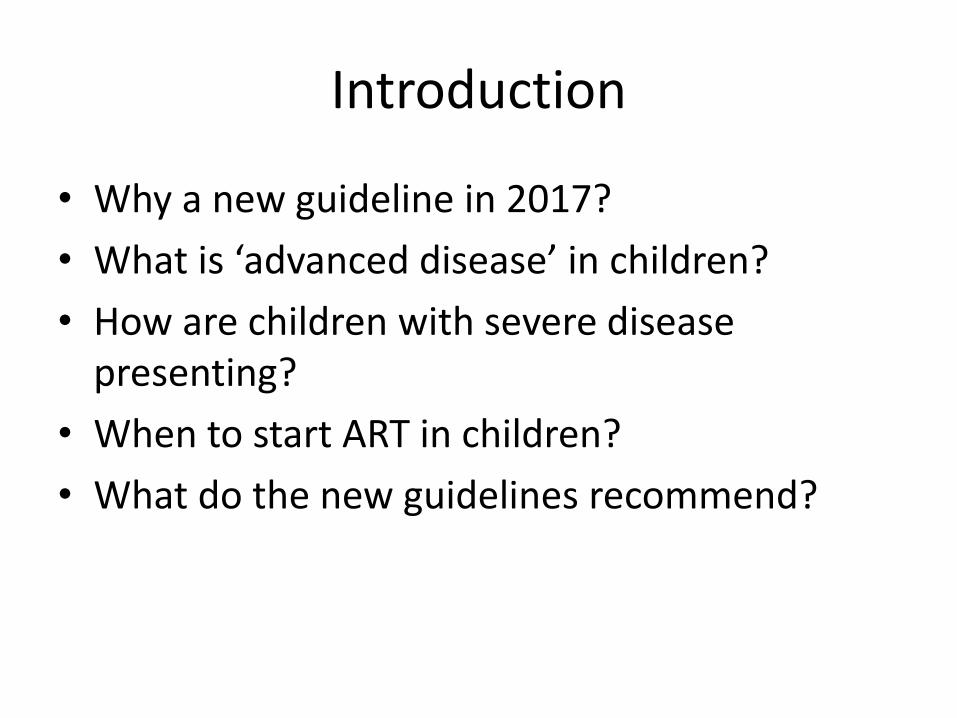
Introduction
• Why a new guideline in 2017?
• What is ‘advanced disease’ in children?
• How are children with severe disease presenting?
• When to start ART in children?
• What do the new guidelines recommend?
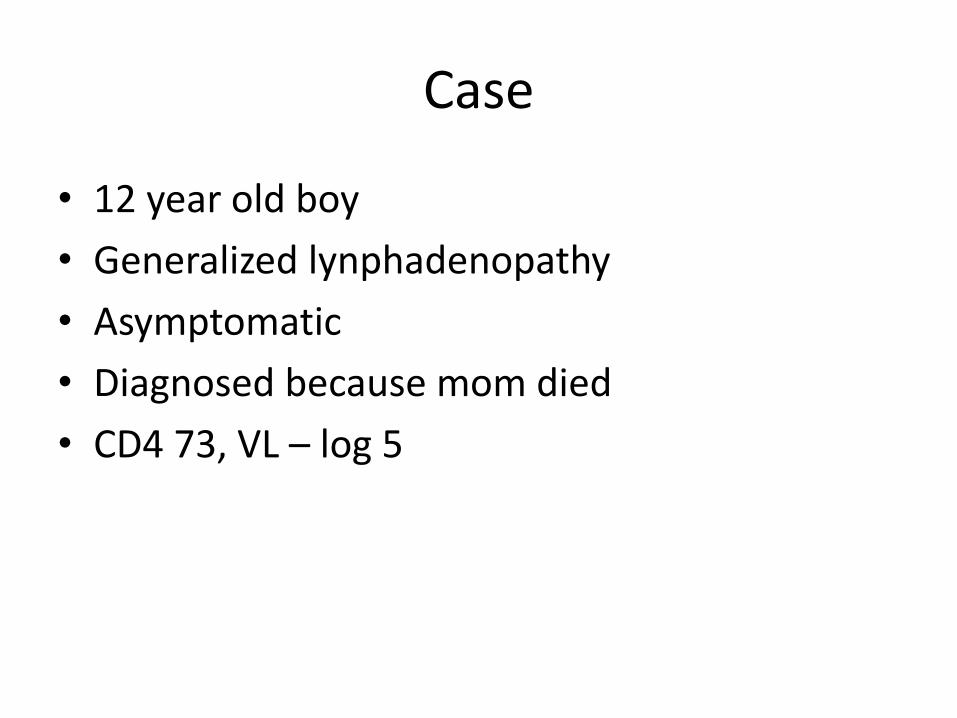
Case
• 12 year old boy
• Generalized lynphadenopathy
• Asymptomatic
• Diagnosed because mom died
• CD4 73, VL – log 5
Background
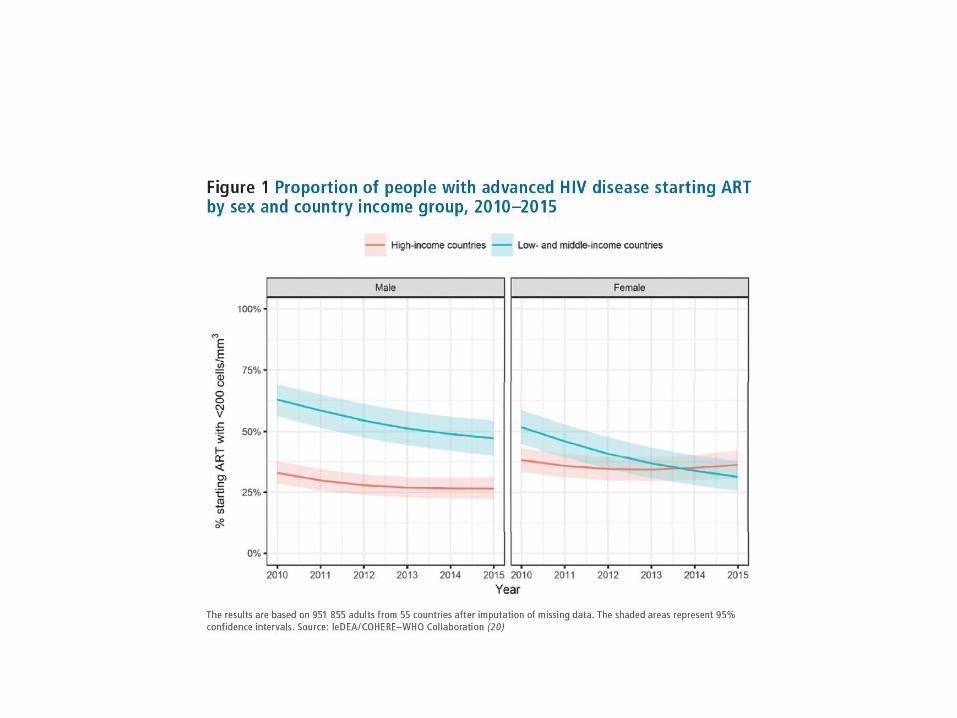
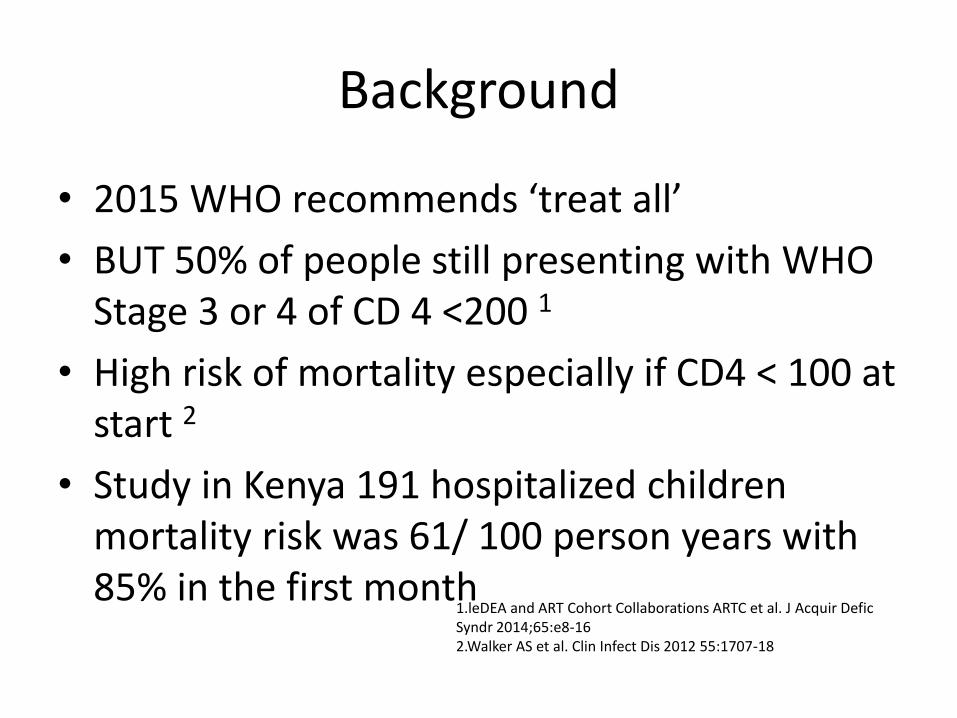
• 2015 WHO recommends ‘treat all’
• BUT 50% of people still presenting with WHO Stage 3 or 4 of CD 4 <200 1
• High risk of mortality especially if CD4 < 100 at start 2
• Study in Kenya 191 hospitalized children mortality risk was 61/ 100 person years with 85% in the first month
1.leDEA and ART Cohort Collaborations ARTC et al. J Acquir DeficSyndr 2014;65:e8-162.Walker AS et al. Clin Infect Dis 2012 55:1707-18
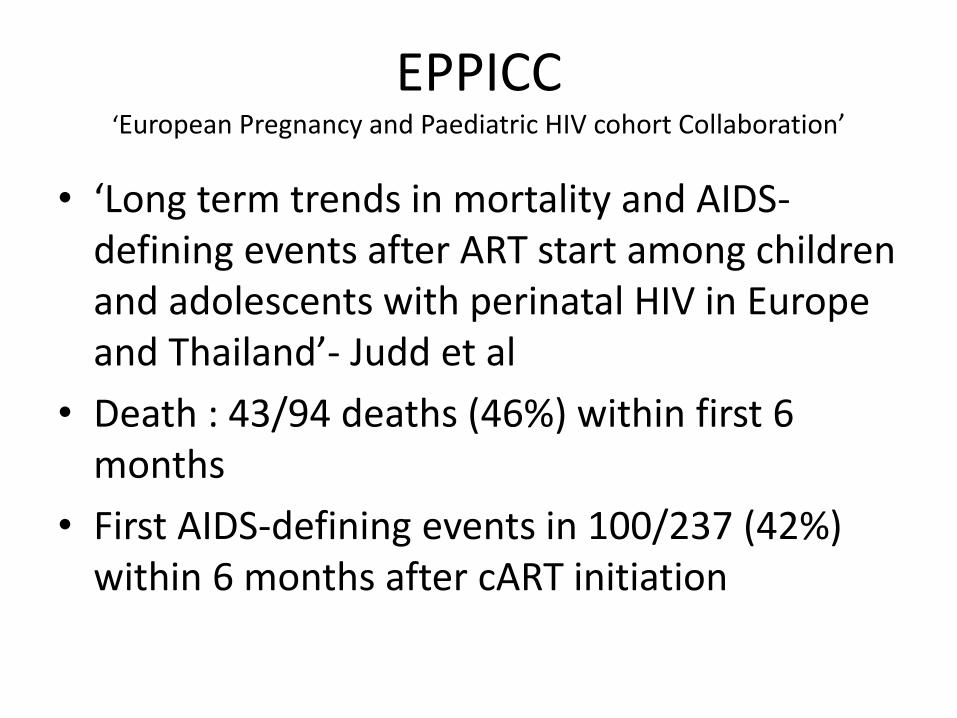
EPPICC‘European Pregnancy and Paediatric HIV cohort Collaboration’
• ‘Long term trends in mortality and AIDS-defining events after ART start among children and adolescents with perinatal HIV in Europe and Thailand’- Judd et al
• Death : 43/94 deaths (46%) within first 6 months
• First AIDS-defining events in 100/237 (42%) within 6 months after cART initiation
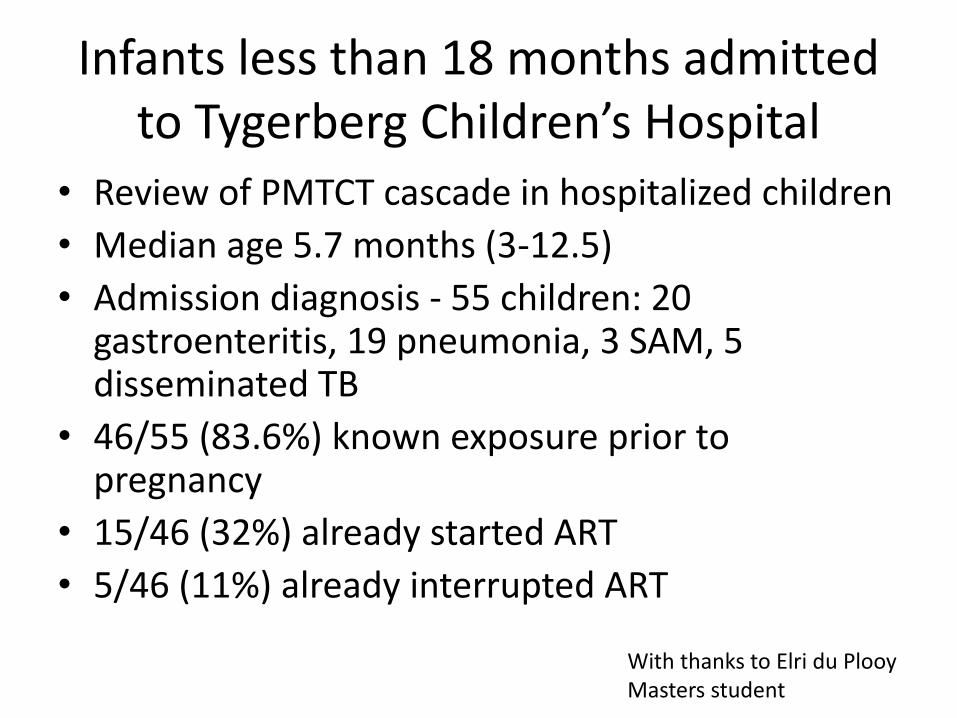
Infants less than 18 months admitted to Tygerberg Children’s Hospital
• Review of PMTCT cascade in hospitalized children
• Median age 5.7 months (3-12.5)
• Admission diagnosis - 55 children: 20 gastroenteritis, 19 pneumonia, 3 SAM, 5 disseminated TB
• 46/55 (83.6%) known exposure prior to pregnancy
• 15/46 (32%) already started ART
• 5/46 (11%) already interrupted ART
With thanks to Elri du PlooyMasters student
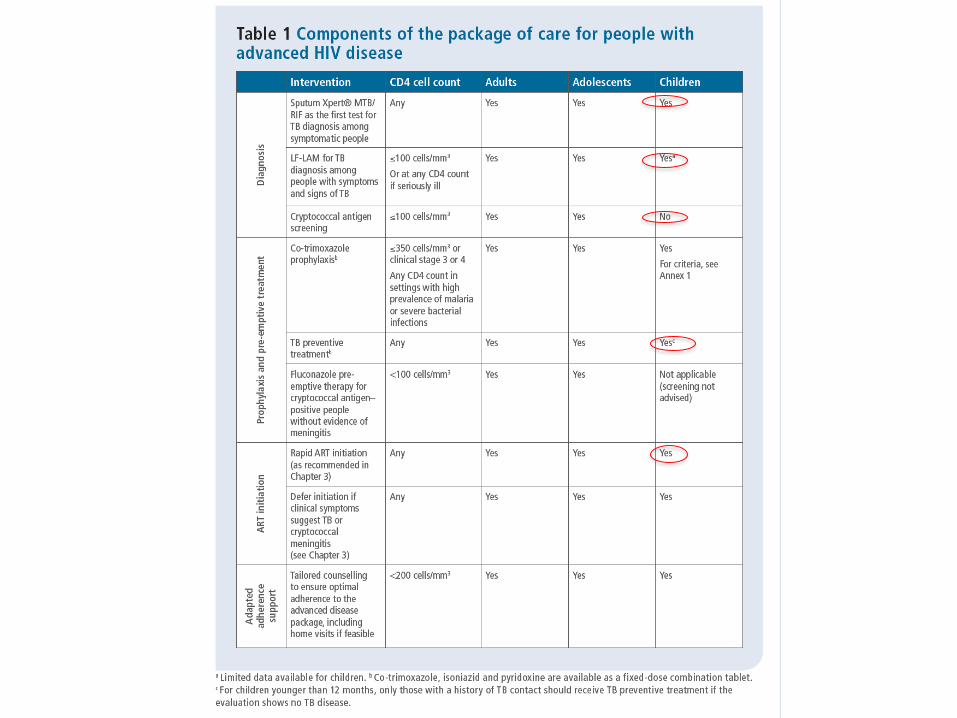
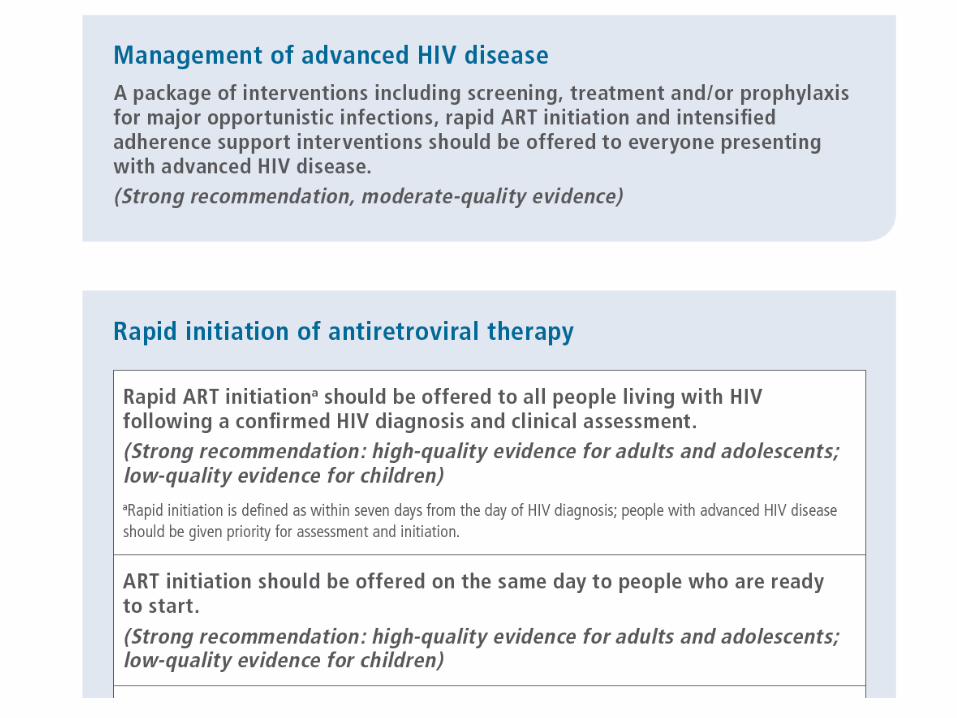
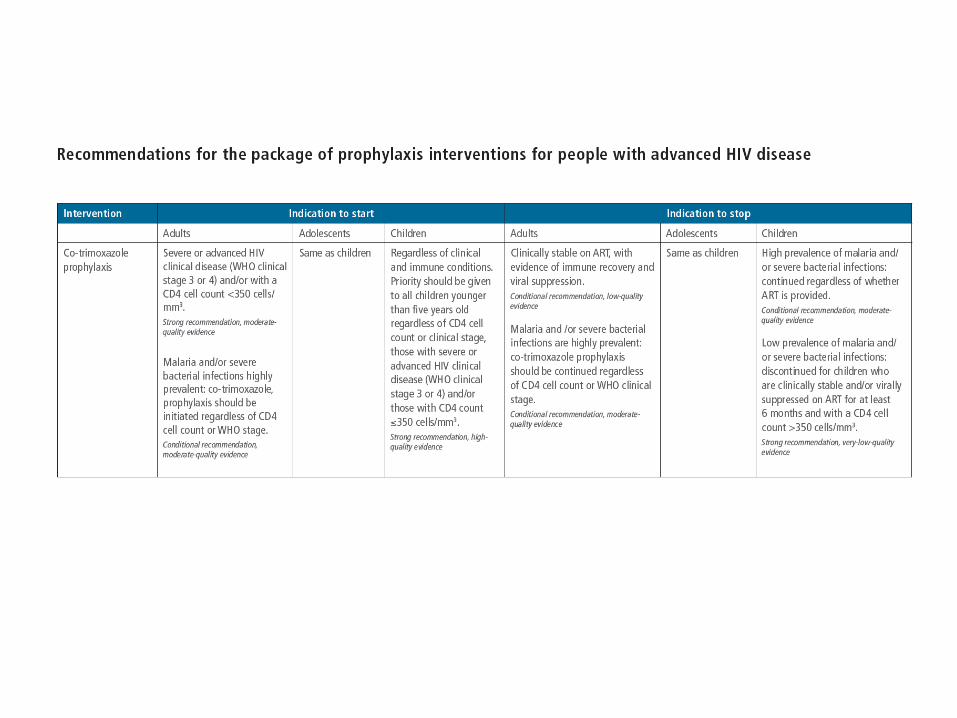
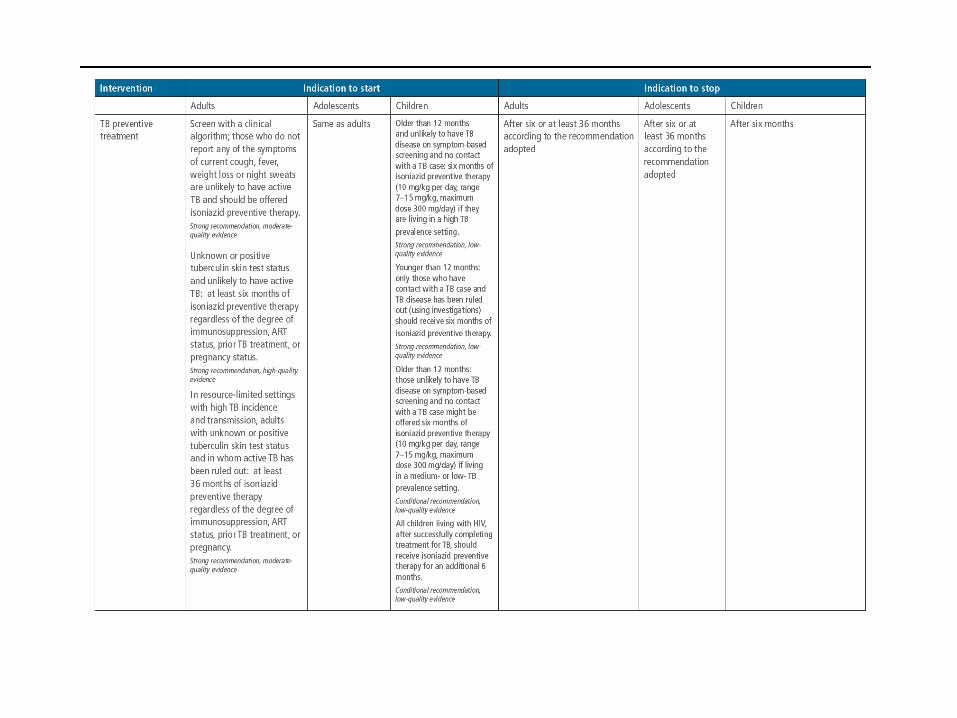
Package of Interventions
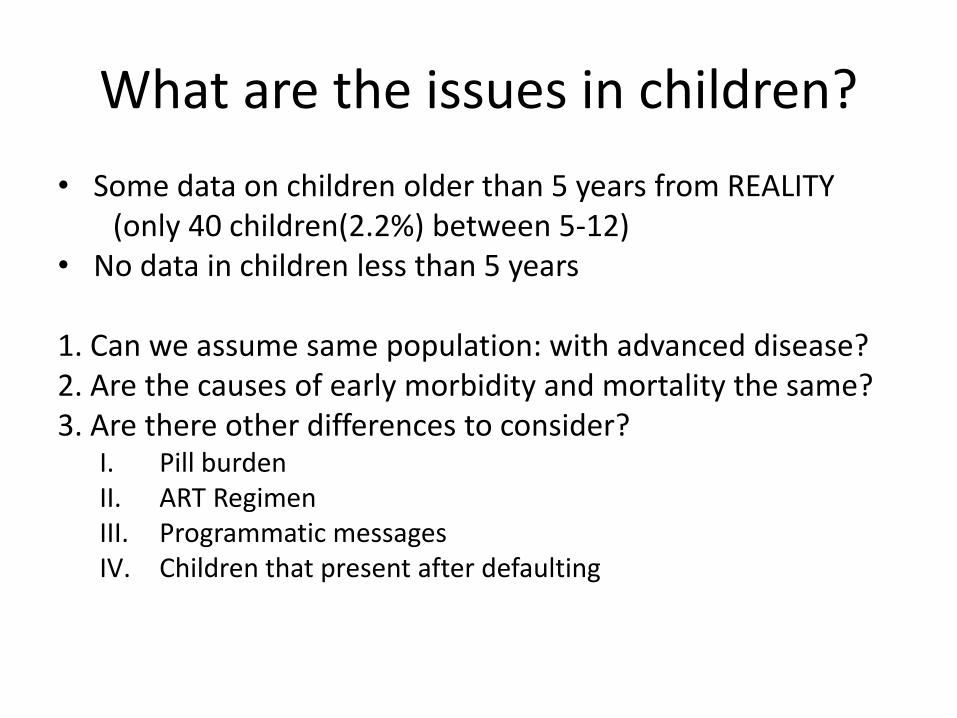
What are the issues in children?
• Some data on children older than 5 years from REALITY(only 40 children(2.2%) between 5-12)
• No data in children less than 5 years
1. Can we assume same population: with advanced disease?2. Are the causes of early morbidity and mortality the same?3. Are there other differences to consider?
I. Pill burdenII. ART RegimenIII. Programmatic messagesIV. Children that present after defaulting
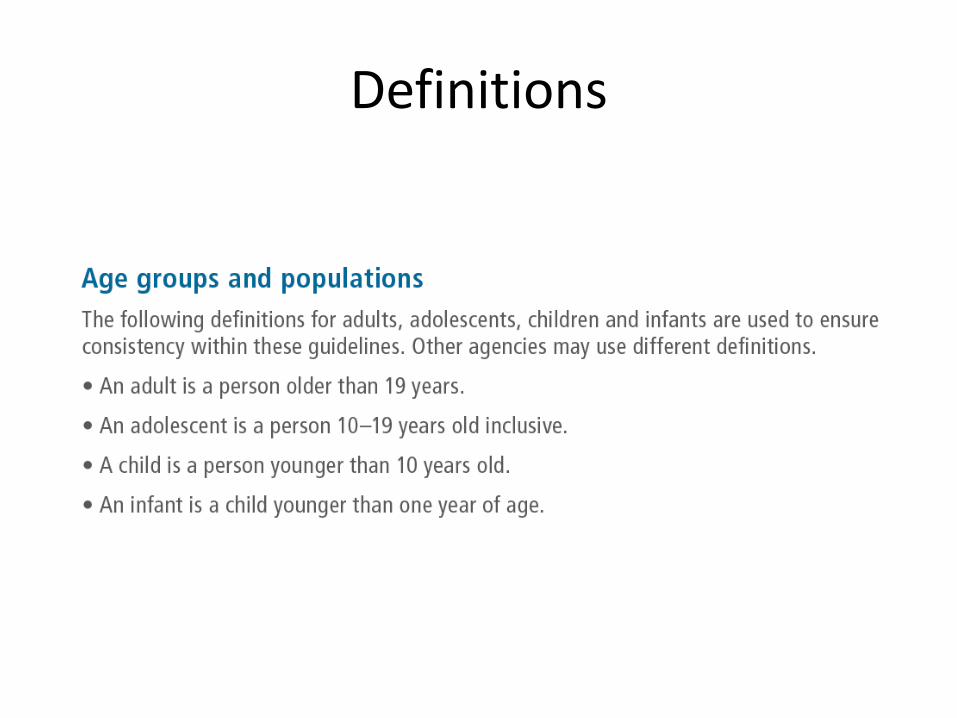
Definitions
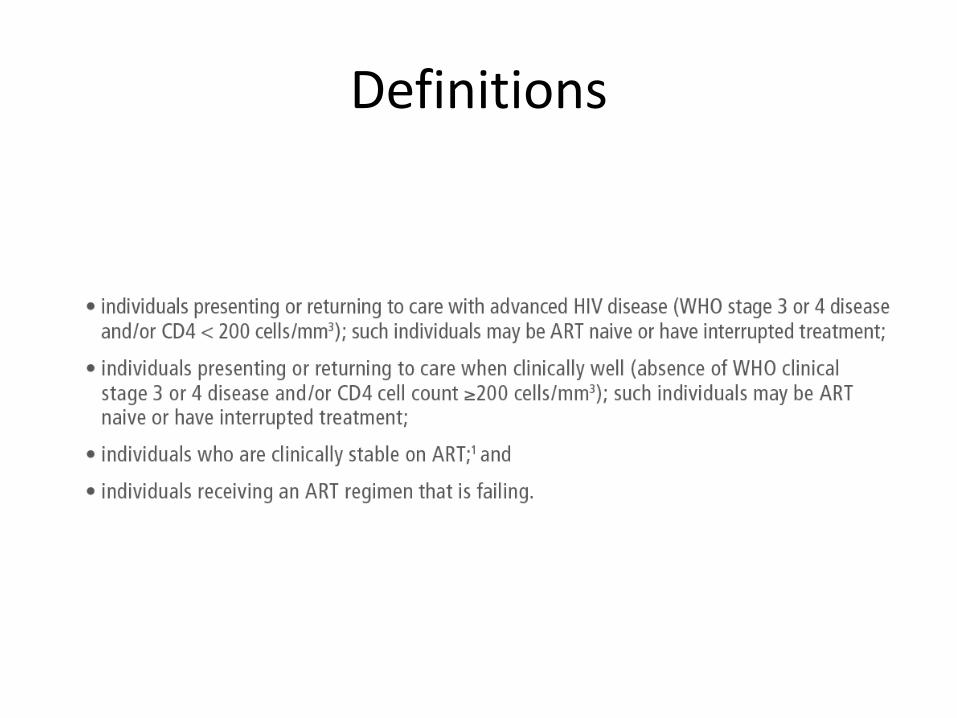
Definitions
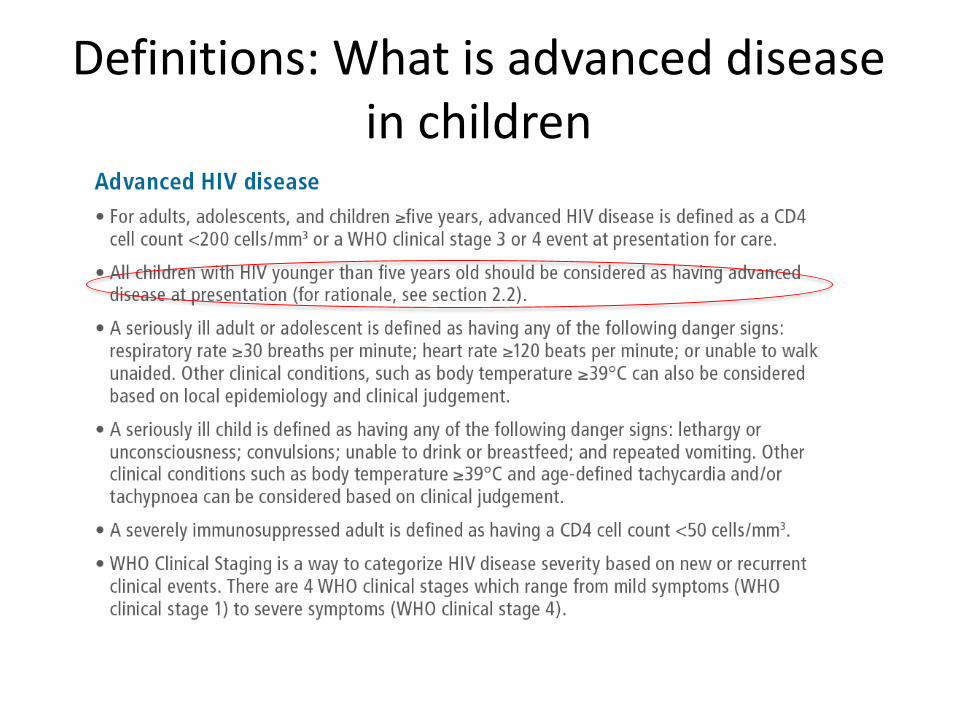
Definitions: What is advanced disease in children
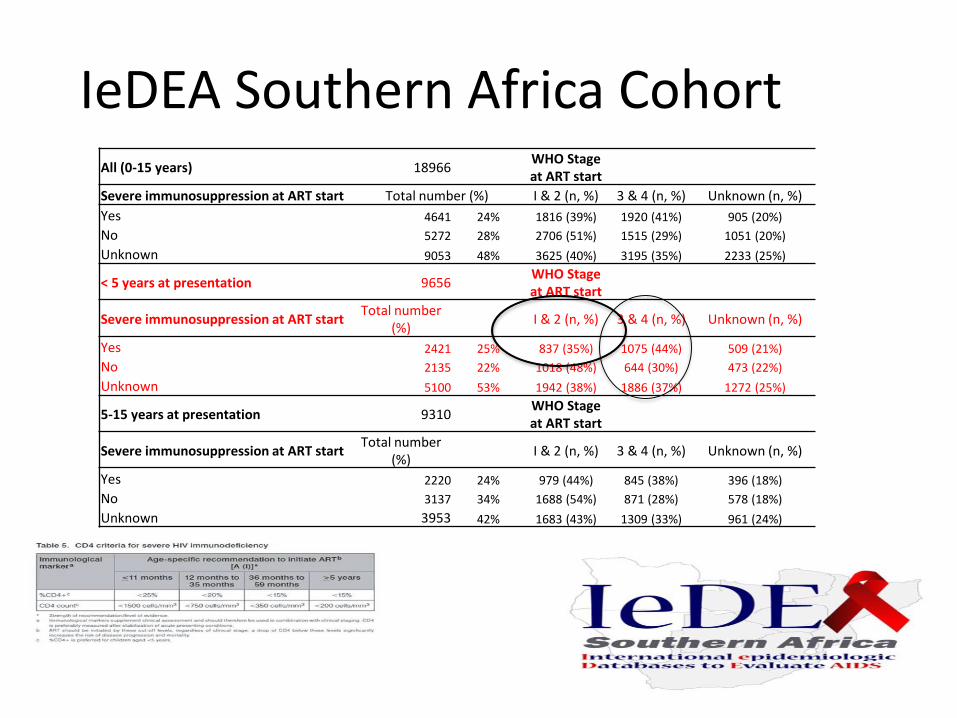
IeDEA Southern Africa CohortAll (0-15 years) 18966
WHO Stage at ART start
Severe immunosuppression at ART start Total number (%) I & 2 (n, %) 3 & 4 (n, %) Unknown (n, %)
Yes 4641 24% 1816 (39%) 1920 (41%) 905 (20%)
No 5272 28% 2706 (51%) 1515 (29%) 1051 (20%)
Unknown 9053 48% 3625 (40%) 3195 (35%) 2233 (25%)
< 5 years at presentation 9656WHO Stage at ART start
Severe immunosuppression at ART startTotal number
(%)I & 2 (n, %) 3 & 4 (n, %) Unknown (n, %)
Yes 2421 25% 837 (35%) 1075 (44%) 509 (21%)
No 2135 22% 1018 (48%) 644 (30%) 473 (22%)
Unknown 5100 53% 1942 (38%) 1886 (37%) 1272 (25%)
5-15 years at presentation 9310WHO Stage at ART start
Severe immunosuppression at ART startTotal number
(%)I & 2 (n, %) 3 & 4 (n, %) Unknown (n, %)
Yes 2220 24% 979 (44%) 845 (38%) 396 (18%)
No 3137 34% 1688 (54%) 871 (28%) 578 (18%)
Unknown 3953 42% 1683 (43%) 1309 (33%) 961 (24%)
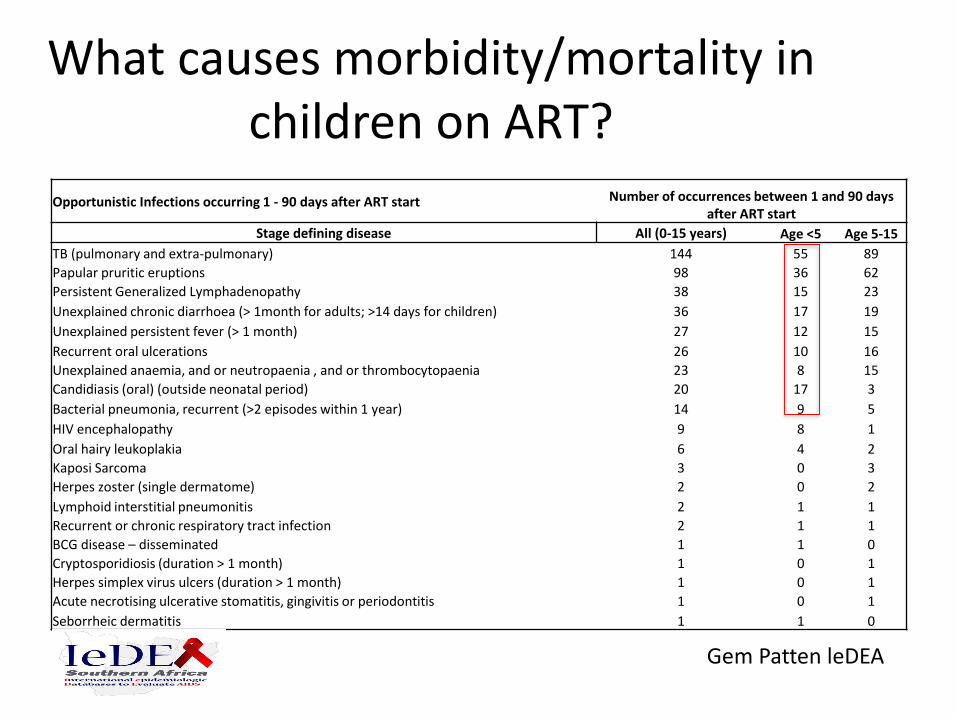
Opportunistic Infections occurring 1 - 90 days after ART start Number of occurrences between 1 and 90 days after ART start
Stage defining disease All (0-15 years) Age <5 Age 5-15
TB (pulmonary and extra-pulmonary) 144 55 89
Papular pruritic eruptions 98 36 62
Persistent Generalized Lymphadenopathy 38 15 23
Unexplained chronic diarrhoea (> 1month for adults; >14 days for children) 36 17 19
Unexplained persistent fever (> 1 month) 27 12 15
Recurrent oral ulcerations 26 10 16
Unexplained anaemia, and or neutropaenia , and or thrombocytopaenia 23 8 15
Candidiasis (oral) (outside neonatal period) 20 17 3
Bacterial pneumonia, recurrent (>2 episodes within 1 year) 14 9 5
HIV encephalopathy 9 8 1
Oral hairy leukoplakia 6 4 2
Kaposi Sarcoma 3 0 3
Herpes zoster (single dermatome) 2 0 2
Lymphoid interstitial pneumonitis 2 1 1
Recurrent or chronic respiratory tract infection 2 1 1
BCG disease – disseminated 1 1 0
Cryptosporidiosis (duration > 1 month) 1 0 1
Herpes simplex virus ulcers (duration > 1 month) 1 0 1
Acute necrotising ulcerative stomatitis, gingivitis or periodontitis 1 0 1
Seborrheic dermatitis 1 1 0
What causes morbidity/mortality in children on ART?
Gem Patten leDEA
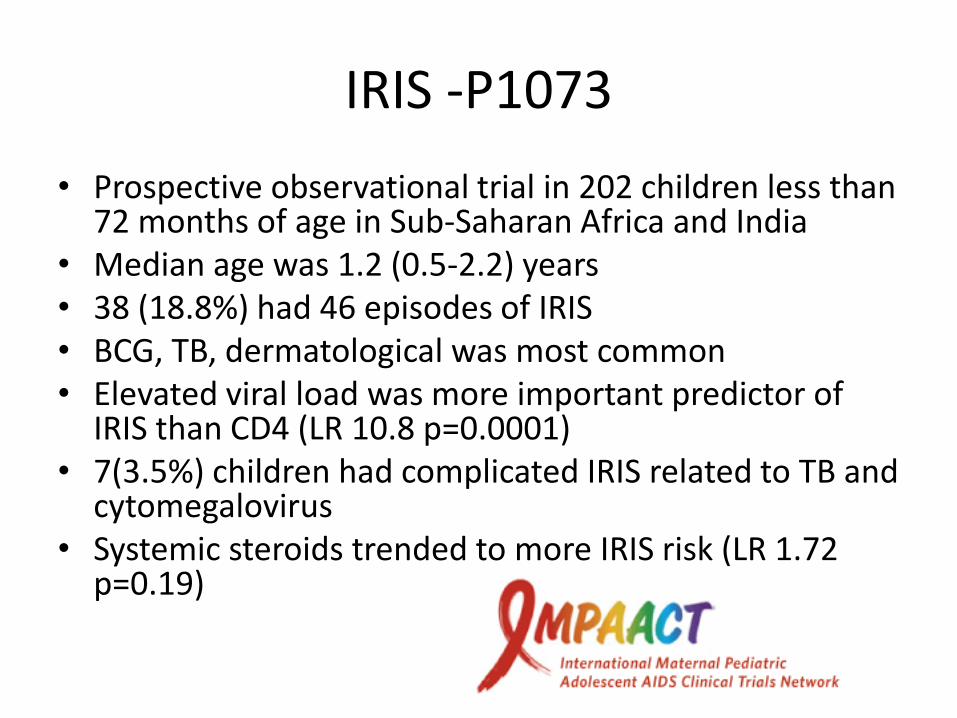
IRIS -P1073
• Prospective observational trial in 202 children less than 72 months of age in Sub-Saharan Africa and India
• Median age was 1.2 (0.5-2.2) years • 38 (18.8%) had 46 episodes of IRIS• BCG, TB, dermatological was most common• Elevated viral load was more important predictor of
IRIS than CD4 (LR 10.8 p=0.0001)• 7(3.5%) children had complicated IRIS related to TB and
cytomegalovirus• Systemic steroids trended to more IRIS risk (LR 1.72
p=0.19)
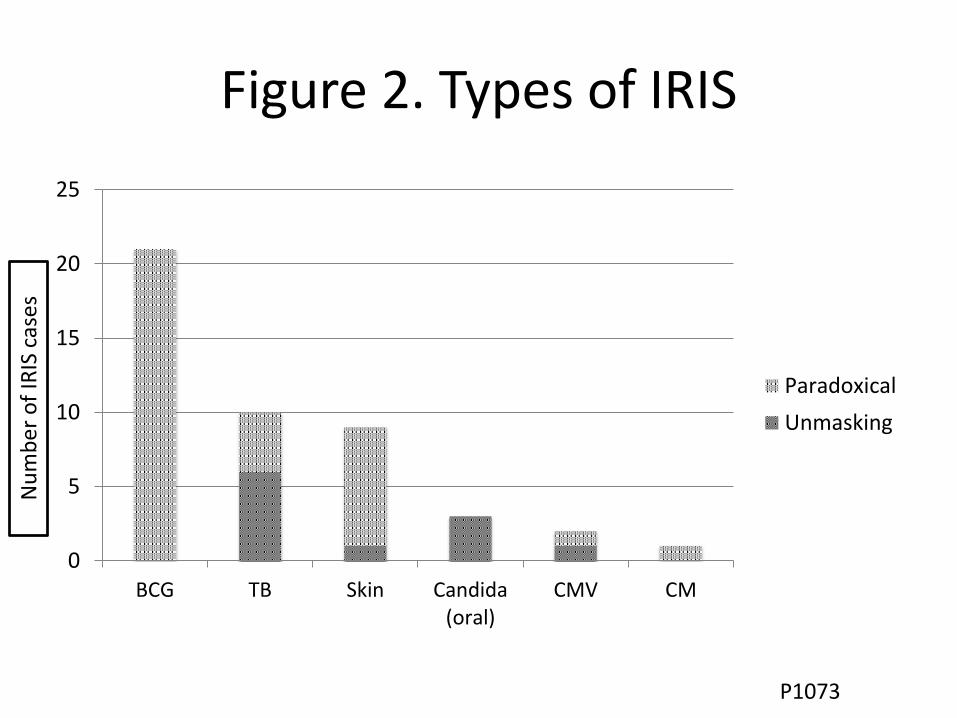
Figure 2. Types of IRIS
0
5
10
15
20
25
BCG TB Skin Candida(oral)
CMV CM
Paradoxical
Unmasking
Nu
mb
er
of
IRIS
cas
es
P1073
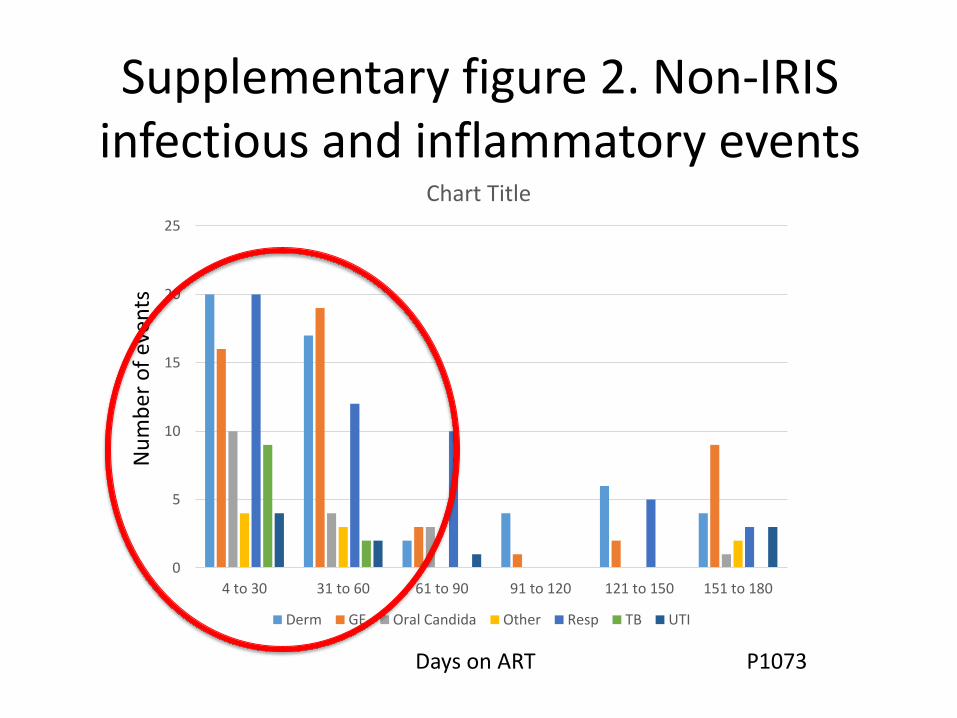
Supplementary figure 2. Non-IRIS infectious and inflammatory events
0
5
10
15
20
25
4 to 30 31 to 60 61 to 90 91 to 120 121 to 150 151 to 180
Chart Title
Derm GE Oral Candida Other Resp TB UTI
Nu
mb
er
of
even
ts
Days on ART P1073
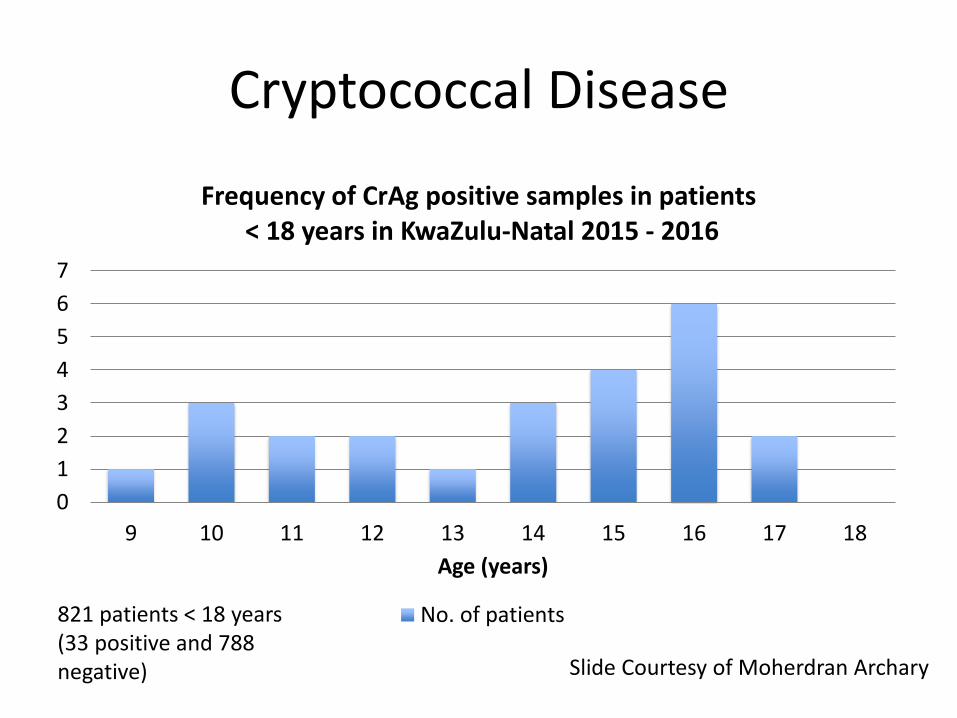
Cryptococcal Disease
0
1
2
3
4
5
6
7
9 10 11 12 13 14 15 16 17 18
Age (years)
Frequency of CrAg positive samples in patients< 18 years in KwaZulu-Natal 2015 - 2016
No. of patients
Slide Courtesy of Moherdran Archary
821 patients < 18 years (33 positive and 788 negative)
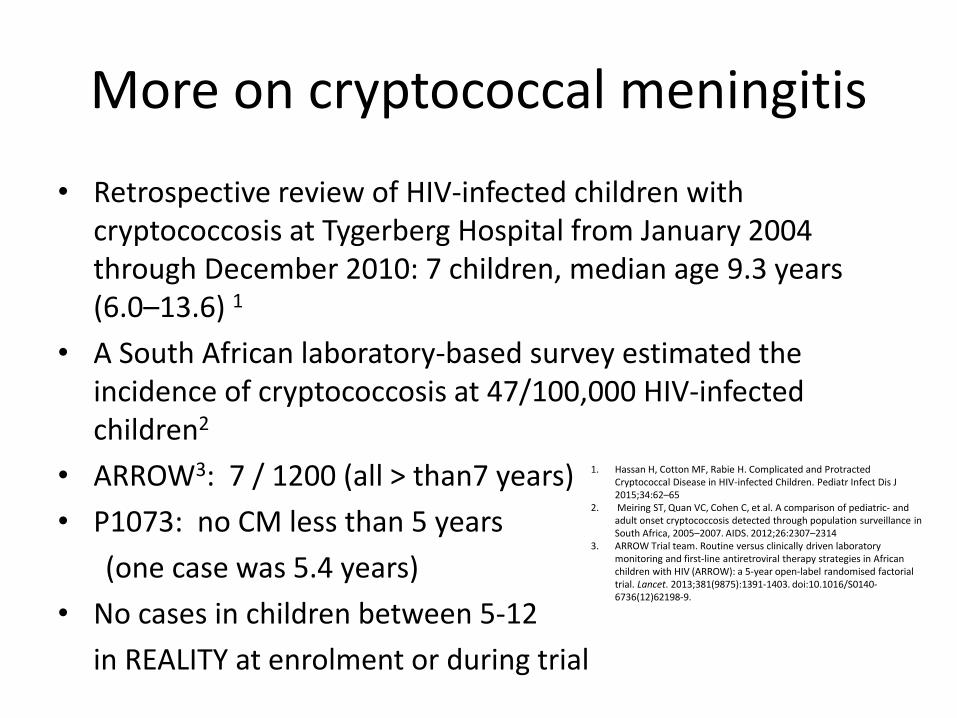
More on cryptococcal meningitis
• Retrospective review of HIV-infected children with cryptococcosis at Tygerberg Hospital from January 2004 through December 2010: 7 children, median age 9.3 years (6.0–13.6) 1
• A South African laboratory-based survey estimated the incidence of cryptococcosis at 47/100,000 HIV-infected children2
• ARROW3: 7 / 1200 (all > than7 years)
• P1073: no CM less than 5 years
(one case was 5.4 years)
• No cases in children between 5-12
in REALITY at enrolment or during trial
1. Hassan H, Cotton MF, Rabie H. Complicated and Protracted Cryptococcal Disease in HIV-infected Children. Pediatr Infect Dis J 2015;34:62–65
2. Meiring ST, Quan VC, Cohen C, et al. A comparison of pediatric- and adult onset cryptococcosis detected through population surveillance in South Africa, 2005–2007. AIDS. 2012;26:2307–2314
3. ARROW Trial team. Routine versus clinically driven laboratory monitoring and first-line antiretroviral therapy strategies in African children with HIV (ARROW): a 5-year open-label randomised factorial trial. Lancet. 2013;381(9875):1391-1403. doi:10.1016/S0140-6736(12)62198-9.
Candida
• REALITY: 1 at enrolment; none during the trial
• P1073: 3 cases of oral candida
• IeDEA :17 cases in first 3 months
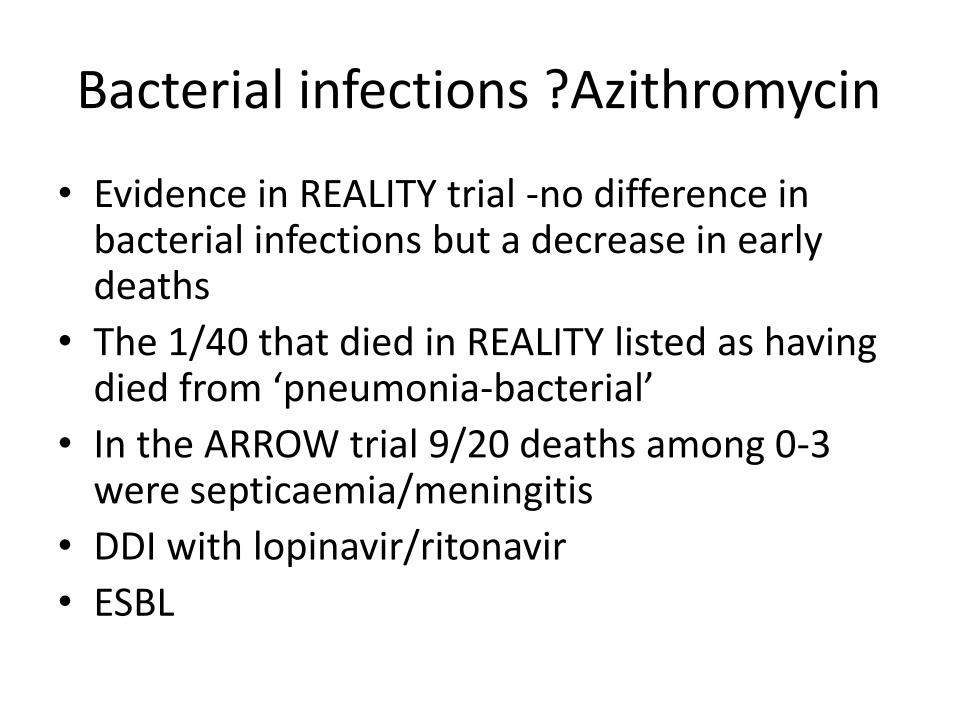
Bacterial infections ?Azithromycin
• Evidence in REALITY trial -no difference in bacterial infections but a decrease in early deaths
• The 1/40 that died in REALITY listed as having died from ‘pneumonia-bacterial’
• In the ARROW trial 9/20 deaths among 0-3 were septicaemia/meningitis
• DDI with lopinavir/ritonavir
• ESBL
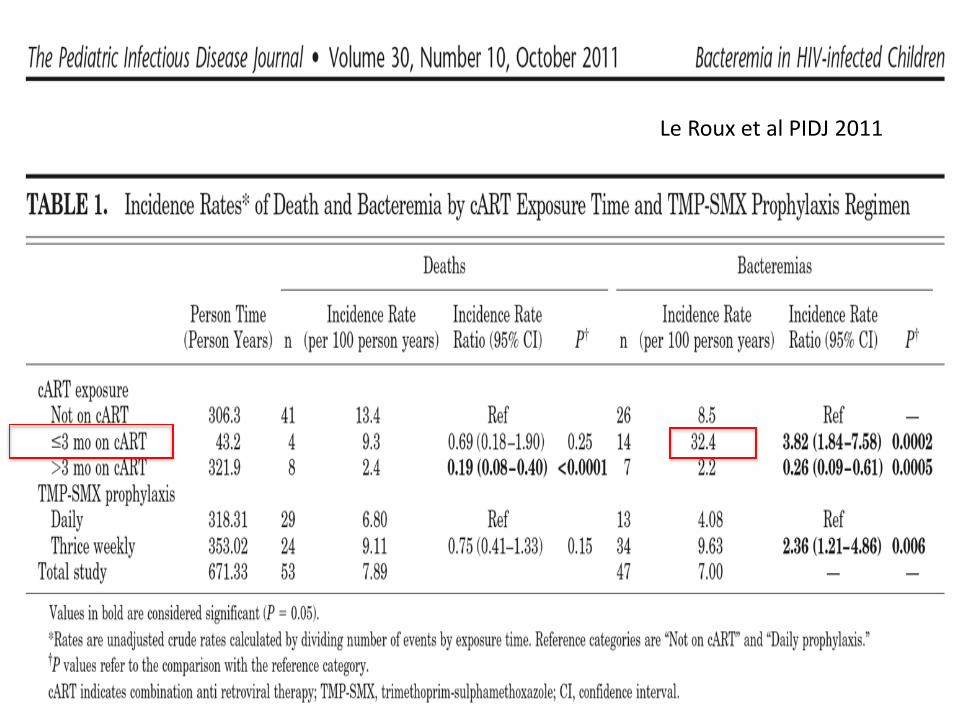
Le Roux et al PIDJ 2011
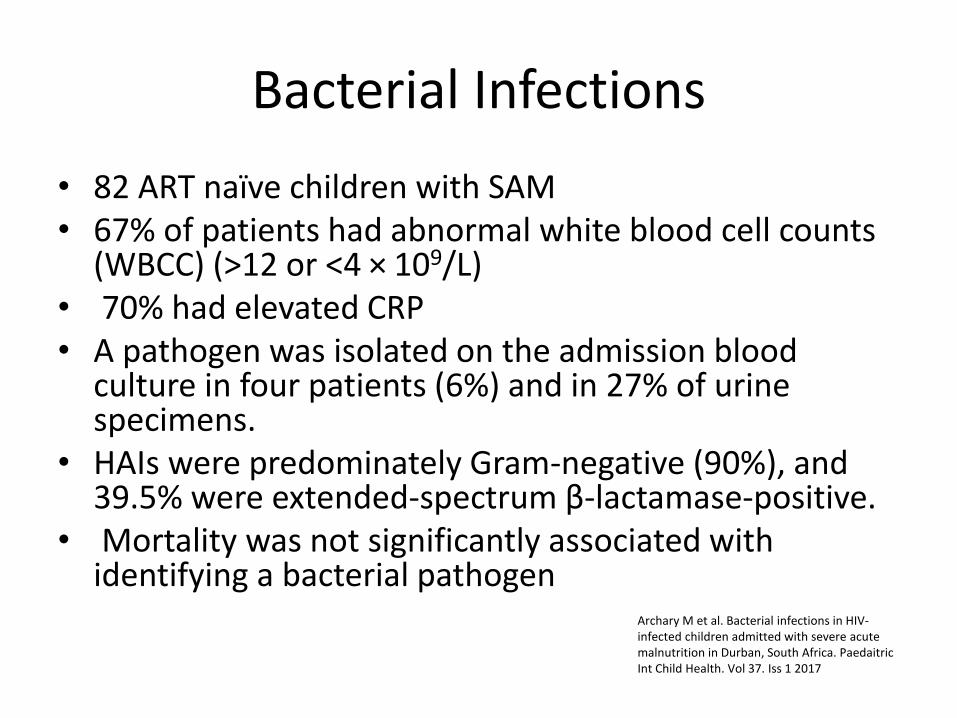
Bacterial Infections
• 82 ART naïve children with SAM• 67% of patients had abnormal white blood cell counts
(WBCC) (>12 or <4 × 10⁹/L)• 70% had elevated CRP• A pathogen was isolated on the admission blood
culture in four patients (6%) and in 27% of urine specimens.
• HAIs were predominately Gram-negative (90%), and 39.5% were extended-spectrum β-lactamase-positive.
• Mortality was not significantly associated with identifying a bacterial pathogen
Archary M et al. Bacterial infections in HIV-infected children admitted with severe acute malnutrition in Durban, South Africa. Paedaitric Int Child Health. Vol 37. Iss 1 2017
Other things to consider
• CMV – Ganciclovir
• Viral pneumonia and ventilatory support
• Diarrhoea – Fluid /ORS
• Dermatological conditions
• Growth monitoring and regular follow up
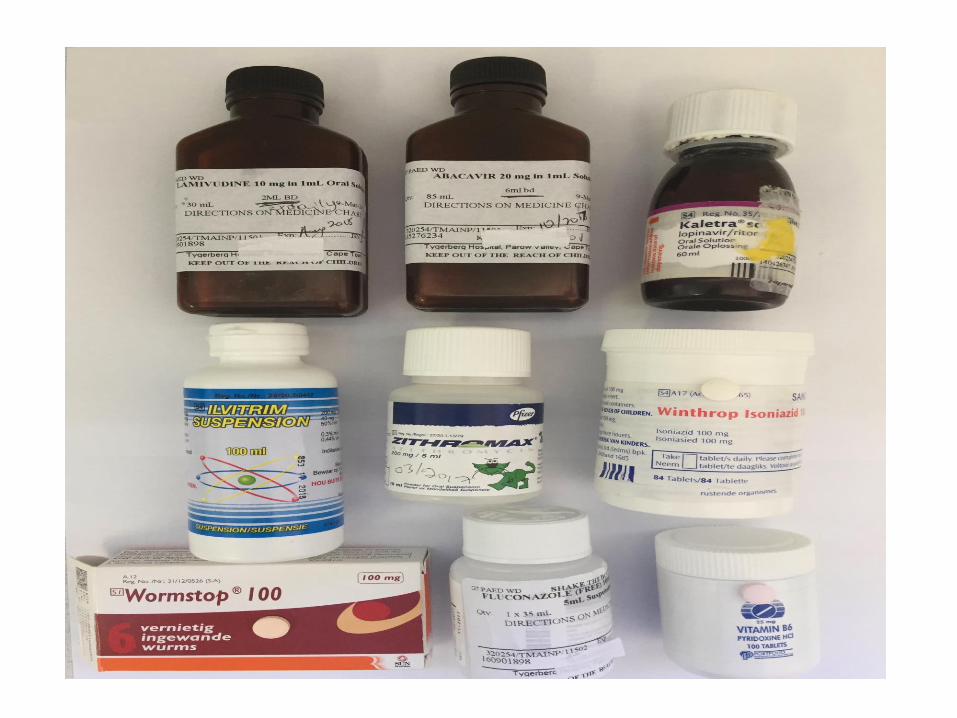
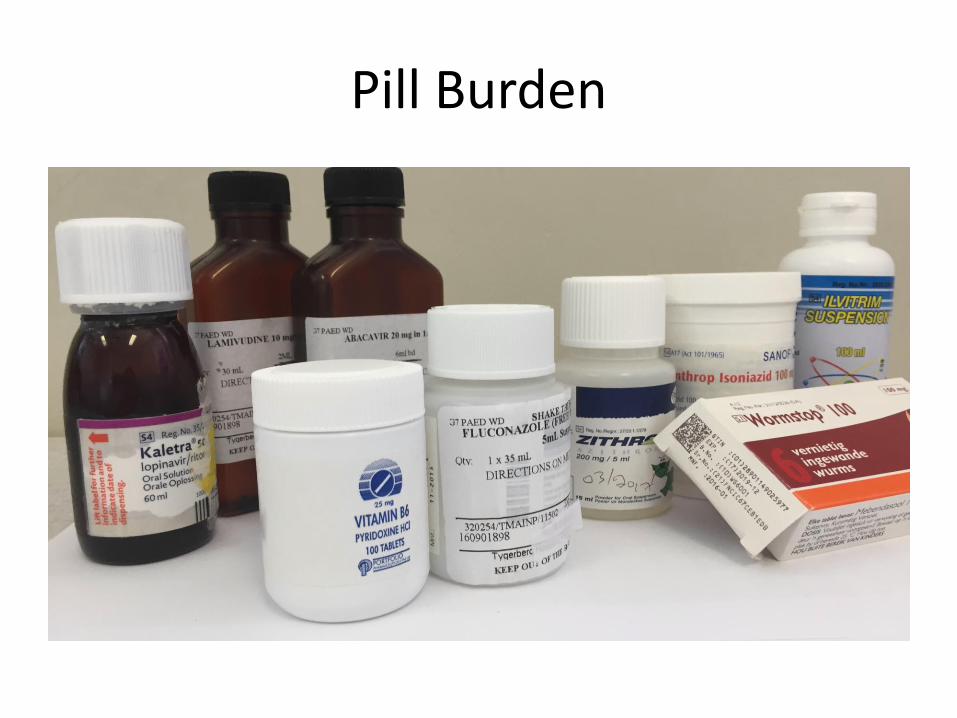
Pill Burden
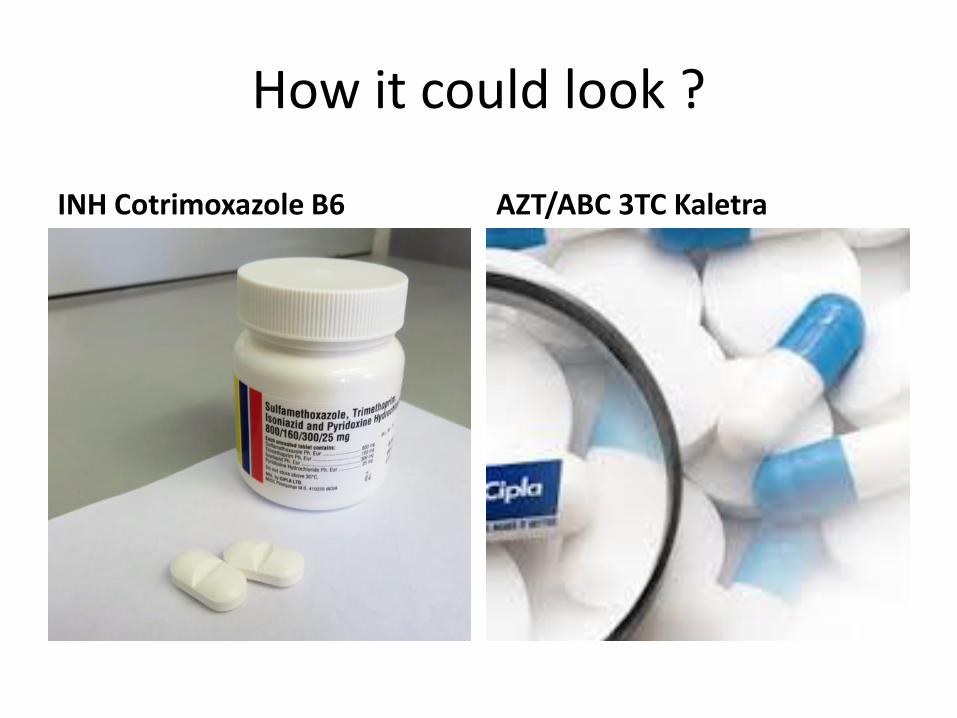
How it could look ?
INH Cotrimoxazole B6 AZT/ABC 3TC Kaletra
When to start ART in children with Severe Acute Malnutrition
Patient Characteristics at baseline
Time from admission to ART initiation
(p<0·001) i.e. mean of 5·6 days (SD 4·4)
in the early arm and
23 days (SD 5·8)
in the delayed arm
Mortality
•During the 48-week study period 14 patients (17%) demised, six (15%) in the early
arm and eight (19%) in the delayed arm. The difference in the mortality between the
two arms was not statistically significant (p=0·626). The average time from
enrollment to death was 74·4 days (SD: 59·9), range 12–252 days. The mean time
to death was 92·7 days in the early arm compared with 60·8 days in the delayed
arm. No patient demised prior to ART initiation. The majority (78·6%) of deaths
occurred before 12 weeks, 67% and 87·5% in the early and delayed arms
respectively.
CD4 count
•There was a significant increase in the overall mean CD4 count from a baseline
count of 878·5 cells/uL (SD 772·8) to 1447·9 cells/uL (SD 739·0) at 48 weeks (p–
value=0·001). The mean CD4 count at week 48 was 1366·7 (SD 732·4) cells/uL in
the early arm and 1518·2 (749·8) cells/uL in the delayed arm (p=0·532)
•Comparison of the change in CD4 count using a multiple mixed effects linear
regression model (Figure 2) suggested no statistically significant difference in
immune recovery between the two groups.
Viral Load
•At 24 weeks, 67·3% of combined patients achieved protocol define response (VL
<1000 copies/ml) overall, 59·7% in the early arm compared to 75% in the delayed
arm (not statistically significant). By 48 weeks the number of patients with protocol
defined virologic response increased to 81·1% overall, 77·8% in the early arm and
84%5 in the delayed arm. This difference at 48 weeks was not statistically significant
before and after multivariable adjustment (OR=1·66, p=0·527, 95% CI 0·34–8·06).
•A multiple mixed effects linear regression model evaluating viral load endpoint and
change, favored the delayed arm at 24 and 48 weeks.
Figure 3: (a) Mean log VL, (b) delta mean VL from baseline by trial arm and time point
Anthropometry
•At week 48, 76·6% of patients achieved an adequate anthropometric response, with
similar responses in both arms (77·2% in early arm and 76·6% in the delayed arm
(p= 0·918)). The adjusted comparison of anthropometric response at week 48 was
not significant (OR=1·66, p=0·566, 95% Cl 0·29–9·31)
•There were no significant differences in BMIZ or WHZ scores between the two arms
at 48 weeks (OR=0·79, p=0·43, 95% CI –0·96–2·25). At week 48 the difference in
weight for age Z-score (WAZ) between the two arms was marginally significant
(OR=1·67, p=0·094, 95% CI 0·11–1·44) whilst the difference in height for age Z-
score (HAZ) was statistically significant (OR=2·51, p=0·012, 95% CI 0·27–2·25).
(Figure 4). After adjusting for age, gender, immune stage, tuberculosis, haemoglobin
(Hb), total protein (TP) and albumin (Alb), only the change in HAZ remained
marginally significant.
Moherndran Archary1,2, Benn Sartorius3, Philip La Russa4, Thobekile Sibaya2, Micheal Healy5, Raziya A Bobat1,2
1 King Edward VIII Hospital, Durban
2 Department of Paediatrics and Child Health, Nelson R Mandela School of Medicine, University of KwaZulu-Natal, Durban
3 School of Nursing and Public Health, College of Health Sciences, University of KwaZulu Natal, Durban
4 Department of Pediatrics, College of Physicians and Surgeons, Columbia University, New York, New York, U.S.A.
5 Department of Medicine, Division of Infectious Diseases, Columbia University, 630 West 168th Street, New York, NY 10032, USA
HIV-INFECTED CHILDREN WITH SEVERE ACUTE MALNUTRITION
EARLY VERSUS DELAYED ART INITIATION
Materials and methodsSubjects were enrolled from King Edward VIII Hospital, a referral hospital in Durban,
South Africa. The key inclusion criteria were:
• Severe acute malnutrition ( Weight/Height < -3 Z score or Mid-upper arm
circumference < 11.5cm or Pedal Oedema)
• HIV infected diagnosed as per South African National guidelines and no prior ART
exposure (except for PMTCT)
Subjects were randomised to an early treatment arm (initiation of ART within 14 days
of admission to hospital) or delayed treatment arm (initiation of ART after nutritional
recovery and after 2 weeks following admission)
Management of the SAM was as per the WHO Inpatient Management of SAM
protocol4. Subjects were initiated on Abacavir, Lamivudine and Lopinavir/rtv if <3yrs of
age/<15kg or Abacavir, lamivudine and Efavirenz if >3yrs of age />15kg. All doses
were prescribed using the weight-band dosage chart as per the South African National
Guidelines (based on the WHO weight-band dosage chart)5.
Patients were followed up at baseline, 2 weeks, 4 weeks, 8 weeks, 12 weeks, 24
weeks and 48 weeks during which a history, clinical examination, anthropometric
examination (weight, length/height, occipito-frontal circumference, mid-upper arm
circumference, Skin fold thickness over the triceps and sub-scapula) was performed.
In addition CD4 counts, HIV Viral loads and safety bloods were performed at each of
the above time-points. A 12 hour pharmacokinetic study was performed at day 1 and
day 14 after initiation of ART.
Introduction
HIV-infected children with severe acute malnutrition (SAM) represent a distinct clinical
entity characterized by a complex interplay between increased energy expenditure
with an increased basal metabolic rate, higher rates of co–infections, diarrhea and
malabsorption, increased micronutrient deficiencies and higher rates of food insecurity
and poverty. Management is complicated by gastro–intestinal side effects to
antiretroviral drugs, perturbed lipid and glucose metabolism, and altered
pharmacokinetics of ART and antibiotics.
Despite nutritional rehabilitation, the CD4 counts in HIV–infected severely
malnourished children continue to decline, and they have a three–fold higher
probability of mortality compared to their non-infected counterparts. Although ART in
HIV infected children has significantly improved survival and quality of life, SAM
remained an independent predictor of mortality even with appropriate immunologic
and virologic responses to ART.
In 2010 the World Health Organization’s (WHO) Nutrition Guideline Advisory Group
identified determining the optimal timing of ART initiation and ART dosing for HIV–
infected children with SAM as a key issue for which guidance must be developed.
ABSTRACT
Background:
Poor access to HIV diagnostic testing and ART services for children from low and
middle-income countries, frequently results in malnutrition at initial presentation.
Despite ART initiation, HIV positive children with malnutrition have a higher mortality
and delayed immune recovery. The optimal timing of ART initiation in children with
malnutrition has not been established.
Methods:
Eighty-two HIV infected children with severe acute malnutrition (SAM) admitted to
King Edward VIII Hospital between July 2012 and December 2015 were enrolled.
Patients were randomized to initiate ART within 14 days from admission (Early arm) or
delay ART initiation until nutritional recovery and more than 14 days from admission
(Delayed arm). All patients received a standardized treatment and feeding protocol
and were evaluated at 4, 8, 12, 24 and 48 weeks.
Findings:
The average age of the patients at baseline was 23·3 months (SD 27·9, range 1.6–
129 months). The mean time from admission to ART initiation was 5·6 days (SD 4·4)
in the early arm and 23 days (SD 5·8) in the delayed arm (p<0·001).
There was no significant difference in mortality (p=0·621), virologic response
(p=0·527) and anthropometric response (p= 0·566) between the two groups at 48
weeks. However the rates of change in CD4, viral load, WAZ and HAZ scores
occurred earlier and favored the delayed arm.
Figure 2: (a) Mean CD4 and (b) delta mean CD4 from baseline by trial arm and time point
Conflict of InterestThe authors declare no conflict of interest.
Financial Support and SponsorshipThis publication was made possible by grant number: R24TW008863 from the
Office of the U.S. Global AIDS Coordinator and the U. S. Department of Health and
Human Services, National Institutes of Health (NIH OAR and NIH ORWH). Its
contents are solely the responsibility of the authors and do not necessarily
represent the official views of the government.
AcknowledgementsWe thank the MATCH Study team (Thobekile Sibaya, Micheal Healy, Alejandro
Palma, Edem Binka, Diana Cristina and Leora Sewnarain) and the parents and
study subjects for participation in the study
Presented at CROI 2017 – Seattle Feb 13-16 2017
ConclusionsHIV–infected children admitted with SAM and initiated on ART demonstrated
significant improvements in CD4 counts and anthropometric parameters, together
with significant viral load reduction compared to baseline. In this randomized
controlled trial comparing early versus delayed ART initiation in HIV infected
children admitted with SAM, although the differences in CD4 count, viral
suppression and anthropometric response at 48 weeks was not significant, the
rates of change in CD4, viral load, WAZ and HAZ scores occurred earlier and
favored the delayed arm. Based on the results of this study, we recommend that
ART initiation in children with SAM should be delayed for at least two weeks after
starting nutritional rehabilitation.
AimsTo compare the nutritional, immunological and virological responses to ART at
48 weeks in HIV infected severely malnourished children started immediately on
HAART versus children in whom HAART is delayed until their severe
malnutrition is resolved
Figure 4: (a) Mean BMI for age z-score, (b) Mean Height-for-age z-score (HAZ), (c) Mean Weight-for-age (WAZ) z-
score and (d) mean Weight-for-height z-score (WHZ) by trial arm and time point
0
200
400
600
800
1000
1200
1400
1600
1800
2000
0 4 8 12 24 48
CD
4 (
SE
)
Follow-up time (in weeks)
Early Late
0
200
400
600
800
1000
1200
1400
1600
4 8 12 24 48
Del
ta m
ea
n C
D4
fro
m b
ase
lin
e
Follow-up time (in weeks)
Early Late
0.0
1.0
2.0
3.0
4.0
5.0
6.0
7.0
8.0
0 4 8 12 24 48
Mea
n l
og
VL
(S
E)
Follow-up time (in weeks)
Early Late
-5.0
-4.5
-4.0
-3.5
-3.0
-2.5
-2.0
-1.5
-1.0
-0.5
0.0
4 8 12 24 48
Del
ta m
ea
n l
og
VL
fro
m b
ase
lin
e
Follow-up time (in weeks)
Early Late
-3.00
-2.50
-2.00
-1.50
-1.00
-0.50
0.00
0.50
1.00
0 4 8 12 24 48
WH
Z (
SE
)
Follow-up time (in weeks)
Early Late
-4.00
-3.50
-3.00
-2.50
-2.00
-1.50
-1.00
-0.50
0.00
0 4 8 12 24 48
WA
Z (
SE
)
Follow-up time (in weeks)
Early Late
-4.50
-4.00
-3.50
-3.00
-2.50
-2.00
-1.50
-1.00
-0.50
0.00
0 4 8 12 24 48
HA
Z (
SE
)
Follow-up time (in weeks)
Early Late
-3.5
-3
-2.5
-2
-1.5
-1
-0.5
0
0.5
1
0 4 8 12 24 48
BM
I fo
r a
ge
z-s
core (
SE
)
Follow-up time (in weeks)
Early Late
Early Delayed p value
Total number (82) 40 42
Age (months)
25·7
(1·7–129)
21·1
(1·6–99·7)
0·64
Gender (M:F) 60%(24): 40%(16) 55%(23): 45%(19) 0·52
CD4 Abs (mean) 805 952
0·59
CD4 % (mean) 16·4 18%
ABC/3TC/EFV 12·2% (10) 11·9% (5)
0·35
ABC/3TC/LPV/rtv 87·8% (30) 88% (37)
Time to ART initiation
(days)
5·6 23 0·0001
Tuberculosis at baseline 38% (16) 35·7% (15) 0·49
WAZ (mean) -3·518 -3·35 0·54
WHZ (mean) -2·217 -2·17 0·36
MUAC (mean) 11·36 11·7 0·66
Hb (admission) 8·87 8·8 0·37
TP (mean) 66 65 0·44
Alb (mean) 22·47 23·8 0·66
Results
A total of 82 patients were enrolled in
the study, 40 in the early arm and 42 in
the delayed arm. At week 48, in the
early treatment arm 27 patients (68%)
completed follow-up (six deaths and
seven lost to follow-up (LTFU)) while in
the delayed arm 31 patients (74%)
completed follow-up (eight deaths,
three LTFU)
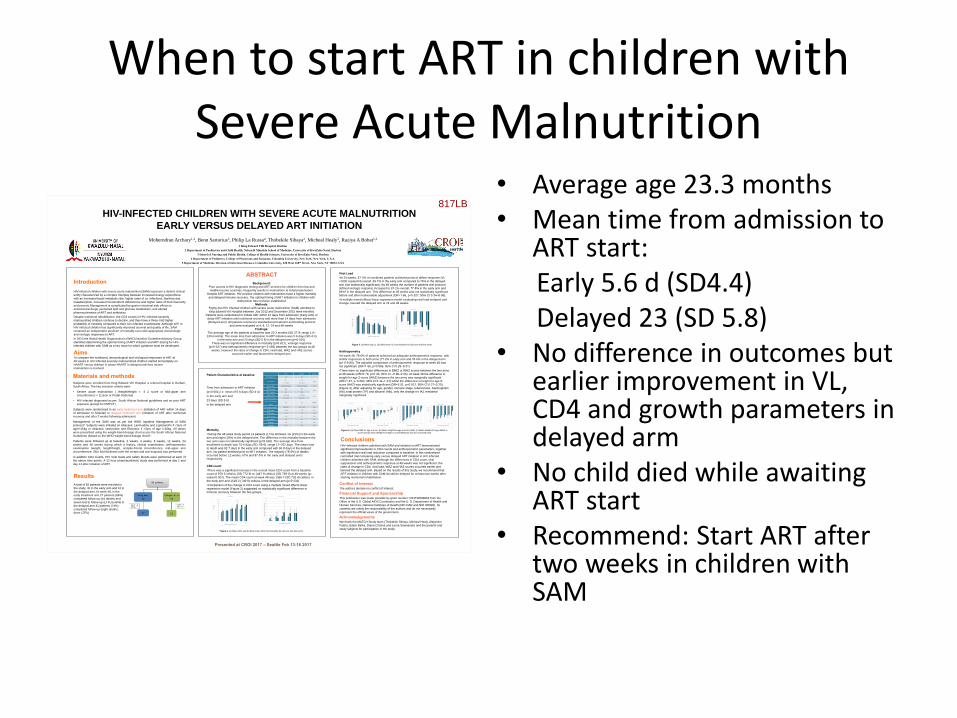
817LB
• Average age 23.3 months• Mean time from admission to
ART start: Early 5.6 d (SD4.4)Delayed 23 (SD 5.8)
• No difference in outcomes but earlier improvement in VL, CD4 and growth parameters in delayed arm
• No child died while awaiting ART start
• Recommend: Start ART after two weeks in children with SAM
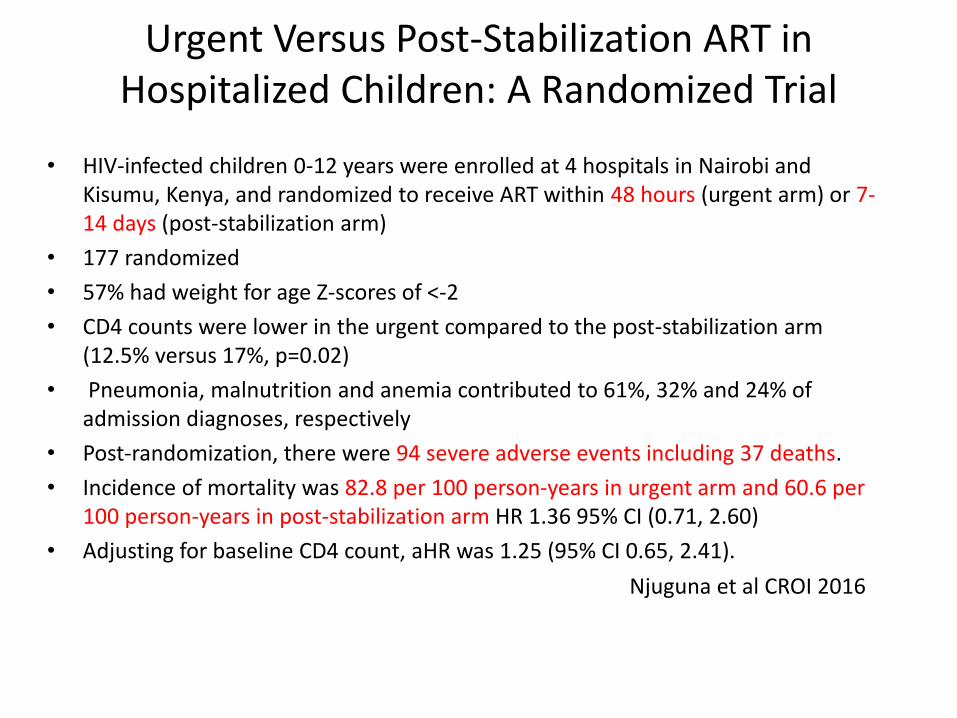
Urgent Versus Post-Stabilization ART in Hospitalized Children: A Randomized Trial
• HIV-infected children 0-12 years were enrolled at 4 hospitals in Nairobi and Kisumu, Kenya, and randomized to receive ART within 48 hours (urgent arm) or 7-14 days (post-stabilization arm)
• 177 randomized
• 57% had weight for age Z-scores of <-2
• CD4 counts were lower in the urgent compared to the post-stabilization arm (12.5% versus 17%, p=0.02)
• Pneumonia, malnutrition and anemia contributed to 61%, 32% and 24% of admission diagnoses, respectively
• Post-randomization, there were 94 severe adverse events including 37 deaths.
• Incidence of mortality was 82.8 per 100 person-years in urgent arm and 60.6 per 100 person-years in post-stabilization arm HR 1.36 95% CI (0.71, 2.60)
• Adjusting for baseline CD4 count, aHR was 1.25 (95% CI 0.65, 2.41).
Njuguna et al CROI 2016
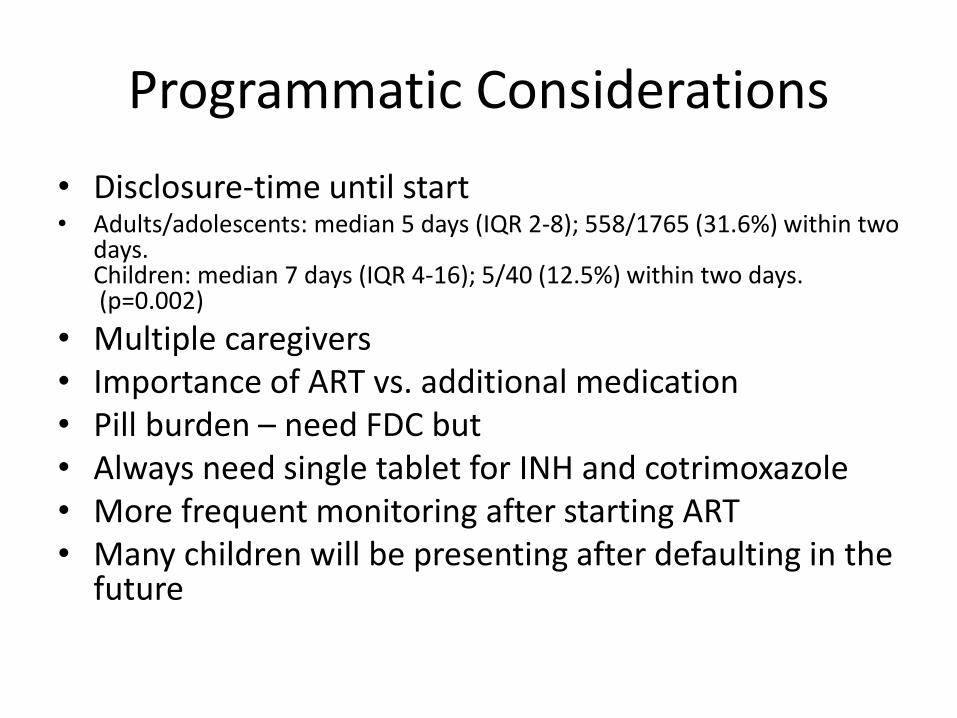
Programmatic Considerations
• Disclosure-time until start• Adults/adolescents: median 5 days (IQR 2-8); 558/1765 (31.6%) within two
days.Children: median 7 days (IQR 4-16); 5/40 (12.5%) within two days.(p=0.002)
• Multiple caregivers• Importance of ART vs. additional medication• Pill burden – need FDC but• Always need single tablet for INH and cotrimoxazole• More frequent monitoring after starting ART • Many children will be presenting after defaulting in the
future
Thank you
• Mark Cotton and P1073 team (Stellenbosch, South Africa)
• Marie- Ann Davies, Gem Patten and IeDEA team• Mo Archary (KZN, South Africa)• Di Gibb (MRC CTU UK)• Andy Prendergast (Queen Mary University London)• George Siberry (PEPFAR)• Dorothy Mbori-Ngacha (UNICEF)
• Nathan Ford (WHO)• Helena Rabie (Stellenbosch, South Africa)
Questions
• What are the WHO recommendations for children with advanced disease starting ART?
• Why is fluconazole not part of these recommendations in children less than 5 years?
• What are the main causes of morbidity in children within the first 3 months of starting ART?
• When is the best time to start ART in children less than 5 years?
P1073
• Mark Cotton, Helena Rabie, Elisa Nemes, Hilda Mujuru, Raziya Bobat, Boniface Njau, Avy Violari, Vidya Mave, Charles Mitchell, James Oleske, Bonnie Zimmer, Jennifer L. Ariensen, Elizabeth Smith and Savita Pahwa