Embed Size (px)
Citation preview
LITHIUM AND LITHIUM ISOTOPES IN TOURMALINE AS
INDICATORS OF CRYSTALLIZATION PROCESSES: A STUDY OF SAN DIEGO COUNTY PEGMATITES, CALIFORNIA
_____________________________________________________________
A Thesis presented to
the Faculty of the Graduate School at the University of Missouri-Columbia
_____________________________________________________________
In Partial Fulfillment of the Requirements for the Degree
Master of Science
_____________________________________________________________
by JENNIFER MALONEY
Dr. Peter Nabelek, Thesis Advisor
May 2007
The undersigned, appointed by the dean of the Graduate School, have examined the thesis entitled
LITHIUM AND LITHIUM ISOTOPES IN TOURMALINE AS INDICATORS OF CRYSTALLIZATION PROCESSES: A STUDY OF SAN DIEGO COUNTY
PEGMATITES, CALIFORNIA.
presented by Jennifer Maloney,
a candidate for the degree of Master of Science,
and hereby certify that, in their opinion, it is worthy of acceptance.
Dr. Peter Nabelek
Dr. Alan Whittington
Dr. Michael Glascock
ii
ACKNOWLEDGEMENTS
This work could not have been completed without the help and support of many
individuals, whom I would like to acknowledge here. First of all, I would like to
acknowledge my advisor Peter Nabelek, who was always available to give guidance and
insight, and gave me the opportunity to see parts of the country that were, perhaps, hotter
than the surface of the sun, but also some of the most beautiful places I’ve ever seen.
Thank you for having such a comfortable chair in your office. Also, my committee
members, Alan Whittington, who provided many interesting and stimulating
conversations, many of which were in his “second office”, and Michael Glascock.
Funding for all my adventures for this project was provided by the National Science
Foundation. I would also like to give Mona Sirbescu and Jim Student from Central
Michigan University a heartfelt thank you for teaching me in the field and being so
helpful with all my questions. An extra thank you goes to Mona for fluid inclusion data
and copies of field notes. I would like to acknowledge our guides in San Diego County,
Matt Taylor and Jeff Patterson, for showing us all of the mines and their passionate
discussions about pegmatite development, and the mine owners, Dana Gochenour, Louis
Spaulding Jr., and Bill Larson for allowing us to sample while they were working hard.
Thank you to Carol Nabelek for all your help running the samples on the ICP-
OES. Li isotope analyses were done at the Geochemistry Laboratory at the University of
Maryland-College Park. I would personally like to thank Ralf Halama for all his
guidance and patience when teaching me how to run samples through the columns and
for analyzing the samples.
iii
I graciously acknowledge the faculty of the Geological Sciences Department of
Mizzou, whose classes fed my interest and love of geology. The completion of this work
would never have been possible with out the support and friendship of my fellow grad
students, especially Angie, Scott, Carolina, and Geoffroy, who were always there to pick
me up when I fell, and were always willing to go for a coffee run. Thank you to Mike
Wise for introducing me to and feeding my passion for pegmatites. Also to Lindsay, your
support and friendship over the years is what has grounded me and reminded me of what
is important in life. Above all, I would also like to thank my family, especially Mom and
Dad, for being so supportive, encouraging, and loving. You are my rock, without you, I
could not have accomplished any of this. Lastly, thank you to Brian, even though you are
so far away, your support and encouragement means more to me than I could ever
express in words. Thank you for being there and for everything that you do.
iv
TABLE OF CONTENTS
Page
Acknowledgements ____________________________________________________ ii
Abstract _____________________________________________________________ vii
Introduction __________________________________________________________ 1
Background Geology ___________________________________________________ 4
San Diego Pegmatite Field _________________________________________ 8
Cryo-Genie _____________________________________________________ 10
Little Three _____________________________________________________ 10
San Diego Mine _________________________________________________ 12
Methods _____________________________________________________________ 13
Bulk Li Concentrations ____________________________________________ 13
Li Isotope Ratios _________________________________________________ 14
Results _______________________________________________________________ 17
Cryo-Genie _____________________________________________________ 18
Little Three _____________________________________________________ 22
San Diego Mine __________________________________________________ 25
Discussion ____________________________________________________________ 28
Lithium Concentration and the Crystallization Process ___________________ 28
Initial Lithium Concentration of the Melt ______________________________ 30
Lithium Isotopic Fractionation ______________________________________ 35
Conclusions ___________________________________________________________ 42
References ____________________________________________________________ 44
v
LIST OF FIGURES Figure Page
1. Map of North American Mesozoic Batholiths and Peninsular Ranges Batholith ___ 5
2. Map of San Diego County, California ____________________________________ 9
3. Plot of δ7Li vs. ppm Li for All Samples __________________________________ 18
4. Sketch of the Green Ledge at the Cryo-Genie Mine _________________________ 19
5. Sketch of the Pay Day Pocket at the Cryo-Genie Mine _______________________ 21
6. Sketch of the Topaz Ledge at the Little Three Mine _________________________ 24
7. Li Concentration of Tourmaline in Different Zones _________________________ 26
8. δ7Li Ratio of Tourmaline in Different Zones _______________________________ 27
9. Tourmaline Crystal Structure ___________________________________________ 38
10. Schematic of Li and Li Isotopic Behavior in a Pegmatitic Melt _______________ 41
vi
LIST OF TABLES Table Page
1. Lithium concentration and isotopic composition of tourmaline ________________ 17
2. Mass balance data for Co(Li) of pegmatitic melt ____________________________ 34
3. Tourmaline granite composition from Black Hills, South Dakota _______________ 35
vii
ABSTRACT
The pegmatites of San Diego County, California, are part of the Mesozoic
Peninsular Ranges Batholith of southwestern California and Baja California, Mexico. In
these lithium-cesium-tantalum (LCT) type pegmatites, tourmaline is the main reservoir
for Li. Due to the incompatibility of Li in most granitic melts and tourmaline’s ability to
incorporate large concentrations of Li, the concentration of Li in the tourmaline can serve
as a petrogenic indicator for pegmatite crystallization processes. Three pegmatites were
studied, Cryo-Genie, Little Three, and San Diego. Their footwalls are characterized by
line rock, a rhythmically layered aplite with oscillating changes in mineralogy from
quartz plus albite-rich bands to tourmaline-rich bands. Above the line rock is the
pegmatite zone, characterized by large euhedral Na-feldspar near the footwall and K-
feldspar near the hanging wall, quartz, and tourmaline, commonly as graphic
intergrowths towards the central pocket zone. Large euhedral, and sometimes gem and
specimen-quality crystals, are found in the miarolitic cavities of the pocket zone.
The Li concentrations in corresponding textural zones are similar in all three
pegmatites. Tourmaline from the line rock has the lowest Li concentrations, 56-70 ppm.
Li concentrations in the pegmatitic zone are significantly larger, 22-517 ppm, with the
most Li occurring in the pockets (265-5075 ppm in tourmaline and ~9100 ppm in fluid
inclusions). The enrichment in incompatible Li from the wall zones towards the pocket
indicates that the dikes crystallized inward from the wall rock contact. The line rock
appears to have crystallized until the melt reached fluid saturation, at which point, fluid
viii
and melt separated to form the pegmatite and the pockets, respectively. Li was strongly
partitioned in favor of the fluid.
The initial concentration of Li in the melt was estimated by mass-balance to have
been ~1120 ppm, which is significantly higher than in leucogranites that are related to
LCT pegmatite fields (10’s to 100’s ppm Li). The elevated amounts of Li and H2O that
occur in pegmatitic dikes lower the melt viscosity, and therefore increase the diffusivity
of elements through the melt by depolymerizing the SiO4 tetrahedra network. The large
crystal size and low crystallization temperatures (<500° C) suggest that these pegmatitic
dikes crystallized from a highly-fluxed, low viscosity melt through a process similar to
that described by Jahns and Burnham (1969).
The isotopic composition of tourmaline is reflective of the medium from which it
crystallized and is controlled by the coordination of Li in that medium. 7Li prefers sites
with smaller coordination numbers and stronger bonds while 6Li fractionates into weaker
sites with higher coordination numbers. Li is tetrahedrally coordinated in the melt as
Li2Si2O5 or Li2SiO3, octahedrally coordinated in tourmaline, and as the hydrated ion
[Li(H2O)4]+ in the fluid (Wunder et al., 2007). Tourmaline in the line rock has δ7Li +12.3
to +15.1 and would have crystallized from a melt that was isotopically heavier as 7Li
prefers the tetrahedral coordination in the melt over the octahedral coordination in
tourmaline. At fluid saturation when melt and fluid separated, there appears to have been
fractionation of the Li isotopes between them. Tourmaline in the pegmatitic zone is
isotopically heavier (δ7Li = +13.4 to +22.9) than that in the pocket zone (δ7Li = +11.2 to
+15.9). This suggests that 7Li was enriched in the melt and that the tetrahedral bonds of
Li in the melt are stronger than the hydrated bonds of Li in the fluid. The δ7Li values in
ix
tourmaline crystallized in the pocket are similar to those in the line rock tourmaline,
which is consistent with the accumulation of the bulk of the initial Li that was in the
original melt in the pocket fluid, as this would result in little change in the isotopic
composition of the Li.
1
Introduction
The crystallization mechanisms of pegmatites is a highly debated topic (Jahns and
Burnham, 1969; London, 1988; Morgan and London, 1999; Černý, 1991). Many
hypotheses have been presented and include processes ranging from closed system
fractional crystallization of hydrous melt (Jahns and Burnham, 1969) to rapid cooling
completely to a glass with subsequent development of pegmatitic textures by zone
refinement (Morgan and London, 1999). Černý (1991) described four plausible models
for the development of pegmatites: 1) closed chamber crystallization, 2) open system
deposition from flowing fluids, 3) recrystallization or metasomatism of finer-grained
precursors, 4) metasomatic replacement by fluids generated in the pegmatite or
introduced from an external source, or some combination of all of these. The prevalent
view of the four presented by Černý (1991) is of crystallization of a volatile-rich, hydrous
granitic melt under decreasing temperature in a relatively closed system with restricted
exchange with the wall rock.
Jahns and Burnham (1969) presented a three-stage sequence of crystallization of a
hydrous silicate melt in a closed system. The first stage involves crystallization of mostly
anhydrous phases that can range in size from aplitic to pegmatitic. The second stage is
the crystallization of a low viscosity-melt that coexists with exsolved aqueous fluid,
leading to growth of very large crystals. The final stage is the crystallization of pocket
minerals from a large vapor bubble in the absence of melt.
This study presents lithium concentrations and isotopic ratios in tourmaline from
three pegmatitic dikes in San Diego County, California, that are used as indicators of
2
crystallization mechanisms of these pegmatites. Lithium is a trace-element in most
granites, but is commonly extremely concentrated in many pegmatite dikes, which
suggests that it plays an essential control in their petrogenesis. The extreme enrichments
of Li in some pegmatites are evidenced by the occurrence of Li-rich minerals, such as
elbaite tourmaline, spodumene, amblygonite-montebrasite and lepidolite. Since Li can
readily substitute into tourmaline, and tourmaline is a ubiquitous mineral in all portions
of the pegmatite dikes, this study uses tourmaline as a proxy for lithium concentration in
the dikes. Accordingly, tourmaline can be used as a recorder of a pegmatite’s
crystallization and the behavior of Li.
The idea of using tourmaline composition to trace crystallization processes is not
unique to this study. Jolliff et al. (1986) used tourmaline compositions as a recorder of
evolution of the large, zoned Bob Ingersol pegmatite in the Black Hills of South Dakota.
They found a progressive decrease in Fe concentrations from the wall zone to the core of
the pegmatite and a corresponding increase in Li, which they attributed to substitution of
(Li + Al) for (Fe + Mg) in the structure of tourmaline with progressive crystallization.
Jolliff et al. (1986) suggest that three crystallization processes leading to the formation of
the Bob Ingersol pegmatite are distinguishable through compositional variation in the
tourmaline. They are: 1) replacement of biotite during boron metasomatism in the
country rocks leading to crystallization of a dravite-schorl tourmaline, 2) crystallization
of an intermediate schorl tourmaline from a silicate melt in the wall zone, and 3)
crystallization of elbaite in the core from a melt-aqueous fluid system.
The isotopic composition of the Li in the tourmaline can act as another indicator
of crystallization processes. Lithium isotopes undergo extreme fractionation during
3
pegmatite crystallization and fluid exsolution due to the ~17% mass difference between
the two isotopes 6Li and 7Li. Fractionation of Li is mostly controlled by the coordination
of Li in minerals, fluids, and melts; the heavier isotope, 7Li, prefers highly coordination
states and stronger bonds, while 6Li is fractionated into the weaker, lesser coordinated
sites (Wunder et al., 2007). For example, in the Tin Mountain pegmatite in the Black
Hills, δ7Li is higher in quartz than in plagioclase, muscovite, and spodumene, even
though the concentration of lithium increases from plagioclase to muscovite to
spodumene (Teng et al., 2006). The isotopic composition of Li in individual minerals
varies little, however, across the different pegmatite zones. The isotopic composition of
fluid inclusions is also lighter than in quartz, and approximately the same as in muscovite
and plagioclase. The elevated δ7Li in quartz was attributed to 7Li preferring the strong
two- and four-fold sites in quartz over the weaker bonds in the other minerals and fluids.
Teng et al. (2006) also suggested that minerals which crystallized in the presence of
exsolved fluids, fluid-rich melts, or have re-equilibrated with late-stage fluids should be
isotopically heavier than those that crystallized from a melt alone.
The goal of this study is to examine the relationship between Li concentration and
isotope fractionation in tourmaline across pegmatite dikes in the San Diego pegmatite
field in order to elucidate the interaction of minerals, melt, and fluid during
crystallization.
4
Background Geology
The pegmatites of San Diego County, California, are located within the north-
west trending, subduction-related Peninsular Ranges Batholith (PRB) that stretches from
the San Jacinto Mountains into Baja California, Mexico. The PRB is bounded on the east
by the San Andreas-Gulf of California Neogene transform-rift system and on the west by
the Continental Borderlands (Wetmore et al., 2003), and is the southernmost segment of
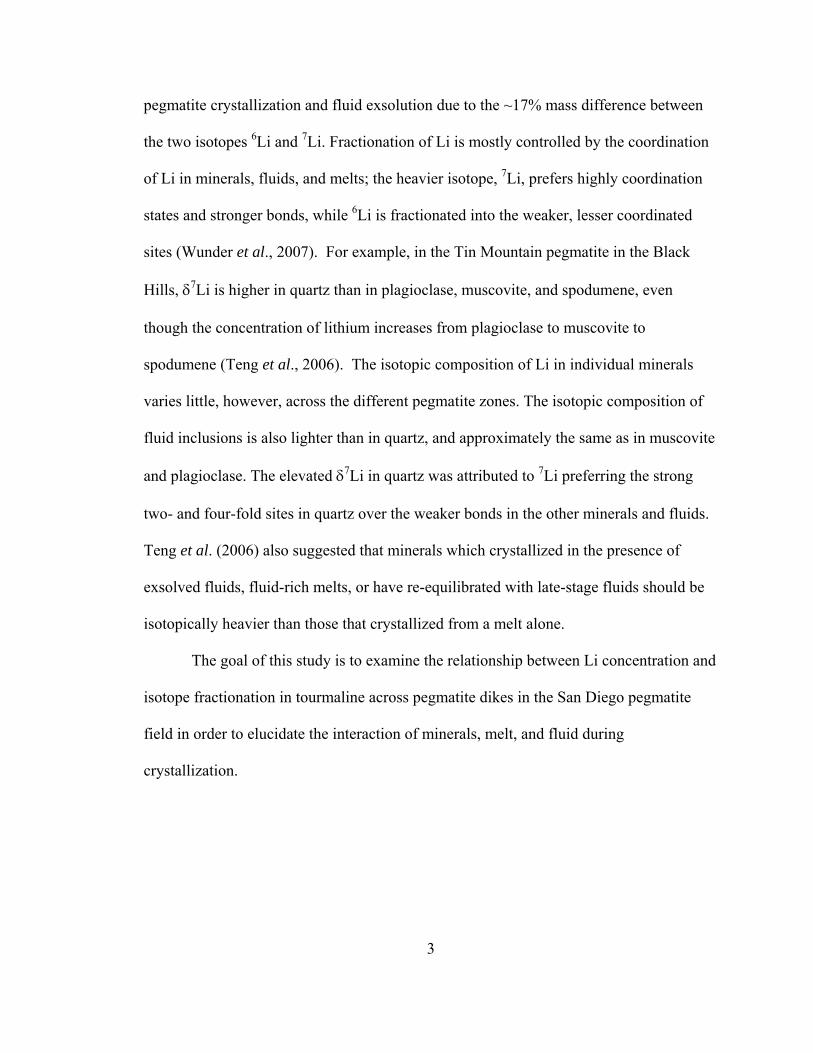
North American Mesozoic Batholiths that stretch from Alaska to Baja California ( Silver
et al., 1979) (Figure 1).
Figure 1: (A) North American Mesozoic Batholiths, figure B is highlighted in the box. (B) General geologic map of Peninsular Ranges Batholith, the study area in San Diego County, California, is highlighted in the box.
The PRB instrusive complex evolved as a continental margin migrating eastward
across the pre-Triassic join between oceanic and continental lithospheres during
subduction of the Farallon plate beneath the North American plate (Wetmore et al.,
2003). The batholith is divided into the western, eastern, and central zones based on
5
6
geochemistry, lithology, structure, and geophysics (Fisher, 2002; Clinkenbeard and
Walawender, 1989, Silver et al., 1979, Walawender, 1979, Gromet and Silver, 1979).
The western zone of the batholith is comprised of shallow I-type gabbros, quartz
diorites, tonalites, granodiorites, and monzogranites ranging from 120 to 105 Ma intruded
into late Jurassic to early Cretaceous basaltic to rhyolitic flows, volcaniclastic breccias,
welded tuffs, and hypabyssal intrusions of the Santiago Peak Formation (Silver et al.,
1979, Walawender, 1979, Walawender et al., 1990, Wetmore et al., 2003). Post-tectonic
pegmatites occur as late-stage dikes emplaced along cooling fractures in the gabbro and
tonalite. Walawender et al. (1990) hypothesized that the western zone formed from
subduction of partially altered oceanic crust, causing the release of volatiles that fluxed
the overlying mantle wedge. This melting produced hydrous basaltic melts that rose to
form gabbroic bodies in the oceanic lithosphere as well as the overlying sedimentary
apron on the leading edge of the continent.
The more felsic eastern zone is dominated by large, concentrically zoned I- and S-
type tonalites and monzogranites younger than 105 Ma intruded into greenschist to
sillimanite-upper amphibolite facies metasedimentary rocks. In the study area, the plutons
are intruded into the metasedimentary Julian Schist, metamorphosed Mesozoic sediments
from a marginal basin that decrease in age (from late Precambrian to Cretaceous age) and
metamorphic grade westward. (Clinkenbeard and Walawender, 1989, Walawender et al.,
1990, Wetmore et al., 2003). The formation of the eastern zone plutons began ~105 Ma
when magmatism in the western zone stopped due to a change in plate dynamics that
caused shallower subduction. Walawender et al. (1990) suggest that the down-going slab
was heated at a slower rate, and the volatiles released from the oceanic plate could no
7
longer escape into the water-saturated mantle wedge, so they caused partial melting of the
down-going slab, as indicated by increased radiogenic Sr in the granites indicating an
altered oceanic crustal source. The melts then rose and interacted with old continental
crust and sedimentary rocks during emplacement.
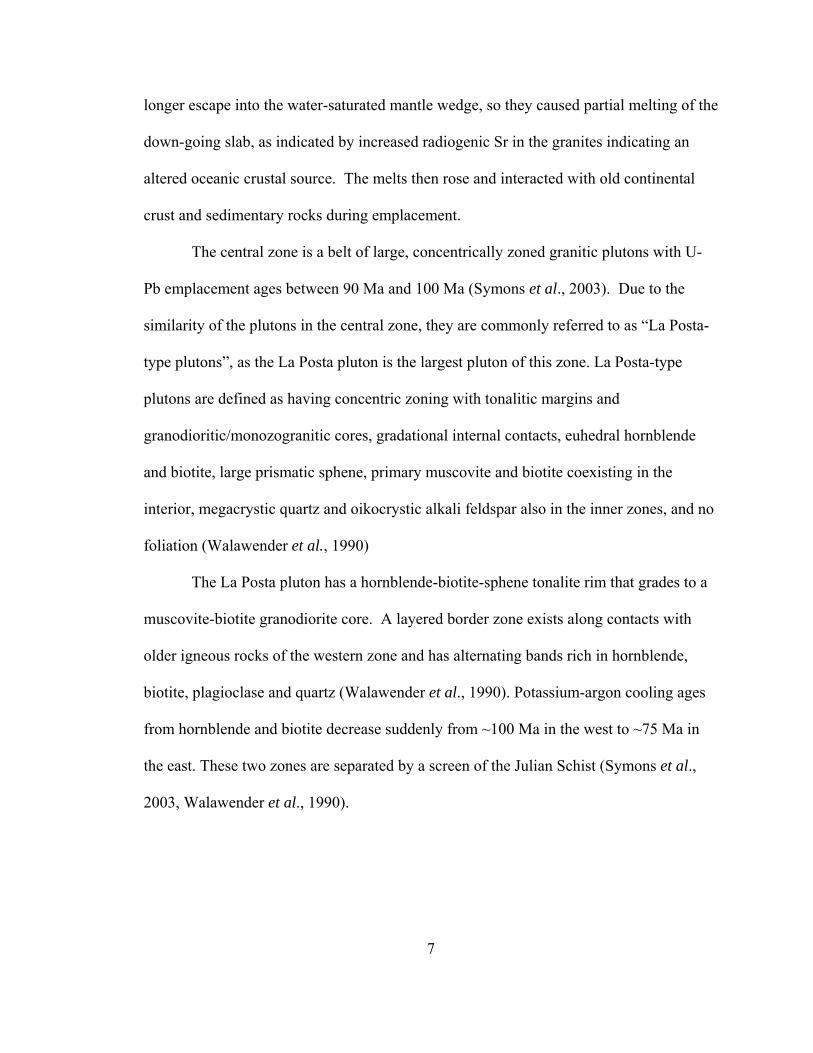
The central zone is a belt of large, concentrically zoned granitic plutons with U-
Pb emplacement ages between 90 Ma and 100 Ma (Symons et al., 2003). Due to the
similarity of the plutons in the central zone, they are commonly referred to as “La Posta-
type plutons”, as the La Posta pluton is the largest pluton of this zone. La Posta-type
plutons are defined as having concentric zoning with tonalitic margins and
granodioritic/monozogranitic cores, gradational internal contacts, euhedral hornblende
and biotite, large prismatic sphene, primary muscovite and biotite coexisting in the
interior, megacrystic quartz and oikocrystic alkali feldspar also in the inner zones, and no
foliation (Walawender et al., 1990)
The La Posta pluton has a hornblende-biotite-sphene tonalite rim that grades to a
muscovite-biotite granodiorite core. A layered border zone exists along contacts with
older igneous rocks of the western zone and has alternating bands rich in hornblende,
biotite, plagioclase and quartz (Walawender et al., 1990). Potassium-argon cooling ages
from hornblende and biotite decrease suddenly from ~100 Ma in the west to ~75 Ma in
the east. These two zones are separated by a screen of the Julian Schist (Symons et al.,
2003, Walawender et al., 1990).
8
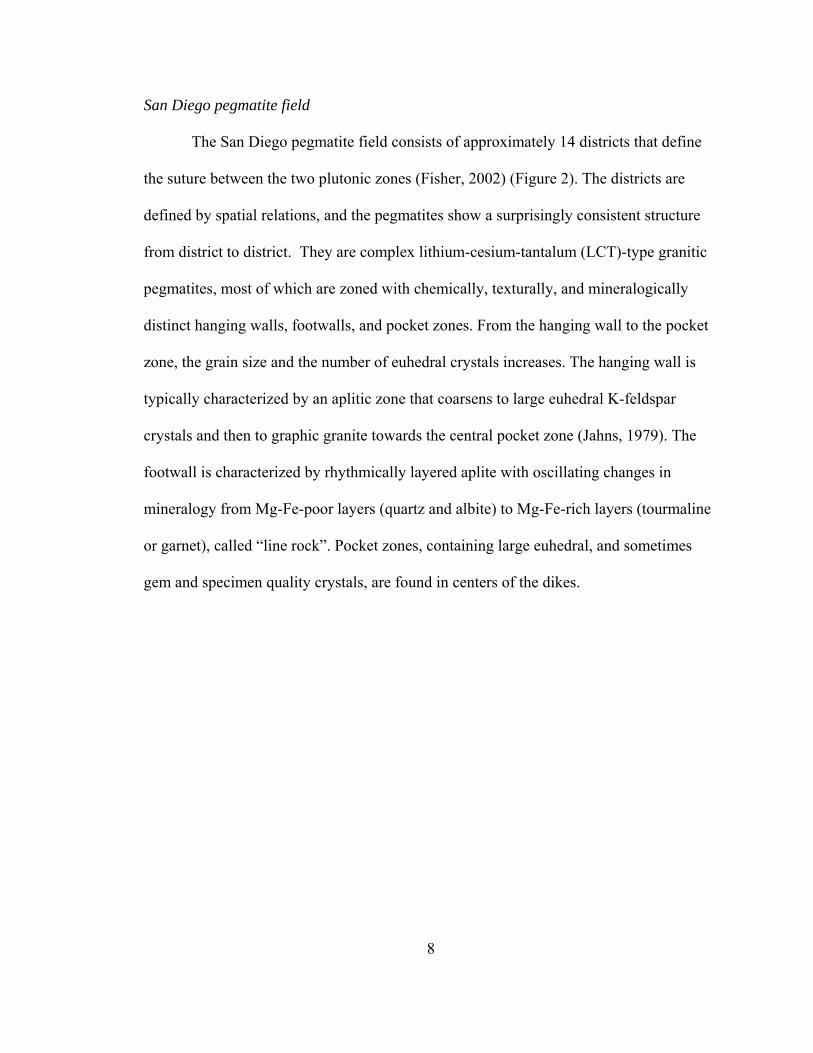
San Diego pegmatite field
The San Diego pegmatite field consists of approximately 14 districts that define
the suture between the two plutonic zones (Fisher, 2002) (Figure 2). The districts are
defined by spatial relations, and the pegmatites show a surprisingly consistent structure
from district to district. They are complex lithium-cesium-tantalum (LCT)-type granitic
pegmatites, most of which are zoned with chemically, texturally, and mineralogically
distinct hanging walls, footwalls, and pocket zones. From the hanging wall to the pocket
zone, the grain size and the number of euhedral crystals increases. The hanging wall is
typically characterized by an aplitic zone that coarsens to large euhedral K-feldspar
crystals and then to graphic granite towards the central pocket zone (Jahns, 1979). The
footwall is characterized by rhythmically layered aplite with oscillating changes in
mineralogy from Mg-Fe-poor layers (quartz and albite) to Mg-Fe-rich layers (tourmaline
or garnet), called “line rock”. Pocket zones, containing large euhedral, and sometimes
gem and specimen quality crystals, are found in centers of the dikes.
Figure 2: Map of San Diego County pegmatite districts.
9
10
Cryo-Genie
The Cryo-Genie mine is located just northwest of Warner Springs, CA, in the
southern portion of the Chihuahua Valley pegmatite district. The pegmatite dike is
intruded into sillimanite-grade metasedimentary rocks and the gneissic portion of the
local La Posta-type biotite granite (Kampf et al., 2003). The dike is possibly genetically
related to younger two-mica granites that intrude the larger La Posta-type pluton. While
no exact age has been measured for this dike, it is estimated to be 98-89 Ma based on
field relations (Kampf et al., 2003).
The dike strikes north-south, dips ~30o west, averages 2-4 m in thickness, and can
be traced laterally for more than 200 meters (Kampf et al., 2003). Ongoing mining
operations have recovered large euhedral crystals of quartz, microcline, albite (var.
clevelandite), elbaite, lepidolite, muscovite, and beryl. Gem and specimen quality elbaite
and beryl (var. morganite) crystals have been recovered from the pockets. Samples for
this study were collected along transects from the footwall to the hanging wall on the
Green Ledge in the surface excavations and near the Payday Pocket in the underground
workings.
Little Three
The Little Three mine is located in the Ramona Pegmatite district, in the central
portion of San Diego County, just east of Ramona. The Little Three property contains
five dikes: the Little Three main dike, the Hercules-Spessartine dike, the Spaulding dike,
the Sinkankas dike, and the Hatfield Creek dike (Stern et al., 1986). The dikes intrudinto
the Green Valley tonalite and gabbro, a member of the western zone of the PRB. The
Little Three Mine is famous for its gem quality tourmaline and topaz, but each of the five
11
dikes is mineralogically distinct, especially in regard to pocket mineral assemblages
(Stern et al., 1986). The pockets of the Little Three dike consist of elbaite, muscovite or
fluorine-rich lepidolite, quartz, microcline, albite, topaz, beryl, and hamgerite, the
Hercules-Spessartine dike pockets contain muscovite, microcline, albite, spessartine,
schorl, and quartz. The Spaulding dike pockets have produced orange garnet, smoky
quartz, schorl, muscovite, biotite, albite, and K-feldspar; the Sinkankas dike pockets have
produced hamberite; and the Hatfield Creek dike has yielded dark red-brown axinite
(Stern et al., 1986). Samples for this study were collected from the Little Three Main
Dike as a nearly complete transect. Samples were also collected from a mineralized area
of the Spalding dike.
Stern et al. (1986) described the mineralogical and geochemical evolution of the
Little Three system as closed system crystallization in the presence of a hydrous silicate
melt that evolved into a melt and coexisting aqueous fluid, and finally a supercritical
fluid phase. Using experiments on a saturated halpogranite, Taylor et al. (1979)
suggested that the Little Three dike was emplaced at temperatures ranging from ~700-
730oC. Crystallization from a hydrous melt began with the aplitic footwall, through
temperatures as low as 540oC. As crystallization progressed, the Na-rich albite
crystallized from the residual melt while the exsolved fluid transferred K to the hanging
wall. The subsequent nonequilibrium crystallization of the pegmatitic graphic granite
zone occurred from a water-rich melt that was unsaturated to saturated with respect to
water. Finally, the pocket zone crystallized from the exsolved aqueous vapor phase at
temperatures 565-520oC or lower with the virtual absence of any melt.
12
San Diego Mine
The San Diego Mine is a member of the Mesa Grande pegmatite district centered
on Gem Hill near Henshaw Reservoir (Fisher, 2002). The San Diego Mine exploits the
Himalaya dike system: two N30W trending, 20-30oW dipping pegmatitic dikes hosted in
the San Marcos Gabbro (Fisher et al., 1999), medium to coarse-grained gabbro and
norite (Jahns and Wright, 1951). The two dikes can be traced for 915 m along strike and
are separated by 3 to 10 m north of the San Diego Mine, but converge on the mine
property. The San Diego Mine is neighbored to the north by the Himalaya Mine (Webber
et al., 1999), a prolific producer of gem-quality colored tourmaline.
The two dikes formed during a single emplacement event at ~100 m.y, ago
(Foord, 1976), as dated by fission track and K-Ar analyses. Well-crystallized specimens
of perthitic microcline, albite (var. clevelandite), colorless and smokey quartz,
tourmaline, beryl, lepidolite, stibiotantalite, hambergite, apatite, morganite, goshenite,
and stilbite have been produced from this dike system (Fisher et al., 1999). Samples were
collected from an area where the two dikes converged in the underground workings of the
San Diego Mine.
13
Methods Bulk Li Concentrations
Tourmaline separates from three pegmatite localities in San Diego County,
California, were ground in an automatic mortar and pestle until fine and homogeneous.
100 mg of each tourmaline was then fluxed with 400 mg of ground K2CO3 in an Al2O3
crucible at 500 oC in an oven. The temperature was slowly increased to 900oC and
maintained there for 15 minutes, after which the furnace was turned off. The crucibles
were cooled in the furnace overnight to negate cracking. The fluxed samples were
washed into 15 ml centrifuge tubes using ~15 ml of 10% HNO3 and centrifuged for 4
minutes. The liquid was decanted into Teflon beakers on a hot plate with an automatic
stirrer. Another 15 ml of 10% HNO3 was added to the remaining solid residue and the
process was repeated. The remaining solid in the centrifuge tubes was finally dissolved in
3 ml of concentrated HNO3. This solution was added to the already dissolved fluxed
tourmaline in the Teflon beakers and was stirred for at least 15 minutes on low heat. The
samples were then brought up to 50 ml in a volumetric flask with 10% HNO3.
In several samples, a brown, amorphous precipitate formed after several days.
After the liquid was decanted, the precipitate was dissolved in a combination of l ml of
HF and 1 ml of HNO3 in a small Teflon beaker with a screw top lid on a hot plate over
night. It was then bought up to 50 ml in a volumetric flask with distilled water. Analysis
of the solutions revealed no Li.
Lithium and boron concentrations in the dissolved samples and precipitates were
analyzed using the Perkin-Elmer Optima 3300 Inductively Coupled Plasma Optical
14
Emission Spectrometer (ICP-OES) at the University of Missouri-Columbia. Due to the
high Li and B concentrations in tourmaline, synthetic standards were prepared to create
the calibration curves for Li and B. Four solutions of K2CO3 were spiked with 0.05 ppm
Li/5.00 ppm B, 0.10 ppm Li/10 ppm B, 1 ppm Li/15 ppm B, and 5 ppm Li/20 ppm B.
Instrumental drift was accounted for by analyzing the prepared standards at regular
intervals through the analysis and the solution of 1ppm Li/ 15ppm B was used as a check
standard. Lithium and boron concentrations were obtained from the 610.362 nm and
249.772 nm emission lines, respectively.
Li isotope ratios
Analysis of Li isotopic ratios followed the procedures outlined in Teng et al.
(2004) and Rudnick et al. (2004). The dissolved samples prepared for ICP-OES analysis
were dried and prepared for determination of Li isotopic ratios at the Geochemistry
Laboratory of the University of Maryland-College Park. Small portions of the dried
samples were transferred to Savillex screw-top beakers and treated with a 3:1 HF-HNO3
solution to remove silica. The samples were placed capped on a hot plate at ~90oC for
one hour until all solids had dissolved; the resultant solutions were slightly cloudy due to
the formation of fluorides. The samples were then uncapped and left on the hotplate to
dry overnight. To redissolve the fluorides, the samples were treated with HNO3, dried
and retreated with HCl until the solutions were clear. The samples were dried once more
to prepare for ion exchange chromatography.
Lithium separation was done using a three column technique based on that
described by Moriguti and Nakamura (1998). Samples were dissolved with 2 ml of 4 M
15
HCl and centrifuged. The first of the three steps uses 12 ml polypropylene Bio-Rad
columns filled with 1 ml of Bio-Rad AG 50Wx12 (200-400 mesh) resin; the resin was
cleaned with 10 ml of 6 M HCl followed by 10 ml of milli-Q water. One milliliter of the
sample was added to the first column, followed by 9 ml of 2.5 M HCl. Aftercut samples
were collected using 2 ml of 2.5M HCl to determine if any Li was lost during separation.
Each sample and its aftercut were dried overnight on the hotplate. The second separation
uses the same columns and resin, but the dried samples were dissolved in 1.5 ml of 0.15
M HCl. This was added to columns that had been equilibrated with 1 ml of milli-Q water.
The Li was collected using 30 ml of 0.15 M HCl and again placed on the hotplate to dry.
The final Li separation was done using quartz-glass columns filled with 1 ml of the Bio-
Rad resin that were equilibrated with 1 ml of milli-Q water. Since these columns were
longer, a pressure head was applied using nitrogen gas. The samples were redissolved in
1 ml of 0.15 M HCl and added to the columns. The Li collection was done using 16.8 ml
of 30% ethanol in 0.5 M HCl. The samples were placed on the hotplate to dry over night.
Aftercuts were collected using 2 ml of the 30% ethanol in 0.5 M HCl mixture.
Before the analysis, the Na/Li ratios of the samples were evaluated semi-
qualitatively. Any ratio larger than 5 causes interference in the Li isotope analyses, so
samples with high Na/Li ratios need to be re-run through the third column. The purified
Li solutions were diluted to ~100 ppb with 2% (v/v) HNO3 and analyzed on a Nu Plasma
Multicollector Inductively Couple Plasma Mass Spectrometer (MC-ICP-MS); 7Li and 6Li
were measured simultaneously in separate Faraday cups (7Li in the high mass Faraday
cup (H6) and 6Li in the low mass faraday cup (L5)). The samples were introduced to the
Ar plasma using an ASX-100® Cetac Technologies auto-sampler then sent through an
16
Ardius® Cetac Technologies desolvating nebulizer fitted with a PFA spray chamber and
Elemental Scientific micronebulizer. To ensure accuracy, each sample analysis was
bracketed by measurement of the L-SVEC standard, each measurement of the 7Li/6Li of
the L-SVEC had an average 2σ=0.003. The δ7Li of the samples were calculated relative
to the average of the two bracketing L-SVEC runs. Two other Li-standards, IRMM-016
(Qi et al., 1997) and the in-house standard UMD-1, were routinely analyzed during each
analytical session. Two USGS rock standards, BHVO-1 (+4.2‰) and QLO-1 (+6.6‰),
were analyzed for quality control purposes, both giving values in within the 2σ limit.
17
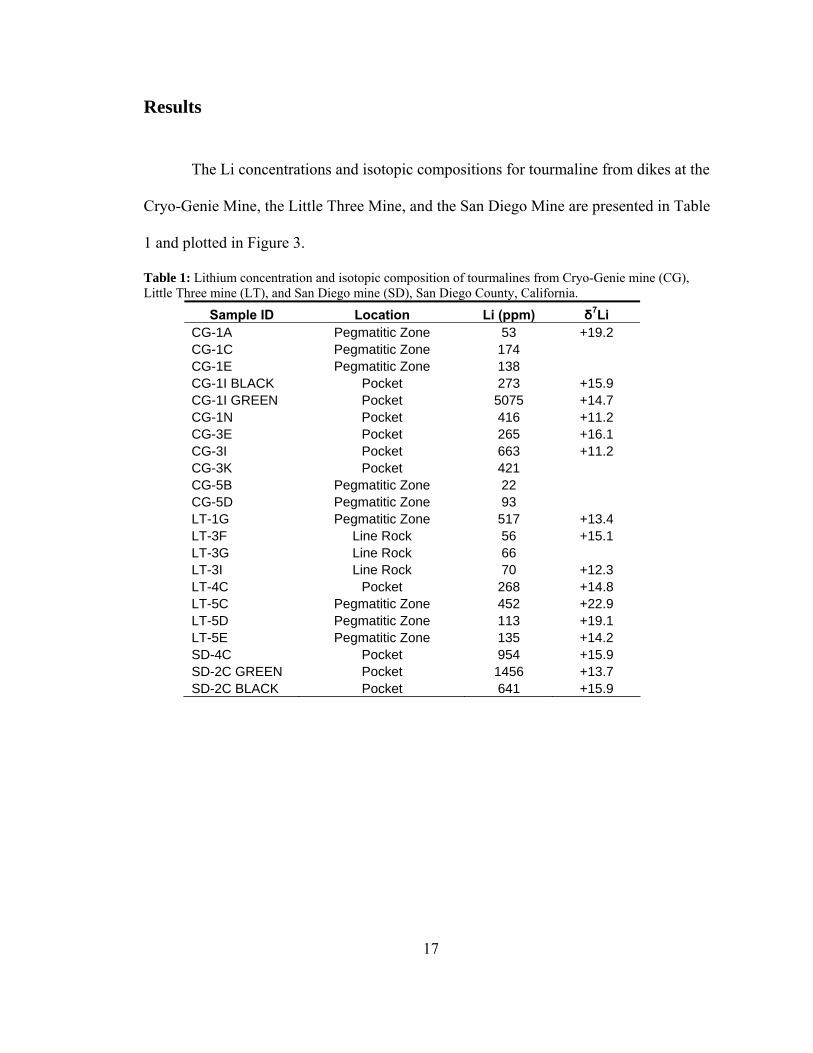
Results The Li concentrations and isotopic compositions for tourmaline from dikes at the
Cryo-Genie Mine, the Little Three Mine, and the San Diego Mine are presented in Table
1 and plotted in Figure 3.
Table 1: Lithium concentration and isotopic composition of tourmalines from Cryo-Genie mine (CG), Little Three mine (LT), and San Diego mine (SD), San Diego County, California.
Sample ID Location Li (ppm) δ7Li CG-1A Pegmatitic Zone 53 +19.2 CG-1C Pegmatitic Zone 174 CG-1E Pegmatitic Zone 138 CG-1I BLACK Pocket 273 +15.9 CG-1I GREEN Pocket 5075 +14.7 CG-1N Pocket 416 +11.2 CG-3E Pocket 265 +16.1 CG-3I Pocket 663 +11.2 CG-3K Pocket 421 CG-5B Pegmatitic Zone 22 CG-5D Pegmatitic Zone 93 LT-1G Pegmatitic Zone 517 +13.4 LT-3F Line Rock 56 +15.1 LT-3G Line Rock 66 LT-3I Line Rock 70 +12.3 LT-4C Pocket 268 +14.8 LT-5C Pegmatitic Zone 452 +22.9 LT-5D Pegmatitic Zone 113 +19.1 LT-5E Pegmatitic Zone 135 +14.2 SD-4C Pocket 954 +15.9 SD-2C GREEN Pocket 1456 +13.7 SD-2C BLACK Pocket 641 +15.9
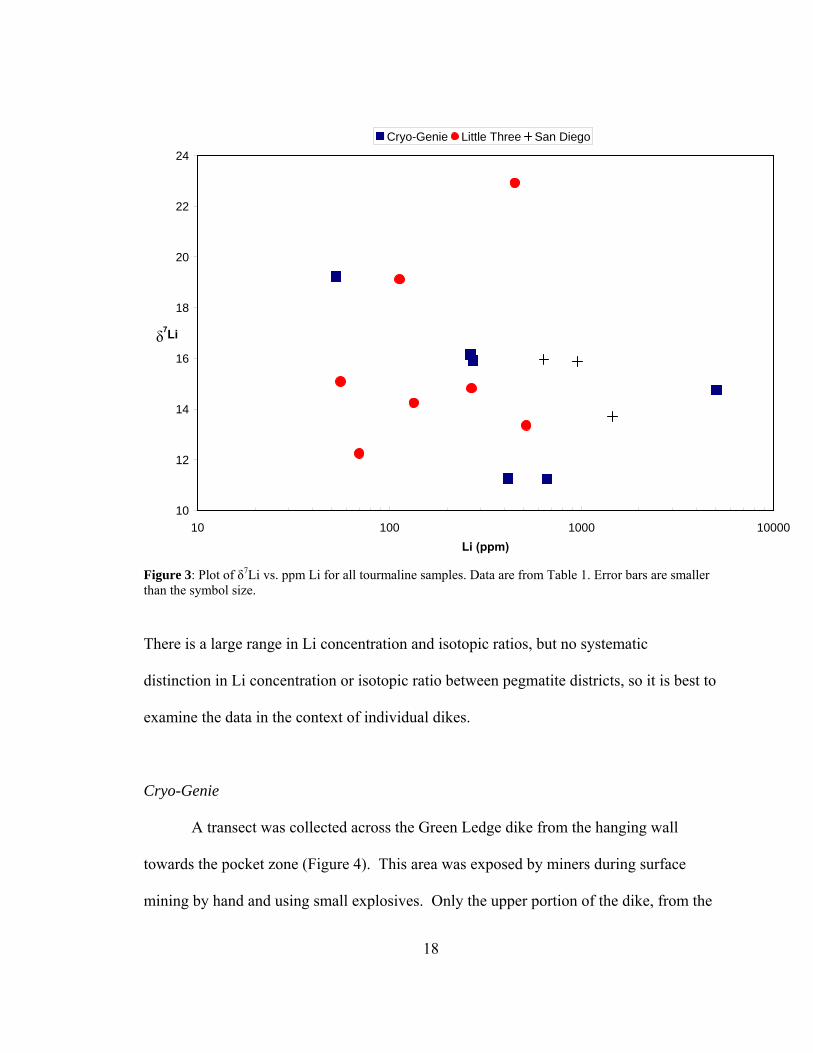
Figure 3: Plot of δ7Li vs. ppm Li for all tourmaline samples. Data are from Table 1. Error bars are smaller than the symbol size.
10
12
14
16
18
20
22
24
10 100 1000 10000Li (ppm)
Cryo-Genie Little Three San Diego
δ 7Li
There is a large range in Li concentration and isotopic ratios, but no systematic
distinction in Li concentration or isotopic ratio between pegmatite districts, so it is best to
examine the data in the context of individual dikes.
Cryo-Genie
A transect was collected across the Green Ledge dike from the hanging wall
towards the pocket zone (Figure 4). This area was exposed by miners during surface
mining by hand and using small explosives. Only the upper portion of the dike, from the
18
19
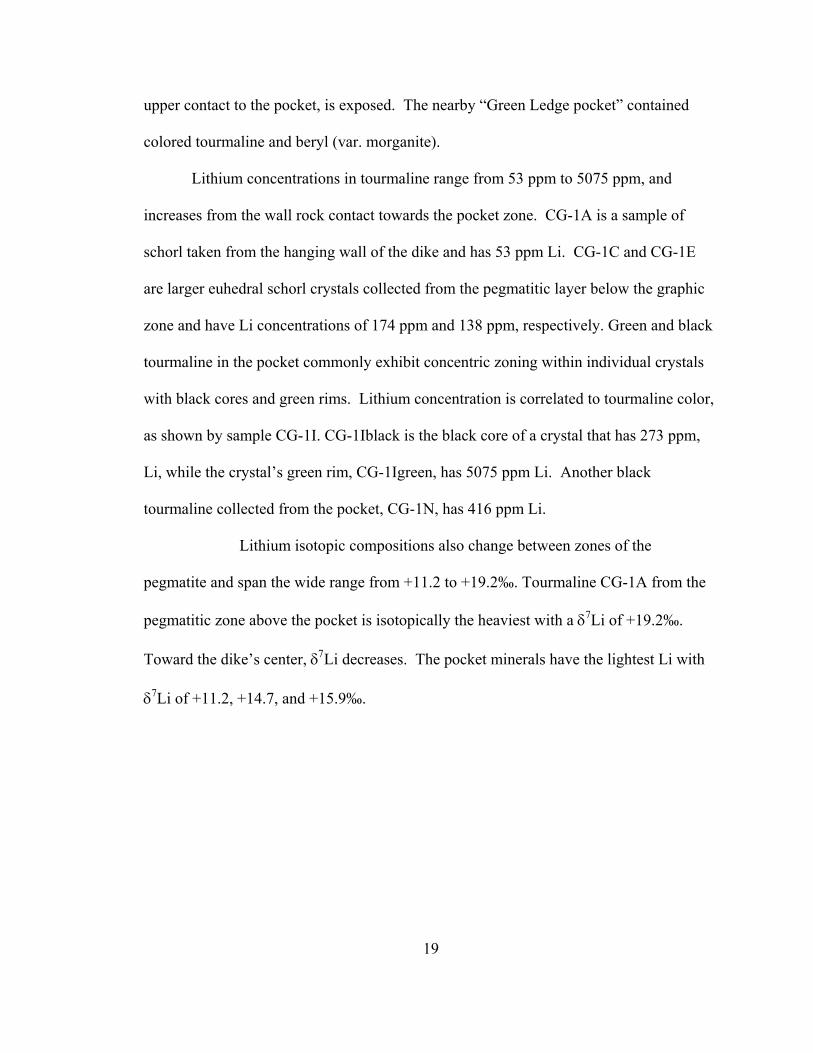
upper contact to the pocket, is exposed. The nearby “Green Ledge pocket” contained
colored tourmaline and beryl (var. morganite).
Lithium concentrations in tourmaline range from 53 ppm to 5075 ppm, and
increases from the wall rock contact towards the pocket zone. CG-1A is a sample of
schorl taken from the hanging wall of the dike and has 53 ppm Li. CG-1C and CG-1E
are larger euhedral schorl crystals collected from the pegmatitic layer below the graphic
zone and have Li concentrations of 174 ppm and 138 ppm, respectively. Green and black
tourmaline in the pocket commonly exhibit concentric zoning within individual crystals
with black cores and green rims. Lithium concentration is correlated to tourmaline color,
as shown by sample CG-1I. CG-1Iblack is the black core of a crystal that has 273 ppm,
Li, while the crystal’s green rim, CG-1Igreen, has 5075 ppm Li. Another black
tourmaline collected from the pocket, CG-1N, has 416 ppm Li.
Lithium isotopic compositions also change between zones of the
pegmatite and span the wide range from +11.2 to +19.2‰. Tourmaline CG-1A from the
pegmatitic zone above the pocket is isotopically the heaviest with a δ7Li of +19.2‰.
Toward the dike’s center, δ7Li decreases. The pocket minerals have the lightest Li with
δ7Li of +11.2, +14.7, and +15.9‰.
A
B
Figure 4: A: Picture of Jim Student, Peter Nabelek, and Mona Sirbescu in Green Ledge Pocket. B: Sketch of A, looking to the northeast
20
21
Samples CG-5B and CG-5D were also collected from the Green Ledge dike, but
down dip from the above samples. A pocket in this area yielded only one large columbite
crystal. The Li concentration in the tourmaline also increases from the wall rock contact
towards the pocket, but there is a less dramatic jump at the aplite-pegmatite transition.
CG-5B is a sample from the wall rock contact and has 22 ppm Li, whereas CG-5D, a
tourmaline from the pegmatitic zone around the pocket has 93 ppm Li.
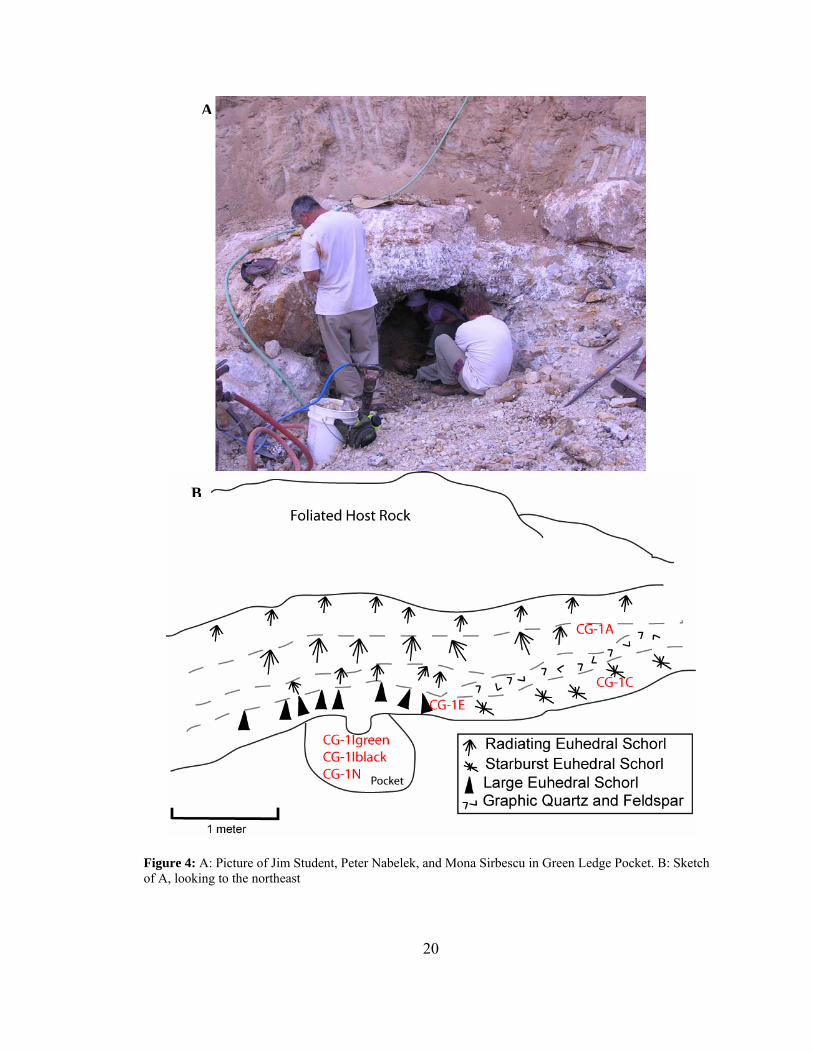
The Pay Day Pocket is located in the underground workings on the Cryo-Genie
property (Figure 5). This pocket was opened in 2001 (Gochenour, 2003) and produced
large green, pink, and black tourmalines. The dike is exposed from the aplite-host rock
contact in the footwall to the pegmatitic zone above the pocket zone. All analyzed
tourmalines from this location were from the pegmatite surrounding the pocket. The
lithium concentrations of the tourmalines CG-3E, CG-3I, and CG-3K are 265 ppm, 663
ppm, and 421 ppm, respectively. They are within the range of those collected from the
pegmatite pocket zone around the Green Ledge pocket.
The δ7Li value for tourmaline CG-3K above the Pay Day pocket is +11.2‰, and
is lighter than for tourmaline CG-3E in the bottom lining of the pocket, which is +16.1‰.
Both of these values are lighter than the δ7Li value of the wall zone tourmaline in the
Green Ledge.
A B
C
Figure 5: A: Photograph of pegmatite above Pay Day Pocket. B: Jennifer Maloney and Mona Sirbescu in underground workings of Cyro-Genie Mine. C: Sketch of the Pay Day pocket in the underground workings of the Cryo-Genie mine, looking north.
22
23
Little Three
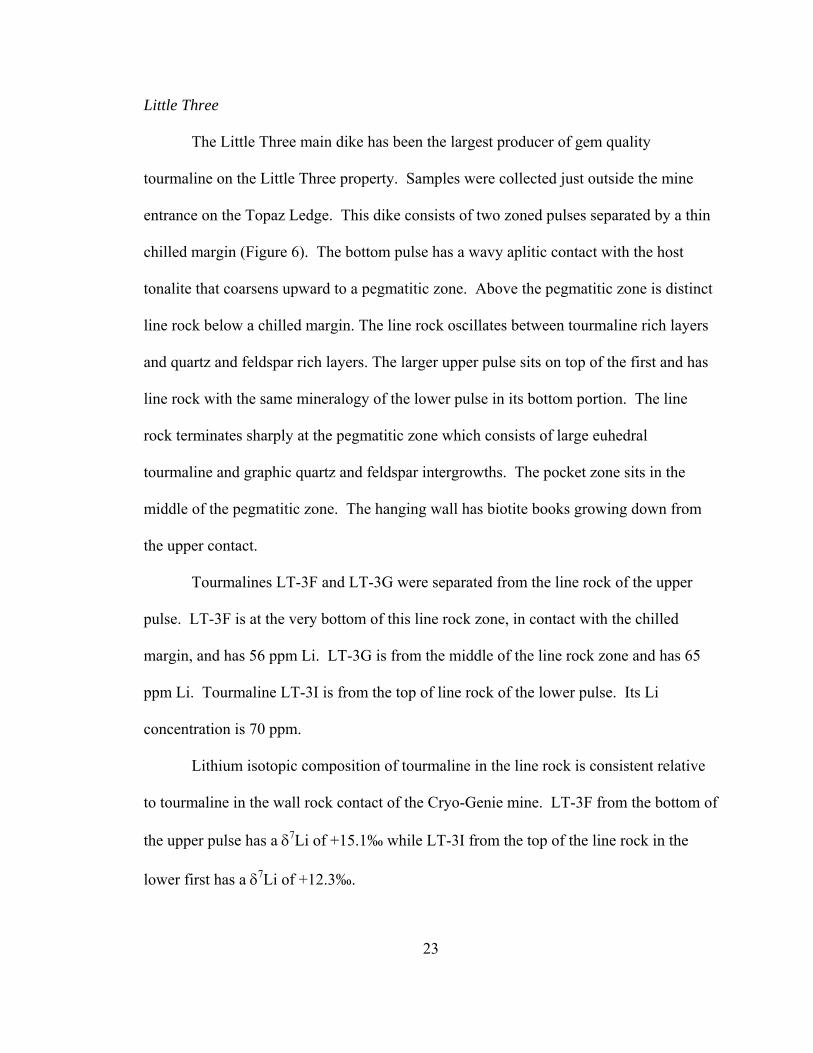
The Little Three main dike has been the largest producer of gem quality
tourmaline on the Little Three property. Samples were collected just outside the mine
entrance on the Topaz Ledge. This dike consists of two zoned pulses separated by a thin
chilled margin (Figure 6). The bottom pulse has a wavy aplitic contact with the host
tonalite that coarsens upward to a pegmatitic zone. Above the pegmatitic zone is distinct
line rock below a chilled margin. The line rock oscillates between tourmaline rich layers
and quartz and feldspar rich layers. The larger upper pulse sits on top of the first and has
line rock with the same mineralogy of the lower pulse in its bottom portion. The line
rock terminates sharply at the pegmatitic zone which consists of large euhedral
tourmaline and graphic quartz and feldspar intergrowths. The pocket zone sits in the
middle of the pegmatitic zone. The hanging wall has biotite books growing down from
the upper contact.
Tourmalines LT-3F and LT-3G were separated from the line rock of the upper
pulse. LT-3F is at the very bottom of this line rock zone, in contact with the chilled
margin, and has 56 ppm Li. LT-3G is from the middle of the line rock zone and has 65
ppm Li. Tourmaline LT-3I is from the top of line rock of the lower pulse. Its Li
concentration is 70 ppm.
Lithium isotopic composition of tourmaline in the line rock is consistent relative
to tourmaline in the wall rock contact of the Cryo-Genie mine. LT-3F from the bottom of
the upper pulse has a δ7Li of +15.1‰ while LT-3I from the top of the line rock in the
lower first has a δ7Li of +12.3‰.
24
Directly above the Topaz Ledge mine entrance is the Dave London 1991 pocket.
One large tourmaline that grew down from the roof of this pocket, LT-4C, was analyzed.
The Li concentration is consistent with other black pocket tourmalines, 268 ppm. The
δ7Li of this tourmaline is +14.8‰.
Samples were also collected from the southern end of the mineralized section of
the Topaz Ledge. This is a large area of pegmatite with smaller blocks of line rock that
sit above an exposed pocket floor. It is possible that these blocks of line rock were rafted
into the pegmatitic portion of this dike. LT-5C, LT-5D, and LT-5E were collected from
the pegmatitic portion in contact with one of the line rock blocks. The tourmalines have
concentrations of 452 ppm, 113 ppm, and 135 ppm Li, respectively. The concentrations
of LT-5D and LT-5E are consistent with those of euhedral tourmaline from the
pegmatitic portion of the dike at the Cryo-Genie mine (53 to 174 ppm), but LT-5C has
significantly more Li.
The δ7Li values are +22.9‰ for LT-5C, +19.1‰ for LT-5D, and +14.2‰ for LT-
5E. This Li is heavy compared to Li in similar tourmalines from other dikes and are
more comparable to tourmalines from wall rock-aplite contacts than those in pegmatitic
portions.
One sample was collected from the Spalding Dike, along the Garnet Ledge. This
was a trench in surface workings that yielded large orange garnet crystals. A tourmaline
from this location, LT-1G, had 517 ppm Li and a δ7Li of +13.4‰.
A
B
Figure 6: A; Photo of the upper pulse of the Little Three Main Dike at the Topaz Ledge B. Sketch of Topaz Ledge e outside the entrance to the mine of the Little Three main dike, looking north.
25
26
San Diego
A euhedral, concentrically zoned tourmaline with a black core, SD-2Cblack, and a
green rim, SD-2Cgreen, from a probable pocket in the San Diego mine was analyzed.
The black core has 641 ppm Li with δ7Li of +15.9‰.The green rim of the crystal has
1456 ppm Li with δ7Li of +13.7‰. SD-4C, a black tourmaline crystal, was collected
from a small productive pocket of the mine. This sample has 954 ppm Li with δ7Li of
+15.9‰.
Summary
Since Li is a characteristic element in the San Diego LCT-type pegmatite dikes,
Li concentrations and isotopic ratios in tourmaline have the potential to serve as
indicators of pegmatite crystallization and the conditions under which different zones
crystallize. Tourmaline in aplitic zones and line rock in contact with host rocks has the
lowest concentration of lithium, on the order of tens of ppm (Figure 7). There is a
significant jump in Li concentration between tourmaline in line rock or aplite and
euhedral tourmaline in the pegmatitic zones of the dikes, which typically have Li
concentrations in excess of 100 ppm. Black schorl tourmalines in pockets have similar
concentrations while green rims have concentrations ranging to thousands of ppm.
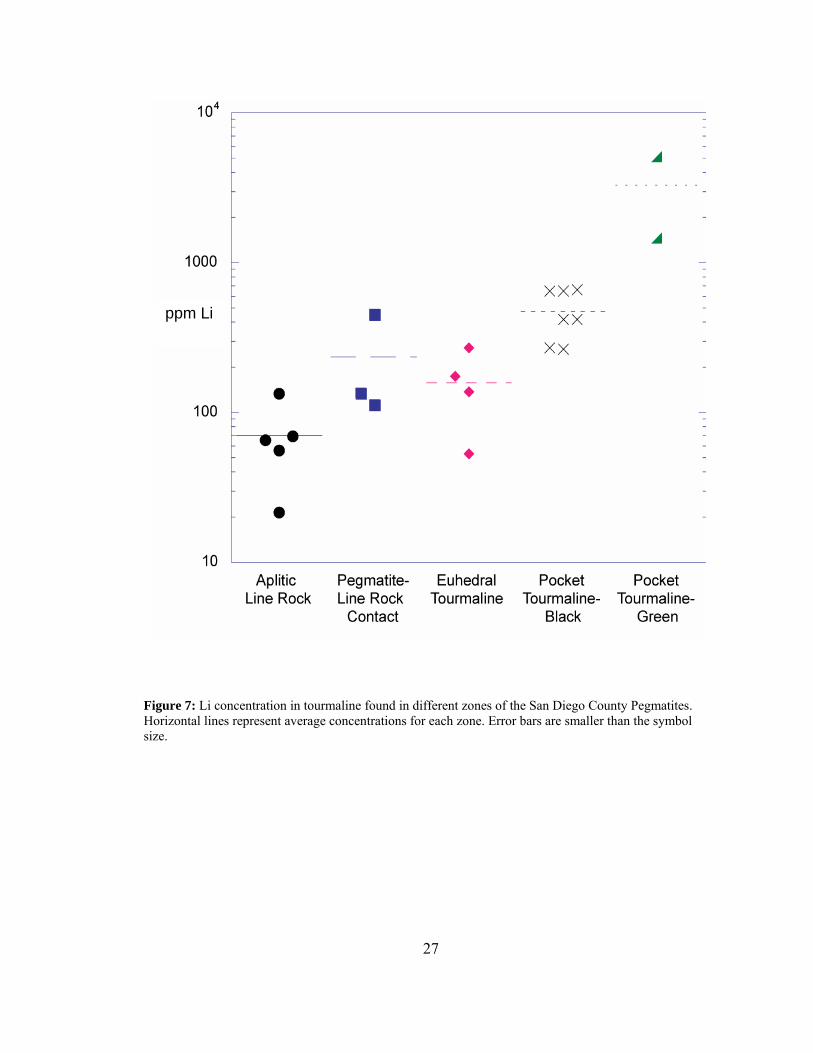
ppm Li
Figure 7: Li concentration in tourmaline found in different zones of the San Diego County Pegmatites. Horizontal lines represent average concentrations for each zone. Error bars are smaller than the symbol size.
27
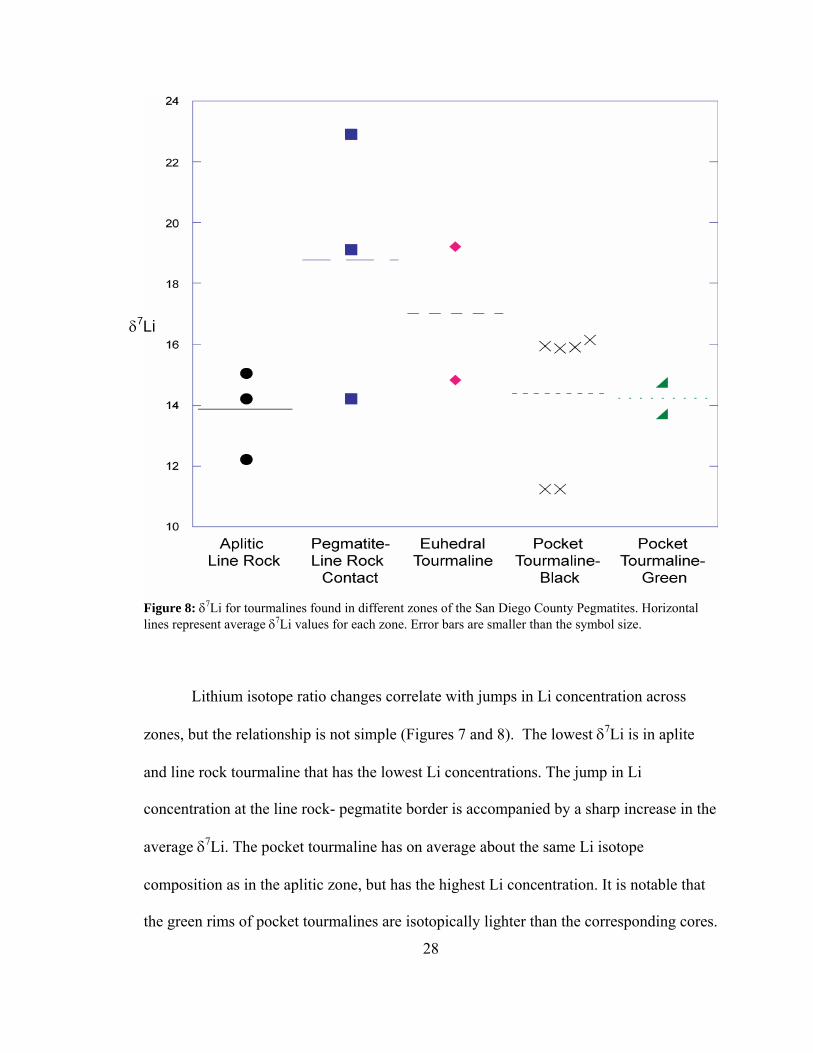
δ7Li
Figure 8: δ7Li for tourmalines found in different zones of the San Diego County Pegmatites. Horizontal lines represent average δ7Li values for each zone. Error bars are smaller than the symbol size. Lithium isotope ratio changes correlate with jumps in Li concentration across
zones, but the relationship is not simple (Figures 7 and 8). The lowest δ7Li is in aplite
and line rock tourmaline that has the lowest Li concentrations. The jump in Li
concentration at the line rock- pegmatite border is accompanied by a sharp increase in the
average δ7Li. The pocket tourmaline has on average about the same Li isotope
composition as in the aplitic zone, but has the highest Li concentration. It is notable that
the green rims of pocket tourmalines are isotopically lighter than the corresponding cores.
28
29
Discussion Lithium is enriched in L-C-T pegmatites, and in the San Diego County pegmatites
Li is stored in almost exclusively in tourmaline and in the pockets also in lepidolite. The
absolute Li concentration varies between zones of the dikes showing progressive
enrichment from the line rock border zones to the pockets. Due to high Li concentrations
in the dikes and the ability of tourmaline to incorporate extreme amounts of Li into its
structure, Li concentration in tourmaline can serve as a mirror on the pegmatite
crystallization process.
Lithium Concentration and the Crystallization Process
Tourmaline in the line rock has the lowest concentration of Li compared to
tourmaline in other zones. This suggests that during line rock crystallization, Li was
incompatible with respect to minerals in the line rock, including tourmaline. Euhedral
tourmaline in the pegmatitic zones contains more Li than tourmaline in the line rock, but
much less Li than tourmaline in the pockets. The high concentration of Li in the pocket
resulted in the crystallization of elbaite (Li-rich tourmaline end-member), and is
supported by the high concentration of Li in fluid inclusions (~9100 ppm; Sirbescu, pers.
comm.) in quartz that formed on the pocket floor.
The difference in Li concentration between tourmaline in the pegmatitic zones
and in the pockets suggests that Li was partitioned between pegmatite and fluid at the
point of fluid saturation in the melt (Figure 10). Fluid saturation of the melt is marked by
the change in texture from the aplitic line rock to the very coarse grained pegmatite. It is
suggested that the large crystals in the pegmatite formed as the result of H2O acting as a
30
network-modifier in the melt, which results in lowering of melt viscosity and in
increasing the diffusion rate of chemical components, which allow faster crystal growth,
even at low temperatures of undercooling. Two-feldspar thermometry records
crystallization temperatures of the melt as low as 240oC in the Little Three dike, which
probably cooled to below its solidus in 33-84 days (Morgan and London, 1999). The
possibility of very low crystallization temperatures of pegmatite dikes to <350° C is
supported by microthermometry of primary fluid inclusions in the Tin Mountain
pegmatite in the Black Hills, oxygen isotope ratios in coexisiting quartz and K-feldspar
and lack of tartan twinning in K-feldspar, which indicate its subsolvus crystallization
(Sirbescu and Nabelek, 2003).
The extremely high Li concentrations in the pockets suggest that most of the Li
partitioned into the fluid. In a hydrous, peraluminous composition, Li is an incompatible
element with a Dfluid/melt~0.4 at temperatures ranging from 650 to 775oC(London et al,
1988). Webster et al. (1989) suggested that Dfluid/melt increases with temperature, mole
fraction of water, and Cl content in the vapor.
The enrichment in incompatible Li from the wall zones towards the pocket
indicates that the dikes crystallized inward from the wall rock contact. It is suggested that
line rock crystallized until the melt reached fluid saturation, at which point fluid and the
melt separated to form the pegmatitic zones and the pockets, respectively. These trends
support the Jahns and Burhnam (1969) hypothesis of pegmatite formation through
fractional crystallization and vapor separation in a hydrous melt. The Li enrichment
observed in the San Diego County pegmatites is inconsistent with pegmatite development
31
by open system deposition from flowing fluids, metasomatism of finer-grained
precursors, or zone-refining of a rapidly quenched melt.
Initial Lithium Concentration of the Melt
In order to determine the amount of enrichment of potential fluxing components
that occurs during pegmatite crystallization, the initial concentration (Co) of Li in the melt
was estimated from concentrations found in tourmaline and fluid inclusions. The initial
Li concentration can be accounted for by the mass proportion of line rock, pegmatitic
zone, and fluid bubble (now represented by the pocket). As tourmaline is the largest
reservoir for Li in the dike, the concentration of Li in line rock and pegmatite can be
estimated by the proportion of tourmaline in each zone and the amount of Li in the
tourmaline (Table 2). The Li concentration in the fluid bubble was determined by
analysis of primary fluid inclusions in quartz that occurs in or near the pockets. These
inclusions have on average ~9100 ppm Li.
Using the mass balance equation:
Co=XLRCLR + XPEGCPEG + XPOCKCPOCK,
where X is the mass proportion of each zone and C is the concentration of Li in each zone
(Table 2), the initial concentration of Li in the melt was calculated as ~1120 ppm. Most
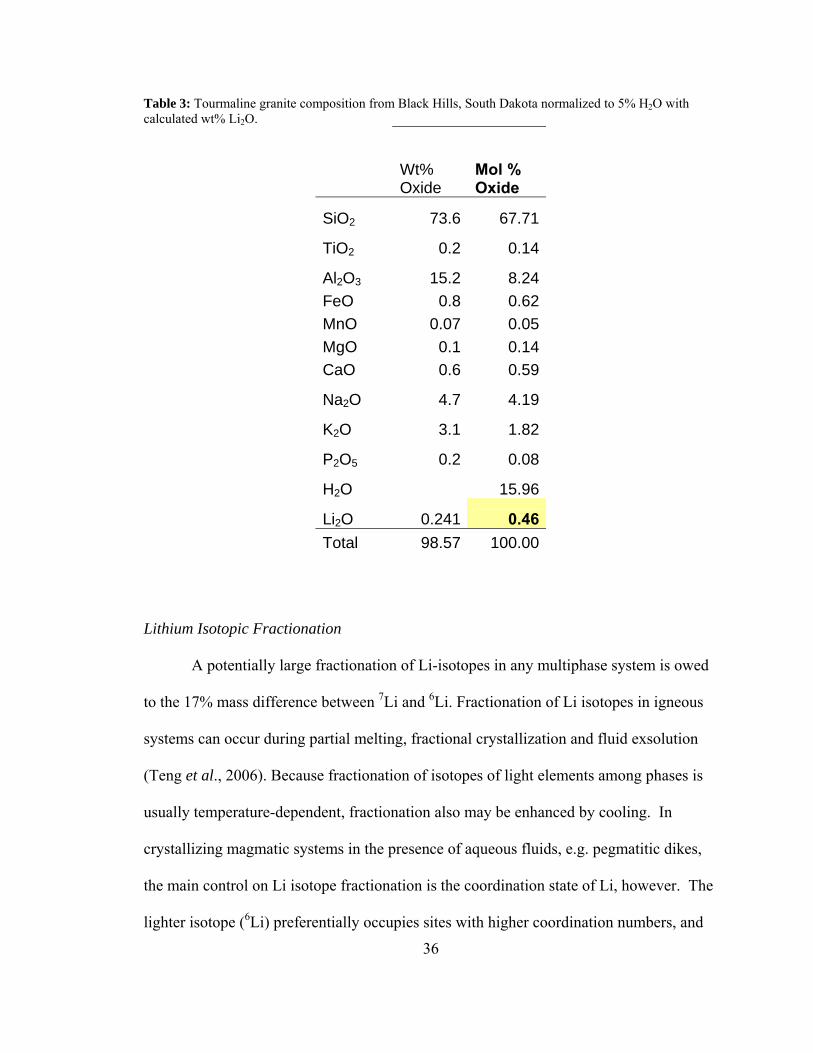
of this Li is in fact accounted for by Li in the pocket fluid. Given a leucogranite
composition of the melt with 5 wt% H2O, as estimated to be water-saturation at 2 kbar
emplacement, the pegmatitic melt is estimated to have initially contained ~0.5 mol %
Li2O (Table 3).
32
The concentration of Li in these pegmatites is significantly higher than that in
granites. The Harney Peak Granite in the Black Hills of South Dakota contains 10’s of
ppm Li in areas of the pluton devoid of pegmatites and 100’s of ppm in pegmatitic
portions (Nabelek, unpublished data). In contrast, the Tin Mountain pegmatite, contains
up to 1.7 wt % Li2O (Walker et al., 1986). This elevated Li content is manifested in the
pegmatite by the presence of extremely Li-rich mineral phases, such as spodumene and
amblygonite.
Many crystallization processes for Li-rich pegmatites have been proposed and
differ significantly (Walker et al., 1986; Morgan and London, 1999), but all hypotheses
suggest that Li has a large influence on the behavior of the melt. Walker et al. (1986)
hypothesized that crystallization of the Tin Mountain pegmatite commenced in the wall
zone, based on the low Li concentrations in the wall zone. The first intermediate zone
crystallized next, marked by the high Sr concentration and positive Eu anomaly in the
feldspar. The structure of the melt then changed when it became more fluid rich and the
core, 2nd, and 3rd intermediate zones crystallized simultaneously inward.
Morgan and London (1999) propose a vastly different crystallization process for
the Little Three Pegmatite. Morgan and London (1999) hypothesized that the low
temperature and the fast cooling rate that must have occurred during solidification of the
pegmatite did not allow for crystal nucleation until the melt has reached a state of very
large undercooling (~250oC below the equilibrium liquidus). They proposed that the dike
quenched to a glass and that crystals formed through constitutional zone refinement – a F
and Li-rich boundary layer that formed due to the large initial undercooling, rapid growth
rate, and low temperature impeded diffusion of incompatible elements into the melt,
33
which migrated through the glass. The increase of Li in the pocket zone of the Little
Three was therefore suggested to be due to an increase in incompatible Li in the
boundary layer as it moved through the dike and culminated near the pockets.
It is proposed here that the crystallization of the San Diego County pegmatites
does not occur by constitutional zone refinement, but by crystallization from a highly
fluxed melt, similar to the process suggested by Walker et al. (1986). The presence of
fluxing components in high concentrations in pegmatitic melts, such as Li and H2O, alter
the rheology of a silicate melt by depolymerizing the silicate network (Mysen and Richet,
2005). In natural melts, oxygen in the SiO4 tetraheda can bond with the cation or water
molecule, depolymerizing the melt.
The effect on melt polymerization, and therefore properties directly dependent on
polymerization such as viscosity and diffusivity, increases with concentration of fluxing
components. The presence of Li alone in the melt lowers the viscosity of the melt, but it
is doubtful that 0.5 mole % of Li2O alone would have had a drastic effect on the
properties of the pegmatitic melts. Pegmatitic melts are also hydrous, and the presence of
water in the melt has an even greater effect on the structure of melt than Li. Water
depolymerizes the melt by dissolving as molecular H2O and OH- groups. The OH- groups
can form alkali-OH, Al-OH, and Si-OH complexes which break up the tetrahedral
network. For example, in alkali-bearing melts, viscosity drops dramatically with in the
first 1 wt% water (Romano et al., 2001). This drop in viscosity promotes a faster
diffusion rate and faster crystal growth. Water also depresses the solidus and glass
transition of the melt to allow for crystallization of a strongly undercooled melt, negating
the necessity of a dike solidifying to glass at temperatures <400oC (Morgan and London,
34
1999). In a haplogranite, the glass transition temperature (Tg) is depressed >350oC with
the addition of 5 wt.% H2O (Dingwell et al., 1996), and for a peraluminous leucogranite,
Whittington et al. (2004) showed that Tg was reduced from 766oC to 414oC with the
addition of 3.4 wt.% H2O. This depression of Tg allows for the crystallization of fluxed
undercooled liquids before viscosity increases and crystal growth becomes hindered as
the melt approaches the glass transition.
Pegmatitic melts are also enriched in F, as evidenced by the crystallization of
tourmaline, topaz, and minor fluroapatite. The presence of F in the melt reduces
viscosity, and has in increased effect with increasing SiO2 content of the melt. F
substitutes for a bridging oxygen forming Si-F bonds, and also forms complexes with Al
in a non-network position, liberating equivalent alkalis, such as Li, from charge balancing
roles, depolymerizing the melt (Mysen and Richet, 2005).
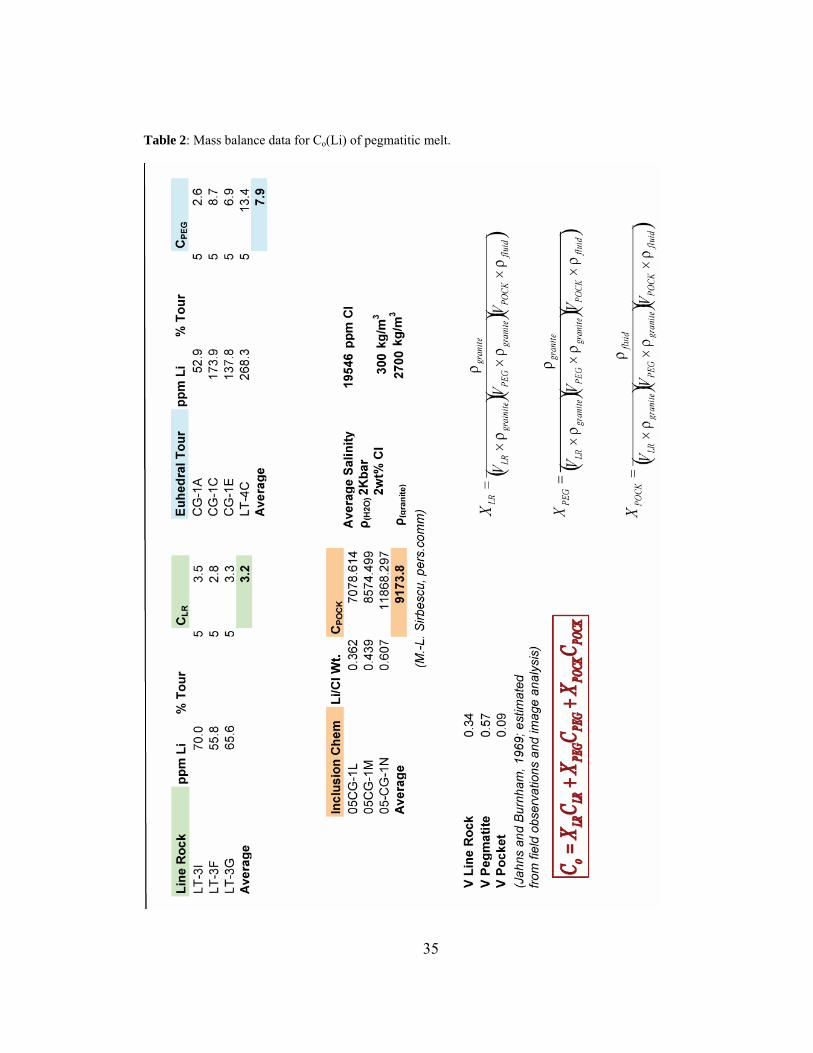
Table 2: Mass balance data for Co(Li) of pegmatitic melt.
35
36
Table 3: Tourmaline granite composition from Black Hills, South Dakota normalized to 5% H2O with calculated wt% Li2O.
Wt% Oxide
Mol % Oxide
SiO2 73.6 67.71
TiO2 0.2 0.14
Al2O3 15.2 8.24FeO 0.8 0.62MnO 0.07 0.05MgO 0.1 0.14CaO 0.6 0.59
Na2O 4.7 4.19
K2O 3.1 1.82
P2O5 0.2 0.08
H2O 15.96
Li2O 0.241 0.46Total 98.57 100.00
Lithium Isotopic Fractionation A potentially large fractionation of Li-isotopes in any multiphase system is owed
to the 17% mass difference between 7Li and 6Li. Fractionation of Li isotopes in igneous
systems can occur during partial melting, fractional crystallization and fluid exsolution
(Teng et al., 2006). Because fractionation of isotopes of light elements among phases is
usually temperature-dependent, fractionation also may be enhanced by cooling. In
crystallizing magmatic systems in the presence of aqueous fluids, e.g. pegmatitic dikes,
the main control on Li isotope fractionation is the coordination state of Li, however. The
lighter isotope (6Li) preferentially occupies sites with higher coordination numbers, and
37
therefore, weaker bonds, while the heavier isotope (7Li) prefers phases with smaller
coordination numbers and stronger bonds (Wunder et al., 2007).
Fractionation of Li between minerals and fluids has been experimentally
determined only for a very limited set of minerals (Wunder et al., 2007; Lynton et al.,
2005). Wunder et al. (2007) experimentally determined the fraction of lithium between
staurolite and fluid and mica and fluid through a range of P and T conditions, and
obtained an average δ7Listaurolite-fluid = +1.3‰. This value is not significantly temperature-
dependent but it indicates that 7Li has a slight preference for staurolite over the fluid. For
Li-bearing muscovite, the fractionation of Li isotopes is temperature-dependent and
decreases with increasing temperature. At temperatures of 350, 375, and 400o C, the mean
values of Δ7Limica-fluid are –2.55‰, –2.15‰, and –2.00‰, respectively.
For both minerals, Wunder et al. (2007) conducted experiments in the presence of
LiCl and LiOH-bearing fluid. At any given temperature, fractionation was insensitive to
fluid composition, which implies that Li-complexation in the two fluids was not different.
In aqueous solutions, Li appears to form a tetrahedrally coordinated hydrated ion,
[Li(H2O)4]+, not LiCl or LiOH complexes as assumed in previous studies (Lynton, 2005)
or suggested by Webster et al’s (1989) experiments. Isotopic fractionation is then
controlled by Li-coordination with 7Li preferentially incorporated into the phase which
allows for a smaller coordination number. In staurolite, Li substitutes for the divalent
cations Fe2+, Mg, and Zn in the tetrahedral site of the structure. In muscovite, however,
Li exists as an octahedrally coordinated cation between the silicate layers, thus the larger
preference of δ7Li for staurolite over muscovite.
38
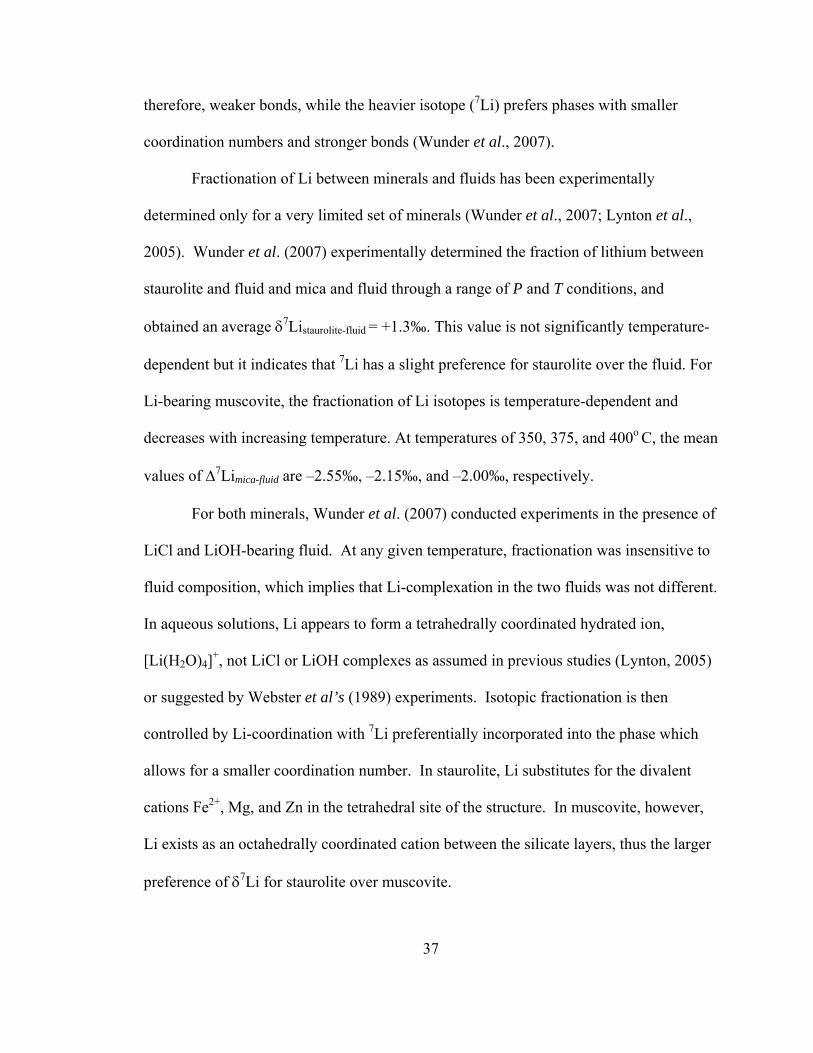
Tourmaline, XY3-Z6Si6O18(BO3)3(OH,O)3(OH,F,O), (Figure 9) occurs in granitic
rocks with compositions ranging from the Fe-bearing schorl,
(NaFe3Al6Si6O18(BO3)3(OH)3(OH)) end member, to the Li-bearing elbaite,
(NaLi1.5Al1.5Al6Si6O18(BO3)3(OH)3(OH)) end member (Deer et al., 1992, Hawthorne and
Henry, 1999). The approximately linear variation between schorl and elbaite can be
described by the coupled substitution 2YFe2+ YAl3+ + YLi+ (Bosi et al., 2005; Hawthorne
and Henry, 1999). Schorl is the major composition throughout the pegmatite while elbaite
is found almost exclusively in the pocket.
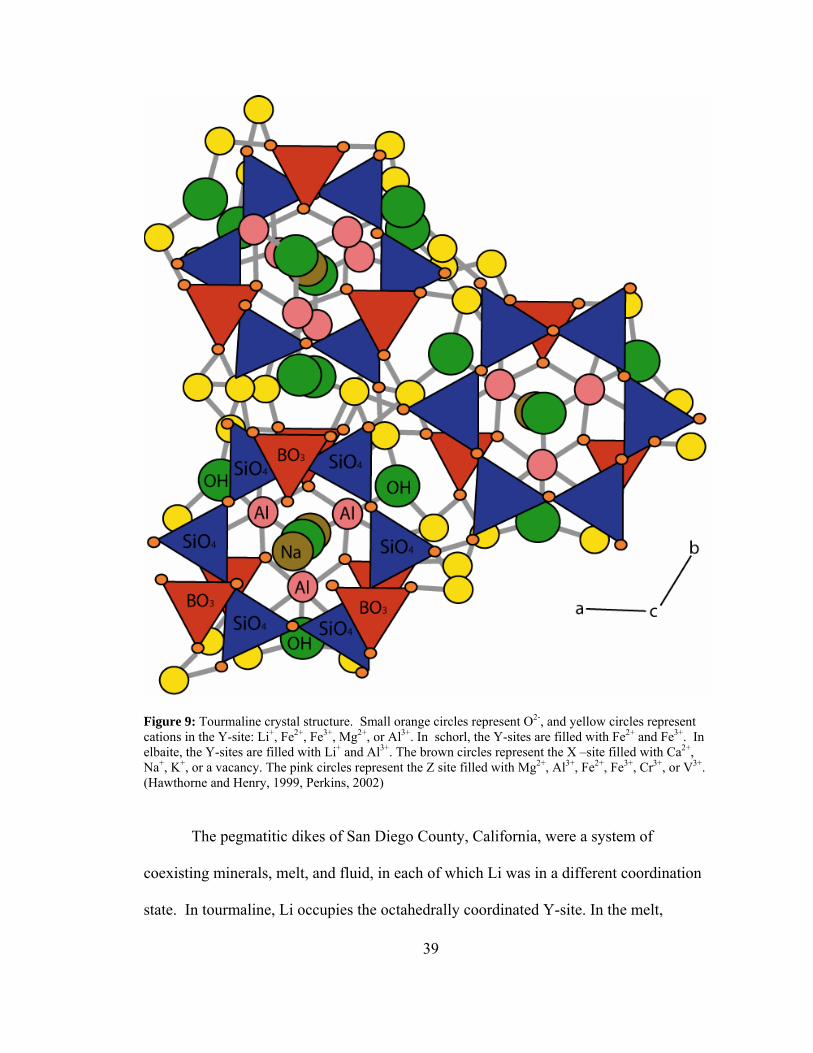
Figure 9: Tourmaline crystal structure. Small orange circles represent O2-, and yellow circles represent cations in the Y-site: Li+, Fe2+, Fe3+, Mg2+, or Al3+. In schorl, the Y-sites are filled with Fe2+ and Fe3+. In elbaite, the Y-sites are filled with Li+ and Al3+. The brown circles represent the X –site filled with Ca2+, Na+, K+, or a vacancy. The pink circles represent the Z site filled with Mg2+, Al3+, Fe2+, Fe3+, Cr3+, or V3+. (Hawthorne and Henry, 1999, Perkins, 2002)
The pegmatitic dikes of San Diego County, California, were a system of
coexisting minerals, melt, and fluid, in each of which Li was in a different coordination
state. In tourmaline, Li occupies the octahedrally coordinated Y-site. In the melt,
39
40
however, Li is in a charge balancing role, balancing Al3+, in a peraluminous melt as
LiAlS3iO8 (Mysen and Richet, 2005). Li is probably very strongly bonded in the charge
balancing site in the alumino-silicate melt.
The isotopic composition of Li in tourmaline in the San Diego pegmatite dikes is
reflective of the medium from which the tourmaline crystallized. The first tourmaline to
have crystallized from the melt is that in the line rock. The Li in the melt was probably
isotopically heavier than in the tourmaline because 7Li prefers the strong bonds in the
melt over the octahedral coordination in tourmaline. At the point of fluid saturation of the
dikes, melt and fluid phases separated and appear to have coexisted, causing the
fractionation of Li isotopes between them. If the isotopic composition of Li in tourmaline
in each of the zones reflects the relative fractionation of Li isotopes in the melt and fluid,
then the isotopically heavier Li in the pegmatite zone tourmaline suggests that 7Li was
enriched in the melt. This fractionation suggests that the bonds involved in the melt are
stronger than the bonds of hydrated Li in the fluid. There are no experimental data on the
fractionation of Li isotopes between melts and fluids, but this inference is supported by
isotopic compositions of Li in fluid inclusions and host quartz in the Tin Mountain
pegmatite in the Black Hills (Teng et al., 2006). Li in the fluid inclusions has much
lower δ7Li values than Li in the quartz, supporting Teng et al. (2006) that 7Li prefers the
stronger bonds in quartz were Li is possibly charge balancing Al incorporated into the
quartz structure, and by analogy bonds in high-silica melts, over the weaker hydrated
bonds in the fluid.
The δ7Li values in tourmaline that crystallized in the pocket are similar to those in
the line rock tourmaline. This is consistent with accumulation of the bulk of initial Li
41
that was in the original melt to the pocket fluid, as this would result in little change in the
isotopic composition of the Li. Tourmaline in the two zones reflects the isotopic
composition of the initial Li. Spodumene in the Tin Mountain pegmatite demonstrates
similar behavior as its δ7Li values are nearly the same across all zones of the pegmatite,
which was attributed to the large concentration of Li incorporated into the spodumene
where the compatibility of Li in the mineral overwhelms the ability of the isotopes to
fractionate (Teng et al., 2006).
Schorl crystals with elbaite rims collected from the pocket have different δ7Li in
the rims than the cores, with δ7Li inversely correlated to Li concentration, Li in the black
schorl cores is isotopically heavier than in the elbaite rims. This suggests that the schorl
crystallized while melt was still present, which is also supported by its iron-rich
composition as the Fe was sourced more likely from the melt than the fluid. The elbaite
rims probably formed later in the presence of the fluid only, as suggested by the fact that
it is a Li–bearing tourmaline and its δ7Li value is smaller.
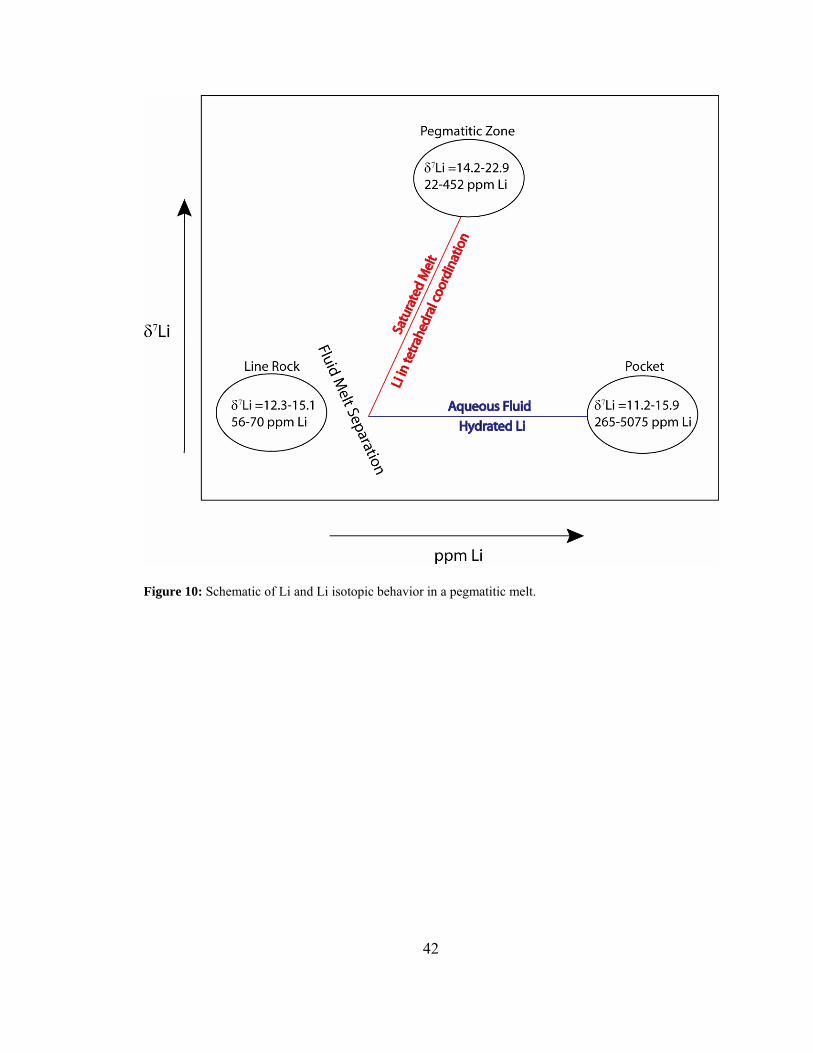
Figure 10: Schematic of Li and Li isotopic behavior in a pegmatitic melt.
42
43
Conclusions
Lithium concentration and isotopic ratio variances across zones of pegmatites can
give insight into the processes that formed these interesting dikes. The pegmatites of San
Diego County, California have similar structure, mineralogy, and geochemistry
throughout all pegmatite districts. Tourmaline in the line rock has the lowest Li
concentration, while tourmaline found in the pocket zone has the highest. Lithium
behaved as an incompatible element and was enriched through progressive crystallization
of the pegmatite. Crystallization of the line rock occurred first and continued until the
melt reached fluid saturation. This point is marked by the increased grain size of the
pegmatitic zone and Li concentration in tourmaline.
The initial concentration of Li of the melt is estimated to be ~1120 ppm, or ~0.5
mol % Li2O, which is one to two orders of magnitude higher than that in the Harney Peak
Granite in the Black Hills of South Dakota. The high concentration of fluxing
components, Li and mostly H2O, in the melt caused depolymerization of the melt that
lowered its viscosity and increased diffusion rates, allowing for crystallization at
temperatures <400oC without the dike solidifying to a glass.
The Li isotopic ratio of tourmaline is reflective of the medium from which it
crystallized. 7Li prefers stronger charge balancing sites in the melt while 6Li fractionates
into weaker octahedral sites in tourmaline and into the weak hydrated bonds in the fluid.
As such, tourmaline in the line rock would have crystallized from a melt that was
isotopically heavier. At the point of fluid saturation when melt and fluid separated, but
appear to have coexisted, 7Li was enriched in the melt suggesting that the hydrated bonds
44
in the fluid are weaker than the tetrahedral bonds in the melt. The δ7Li values of
tourmaline that crystallized in the pocket are similar to those found in the line rock as
bulk of the initial Li from the original melt accumulated in the pocket fluid. The
fractionation between melt and fluid can been seen in zoned tourmaline with isotopically
heavy schorl cores that probably crystallized with melt still present and isotopically
lighter elbaite rims that probably crystallized from fluid alone.
The behavior of Li and Li isotopes suggests that the San Diego County pegmatites
crystallized by a process similar to that described by Jahns and Burnham (1969) and
Walker et al. (1989). Crystallization started in the hanging wall and footwall and
proceeded inward. Crystallization occurred as the melt evolved from fluid-unsaturated to
fluid-saturated, while the pockets crystallized from the exsolved fluid that has gathered to
form a bubble in the center of the dike. The gem and specimen quality elbaite tourmaline
crystals in the pockets crystallized from fluid alone, in the absence of melt.
The crystallization of the pegmatite in a closed system is also supported by clay
minerals found in the pocket from the dissolution of feldspars by the fluids, fracture
fillings from the pocket outward which formed during rupture of the pocket and
migration of the fluids through the fracture, and late-stage fluid alteration of albite and K-
feldspar. If crystallization did not occur in a closed system, but rather through open-
system fluid flow or metasomatism, there would be no progressive concentration of Li
from the wall rock contact inward and no fractionation of the Li-isotopes, as there would
not be coexisiting phases for the isotopes to fractionate between.
45
Future studies of Li fractionation between other minor Li-bearing phases, such as
lepidolite and spodumene, are warranted to further understand the behavior of Li during
pegmatite crystallization.
46
References Bosi, F., Andreozzi, G.B., Frederico, M., Graziani, G., Lucchesi, S. (2005). Crystal
chemistry of the elbaite-schorl series. American Mineralogist. v.90. 1784-1792. Berhens, H., Meyer, M., Holtz, F., Benne, D., Nowak, M. (2001). The effect of alkali
ionic radius, temperature, and pressure on the solubility of water in MAlSi3O8 melts (M=Li, Na, K, Rb). Chemical Geology. v.174. 275-289.
Brenan, J.M., Ryerson, F.J., Shaw, H.F. (1998). The role of aqueous fluids in the slab-to-
mantle transfer to boron, beryllium, and lithium during subduction: Experiments and models. Geochimica et Cosmochimica Acta. v.62, 19-20. 3337-3347.
Černý, P. (1991). Rare-element granitic pegmatites. Part I: Anatomy and internal
evolution of pegmatite deposits. Geoscience Canada. V. 18, 2. 49-67. Clinkenbeard, J.P., and Walawender, M.J. (1989). Mineralogy of the La Posta pluton:
Implications for the origin of zoned plutons in the eastern Peninsular Ranges batholith, southern and Baja California. American Mineralogist, v.74. 1258-1269.
Deere, W.A., Howe, R.A, and Zussman, J. (1992). An introduction to the rock-forming
minerals. 2nd Edition. Dingwell, D.B., Romano, C., Hess, K.U. (1996). The effect of water on the viscosity of a
haplogranitic melt under P-T-X conditions relevant to silicic volcanism. Contributions to Petrology and Mineralogy. v.124. 19-28.
Fisher, J. (2002). Gem and rare-element pegmatites of southern California. Mineralogical
Record. v.33. 363-407. Fisher, J., Foord, E.E., Bricker, G.A. (1999). The geology, mineralogy, and history of the
Himalaya Mine, Mesa Grande, San Diego County, California. California Geology. 3-17.
Foord, E.E. (1976). Mineralogy and petrogenesis of layered pegmatite-aplite dikes in the
Mesa Grande District, San Diego County, California. Ph.D. Disseration. Stanford University.
Gochenour, K. (2003). Diary of a discovery: Summer and fall 2001. Rocks & Minerals.
v.78. 164-168.
47
Gromet, L.P., and Silver, L.T. (1979). Profile of rare earth element characterisitics across the Peninsular Ranges batholith near the internation border, southern California, U.S.A., and Baja California, Mexico. In: P.L. Abbott and V.R. Todd Eds. Mesozoic Crystalline Rocks: Peninsular Ranges batholith and pegmatites, Point Sal ophiolite. 111-142.
Hawthorne, F.C., and Henry D.J. (1999). Classification of the minerals in the tourmaline
group. European Journal of Mineralogy. v.11. 201-215. Jahns, R.H., and Burnham, C.W. (1969). Experimental studies of pegmatite genesis: I. A
model for the derivation and crystallization of granitic pegmatites. Economic Geology. v.64, 8. 843-864.
Jahns, R.H., and Wright, L.A. (1951). Gem- and lithium-bearing pegmatites of the Pala
District, San Diego County, California. Special Report - California Division of Mines and Geology. v. l, 7-A. 1-72
Jolliff, B.L., Papike, J.J., Shearer, C.K. (1986). Tourmaline as a recorder of pegmatite
evolution: Bob Ingersoll Pegmatite, Black Hills, South Daktoa. American Mineralogist. v. 71. 472-500.
Kampf, A.R., Gochenour, K., Clanin, J. (2003). Tourmaline: Discovery at the Cryo-
Genie Mine, San Diego County, California. Rocks and Minerals, v.78. 156-163. London, D., Hervig, R.L., Morgan, G.B. (1988). Melt-vapor solubilities and elemental
partitioning in peraluminous granite-pegmatite systems: experimental results with Macusani glass at 200 MPa. Contributions to Mineralogy and Petrology., v.99. 360-373.
Lynton, S.J., Walker, R.J., Candela, P.A. (2005). Lithium isotopes in the system Qz-Ms-
fluid: An experimental study. Geochimica et Cosmochimica Acta. v.69, 13. 3337-3347.
Morgan, G.B., and London, D. (1999). Crystallization of the Little Three layered
pegmatite-aplite dike, Ramona District, California. Contributions to Mineralogy and Petrology, v.136. 310-330.
Moriguiti, T., and Nakamure, E. (1998). High-yield lithium separation and the precise
isotopic analysis for natural rock and aqueous samples. Chemical Geology. v.145, 1-2. 91-104.
Mysen, B.O., and Richet, P. (2005). Developments in Geochemistry 10: Silicate glasses
and melts, properties and structure. Elsevier. Perkins, D. (2002). Mineralogy. Prentice Hall.
48
Qi, H.P., Taylor, P.D.P., Berglund, M., Be Bievre, P. (1997). Calibrated measurements of
the isotopic composition and atomic weight of the natural Li isotopic reference material IRMM-016. International Journal of Mass Spectrometry. v.171, 1-3. 263-268.
Romano, C., Poe, B., Mincione, V., Hess, K.U., Dinwell, D.B. (2001). The viscosities of
dry and hydrous XAlSi3O8 (X=Li, Na, K, Ca0.5, Mg0.5) melts. Chemical Geology. v.174. 115-132.
Rudnick, R.L., Tomascack, P.B., Njo, H.B., Gardner, L.R. (2004). Extreme lithium
isotopic fractionation during continental weathering revealed in saprolites from South Carolina. Chemical Geology, v. 212. 45-57.
Silver, L.T., Taylor, H.P., Chappell, B. (1979). Some petrological, geochemical and
geochronological observations of the Peninsular Ranges batholith near the internation border of the U.S.A. and Mexico. In: P.L. Abbott and V.R. Todd Eds. Mesozoic Crystalline Rocks: Peninsular Ranges batholith and pegmatites, Point Sal ophiolite. 83-110.
Sirbescu, M.-L., Nabelek, P.I. (2003). Crustal melts below 400oC. Geology. v.31, 8. 685-
688. Sirbescu, M.-L. (2007) Personal Communications. Stern, L.A., Brown, G.E., Bird, D.K., Jahns, R.H., Foord, E.E., Shigley, J.E., Spaulding,
L.B. (1986). Mineralogy and geochemical evolution of the Little Three pegmatite-aplite layered intrusive, Ramona, California. American Mineralogist, v.71. 406-427.
Symons, D.T.A., Walawender, M.J., Smith, T.E., Molnar, S.E., Harris, M.J., Blackburn,
W.H. (2003). Palomagnetism and geobarometry of the La Posta pluton, California. In: S.E. Johnson, S.R. Paterson, J.M. Fletcher, D.L. Kimbrough, A. Martin-Barajas Eds. GSA Special Paper 374: Tectonic Evolution of Northwestern Mexico and the Southwestern USA. 93-116.
Taylor, M.C. (2005). Personal Communications. Taylor, B.E., Foord, E.E., Friedrichsen, H. (1979). Stable isotope and fluid inclusion
studies of gem-bearing granitic pegmatite-aplite dikes, San Diego County, California. Contributions to Mineralogy and Petrology. v. 68. 187-205.
Teng, F.-Z., McDonough, W.F., Rudnick, R.L., Dalpé, C., Tomascak, P.B., Chappell,
B.W., Gao, S. (2004). Lithium isotopic composition and concentration of the
49
upper continental crust. Geochimica et Cosmochimica Acta, v.68, n10. 4167-4178.
Teng, F.-Z., McDonough, W.F., Rudnick, R.L., Walker, R.J., Sirbescu, M.-L. (2006).
Lithium isotopic systematics of granites and pegmatites from the Black Hills, South Dakota. American Mineralogist, v. 91. 1488-1498.
Walawender. M.J. (1979). Basic plutons of the Peninsular Ranges batholith, southern
California. In: P.L. Abbott and V.R. Todd Eds. Mesozoic Crystalline Rocks: Peninsular Ranges batholith and pegmatites, Point Sal ophiolite. 151-162.
Walawender, M.J., Gastil, R.G., Clinkenbeard, J.P., McCormick, W.V., Eastman, B.G.,
Wernicke, R.S., Wardlaw, M.S., Gunn, S.H., Smith, B.M. (1990). Origin and evolution of the zoned La Posta-type plutons, eastern Peninsular Ranges batholith, southern and Baja California. In: J.L. Anderson Ed. GSA Memoir 174: The Nature and Origin of Cordilleran Magmatism. 1-18.
Walker, R.J., Hanson, G.N., Papike, J.J., O’Neil, J.R., and Laul, J.C. (1986). Internal
Evolution of the Tin Mountain pegmatite, Black Hills, South Dakota. American Mineralogist. v. 71, 3-4. 440-459.
Webber, K.L., Falster, A.U., Simmons, W.B., Foord, E.E. (1997). The role of diffusion-
controlled oscillatory nucleation in the formation of line rock in pegmatite-aplite dikes. Journal of Petrology, v.38, n.12. 1777-1791.
Webber, K.L., Simmons, W.B., Falster, A.U., Foord, E.E. (1999). Cooling rates and
crystallization dynamics of shallow level pegmatite-aplite dikes, San Diego County, California. American Mineralogist, v.84. 708-717.
Webster, J.D., Holloway, J.R., Hervig, R.L. (1989). Partitioning of Lithophile trace
elements between H2O and H2O+CO2 fluids and topaz rhyolite melt. Economic Geology. v.84. 116-134.
Wetmore, P.H., Herzig, C., Alslebean, H., Sutherland, M., Schmidt, K.L., Schultz, P.W.,
Paterson, S.R. (2003). Mesozoic tectonic evolution of the Peninsular Ranges of southern and Baja, California. In: S.E. Johnson, S.R. Paterson, J.M. Fletcher, D.L. Kimbrough, A. Martin-Barajas Eds. GSA Special Paper 374: Tectonic Evolution of Northwestern Mexico and the Southwestern USA. 93-116.
Whittington, A., Richet, P., Behrens, H., François, H., Scaillet, B. (2004). Experimental
temperature-X(H2O)-viscosity relationship for leucogranites and comparison with synthetic silicic liquids. Transactions of the Royal Society of Edinburgh: Earth Sciences. v.95. 59-71.
50
Wilke, M., Nabelek, P.I., Glascock, M.D. (2002). B and Li in Proterozoic metapelites from the Black Hills, U.S.A.: Implications for the origin of leucogranitic magmas. American Mineralogist, v. 37. 491-500.
Wunder, B., Meixner, A., Romer, R.L., Heinrich, W. (2006). T-dependent isotopic
fractionation of lithium between clinopyroxene and high-pressure hydrous fluids. Contributions to Mineralogy and Petrology. v.151. 112-120.
Wunder, B., Meixner, A., Romer, R.L., Feenstra, A., Schettler, G., Heinrich, W. (2007).
Lithium isotope fractionation between Li-bearing staurolite, Li-mica and aqueous fluids: An experimental study. Chemical Geology. v. 238. 277-290.
![IUPAC Periodic Table of the Isotopes - · PDF fileIUPAC Periodic Table of the Isotopes 1 H 2 [1.007 84; 1.008 11] hydrogen 1 7 Li 6 [6.938; 6.997] lithium 3 Be 9 9.012 182(3) beryllium](https://img.pdfslide.net/doc/110x75/5a7ac52f7f8b9a563b8b90e2/iupac-periodic-table-of-the-isotopes-periodic-table-of-the-isotopes-1-h-2-1007.jpg)