Embed Size (px)
Citation preview
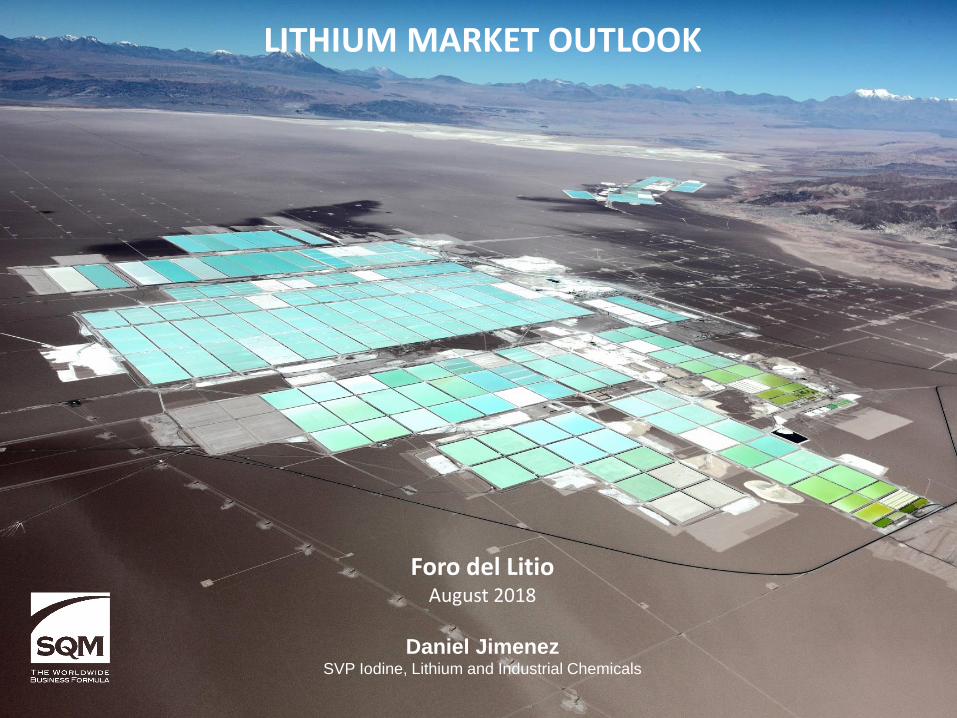
LITHIUM MARKET OUTLOOK
Foro del LitioAugust 2018
Daniel JimenezSVP Iodine, Lithium and Industrial Chemicals
Agenda
2
4 Lithium at SQM
2 Demand
3 Supply
2.1 Global
1 Lithium Market
2.2 Li-ion Batteries and Electric Vehicles
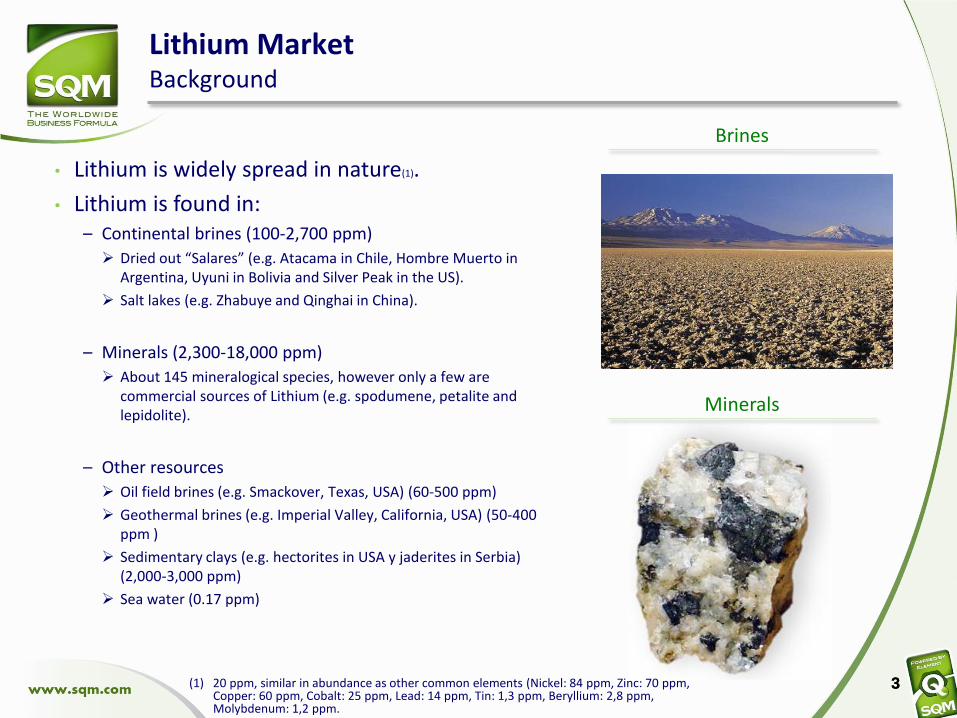
• Lithium is widely spread in nature(1).
• Lithium is found in:– Continental brines (100-2,700 ppm)
Dried out “Salares” (e.g. Atacama in Chile, Hombre Muerto in Argentina, Uyuni in Bolivia and Silver Peak in the US).
Salt lakes (e.g. Zhabuye and Qinghai in China).
– Minerals (2,300-18,000 ppm)
About 145 mineralogical species, however only a few are commercial sources of Lithium (e.g. spodumene, petalite and lepidolite).
– Other resources
Oil field brines (e.g. Smackover, Texas, USA) (60-500 ppm)
Geothermal brines (e.g. Imperial Valley, California, USA) (50-400 ppm )
Sedimentary clays (e.g. hectorites in USA y jaderites in Serbia) (2,000-3,000 ppm)
Sea water (0.17 ppm)
33
Brines
Minerals
(1) 20 ppm, similar in abundance as other common elements (Nickel: 84 ppm, Zinc: 70 ppm, Copper: 60 ppm, Cobalt: 25 ppm, Lead: 14 ppm, Tin: 1,3 ppm, Beryllium: 2,8 ppm, Molybdenum: 1,2 ppm.
Lithium MarketBackground
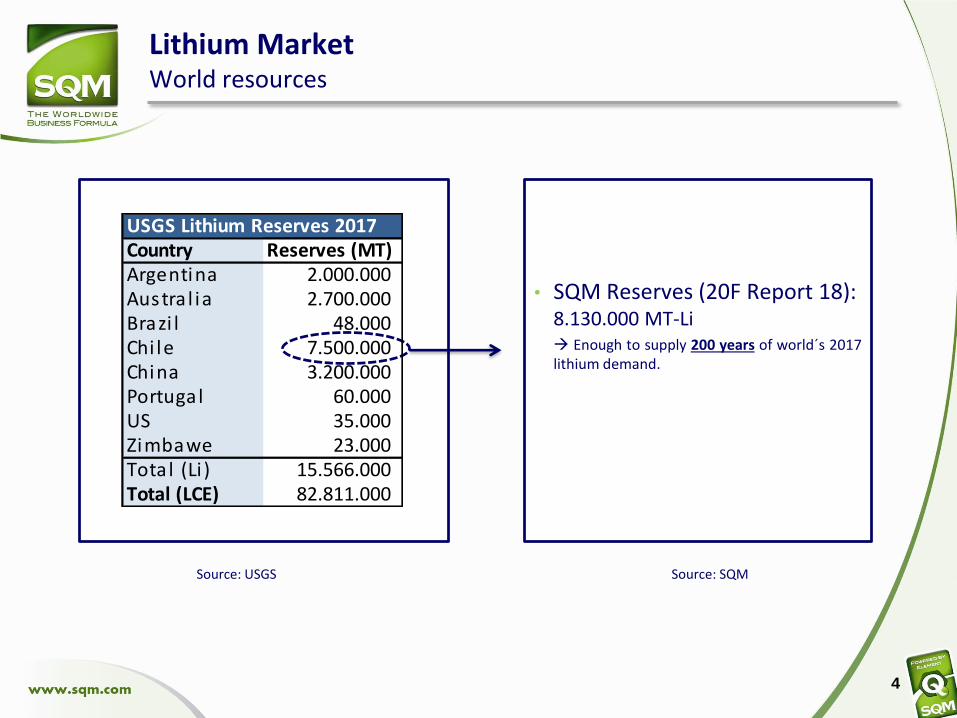
• SQM Reserves (20F Report 18): 8.130.000 MT-Li Enough to supply 200 years of world´s 2017lithium demand.
4
Source: USGS
Lithium MarketWorld resources
Source: SQM
USGS Lithium Reserves 2017Country Reserves (MT)Argentina 2.000.000 Austra l ia 2.700.000 Brazi l 48.000 Chi le 7.500.000 China 3.200.000 Portugal 60.000 US 35.000 Zimbawe 23.000 Tota l (Li ) 15.566.000 Total (LCE) 82.811.000
5
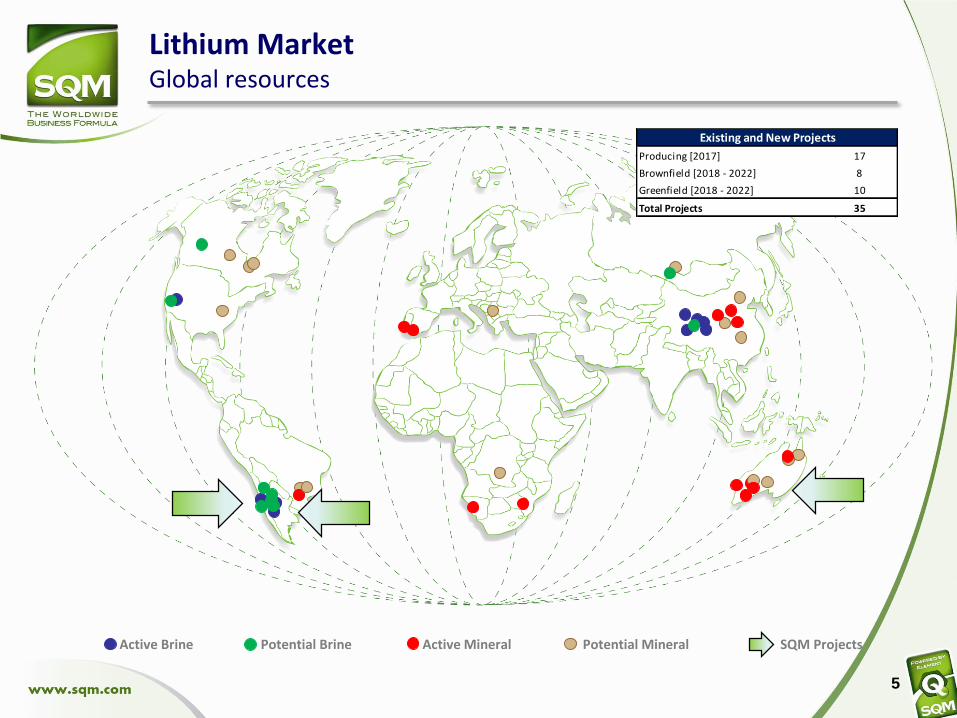
Active Brine SQM ProjectsActive Mineral Potential Mineral
Lithium MarketGlobal resources
Producing [2017] 17
Brownfield [2018 - 2022] 8
Greenfield [2018 - 2022] 10
Total Projects 35
Existing and New Projects
Potential Brine
Agenda
6
4 Lithium at SQM
2 Demand
3 Supply
2.1 Global
1 Lithium Market
2.2 Li-ion Batteries and Electric Vehicles
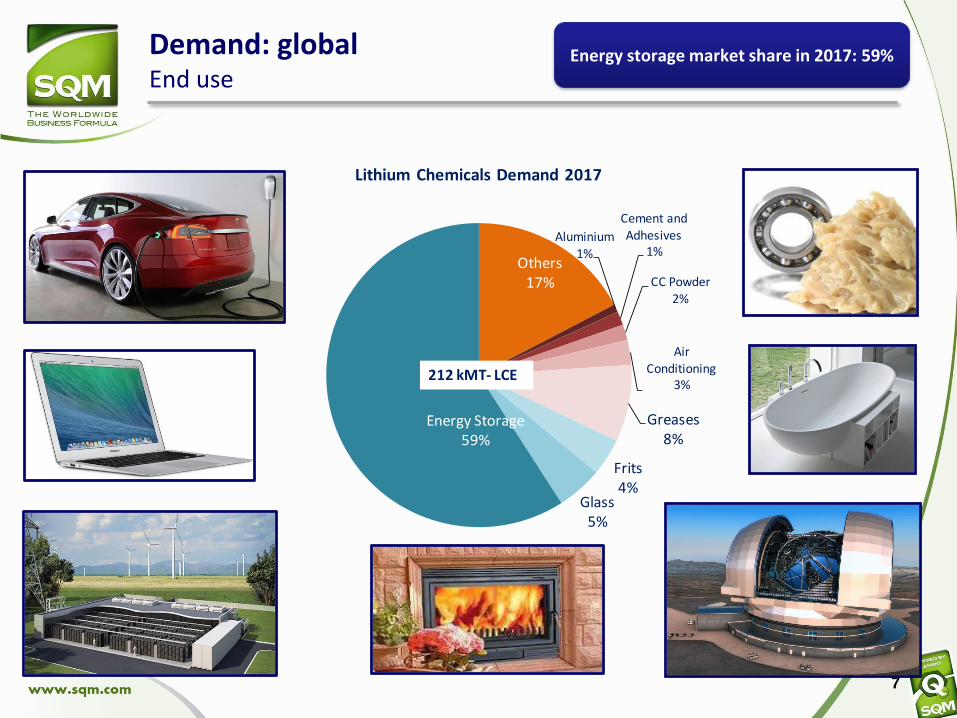
Demand: globalEnd use
7
Energy storage market share in 2017: 59%
Others17%
Aluminium1%
Cement and Adhesives
1%
CC Powder2%
Air Conditioning
3%
Greases8%
Frits4%
Glass5%
Energy Storage59%
Lithium Chemicals Demand 2017
212 kMT- LCE
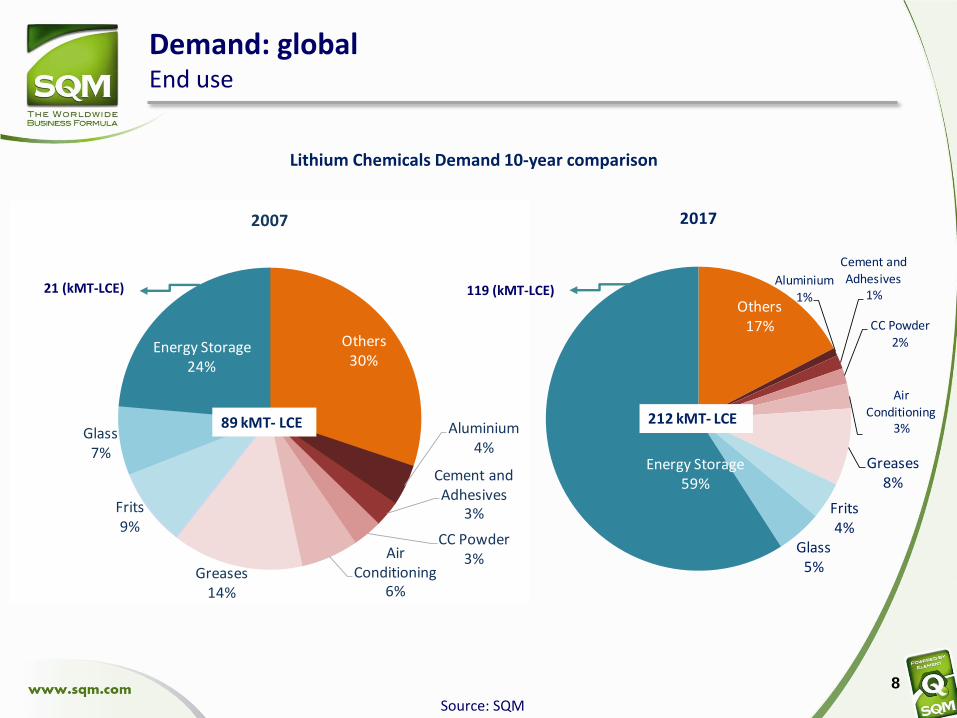
Demand: globalEnd use
8
Source: SQM
Others17%
Aluminium1%
Cement and Adhesives
1%
CC Powder2%
Air Conditioning
3%
Greases8%
Frits4%
Glass5%
Energy Storage59%
2017
212 kMT- LCE
Others30%
Aluminium4%
Cement and Adhesives
3%
CC Powder3%Air
Conditioning6%
Greases14%
Frits9%
Glass7%
Energy Storage24%
2007
89 kMT- LCE
Lithium Chemicals Demand 10-year comparison
21 (kMT-LCE) 119 (kMT-LCE)
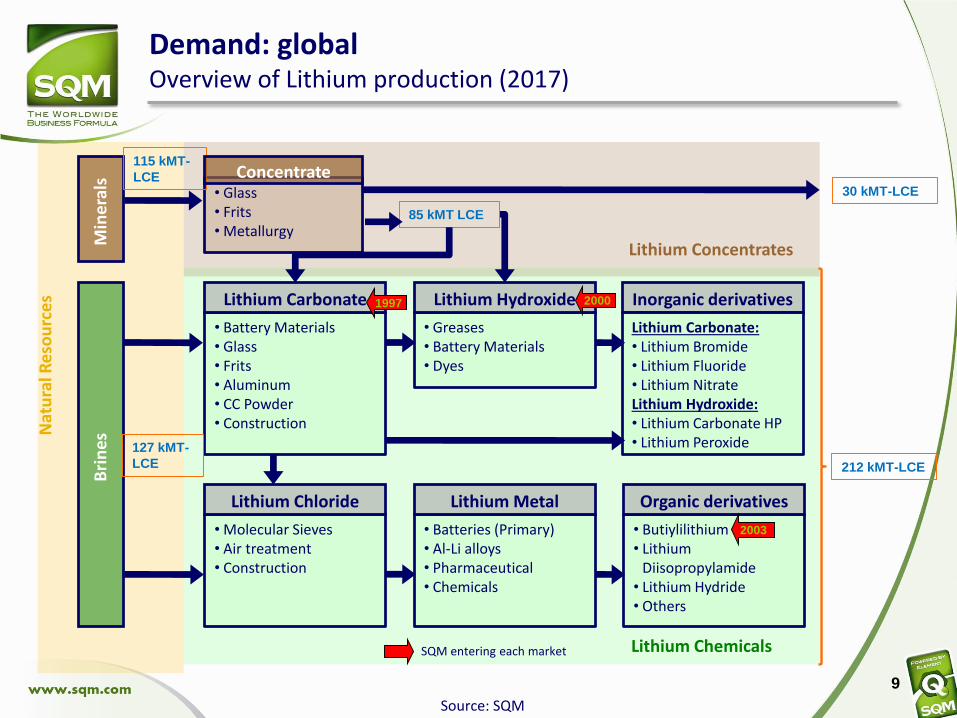
Inorganic derivatives
• Glass• Frits• Metallurgy
• Battery Materials• Glass• Frits• Aluminum• CC Powder• Construction
Lithium Carbonate
• Molecular Sieves• Air treatment• Construction
Lithium Chloride
• Greases• Battery Materials• Dyes
Lithium Hydroxide
• Batteries (Primary)• Al-Li alloys• Pharmaceutical• Chemicals
Lithium Metal
Lithium Carbonate:• Lithium Bromide• Lithium Fluoride• Lithium NitrateLithium Hydroxide:• Lithium Carbonate HP• Lithium Peroxide
• Butiylilithium• Lithium
Diisopropylamide• Lithium Hydride• Others
Organic derivatives
Lithium Concentrates
Lithium Chemicals
Min
era
lsB
rin
esN
atu
ral R
eso
urc
es
SQM entering each market
1997 2000
Demand: globalOverview of Lithium production (2017)
127 kMT-
LCE
115 kMT-
LCE
Source: SQM
30 kMT-LCE
85 kMT LCE
Concentrate
2003
212 kMT-LCE
9
10
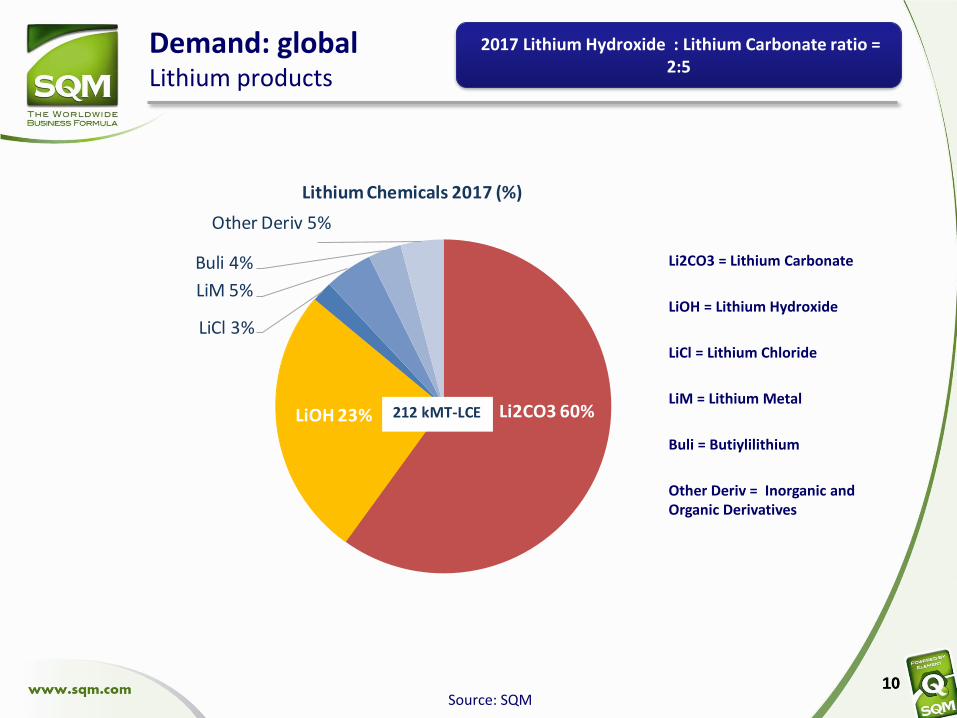
Demand: globalLithium products
10
2017 Lithium Hydroxide : Lithium Carbonate ratio = 2:5
Source: SQM
Li2CO3 60%LiOH 23%
LiCl 3%
LiM 5%
Buli 4%
Other Deriv 5%
Lithium Chemicals 2017 (%)
212 kMT-LCE
Li2CO3 = Lithium Carbonate
LiOH = Lithium Hydroxide
LiCl = Lithium Chloride
LiM = Lithium Metal
Buli = Butiylilithium
Other Deriv = Inorganic and Organic Derivatives
11
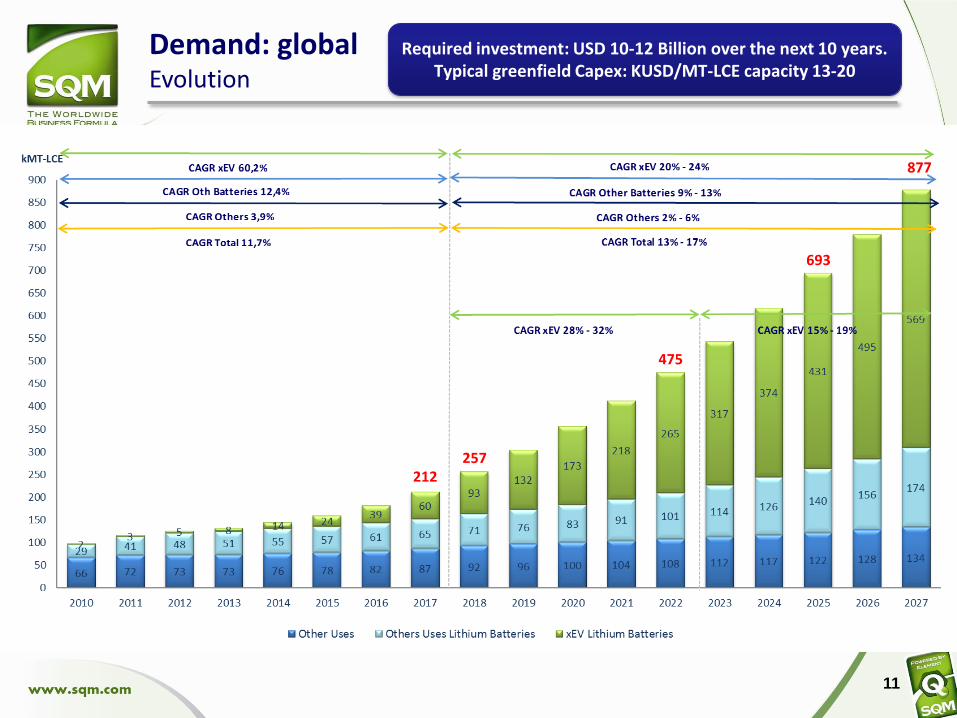
Demand: globalEvolution
Required investment: USD 10-12 Billion over the next 10 years. Typical greenfield Capex: KUSD/MT-LCE capacity 13-20
212
475
257
693
877
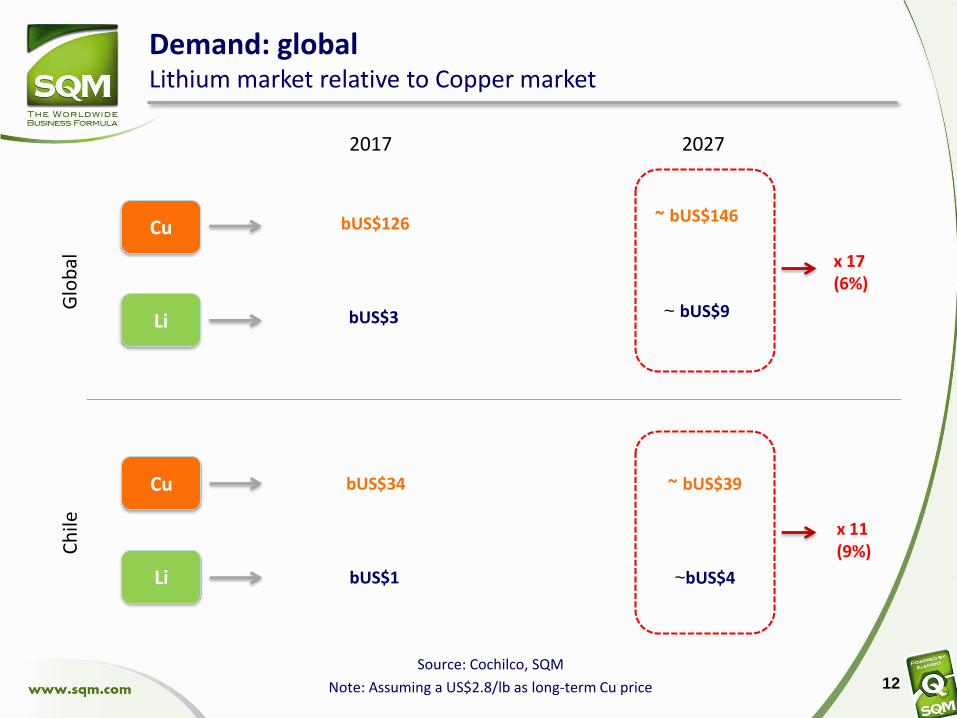
Demand: globalLithium market relative to Copper market
Cu
Li
Source: Cochilco, SQM
Note: Assuming a US$2.8/lb as long-term Cu price
bUS$34
bUS$1 ~bUS$4
bUS$126
bUS$3
Cu
Li
Glo
bal
Ch
ile
2017 2027
~ bUS$146
~ bUS$9
~ bUS$39
x 17(6%)
x 11(9%)
12
Agenda
13
4 Lithium at SQM
2 Demand
3 Supply
2.1 Global
1 Lithium Market
2.2 Li-ion Batteries and Electric Vehicles
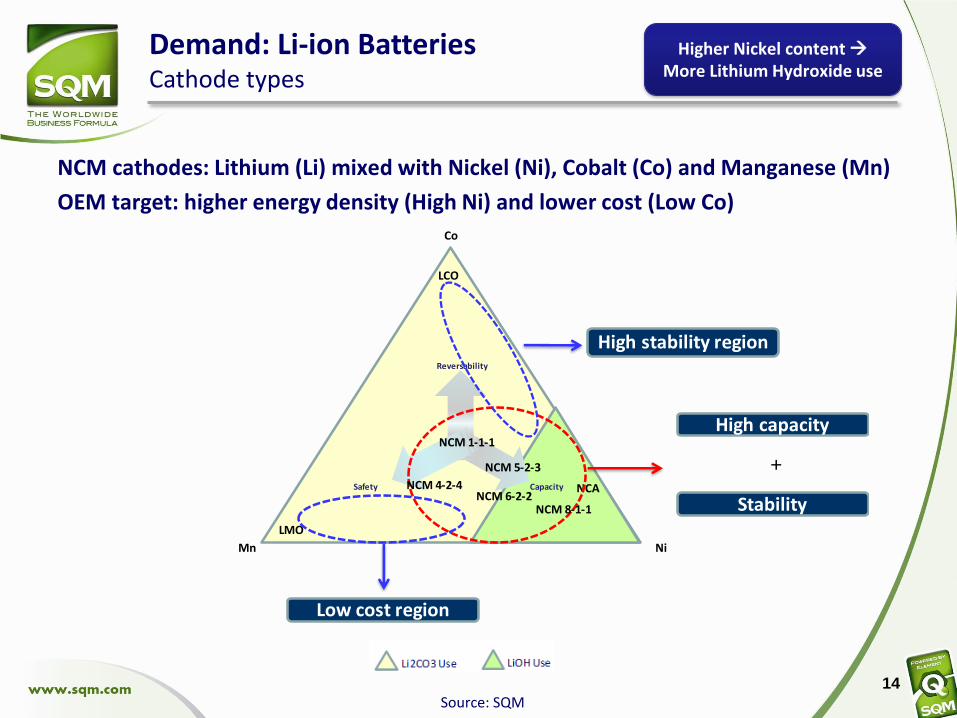
NCM cathodes: Lithium (Li) mixed with Nickel (Ni), Cobalt (Co) and Manganese (Mn)
OEM target: higher energy density (High Ni) and lower cost (Low Co)
14
Demand: Li-ion BatteriesCathode types
Source: SQM
Higher Nickel content More Lithium Hydroxide use
High capacity
Stability
+
Co
Mn Ni
LCO
LMO
NCA
Reversability
Safety Capacity
NCM 1-1-1
NCM 6-2-2NCM 8-1-1
NCM 4-2-4
NCM 5-2-3
Low cost region
High stability region
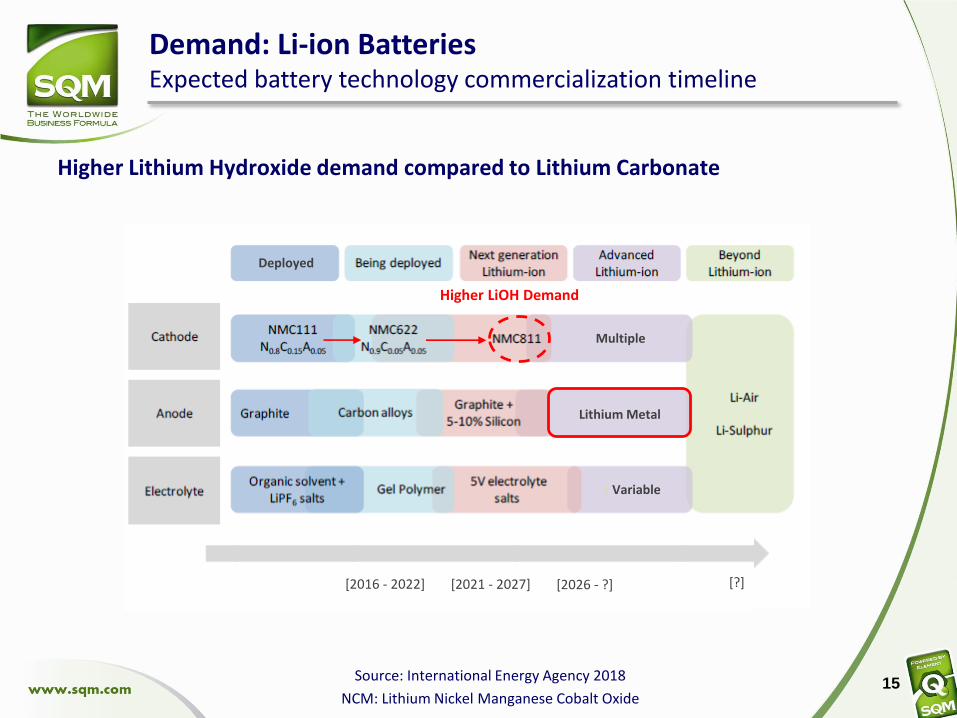
Demand: Li-ion BatteriesExpected battery technology commercialization timeline
Source: International Energy Agency 2018
NCM: Lithium Nickel Manganese Cobalt Oxide15
Higher LiOH Demand
Multiple
Lithium Metal
Variable
[2016 - 2022] [2021 - 2027] [2026 - ?]
Deployed
[?]
Higher Lithium Hydroxide demand compared to Lithium Carbonate
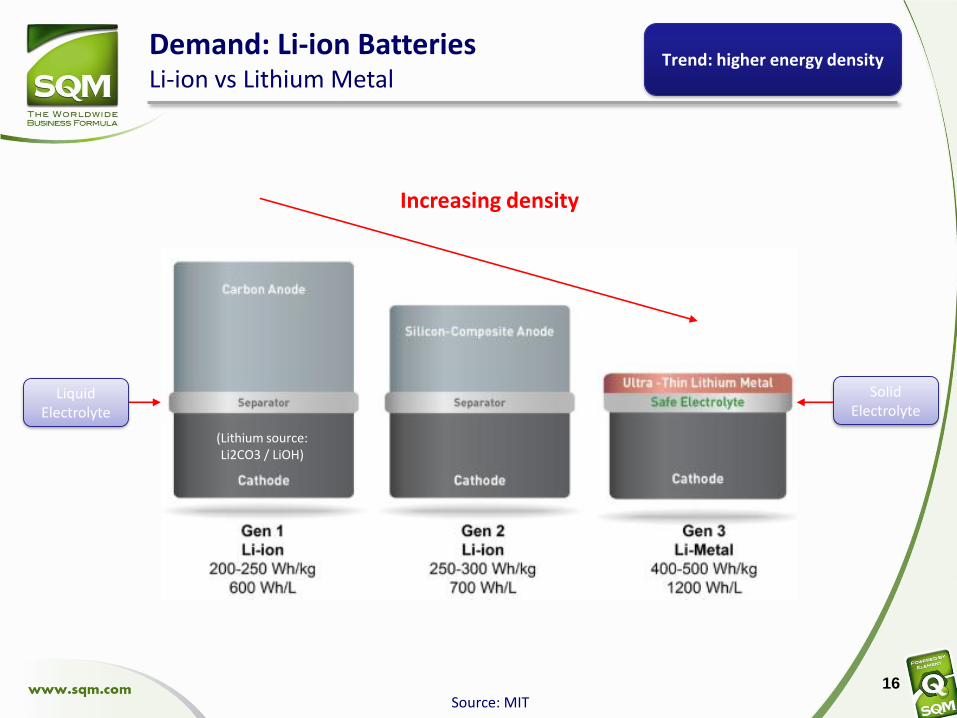
Demand: Li-ion BatteriesLi-ion vs Lithium Metal
Source: MIT16
Liquid Electrolyte
Solid Electrolyte
(Lithium source: Li2CO3 / LiOH)
Increasing density
Trend: higher energy density
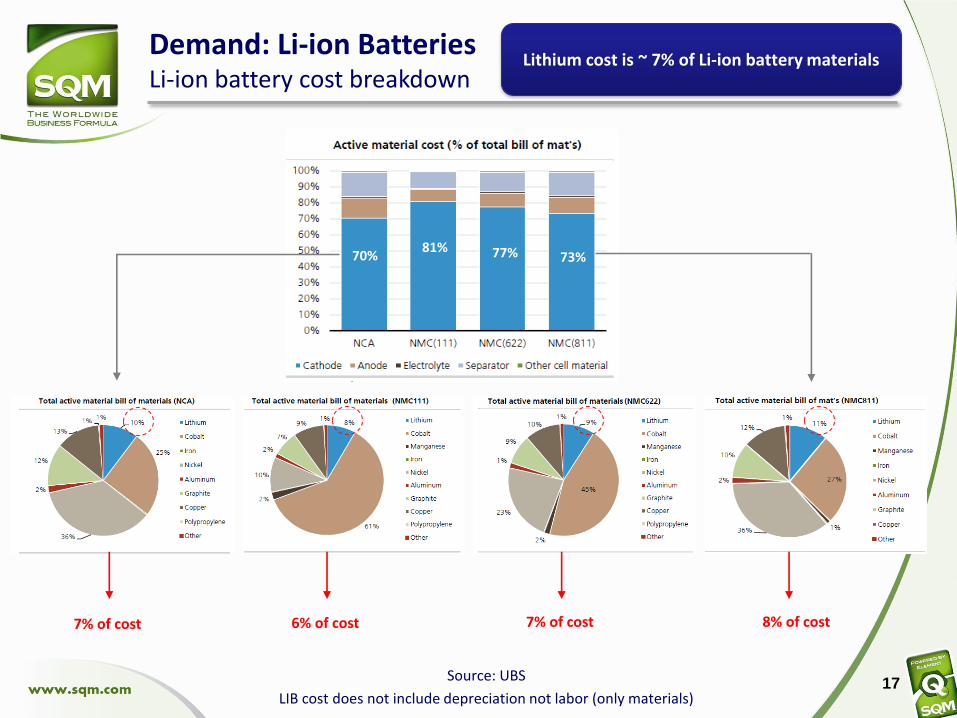
Demand: Li-ion BatteriesLi-ion battery cost breakdown
17Source: UBS
LIB cost does not include depreciation not labor (only materials)
7% of cost 6% of cost 7% of cost 8% of cost
Lithium cost is ~ 7% of Li-ion battery materials
70%81% 77% 73%
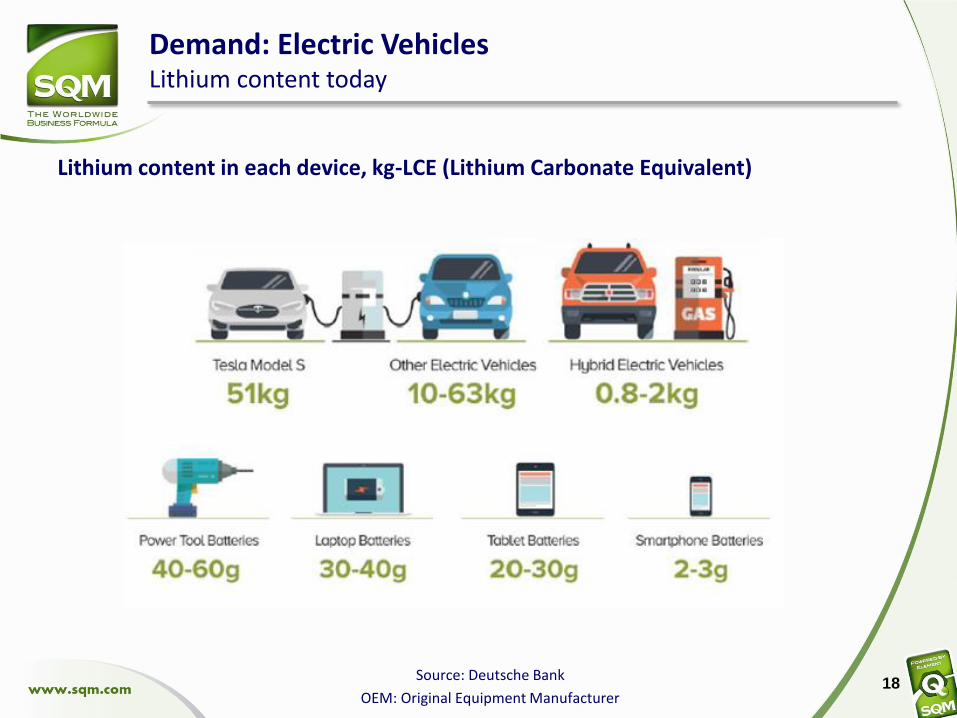
Demand: Electric VehiclesLithium content today
Source: Deutsche Bank
OEM: Original Equipment Manufacturer 18
Lithium content in each device, kg-LCE (Lithium Carbonate Equivalent)
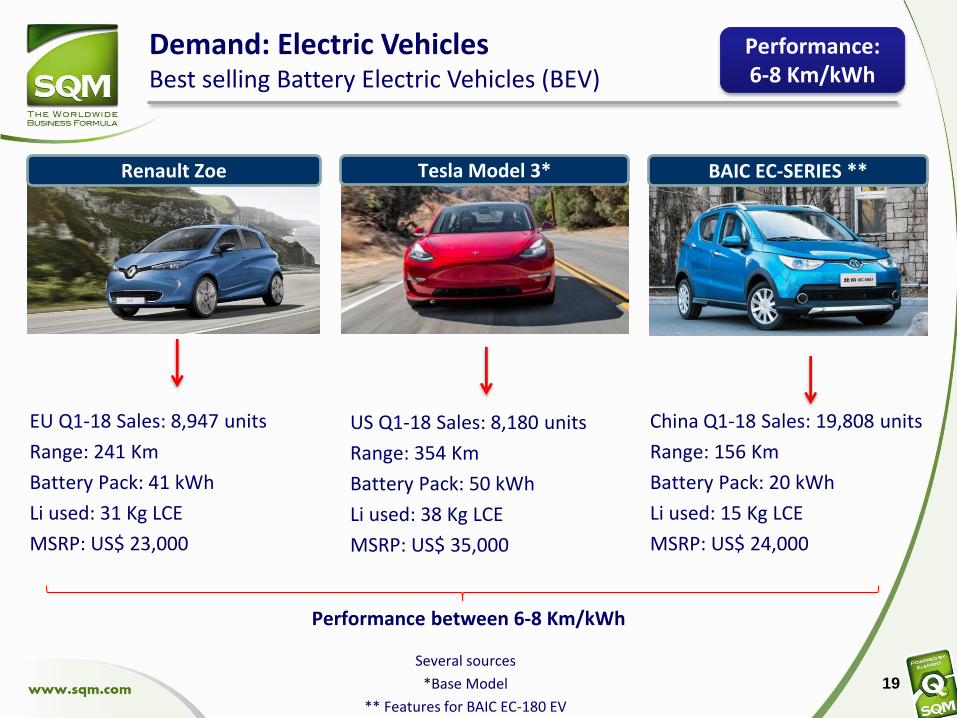
19
EU Q1-18 Sales: 8,947 units
Range: 241 Km
Battery Pack: 41 kWh
Li used: 31 Kg LCE
MSRP: US$ 23,000
Demand: Electric VehiclesBest selling Battery Electric Vehicles (BEV)
US Q1-18 Sales: 8,180 units
Range: 354 Km
Battery Pack: 50 kWh
Li used: 38 Kg LCE
MSRP: US$ 35,000
China Q1-18 Sales: 19,808 units
Range: 156 Km
Battery Pack: 20 kWh
Li used: 15 Kg LCE
MSRP: US$ 24,000
Renault Zoe Tesla Model 3* BAIC EC-SERIES **
Several sources
*Base Model
** Features for BAIC EC-180 EV
Performance between 6-8 Km/kWh
Performance: 6-8 Km/kWh
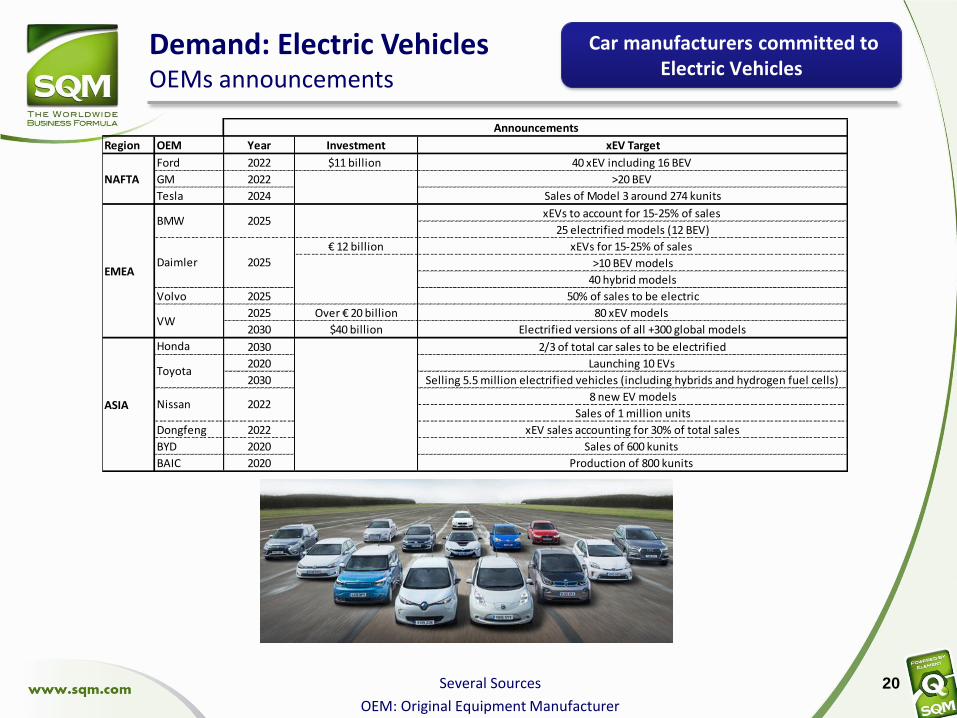
Demand: Electric VehiclesOEMs announcements
Several Sources
OEM: Original Equipment Manufacturer
20
Region OEM Year Investment xEV Target
Ford 2022 $11 billion 40 xEV including 16 BEV
GM 2022 >20 BEV
Tesla 2024 Sales of Model 3 around 274 kunits
xEVs to account for 15-25% of sales
25 electrified models (12 BEV)
€ 12 billion xEVs for 15-25% of sales
>10 BEV models
40 hybrid models
Volvo 2025 50% of sales to be electric
2025 Over € 20 billion 80 xEV models
2030 $40 billion Electrified versions of all +300 global models
2/3 of total car sales to be electrified
2020 Launching 10 EVs
2030 Selling 5.5 million electrified vehicles (including hybrids and hydrogen fuel cells)
8 new EV models
Sales of 1 million units
Dongfeng 2022 xEV sales accounting for 30% of total sales
BYD 2020 Sales of 600 kunits
BAIC 2020 Production of 800 kunits
NAFTA
Toyota
Daimler
Nissan
BMW
Honda
VW
EMEA
2025
2025
ASIA
Announcements
2022
2030
Car manufacturers committed to Electric Vehicles
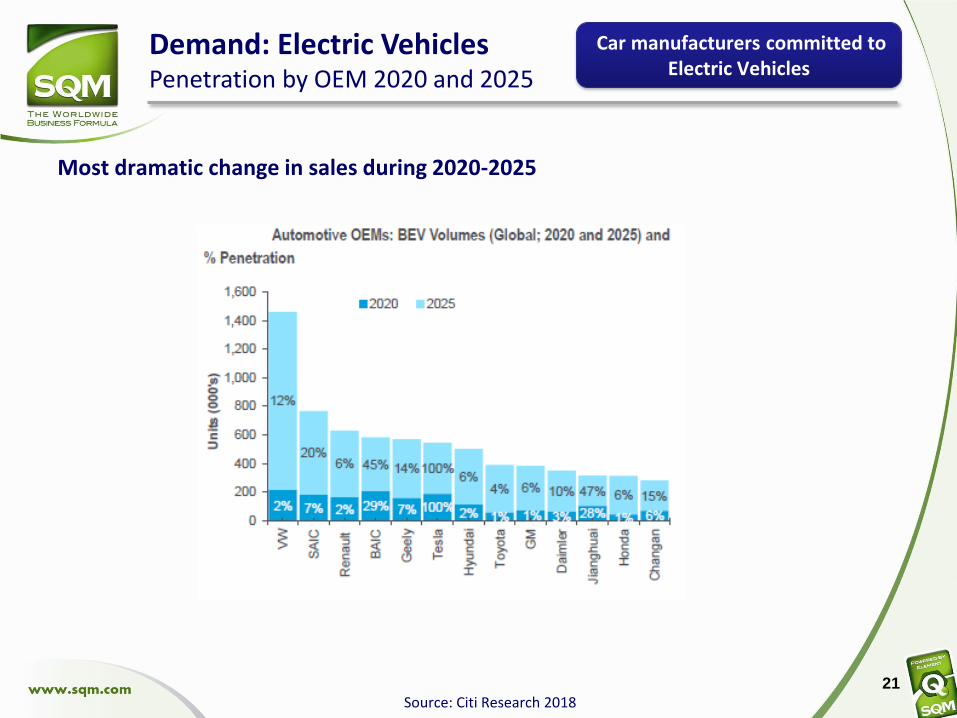
Demand: Electric VehiclesPenetration by OEM 2020 and 2025
Source: Citi Research 2018
Most dramatic change in sales during 2020-2025
21
Car manufacturers committed to Electric Vehicles
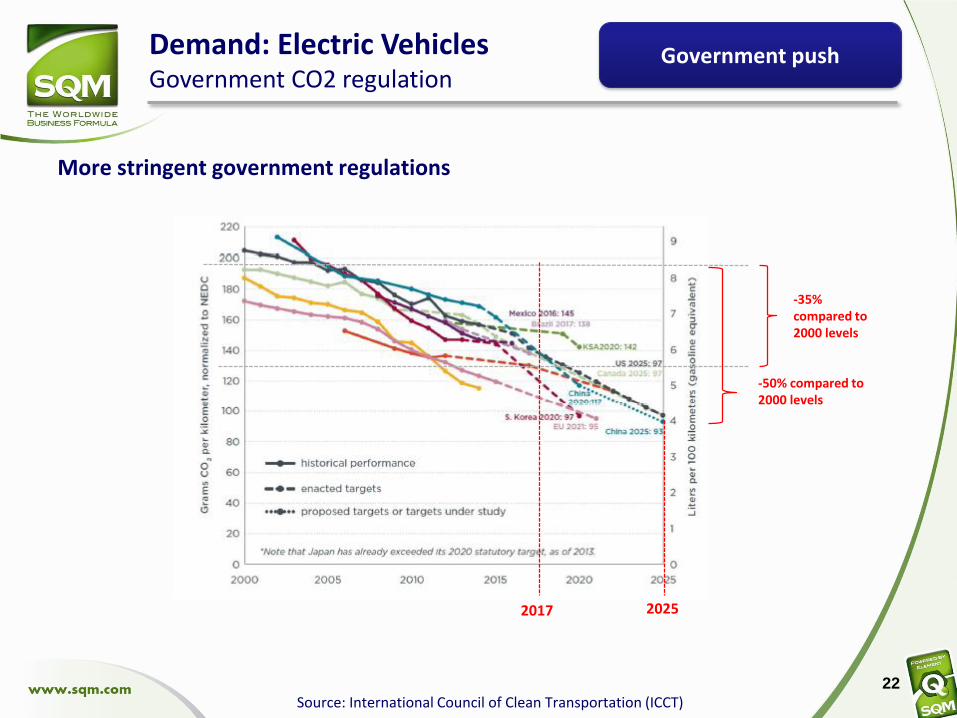
Demand: Electric VehiclesGovernment CO2 regulation
Source: International Council of Clean Transportation (ICCT)
More stringent government regulations
2017
22
Government push
-35% compared to2000 levels
-50% compared to2000 levels
2025
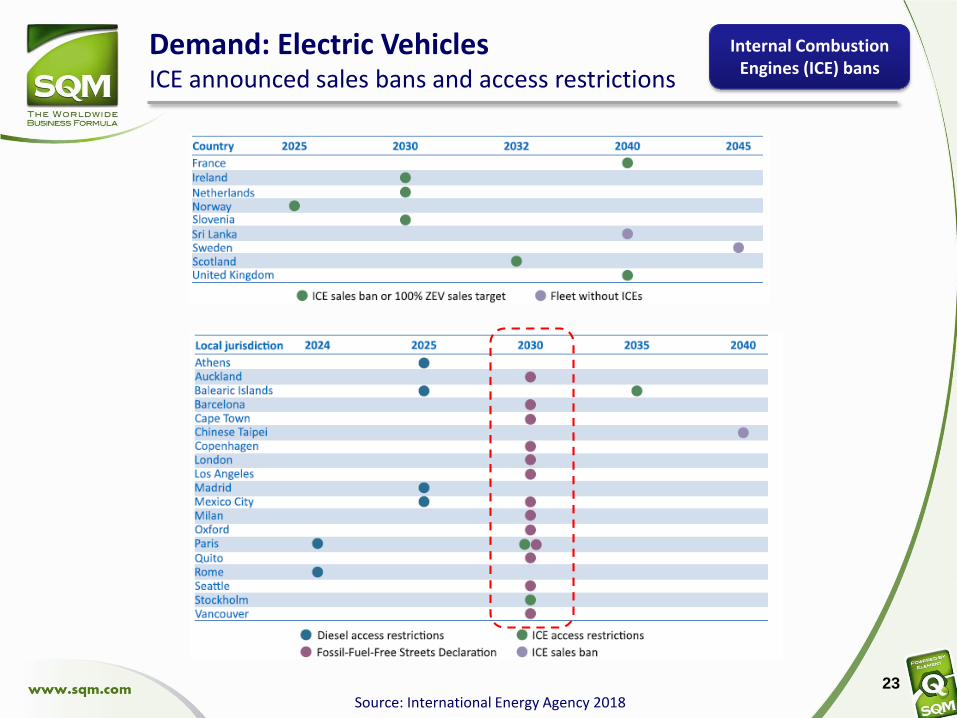
Demand: Electric VehiclesICE announced sales bans and access restrictions
Source: International Energy Agency 201823
Internal Combustion Engines (ICE) bans
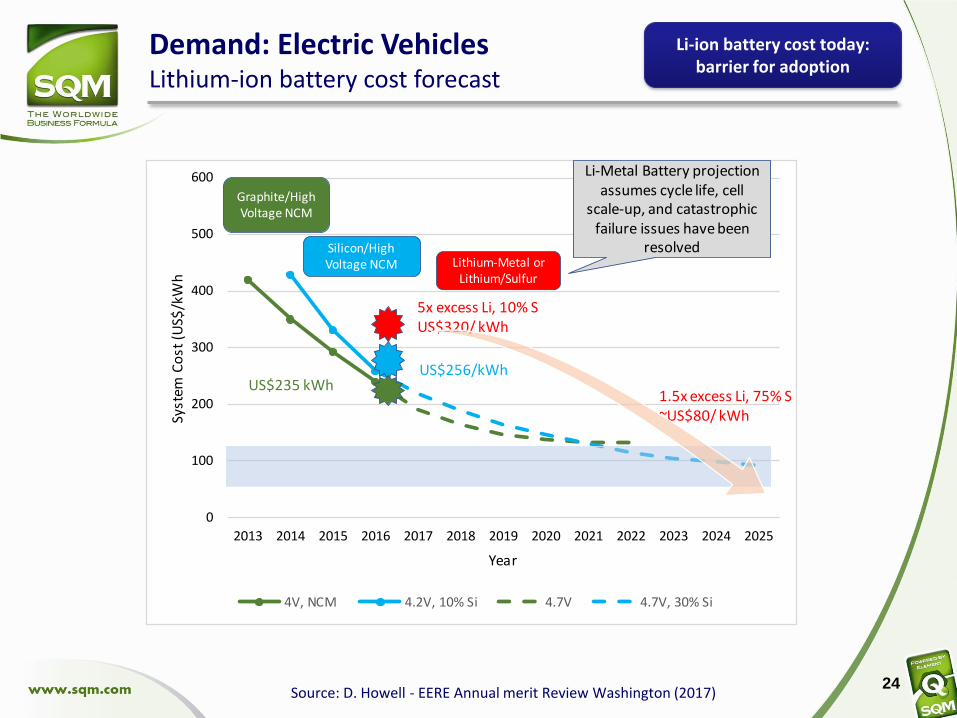
Demand: Electric VehiclesLithium-ion battery cost forecast
Source: D. Howell - EERE Annual merit Review Washington (2017)24
0
100
200
300
400
500
600
2013 2014 2015 2016 2017 2018 2019 2020 2021 2022 2023 2024 2025
Syst
em C
ost
(U
S$/k
Wh
Year
4V, NCM 4.2V, 10% Si 4.7V 4.7V, 30% Si
5x excess Li, 10% SUS$320/ kWh
US$256/kWhUS$235 kWh
Graphite/High Voltage NCM
Silicon/High Voltage NCM Lithium-Metal or
Lithium/Sulfur
Li-Metal Battery projectionassumes cycle life, cell
scale-up, and catastrophicfailure issues have been
resolved
1.5x excess Li, 75% S~US$80/ kWh
Li-ion battery cost today: barrier for adoption
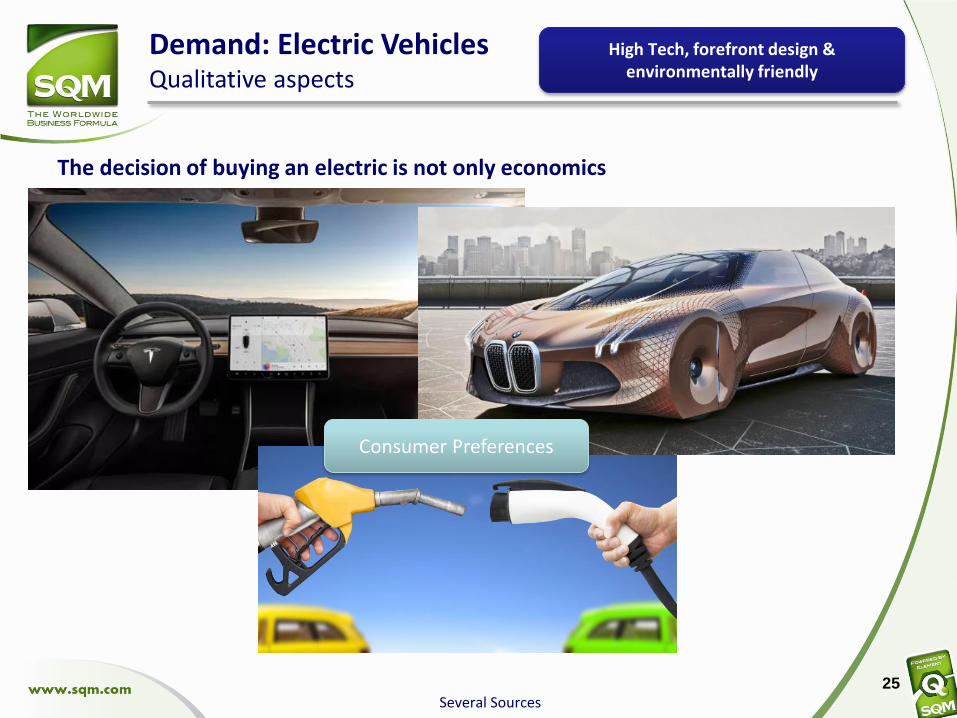
The decision of buying an electric is not only economics
Demand: Electric VehiclesQualitative aspects
Several Sources
High Tech, forefront design & environmentally friendly
25
Consumer Preferences
Agenda
26
4 Lithium at SQM
2 Demand
3 Supply
2.1 Global
1 Lithium Market
2.2 Li-ion Batteries and Electric Vehicles
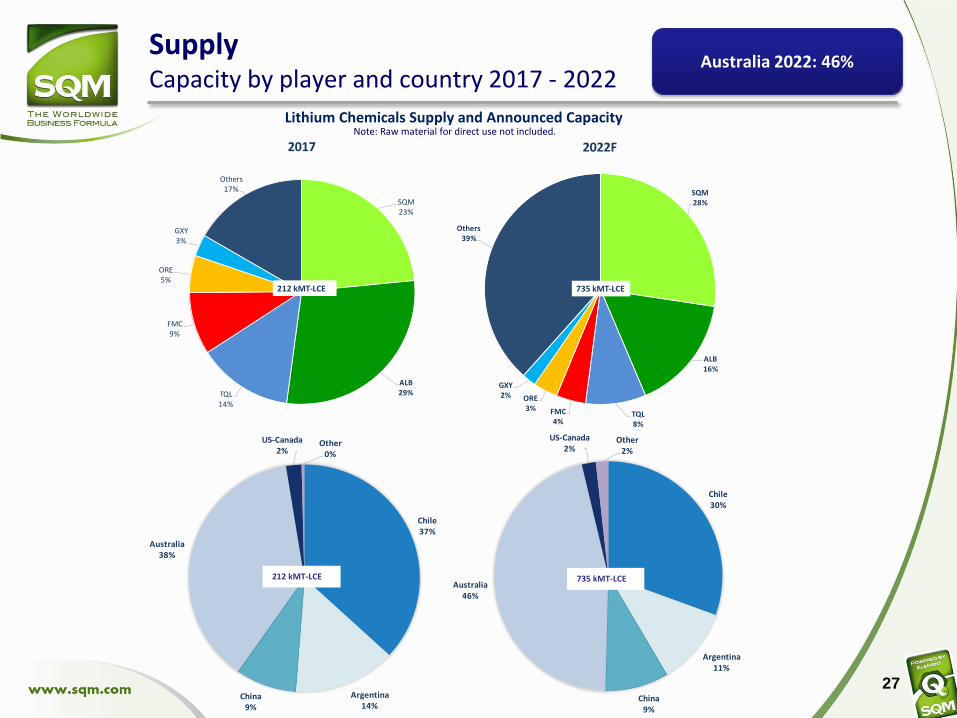
SupplyCapacity by player and country 2017 - 2022
27
Note: Raw material for direct use not included. Lithium Chemicals Supply and Announced Capacity
Chile37%
Argentina14%
China9%
Australia38%
US-Canada2%
Other0%
212 kMT-LCE
Chile30%
Argentina11%
China9%
Australia46%
US-Canada2%
Other2%
735 kMT-LCE
Australia 2022: 46%
SQM23%
ALB29%TQL
14%
FMC9%
ORE5%
GXY3%
Others17%
2017
212 kMT-LCE
SQM28%
ALB16%
TQL8%
FMC4%
ORE3%
GXY2%
Others39%
2022F
735 kMT-LCE
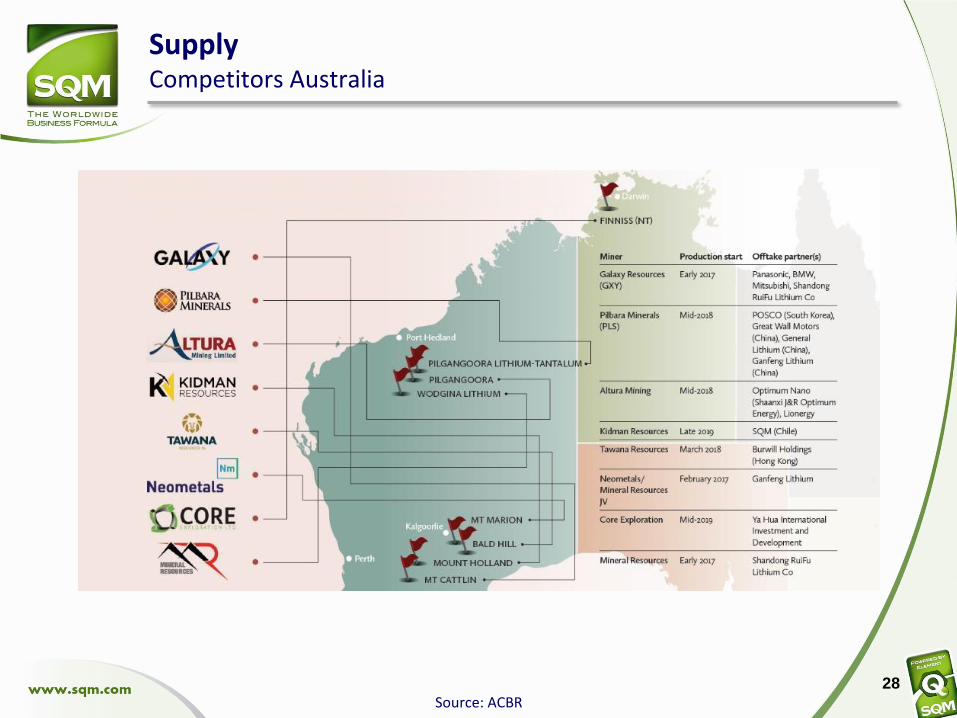
SupplyCompetitors Australia
28
Source: ACBR
Agenda
29
4 Lithium at SQM
2 Demand
3 Supply
2.1 Global
1 Lithium Market
2.2 Li-ion Batteries and Electric Vehicles
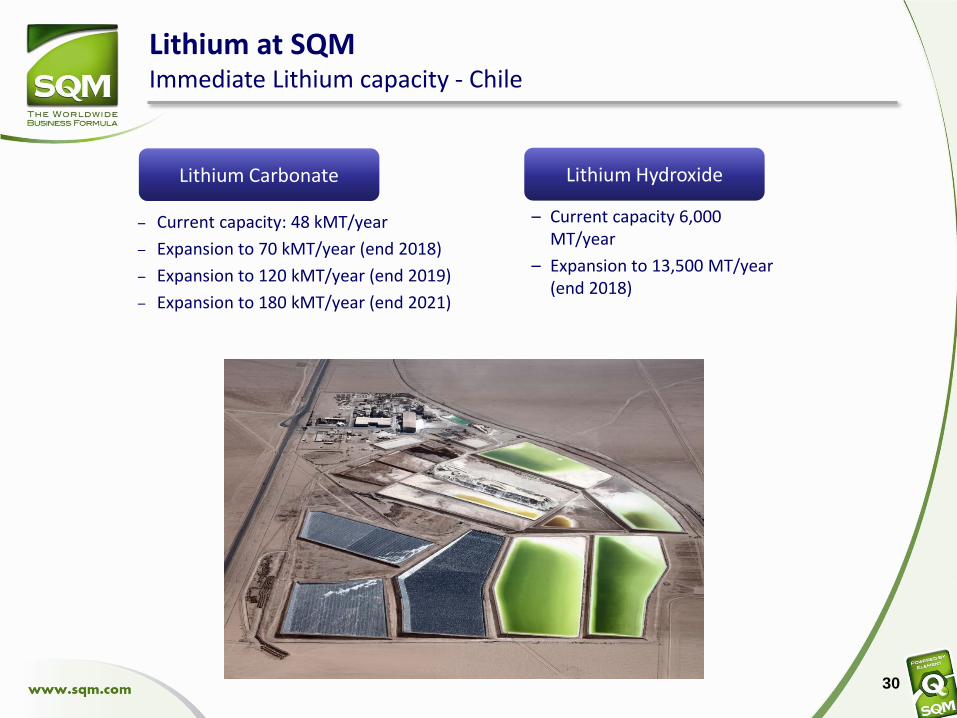
Lithium at SQMImmediate Lithium capacity - Chile
– Current capacity 6,000 MT/year
– Expansion to 13,500 MT/year (end 2018)
30
– Current capacity: 48 kMT/year
– Expansion to 70 kMT/year (end 2018)
– Expansion to 120 kMT/year (end 2019)
– Expansion to 180 kMT/year (end 2021)
Lithium Carbonate Lithium Hydroxide
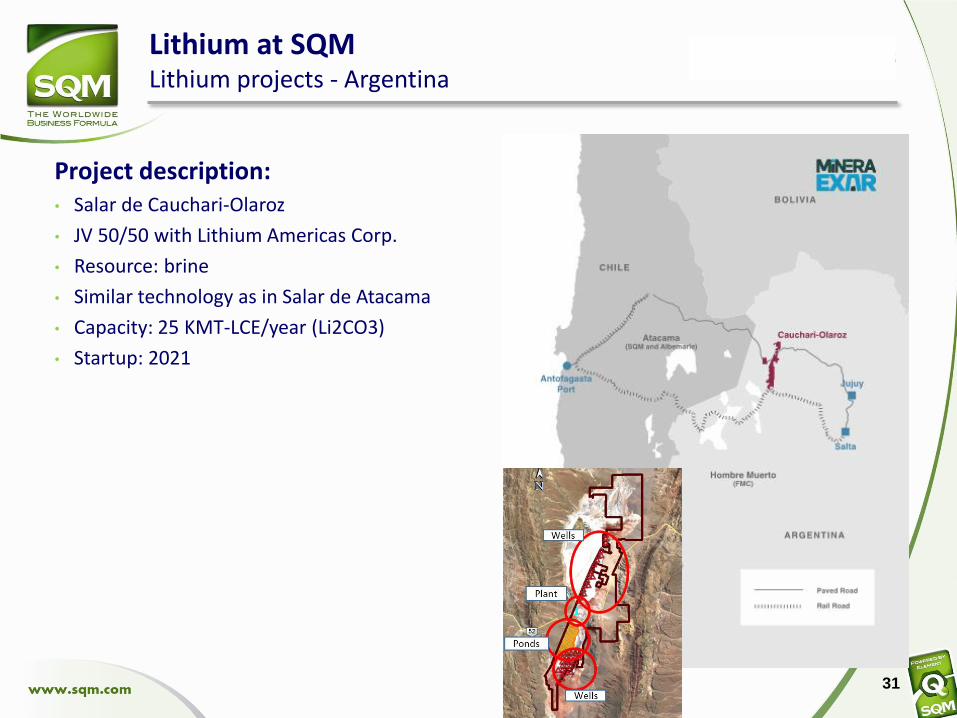
Lithium at SQMLithium projects - Argentina
Project description:• Salar de Cauchari-Olaroz
• JV 50/50 with Lithium Americas Corp.
• Resource: brine
• Similar technology as in Salar de Atacama
• Capacity: 25 KMT-LCE/year (Li2CO3)
• Startup: 2021
31
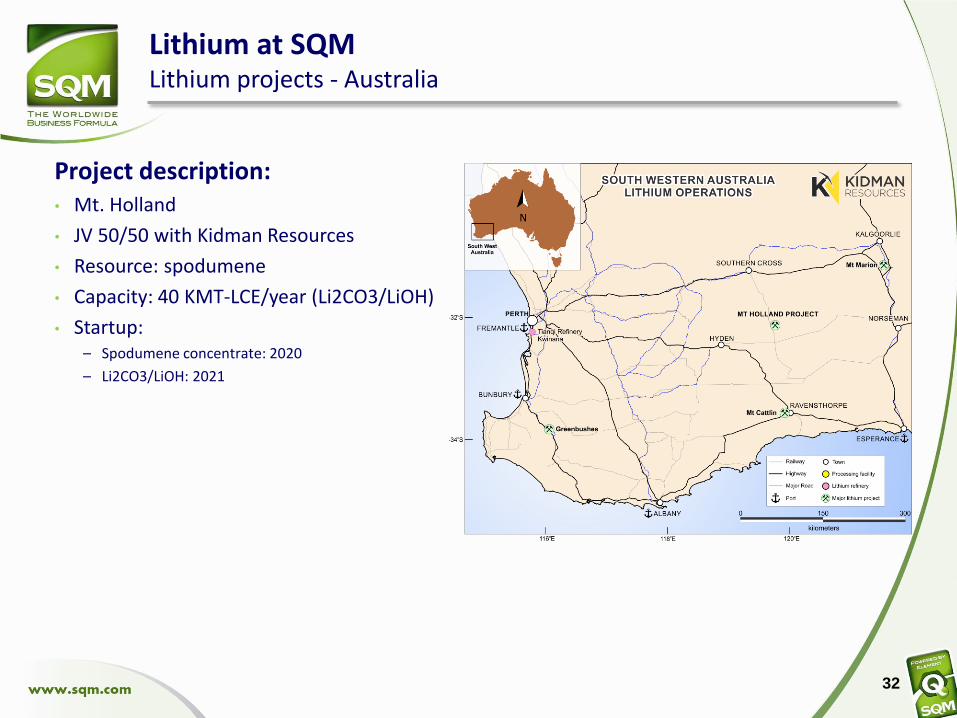
Lithium at SQMLithium projects - Australia
Project description:• Mt. Holland
• JV 50/50 with Kidman Resources
• Resource: spodumene
• Capacity: 40 KMT-LCE/year (Li2CO3/LiOH)
• Startup:– Spodumene concentrate: 2020
– Li2CO3/LiOH: 2021
32
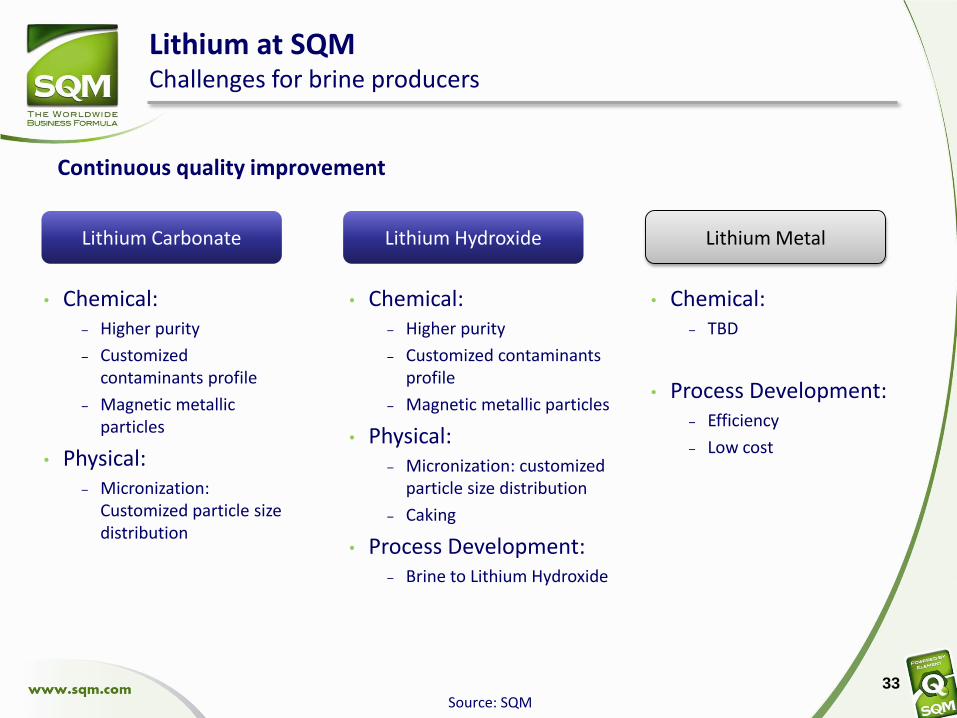
Lithium at SQMChallenges for brine producers
33
• Chemical:‒ Higher purity
‒ Customized contaminants profile
‒ Magnetic metallic particles
• Physical:‒ Micronization:
Customized particle size distribution
Lithium Carbonate Lithium Hydroxide
• Chemical:‒ Higher purity
‒ Customized contaminants profile
‒ Magnetic metallic particles
• Physical:‒ Micronization: customized
particle size distribution
‒ Caking
• Process Development:‒ Brine to Lithium Hydroxide
Source: SQM
Continuous quality improvement
Lithium Metal
• Chemical:‒ TBD
• Process Development:‒ Efficiency
‒ Low cost
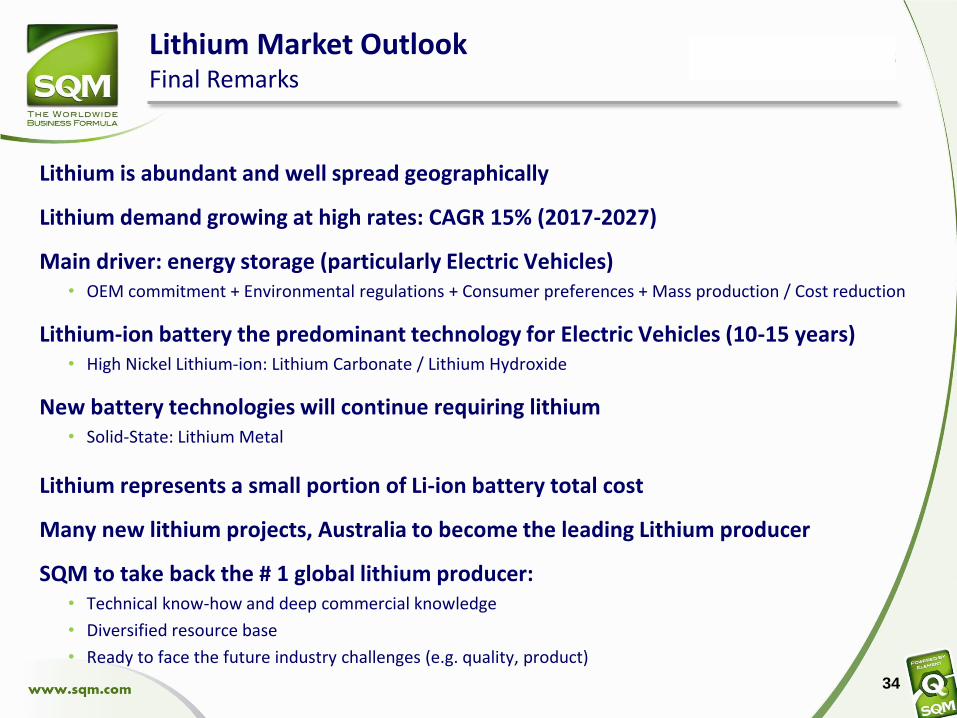
Lithium Market OutlookFinal Remarks
Lithium is abundant and well spread geographically
Lithium demand growing at high rates: CAGR 15% (2017-2027)
Main driver: energy storage (particularly Electric Vehicles)• OEM commitment + Environmental regulations + Consumer preferences + Mass production / Cost reduction
Lithium-ion battery the predominant technology for Electric Vehicles (10-15 years) • High Nickel Lithium-ion: Lithium Carbonate / Lithium Hydroxide
New battery technologies will continue requiring lithium• Solid-State: Lithium Metal
Lithium represents a small portion of Li-ion battery total cost
Many new lithium projects, Australia to become the leading Lithium producer
SQM to take back the # 1 global lithium producer:• Technical know-how and deep commercial knowledge
• Diversified resource base
• Ready to face the future industry challenges (e.g. quality, product)
34
Thank You…