Embed Size (px)
Citation preview
Evaluating the Use of Open Badges
in an Open Learning Environment
Jose Luis Santos1, Sven Charleer1, Gonzalo Parra1,Joris Klerkx1, Erik Duval1, and Katrien Verbert2
1 Dept. of Computer Science, KU LeuvenLeuven, Belgium
{JoseLuis.Santos,Sven.Charleer,Gonzalo.Parra,Joris.Klerkx,Erik.Duval}@cs.kuleuven.be
2 Dept. of Computer Science, Eindhoven University of TechnologyEindhoven, The Netherlands
Abstract. This paper reports on our ongoing research around learninganalytics. We focus on how learning analytics can be used to increasestudent motivation and the use of badges as a way to aggregate learn-ing activity being a representation of their goals and progress along thecourse. The context of this work is an open learning environment, basedon wikis, blogs, twitter, an activity stream mash-up and an open badgessystem. Our evaluation analyses perceived usefulness and usability of thesystem, as well as the impact on student motivation. Our results indicatethat badges are useful to motivate students while activity streams havethe potential to activate students.
1 Introduction
Motivation, while often overlooked, is perhaps the single most important factorin learning [1]. Also in our earlier work [2], students reported motivation as oneof their main learning issues. New strategies to raise learner motivation havebeen discussed in recent years [3,4].
Some research identifies the factors that influence motivation in order to planinterventions [5]. Others study how technology such as using augmented realitydevices [6] and learning dashboards [7] can impact on the learner motivation.Whilst nobody has found a magic recipe, we try to figure out what strategyworks better in our context.
We believe that social support and collaboration among students and activeteacher support may help to overcome and regulate problems in motivation [1].In order to promote such collaboration in our courses (see section 3.1), we followan ’open learning‘ approach. Students use Twitter (with a course hashtag), wikis,blogs and other web 2.0 tools such as Toggl [2] and TiNYARM [8] (i) to reporton and (ii) communicate about their work with each other and the outside worldin a ’community of practice‘ kind of way [9]. We focus on the use of learningdashboards that visualise data about learners in an open way, therefore students
D. Hernandez-Leo et al. (Eds.): EC-TEL 2013, LNCS 8095, pp. 314–327, 2013.c© Springer-Verlag Berlin Heidelberg 2013
Evaluating the Use of Open Badges in an Open Learning Environment 315
can check their own and peers’ information [2]. We design, build and evaluate thedashboards in order to measure their potential to support awareness and (self-)reflection and to motivate students to participate actively [2]. Whilst several ofour case studies showed that these kind of dashboards can successfully address avariety of learning issues, one thing they did not, is to increase learner motivation[10,2]. This paper focuses on the next version of our dashboards of which webelieved they could increase learner motivation.
The learning dashboard described in this paper merges three approaches:
• Badges. Exciting new research is adopting badge systems to certify skillsand abilities [11] such as Mozilla Open Badges that allows students toshare their achievements/badges on different social networks such as blogs,Linkedin and Facebook [12]. The use of badges have been proven to positivelyincrease learner motivation [13]. In addition, badges are a representation ofhow students carried out the activities which in turn can affect positivelythe learner motivation [14].
• Social visualisations. The use of social visualisations may increase learnermotivation [7].
• Activity Stream. Activity streams increase user awareness [15] by aggre-gating the activity from the different systems that are being used in ourcourse: posts, comments, tweets and badges.
We carried out a detailed online 5-point Likert scales questionnaire and asecond evaluation with open questions four weeks into the course. 21 out of 26students replied to the survey. The questionnaire assesses perceived usefulnessand usability of the different components of the system.
The remainder of this text is structured as follows: section 2 describes relatedwork. Section 3 describes the architecture of the Open Learning Analytics systemand the badges used in this experiment. Section 4 explains the evaluation settingsand the obtained results. Conclusions and future work are presented in Section 5.
2 Related Work
Dashboards can be considered as a subset of ’personal informatics‘applications[16]. These applications typically encourage positive change of be-haviour or provide new insights from data[17,18].
Results of our analysis of learning dashboards [17] suggests that dashboardscan have an impact on the behaviour of students if they go through four stages:
• The first stage is awareness. This level concerns with just data. Such datacan be visualised as activity streams, tabular overviews, linecharts or othervisualisations.
• The second stage is reflection. It concerns users coming up with questionsand assessing how useful and relevant these are.
• The third stage is sense-making. This level concerns users answering suchquestions.
316 J.L. Santos et al.
• The final stage is impact. This level concerns new meaning or changebehaviour.
Dashboards such as Moodle dashboard [19] visualise the overview of the ac-tivity in a table. In addition to the table overview, StepUp! [2] visualises theactivity using also spark lines and bar charts to zoom in the activity .Otherdashboards visualise the data using line charts such as GLASS [20] and othersare complemented with parallel coordinates and word clouds such as the StudentActivity Meter [10]. Class-on [21], for instance, visually represent the class andthe status of the student with different colours for each seat.
The dashboard described in this paper visualises the achievement of OpenBadges along the course using line charts. Open Badges [12] are used as a meanto aggregate data and representation of achievements. In addition, Badges arealso completely public enabling factors such as social influence and the per-ceived degree of recognition [22]. This dashboard is supported also by an activ-ity stream mashups providing a quick and easily accessible overview of a group’swork. Different activity streams enable users to become peripherally aware ofcontributions[15]. Some activity stream dashboards visualise this information byaggregating information from different social networks in a single stream [23].The activity stream presented in this paper also aggregates information whenstudents are awarded with badges.
Depending on how the data is visualised, the dashboard will trigger differ-ent questions and consequently different conclusions [24]. Some dashboards aredesigned to detect isolated students [25] or students who do not work well [26].Other dashboards are used to increase awareness of class activity [2] and resourceuse [10] or to increase motivation of students [7]. Our learning dashboards isdesigned specifically for motivational purposes. Badges are set up in order torepresent the way that activities are carried out. Displaying this informationshould motivate the students [14].
3 Open Learning Analytics System
3.1 Introduction
The system described in this section has been designed based on the previousstatements and deployed in a course on user interfaces where 26 engineering stu-dents work in teams on projects related to Human-Computer Interaction. Thisyear they focus on creating a ”recommendation application”. A large part of thecourse activity focuses on the design, implementation and evaluation of a work-ing prototype, starting from a paper prototype to a working digital prototype.Each group sets up a blog on which they regularly post updates on thoughts,ideas and progression. They also tweet using a course hashtag (#chikul13) andcomment on each other’s blogs. All blogs are deployed on the Wordpress1 plat-form. This allows us to easily track student activity through the use of RSS
1 http://developer.wordpress.com/docs/api/
Evaluating the Use of Open Badges in an Open Learning Environment 317
feeds and the availability of their usernames for all comments. Interaction withteacher and assistants outside the classroom also happens through Twitter andcomments on their blogs. Using these platforms, we create an open course thatis accessible by everyone, promoting interaction with external parties and givingthe tasks a value also outside of the course.
3.2 Architecture
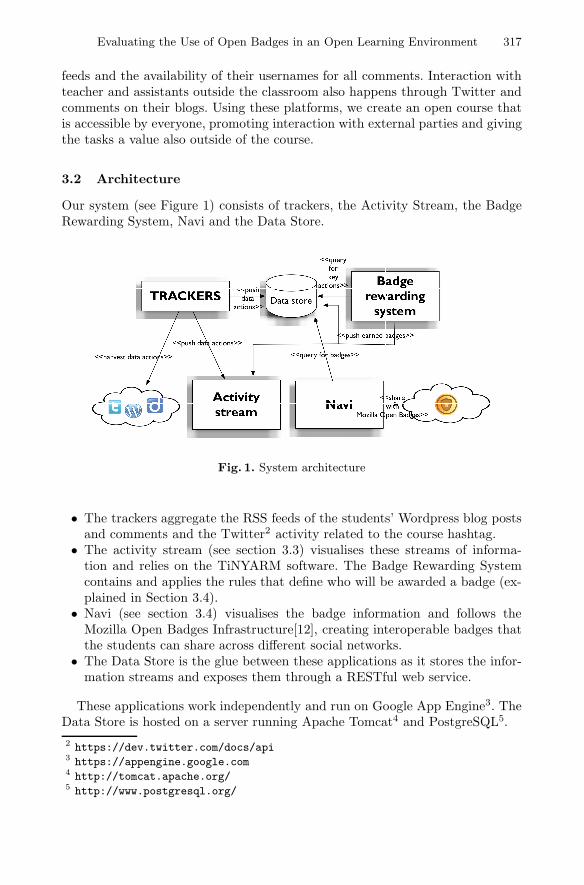
Our system (see Figure 1) consists of trackers, the Activity Stream, the BadgeRewarding System, Navi and the Data Store.
Fig. 1. System architecture
• The trackers aggregate the RSS feeds of the students’ Wordpress blog postsand comments and the Twitter2 activity related to the course hashtag.
• The activity stream (see section 3.3) visualises these streams of informa-tion and relies on the TiNYARM software. The Badge Rewarding Systemcontains and applies the rules that define who will be awarded a badge (ex-plained in Section 3.4).
• Navi (see section 3.4) visualises the badge information and follows theMozilla Open Badges Infrastructure[12], creating interoperable badges thatthe students can share across different social networks.
• The Data Store is the glue between these applications as it stores the infor-mation streams and exposes them through a RESTful web service.
These applications work independently and run on Google App Engine3. TheData Store is hosted on a server running Apache Tomcat4 and PostgreSQL5.
2 https://dev.twitter.com/docs/api3 https://appengine.google.com4 http://tomcat.apache.org/5 http://www.postgresql.org/
318 J.L. Santos et al.
3.3 Activity Stream
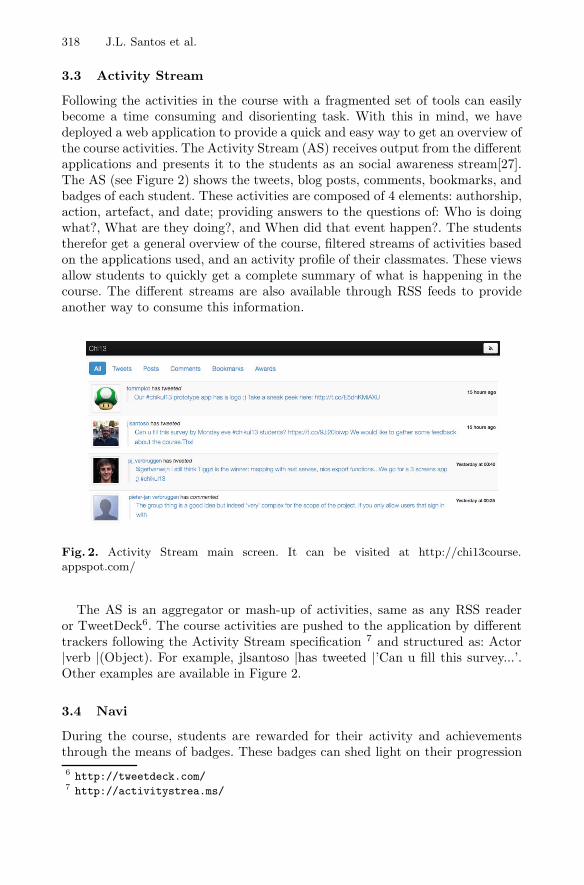
Following the activities in the course with a fragmented set of tools can easilybecome a time consuming and disorienting task. With this in mind, we havedeployed a web application to provide a quick and easy way to get an overview ofthe course activities. The Activity Stream (AS) receives output from the differentapplications and presents it to the students as an social awareness stream[27].The AS (see Figure 2) shows the tweets, blog posts, comments, bookmarks, andbadges of each student. These activities are composed of 4 elements: authorship,action, artefact, and date; providing answers to the questions of: Who is doingwhat?, What are they doing?, and When did that event happen?. The studentstherefor get a general overview of the course, filtered streams of activities basedon the applications used, and an activity profile of their classmates. These viewsallow students to quickly get a complete summary of what is happening in thecourse. The different streams are also available through RSS feeds to provideanother way to consume this information.
Fig. 2. Activity Stream main screen. It can be visited at http://chi13course.appspot.com/
The AS is an aggregator or mash-up of activities, same as any RSS readeror TweetDeck6. The course activities are pushed to the application by differenttrackers following the Activity Stream specification 7 and structured as: Actor|verb |(Object). For example, jlsantoso |has tweeted |’Can u fill this survey...’.Other examples are available in Figure 2.
3.4 Navi
During the course, students are rewarded for their activity and achievementsthrough the means of badges. These badges can shed light on their progression
6 http://tweetdeck.com/7 http://activitystrea.ms/
Evaluating the Use of Open Badges in an Open Learning Environment 319
and that of the class. To design these badges, we start from the idea of what wewant to promote, namely: activity, quality and results.
Evident choices for activity are the amount of entries posted on Twitter andWordpress, resulting in, for example, badges rewarding 5, 10 or 15 tweets posted.Quality can be indirectly linked to the external activity on a student’s activity.For instance, a blog post with many comments by external parties or ”retweets”in Twitter can be a good indicator, hence we design badges rewarding the acquir-ing of 5, 10 or 15 comments on one’s blogpost. Results are related to milestonesso students can be rewarded for completing certain activities such as finishingan assignment. Thus, we award badges for the completion of a developmentiteration in the course.
To keep the students actively engaged during the entire duration of the course,most badges are awarded biweekly. There are badges that are awarded instantly(i.e. a student that tweets 5 times receives a badge), other badges are awarded atthe end of the 2 week period (i.e. the most active student in class). A few badgescan only be achieved once in the course (i.e. development iteration 1 completed).To reward team effort, some badges can only be earned as a team. Keepingtrack of and commenting on every blog post is more feasible as a team andis rewarded with an appropriate team badge. While generally badges representpositive activities, we designed a couple of negative badges that students shouldnot wish to receive, such as the badge for ’no comment‘ activity.
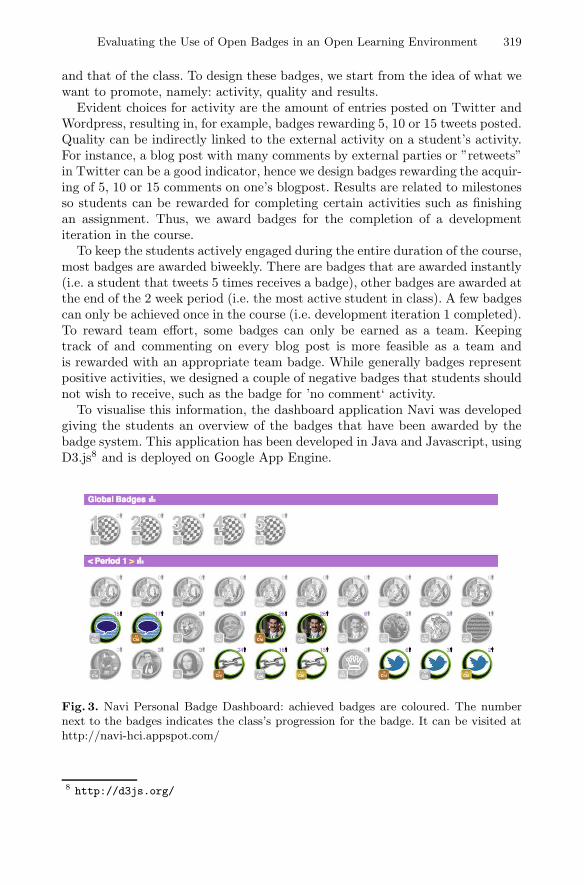
To visualise this information, the dashboard application Navi was developedgiving the students an overview of the badges that have been awarded by thebadge system. This application has been developed in Java and Javascript, usingD3.js8 and is deployed on Google App Engine.
Fig. 3. Navi Personal Badge Dashboard: achieved badges are coloured. The numbernext to the badges indicates the class’s progression for the badge. It can be visited athttp://navi-hci.appspot.com/
8 http://d3js.org/
320 J.L. Santos et al.
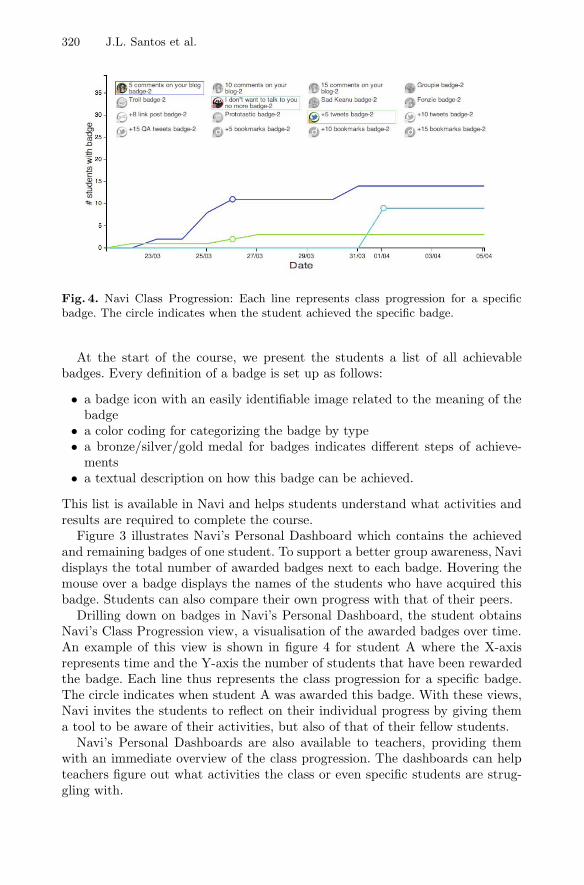
Fig. 4. Navi Class Progression: Each line represents class progression for a specificbadge. The circle indicates when the student achieved the specific badge.
At the start of the course, we present the students a list of all achievablebadges. Every definition of a badge is set up as follows:
• a badge icon with an easily identifiable image related to the meaning of thebadge
• a color coding for categorizing the badge by type• a bronze/silver/gold medal for badges indicates different steps of achieve-ments
• a textual description on how this badge can be achieved.
This list is available in Navi and helps students understand what activities andresults are required to complete the course.
Figure 3 illustrates Navi’s Personal Dashboard which contains the achievedand remaining badges of one student. To support a better group awareness, Navidisplays the total number of awarded badges next to each badge. Hovering themouse over a badge displays the names of the students who have acquired thisbadge. Students can also compare their own progress with that of their peers.
Drilling down on badges in Navi’s Personal Dashboard, the student obtainsNavi’s Class Progression view, a visualisation of the awarded badges over time.An example of this view is shown in figure 4 for student A where the X-axisrepresents time and the Y-axis the number of students that have been rewardedthe badge. Each line thus represents the class progression for a specific badge.The circle indicates when student A was awarded this badge. With these views,Navi invites the students to reflect on their individual progress by giving thema tool to be aware of their activities, but also of that of their fellow students.
Navi’s Personal Dashboards are also available to teachers, providing themwith an immediate overview of the class progression. The dashboards can helpteachers figure out what activities the class or even specific students are strug-gling with.
Evaluating the Use of Open Badges in an Open Learning Environment 321
4 Evaluation
4.1 Evaluation Setup, Data and Demographics
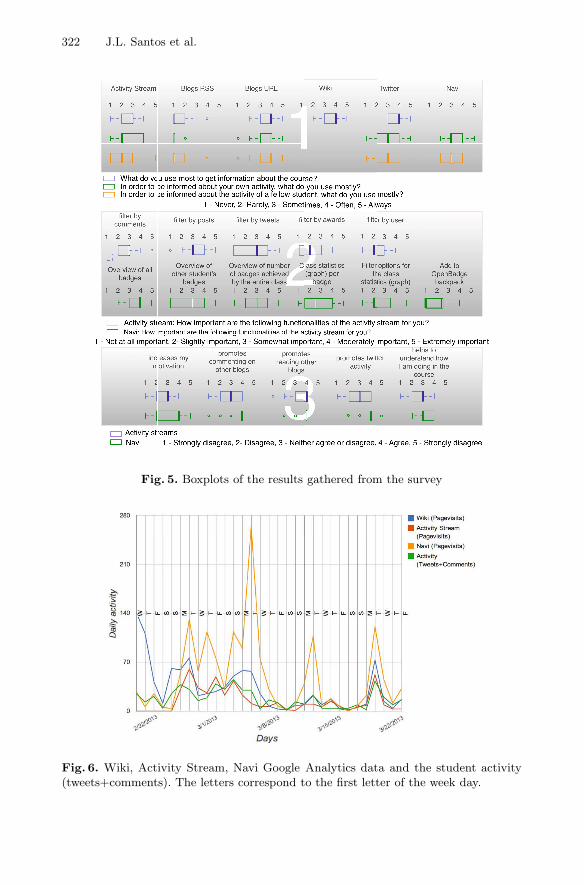
We carried out a detailed online 5-point Likert scales questionnaire four weeksinto the course. This survey was not anonymised: we informed the users thattheir name was required to find possible correlations with their activity withinthe community for research purposes. In the questionnaire, we analysed fouraspects, in order to obtain a broad view:
• Frequency of use. How frequently students visit the applications and why(see marker 1 at figure 5, the colors are defined in the legends below theboxplots). The results are discussed in Section 4.2.
• usability of the activity stream and Navi (see marker 2 at figure 5). In addi-tion we use the SUS questionnaire[28]. SUS scores and results are discussedin Section 4.3.
• usefulness and how they perceive that Navi and the activity stream arehelping them (see marker 3 at figure 5). The results are discussed in Section4.4.
• perceived usefulness of the badges (The results are not visualised but theyare discussed in Section 4.5).
A week later, we performed a second evaluation to gather additional infor-mation regarding usefulness and usability that was not clear in the first survey.This second evaluation relies on open questions and is anonymous.
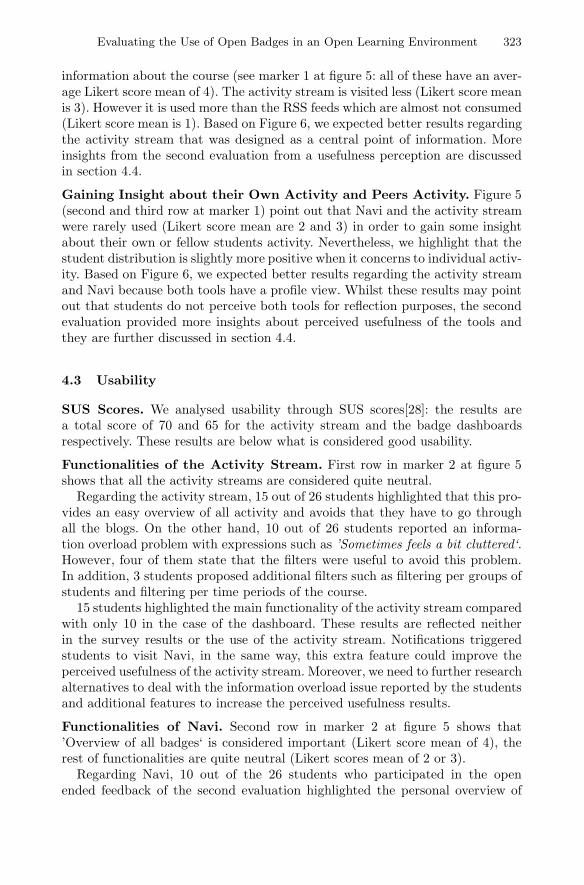
Furthermore, we track the use of the wiki, the activity stream and Navi withGoogle Analytics9. This data together with the individual activity within thecommunity (comments and tweets) are visualised in figure 6. The linechart helpsus to find usage patterns.
These two additional sources are referenced along the sections 4.2, 4.3 and 4.4in order to enrich the discussion.
21 students out of 26 replied to the online survey. They are between 20 and 25years old. 20 out of 21 were males and only one female student replied to the sur-vey. All participants are master students. 24 out of the 26 students participatedin the second survey.
4.2 Frequency of Use
Google Analytics. The activity stream, Navi and wiki are all actively used(see Figure 6). Navi is the most actively used application based on figure 6.Moreover, the activity stream and wiki page views are aligned. Activity peakscorrespond to the face-to-face sessions with the teachers.
Information about the Course. The survey results show that our studentsprefer the wiki, the url of the blogs and following the twitter hashtag for getting
9 http://www.google.com/analytics/
322 J.L. Santos et al.
Fig. 5. Boxplots of the results gathered from the survey
Fig. 6. Wiki, Activity Stream, Navi Google Analytics data and the student activity(tweets+comments). The letters correspond to the first letter of the week day.
Evaluating the Use of Open Badges in an Open Learning Environment 323
information about the course (see marker 1 at figure 5: all of these have an aver-age Likert score mean of 4). The activity stream is visited less (Likert score meanis 3). However it is used more than the RSS feeds which are almost not consumed(Likert score mean is 1). Based on Figure 6, we expected better results regardingthe activity stream that was designed as a central point of information. Moreinsights from the second evaluation from a usefulness perception are discussedin section 4.4.
Gaining Insight about their Own Activity and Peers Activity. Figure 5(second and third row at marker 1) point out that Navi and the activity streamwere rarely used (Likert score mean are 2 and 3) in order to gain some insightabout their own or fellow students activity. Nevertheless, we highlight that thestudent distribution is slightly more positive when it concerns to individual activ-ity. Based on Figure 6, we expected better results regarding the activity streamand Navi because both tools have a profile view. Whilst these results may pointout that students do not perceive both tools for reflection purposes, the secondevaluation provided more insights about perceived usefulness of the tools andthey are further discussed in section 4.4.
4.3 Usability
SUS Scores. We analysed usability through SUS scores[28]: the results area total score of 70 and 65 for the activity stream and the badge dashboardsrespectively. These results are below what is considered good usability.
Functionalities of the Activity Stream. First row in marker 2 at figure 5shows that all the activity streams are considered quite neutral.
Regarding the activity stream, 15 out of 26 students highlighted that this pro-vides an easy overview of all activity and avoids that they have to go throughall the blogs. On the other hand, 10 out of 26 students reported an informa-tion overload problem with expressions such as ’Sometimes feels a bit cluttered‘.However, four of them state that the filters were useful to avoid this problem.In addition, 3 students proposed additional filters such as filtering per groups ofstudents and filtering per time periods of the course.
15 students highlighted the main functionality of the activity stream comparedwith only 10 in the case of the dashboard. These results are reflected neitherin the survey results or the use of the activity stream. Notifications triggeredstudents to visit Navi, in the same way, this extra feature could improve theperceived usefulness of the activity stream. Moreover, we need to further researchalternatives to deal with the information overload issue reported by the studentsand additional features to increase the perceived usefulness results.
Functionalities of Navi. Second row in marker 2 at figure 5 shows that’Overview of all badges‘ is considered important (Likert score mean of 4), therest of functionalities are quite neutral (Likert scores mean of 2 or 3).
Regarding Navi, 10 out of the 26 students who participated in the openended feedback of the second evaluation highlighted the personal overview of
324 J.L. Santos et al.
the badges. 8 students also highlighted comparison of the earned badges withtheir peers. On the other hand, 3 students reported some problems regardingthe graph functionalities. They reported that it is difficult to draw conclusionsfrom the visualisations. 2 students reported that they only accessed the badgedashboard when they got a notification email that they earned a badge. 2 otherstudents report that there are too many badges and that this makes it difficultto be fully aware of the ones they can earn. 9 students reported that they did notknow the functionality of sharing their badges through Mozilla Open Badges.
Based on the quantity and quality results, we conclude that the ’Overview ofall badges‘ is the most important functionality, although the ability to comparetheir achievements with their peers is also used. Addressing the graph usabilityissues reported by the students, students may use Navi more frequently in orderto be informed about their own activity and their peers (section 4.2). Moreoverthe badges notification trigger some of them to visit Navi. This notificationsystem can also be used to reinforce the use of the graphs or other new featuresin Navi and the activity stream.
4.4 Perceived Usefulness
Motivation. Whereas first column in marker 3 at figure 5 shows that the stu-dents consider badges motivating (Likert scale average of 4), they do not havesame opinion about the activity stream (Likert scale mean of 3). This resultsare somehow logic since the activity stream is designed to increase the learnerawareness and not motivation. However, it is also useful to see clearly the differ-ent scores between both applications in order to see how the perception changesregarding a tool designed to motivate and the other that was not designed withthis goal.
Motivating Activity. Columns 2, 3 and 4 in marker 3 in figure 5 show thatstudents believe that badges motivate reading other blogs, writing comments andtweets, whereas the activity stream only promotes reading other blogs (Likertscale mean of 4). However, we also know from earlier research that the activitystream may help them to decide what to read next [8].
How they are Doing in the Course. Results are inconclusive regarding ei-ther the activity stream or Navi helps them to understand how they are doing inthe course, although the student distribution is slightly more positive in Navi’sboxplot. We expected better results since badges are designed in order to indi-cate their progress. Further research is required in this area. Badges are furtherdiscussed in section 4.5.
Earlier Research. In earlier research[2], we evaluated StepUp!, a dashboardthat displays the raw data of the community in a big table overview with thesame questions discussed in this section. The obtained results were similar tothe activity stream regarding motivation but similar to Navi regarding the otherquestions.
All three apps require tracking of student activity, they make the data publicand they get the same result regarding promoting reading of blogs. Therefore
Evaluating the Use of Open Badges in an Open Learning Environment 325
increasing the student awareness of the activity within the community may pro-mote the curiosity of the students to read what others are doing.
Whereas Navi and StepUp! aggregate the activity per actions such as com-ments and tweets in badges or simple numbers, the activity stream displaysuniquely the individual actions. Therefore, the aggregation of the data may pro-mote actions such as commenting or tweeting.
Navi uses badges in order to give the message to the user, whilst StepUp! reliesthe whole cognitive effort on the users who have to process the information anddraw conclusions by themselves. Badges may provide this motivational elementto the students.
Open Feedback in Second Evaluation. In the second evaluation, 4 out of26 students also reported that the badge system was motivating and boostsextra effort for the course, whereas one student wrote the opposite. This kind ofstatement supports our previous analysis regarding motivation.
Regarding the activity stream, 3 out of 26 students highlighted that the cen-tralisation of all the information was a nice feature for the course. 5 other stu-dents also reported that it was a nice way ’to catch up with what others are doing‘. This feedback also supports the conclusions of section 4.3. However we shouldexplore the implementation of new features in order to improve the perceivedusefulness such as a notification system as Navi has.
4.5 Perceived Usefulness of the Badges
We asked students to score 18 badges following a likert scale from not at allimportant to extremely important.
Summarising the results, they surprisingly consider among the most importantbadges those badges which have a negative connotation. The rest of the badgesare ranked as we could expect. The most important ones are those who promoteto achieve learning outcomes, afterwards those who want to improve the qualityand finally those who want to promote quantity. Moreover, they consider groupbadges more important than individual badges, except for the negative ones thatare in the top.
In the second evaluation, 2 students reported that there were many badges.However, we expect that badges increase their curiosity in order to explore themand to increase their learning motivation. Therefore, we do not consider it nec-essary to reduce the number of badges as the system is motivating them.
5 Conclusion and Future Work
This paper reports on an experiment where we deployed a badge reward sys-tem in order to increase learner motivation and activity stream to raise learnerawareness about contributions within the learning community.
Comparing the results of three different tools such as Navi, StepUp! and theactivity stream, we conclude that the mere fact of tracking student activity andmaking it public through student activity such as activity streams, tabular and
326 J.L. Santos et al.
badge overviews may motivate activity such as reading. Social visualisations suchas StepUp! and Navi may trigger more explicit activity such as commenting andtweeting. Moreover, badges motivates our students.
Whereas students reported that they did not really use the graph visualisa-tions, they reported that they used Navi to compare their badges with others inthe second evaluation. Such comparison may trigger some reflection process. Inorder to simplify this comparison process, we are going to explore others visuali-sations and the use of tabletops and ambient displays in a classroom environmentto enhance such social comparison enabling several people to interact with thevisualisations at the same time and promoting social discourse.
Based on section 4.3, students did not add badges to their Mozilla OpenBadges Backpack. Further research is required in order to gain some insightabout what kind of badges students would like to share through such system.
Students also reported that the activity stream was a useful central point ofinformation, however they also reported that they used it rarely. We have seenthat notifications triggered visits on Navi. Email notifications may raise the useof the activity stream and consequently the awareness of the activity.
This system will be integrated within the WeSPOT (included in the acknowl-edgements) system in order to support inquiry learning and it is also open to betested in other testbeds.
Acknowledgement. The research leading to these results has received fundingfrom the European Community’s Seventh Framework Programme (FP7/2007-2013) under grant agreement No 318499 - weSPOT project. Katrien Verbert isa post-doctoral fellow of the Research Foundation Flanders (FWO).
References
1. Eales, R.T.J., Hall, T., Bannon, L.J.: The motivation is the message: comparingcscl in different settings. In: Proc. of CSCL 2002, International Society of theLearning Sciences, pp. 310–317 (2002)
2. Santos, J.L., Verbert, K., Govaerts, S., Duval, E.: Addressing learner issues withstepup!: An evaluation. In: Proc. of LAK 2013. ACM (accepted, 2013)
3. Volet, S., Vauras, M.: Interpersonal Regulation of Learning and Motivation:Methodological Advances. Routledge (2013)
4. Williams, K.C., Williams, C.C.: Five key ingredients for improving student moti-vation. Research in Higher Education Journal 12, 1–23 (2011)
5. Savage, N., Birch, R., Noussi, E.: Motivation of engineering students in highereducation. Engineering Education 6(2), 39–46 (2012)
6. Di Serio, A., Ibanez, M.B., Kloos, C.D.: Impact of an augmented reality system onstudentsmotivation for a visual art course. Computers & Education (2012)
7. Hsiao, I.-H., Brusilovsky, P.: Motivational social visualizations for personalized E-learning. In: Ravenscroft, A., Lindstaedt, S., Kloos, C.D., Hernandez-Leo, D. (eds.)EC-TEL 2012. LNCS, vol. 7563, pp. 153–165. Springer, Heidelberg (2012)
8. Parra, G., Klerkx, J., Duval, E.: What should i read next? awareness of relevantpublications through a community of practice. In: Proc. of CHI EA 2013. ACM(accepted, 2013)
Evaluating the Use of Open Badges in an Open Learning Environment 327
9. Wenger, E.: Communities of practice: Learning, meaning, and identity. CambridgeUniversity Press (1999)
10. Govaerts, S., Verbert, K., Duval, E., Pardo, A.: The student activity meter forawareness and self-reflection. In: Proc. of CHI EA 2012, pp. 869–884. ACM (2012)
11. Young, J.R.: Badges earned online pose challenge to traditional college diplomas.Chronicle of Higher Education (2012)
12. Goligoski, E.: Motivating the learner: Mozillas open badges program. Access toKnowledge: A Course Journal 4(1) (2012)
13. Domınguez, A., Saenz-de Navarrete, J., de Marcos, L., Fernandez-Sanz, L., Pages,C., Martınez-Herraiz, J.J.: Gamifying learning experiences: Practical implicationsand outcomes. Computers & Education 63, 380–392 (2013)
14. Michel, C., Lavoue, E., Pietrac, L.: A dashboard to regulate project-based learn-ing. In: Ravenscroft, A., Lindstaedt, S., Kloos, C.D., Hernandez-Leo, D. (eds.)EC-TEL 2012. LNCS, vol. 7563, pp. 250–263. Springer, Heidelberg (2012)
15. Olson, J.F., Howison, J., Carley, K.M.: Paying attention to each other in visiblework communities: Modeling bursty systems of multiple activity streams. In: IEEESocialCom, pp. 276–281 (2010)
16. Li, I., Dey, A., Forlizzi, J., Hook, K., Medynskiy, Y.: Personal informatics and hci:design, theory, and social implications. In: Proc. of CHI EA 2011, pp. 2417–2420.ACM (2011)
17. Li, I., Dey, A., Forlizzi, J.: A stage-based model of personal informatics systems.In: Proc. of CHI 2010, pp. 557–566. ACM (2010)
18. Verbert, K., Duval, E., Klerkx, J., Govaerts, S., Santos, J.L.: Learning analyticsdashboard applications. American Behavioral Scientist (accepted, 2013)
19. Podgorelec, V., Kuhar, S.: Taking advantage of education data: Advanced dataanalysis and reporting in virtual learning environments. Electronics and ElectricalEngineering 114(8), 111–116 (2011)
20. Leony, D., Pardo, A., de la Fuente Valentın, L., de Castro, D.S., Kloos, C.D.: Glass:A learning analytics visualization tool. In: Proc. of LAK 2012, pp. 162–163. ACM(2012)
21. Gutierrez Rojas, I., Crespo Garcıa, R.M., Delgado Kloos, C.: Enhancing orchestra-tion of lab sessions by means of awareness mechanisms. In: Ravenscroft, A., Lind-staedt, S., Kloos, C.D., Hernandez-Leo, D. (eds.) EC-TEL 2012. LNCS, vol. 7563,pp. 113–125. Springer, Heidelberg (2012)
22. Hamari, J., Koivisto, J.: Social motivations to use gamification: an empirical studyof gamifying exercise. In: Proc. of ECIS 2013 (2013)
23. Grosseck, G., Holotescu, C.: Can we use twitter for educational activities. In:eLSE08 (2008), http://adlunap.ro/else
24. Zeng, X., Mehdi, Q.H., Gough, N.E.: Shape of the story: Story visualization tech-niques. In: Proc. of IV 2003, pp. 144–149. IEEE (2003)
25. Dawson, S., Bakharia, A., Heathcote, E.: Snapp: Realising the affordances ofreal-time sna within networked learning environments. In: Proc. of NLC 2010,pp. 125–133 (2010)
26. Kosba, E., Dimitrova, V., Boyle, R.: Using student and group models to supportteachers in web-based distance education. In: Ardissono, L., Brna, P., Mitrovic,A. (eds.) UM 2005. LNCS (LNAI), vol. 3538, pp. 124–133. Springer, Heidelberg(2005)
27. Naaman, M., Boase, J., Lai, C.H.: Is it really about me?: message content in socialawareness streams. In: Proc. of CSCW 2010, pp. 189–192. ACM (2010)
28. Brooke, J.: Sus-a quick and dirty usability scale. Usability Evaluation in Industry,189–194 (1996)