Embed Size (px)
Citation preview
1
Supplementary Online Material
for
Long-lived Electron Emission Reveals Localized Plasmon Modes
in Disordered Nanosponge Antennas
Germann Hergert1, Jan Vogelsang1, Felix Schwarz2, Dong Wang3, Heiko Kollmann1,
Petra Groß1, Christoph Lienau1,4*, Erich Runge2, and Peter Schaaf3 1Carl von Ossietzky Universität, Institut für Physik and Center of Interface Science,
D-26129 Oldenburg, Germany 2 Technische Universität Ilmenau, Institut für Physik and Institut für Mikro- und
Nanotechnologien MacroNano®, D-98693 Ilmenau, Germany 3Technische Universität Ilmenau, Institut für Mikro- und Nanotechnologien MacroNano® and
Institut für Werkstofftechnik, Fachgebiet Werkstoffe der Elektrotechnik, D-98693 Ilmenau, Germany
4 Forschungszentrum Neurosensorik, Carl von Ossietzky Universität, D-26111 Oldenburg, Germany
*email: [email protected]
1. Generation of few-femtosecond NIR laser pulses
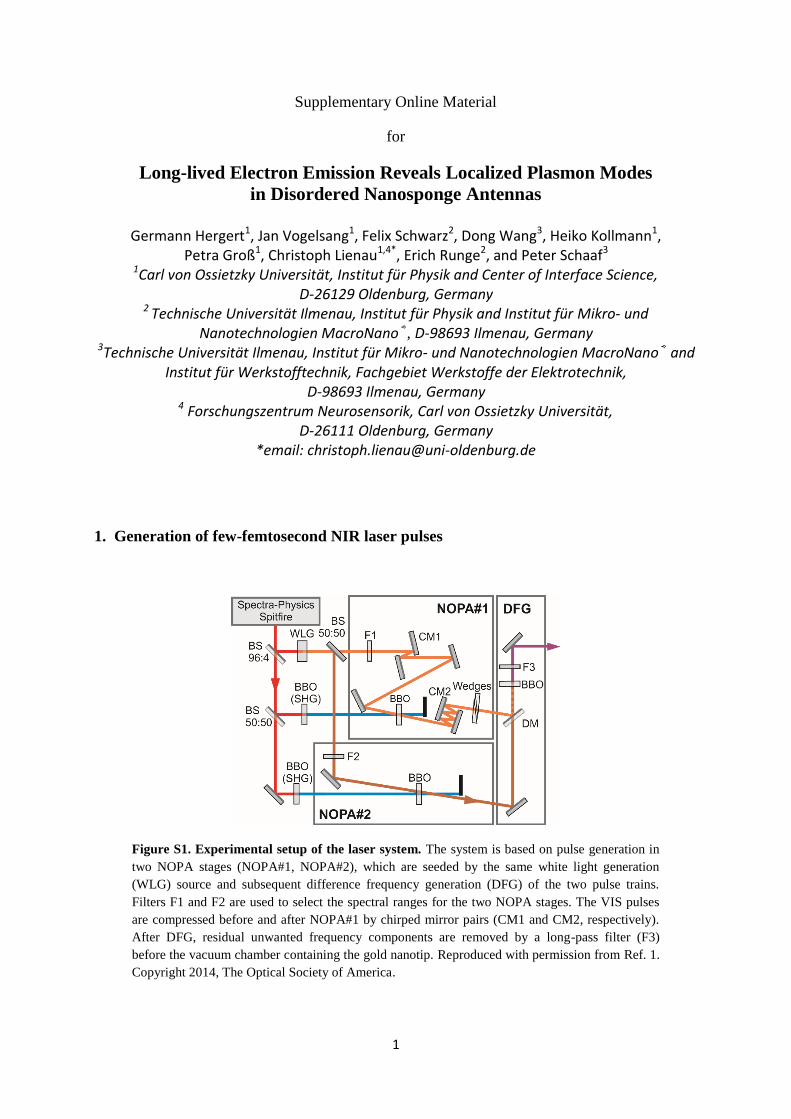
Figure S1. Experimental setup of the laser system. The system is based on pulse generation in
two NOPA stages (NOPA#1, NOPA#2), which are seeded by the same white light generation
(WLG) source and subsequent difference frequency generation (DFG) of the two pulse trains.
Filters F1 and F2 are used to select the spectral ranges for the two NOPA stages. The VIS pulses
are compressed before and after NOPA#1 by chirped mirror pairs (CM1 and CM2, respectively).
After DFG, residual unwanted frequency components are removed by a long-pass filter (F3)
before the vacuum chamber containing the gold nanotip. Reproduced with permission from Ref. 1.
Copyright 2014, The Optical Society of America.
2
In our experiments, few-cycle pulses at a center wavelength of 1600 nm are used to initiate
photoemission from gold sponges. Such pulses are derived from a regenerative Ti:Sapphire amplifier
(Spectra Physics Spitfire) with a repetition rate of 5 kHz. They are generated in two non-collinear
optical parametric amplifier (NOPA) stages, which are seeded by the same white light, followed by
difference frequency generation (DFG) between the output pulses from these two NOPA stages to
reach the near-infrared (NIR) spectral region.1
The first NOPA stage (NOPA#1) supports amplification of a broad spectral range from 530 nm to
640 nm and yields a pulse energy of about 3.6 µJ. The pulses are compressed using chirped mirrors
and pulse duration measurements indicate a nearly transform-limited pulse duration of 9 fs.
The seed for the second NOPA stage (NOPA#2) is filtered to a narrow bandwidth of 10 nm, centered
at 890 nm. The output pulses of both NOPA stages are spatially and temporally overlapped in a third
BBO crystal cut for DFG. With the fixed, narrow-bandwidth output of NOPA#2, the wide bandwidth
of NOPA#1 is directly transferred to the NIR by the DFG process. The NOPA-DFG system supplies
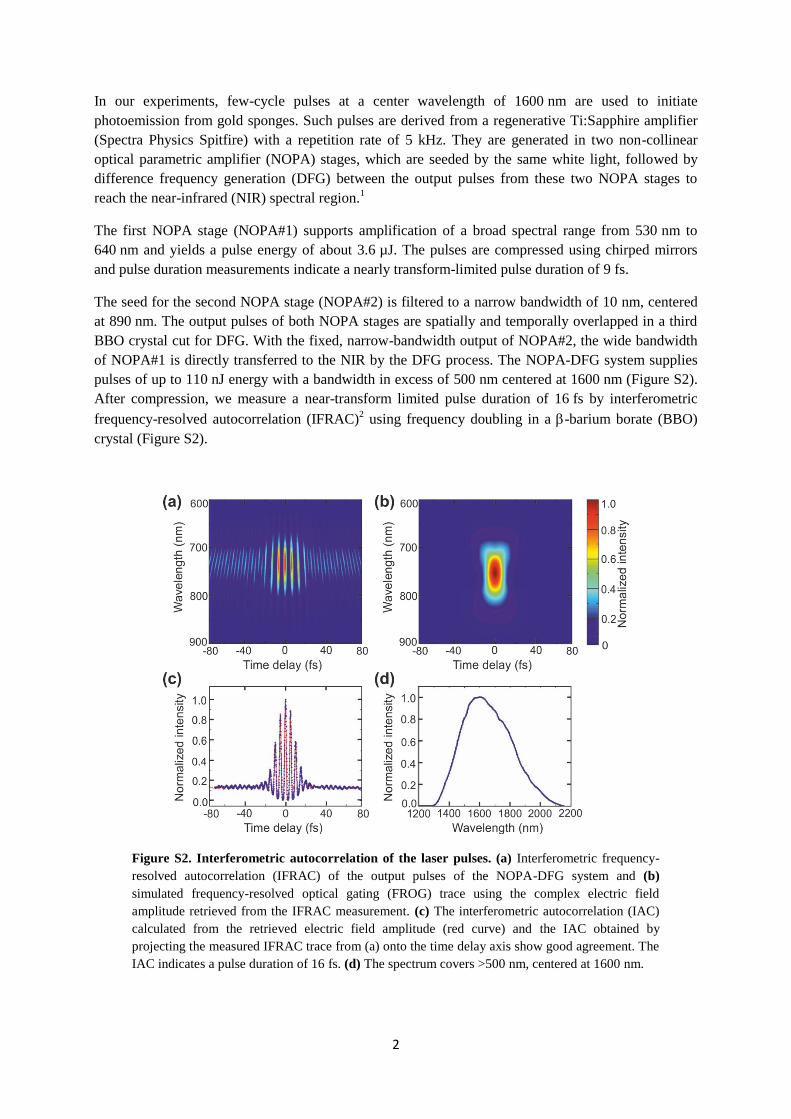
pulses of up to 110 nJ energy with a bandwidth in excess of 500 nm centered at 1600 nm (Figure S2).
After compression, we measure a near-transform limited pulse duration of 16 fs by interferometric
frequency-resolved autocorrelation (IFRAC)2 using frequency doubling in a -barium borate (BBO)
crystal (Figure S2).
Figure S2. Interferometric autocorrelation of the laser pulses. (a) Interferometric frequency-
resolved autocorrelation (IFRAC) of the output pulses of the NOPA-DFG system and (b)
simulated frequency-resolved optical gating (FROG) trace using the complex electric field
amplitude retrieved from the IFRAC measurement. (c) The interferometric autocorrelation (IAC)
calculated from the retrieved electric field amplitude (red curve) and the IAC obtained by
projecting the measured IFRAC trace from (a) onto the time delay axis show good agreement. The
IAC indicates a pulse duration of 16 fs. (d) The spectrum covers >500 nm, centered at 1600 nm.
3
Since the two NOPA stages are seeded by the same white light, they inherently share the same carrier-
envelope phase (CEP). Thus, by DFG of the two NOPA output pulse trains, the resulting NIR pulses
are passively CEP-stabilized.3,4
We have previously demonstrated a shot-to-shot CEP RMS noise of
about 800 mrad as well as an excellent long-term CEP stability of this source of better than 50 mrad
over time spans up to 20 minutes, when averaging over 100 pulses.1
2. Experimental setup for electron photoemission from nanoporous gold sponges
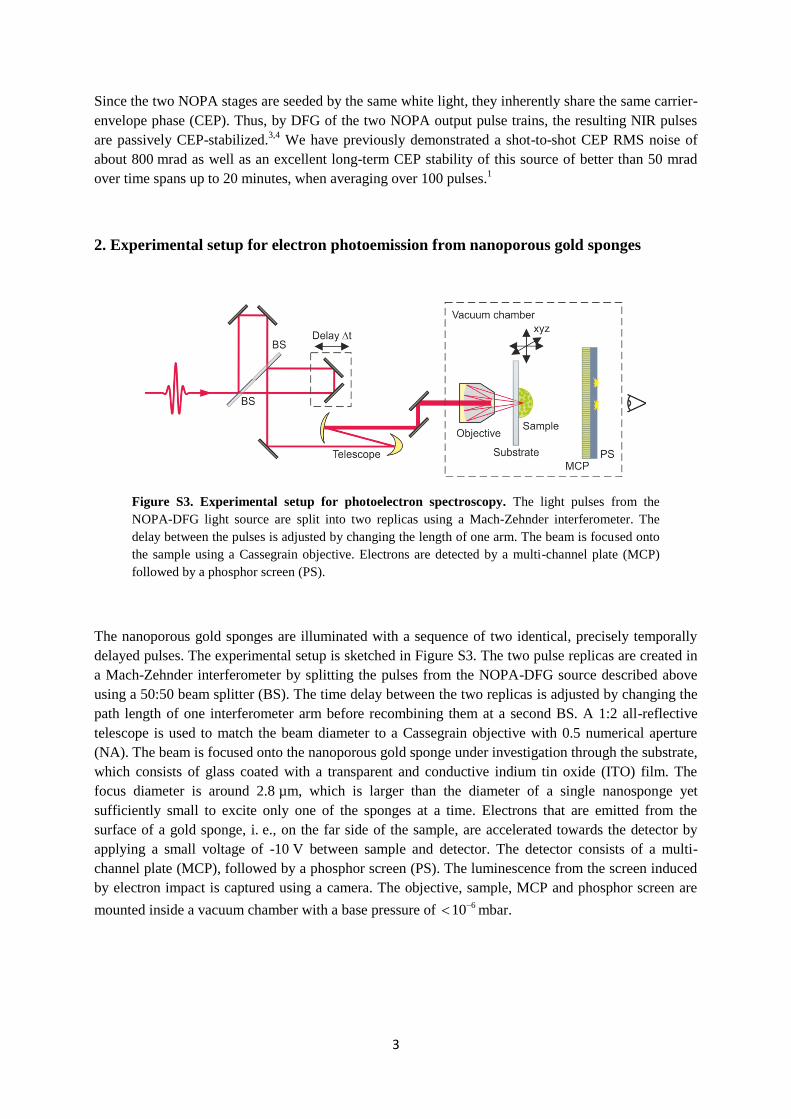
Figure S3. Experimental setup for photoelectron spectroscopy. The light pulses from the
NOPA-DFG light source are split into two replicas using a Mach-Zehnder interferometer. The
delay between the pulses is adjusted by changing the length of one arm. The beam is focused onto
the sample using a Cassegrain objective. Electrons are detected by a multi-channel plate (MCP)
followed by a phosphor screen (PS).
The nanoporous gold sponges are illuminated with a sequence of two identical, precisely temporally
delayed pulses. The experimental setup is sketched in Figure S3. The two pulse replicas are created in
a Mach-Zehnder interferometer by splitting the pulses from the NOPA-DFG source described above
using a 50:50 beam splitter (BS). The time delay between the two replicas is adjusted by changing the
path length of one interferometer arm before recombining them at a second BS. A 1:2 all-reflective
telescope is used to match the beam diameter to a Cassegrain objective with 0.5 numerical aperture
(NA). The beam is focused onto the nanoporous gold sponge under investigation through the substrate,
which consists of glass coated with a transparent and conductive indium tin oxide (ITO) film. The
focus diameter is around 2.8 µm, which is larger than the diameter of a single nanosponge yet
sufficiently small to excite only one of the sponges at a time. Electrons that are emitted from the
surface of a gold sponge, i. e., on the far side of the sample, are accelerated towards the detector by
applying a small voltage of -10 V between sample and detector. The detector consists of a multi-
channel plate (MCP), followed by a phosphor screen (PS). The luminescence from the screen induced
by electron impact is captured using a camera. The objective, sample, MCP and phosphor screen are
mounted inside a vacuum chamber with a base pressure of 610 mbar.
4
3. Theoretical model for long-lived hot spot resonances
The presence of long-lived hot spot resonances on the gold nanosponges is experimentally verified, as
described in the main manuscript, by performing time-resolved photoemission experiments on single
nanosponges. We observe photoemission for delays of more than 50 fs, which is much longer than the
pulse duration. This long-lived response function was explained by long-lived and narrow-bandwidth
hot spot resonances superimposed on a short-lived and delocalized dipolar resonance of the gold
particle. Here we explain the model and the results in increasing steps of complexity. Exemplarily, we
compare the model with the experimental results obtained for the nanoporous gold sponge labelled
“particle A” in the main text.
A time-dependent electric field LE t that is incident on the nanoporous gold sponge excites a short-
lived delocalized plasmon resonance, similar to the plasmon resonance of a solid gold nanoparticle,
which is assumed to decay exponentially with a short decay time P . In addition, N hot spot
resonances with a longer decay time H are excited. In response to a delta pulse excitation, any of the
plasmon resonances will oscillate with the resonance frequency P for the delocalized plasmon and
with j for the j-th localized plasmon, with 1,2j N . These oscillations decay exponentially with
the time constants P and
H , respectively. For simplicity, we have assumed the same lifetime for all
localized hot spot plasmon resonances in each simulation. Each localized hot spot plasmon field can
interfere with the delocalized plasmon field, creating a superposition of the two oscillating terms, but
in our model we have excluded interference of the localized fields of two different hot spots. This is
assumed, because the average distance between hot spots is much larger than the extent of the
localized near field (compare FDTD simulation shown in Figure 4b in the main text). Hence we first
derive electron emission for the field originating from each hot spot in combination with the
delocalized plasmon mode, before incoherently adding together the electron contributions from the
different hot spots.
At each spot, the short-lived plasmon field couples to the long-lived, and hence spectrally much
sharper resonance of the corresponding hot spot. This means they have a sharp resonance that is
coupled to a quasi-continuum (the broadband dipolar plasmon resonance), a situation that has first
been treated by Fano in the autoionization of Helium atoms.5 Later, a similar model to describe such
Fano-type resonances has also been used in plasmonic crystals6-8
or systems of coupled metal
nanostructures.9 Then, the local electric field strength on the surface of the sponge at time t and at the
position of hot spot j is given by the convolution of the incident field and the local response function,
which can be taken as the sum the damped exponentials delocalized and the j-th localized plasmon
resonance:
P P H
S, L Pj
t ti ti t
j jE t E t t A e e A e e
. (1)
Here, t is the Heaviside function, and PA and jA are the relative amplitudes of the delocalized
and of the j-th localized plasmon mode, respectively. The response of the individual plasmon
resonances to the driving field is implemented in the frequency domain, and the fields S, jE t are then
reconstructed by an inverse Fourier transform. The incident electric field in the frequency domain is
given as
5
L L
1
2
i tE E t e dt
(2)
and the response function of the delocalized and the j-th localized plasmon resonance is written as
P P H
Pj
t ti ti t i t
j jR t A e e A e e e dt
. (3)
In the frequency domain, the electric field strength of hot spot j is then given by the product
S, Lj jE E R . (4)
The resulting temporal field of the j-th hot spot is obtained by performing the inverse Fourier
transform of the spectral field S, jE :
S, S,
1
2
i t
j jE t E e d
(5)
The local field S, jE t gives rise to multiphoton electron emission in a nonlinear process of order
2 n of the electric field. From experimental measurements, we obtain the order of nonlinearity 5n ,
which is employed in our calculations. The temporal dynamics of the oscillating plasmon field is
studied experimentally by measuring an interferometric autocorrelation (IAC) trace of the
photoemission. This is performed by illuminating the gold sponge by a sequence of two pulses with
delay t , and by measuring the electron yield C t as a function of delay. In order to compare the
numerical model with the experimentally measured IAC, we generate the corresponding function
C t numerically. For this we first calculate the IAC jC t for each hot spot as:
2
S, S,
n
j j jC t E t E t t dt
(6)
Subsequently the different contributions of the hot spots are incoherently added together to yield the
total electron count:
1
N
j
j
C t C t
(7)
The model is implemented using the complex field amplitude that was derived from the IFRAC
measurements (see Figure S2) as the incident light field LE t . The resonance of the delocalized
plasmon mode is centered at P 1500 nm , and its decay time is taken as
P 5 fs . We have varied
the number of localized hot spots and their resonance frequencies to approximate the measured dark-
field spectra and IACs, while we have assumed a constant decay time for all hot spots in one
simulation, which is much larger than that of the delocalized plasmon mode.
6
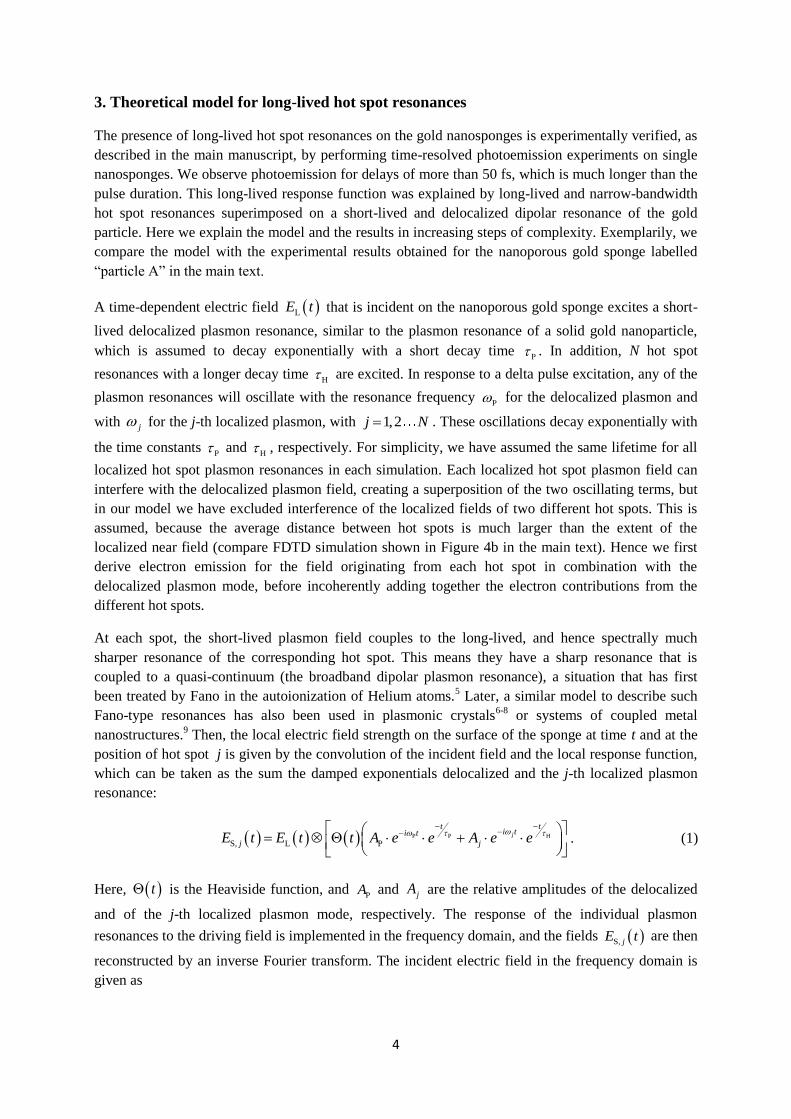
Figure S4. Interferometric autocorrelation trace of photoemission simulated for a single
dipolar resonance. (a) Model dark field spectrum of a solid gold particle with only a broad and
short-lived resonance. (b) Simulated IAC trace (black line) plotted together with the experimental
data (blue symbols) on a linear scale. In (c) the same simulated and experimental IAC are shown
as in (b) but on a logarithmic scale. The resonance as shown in (a) is centered at 1500 nm and has
a spectral width of 550 nm, corresponding to a plasmon decay time of 5 fs. A nonlinearity of order
5, matching the experimentally measured value, is assumed. Without long-lived plasmon
resonance, the simulated IAC trace cannot account for the persistent electron emission for long
delay times.
As a reference example, we calculate IAC traces expected for a (non-porous) solid gold nanoparticle.
Such a particle should only show a single broad dipole resonance, which results in a nearly
instantaneous response of the particle. For the simulations, we have taken only one resonance centered
at P 1500 nm and with a fast decay time of
P 5 fs in Eqs. (1) and (3), corresponding to a spectral
bandwidth of ~550 nm. This yields the expected broad-bandwidth intensity spectrum shown in Figure
S4a. The IAC shows interference fringes only at very short delays, which mainly reflects the
convolution of the incident field and the short-lived plasmon response. When assuming a nonlinearity
of order 5, the central fringes of the measured curve are well reproduced. The measured IAC
photoelectron emission, however, persists over a much longer delay. This shows clearly that this
simple model, taking into account only one short-lived (delocalized) plasmon mode, is not sufficient to
describe our experimental observations.
In a next step, we show the results of a model taking into account one long-lived hot spot resonance in
addition to the short-lived dipolar mode discussed above. For this we have set 1N and 1 P2A A .
The resonance was centered at 1 1700 nm and had a long decay time of
H 40 fs . The center
wavelength 1 was chosen to match the IAC fringe spacing at long delays while the lifetime was
adopted to match the overall decay of the fringes. The short-lived delocalized plasmon resonance was
kept at P 1500 nm and
P 5 fs , as before.
7
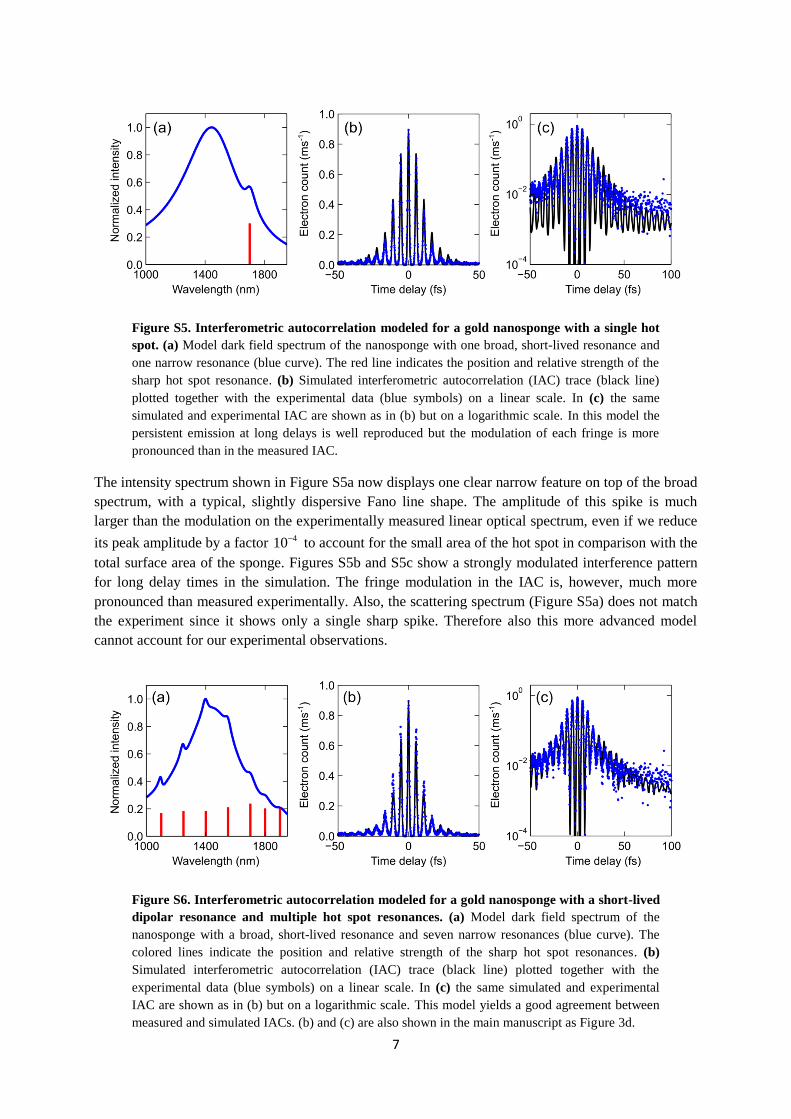
Figure S5. Interferometric autocorrelation modeled for a gold nanosponge with a single hot
spot. (a) Model dark field spectrum of the nanosponge with one broad, short-lived resonance and
one narrow resonance (blue curve). The red line indicates the position and relative strength of the
sharp hot spot resonance. (b) Simulated interferometric autocorrelation (IAC) trace (black line)
plotted together with the experimental data (blue symbols) on a linear scale. In (c) the same
simulated and experimental IAC are shown as in (b) but on a logarithmic scale. In this model the
persistent emission at long delays is well reproduced but the modulation of each fringe is more
pronounced than in the measured IAC.
The intensity spectrum shown in Figure S5a now displays one clear narrow feature on top of the broad
spectrum, with a typical, slightly dispersive Fano line shape. The amplitude of this spike is much
larger than the modulation on the experimentally measured linear optical spectrum, even if we reduce
its peak amplitude by a factor 410 to account for the small area of the hot spot in comparison with the
total surface area of the sponge. Figures S5b and S5c show a strongly modulated interference pattern
for long delay times in the simulation. The fringe modulation in the IAC is, however, much more
pronounced than measured experimentally. Also, the scattering spectrum (Figure S5a) does not match
the experiment since it shows only a single sharp spike. Therefore also this more advanced model
cannot account for our experimental observations.
Figure S6. Interferometric autocorrelation modeled for a gold nanosponge with a short-lived
dipolar resonance and multiple hot spot resonances. (a) Model dark field spectrum of the
nanosponge with a broad, short-lived resonance and seven narrow resonances (blue curve). The
colored lines indicate the position and relative strength of the sharp hot spot resonances. (b)
Simulated interferometric autocorrelation (IAC) trace (black line) plotted together with the
experimental data (blue symbols) on a linear scale. In (c) the same simulated and experimental
IAC are shown as in (b) but on a logarithmic scale. This model yields a good agreement between
measured and simulated IACs. (b) and (c) are also shown in the main manuscript as Figure 3d.
8
We have performed model calculations that led to a rather good agreement with the experiment by
assuming photoemission not only from one broad dipole mode but also from multiple hot spot
resonances. Their resonance wavelengths have been extracted from the measured linear spectra. Here,
seven resonances can be recognized, at wavelengths 1 1100 nm ,
2 1250 nm , 3 1400 nm ,
4 1550 nm , 5 1700 nm ,
6 1800 nm , and 7 1900 nm . The hot spot amplitudes were chosen
such that PjA A , and the relative amplitudes , 1,2...7jA j are indicated by the stick spectrum
in Figure S6. The lifetime of the plasmon resonances was P 5 fs and that of the hot spots was
H 50 fsj for all seven hot spots. We found that we could vary the hot spot lifetime by not more
than 10 fs without considerably deteriorating the agreement between measured and simulated IAC.
Hence, the corresponding intensity lifetimes of the hot spots is 25 5 fs . The resulting intensity
spectrum in Figure S6a resembles the measured dark-field spectrum in Figure 2 of the main
manuscript, and the simulated IAC is indeed acceptable.
References
1. Vogelsang J, Robin J, Piglosiewicz B, Manzoni C, Farinello P et al. High passive CEP stability from a
few-cycle, tunable NOPA-DFG system for observation of CEP-effects in photoemission. Opt Express
2014; 22: 25295-25306.
2. Amat-Roldán I, Cormack I, Loza-Alvarez P, Gualda E, Artigas D. Ultrashort pulse characterisation with
SHG collinear-FROG. Opt Express 2004; 12:1169-1178.
3. Cerullo G, Baltuška A, Mücke OD, Vozzi C. Few-optical-cycle light pulses with passive carrier-envelope
phase stabilization. Laser Photon Rev 2011; 5: 323-351.
4. Manzoni C, Cerullo G, De Silvestri S. Ultrabroadband self-phase-stabilized pulses by difference-
frequency generation. Opt Lett 2004; 29: 2668-2670.
5. Fano U. Effects of configuration interaction on intensities and phase shifts. Phys Rev 1961; 124:1866-
1878.
6. Sarrazin M, Vigneron JP, Vigoureux JM. Role of wood anomalies in optical properties of thin metallic
films with a bidimensional array of subwavelength holes. Phys Rev B 2003; 67: 085415.
7. Genet C, van Exter MP, Woerdman JP. Fano-type interpretation of red shifts and red tails in hole array
transmission spectra. Opt Commun 2003; 225: 331-336.
8. Ropers C, Park DJ, Stibenz G, Steinmeyer G, Kim J et al. Femtosecond light transmission and subradiant
damping in plasmonic crystals. Phys Rev Lett 2005; 94: 113901.
9. Luk'yanchuk B, Zheludev NI, Maier SA, Halas NJ, Nordlander P et al. The Fano resonance in plasmonic
nanostructures and metamaterials. Nat Mater 2010; 9: 707-715.