Embed Size (px)
Citation preview
1
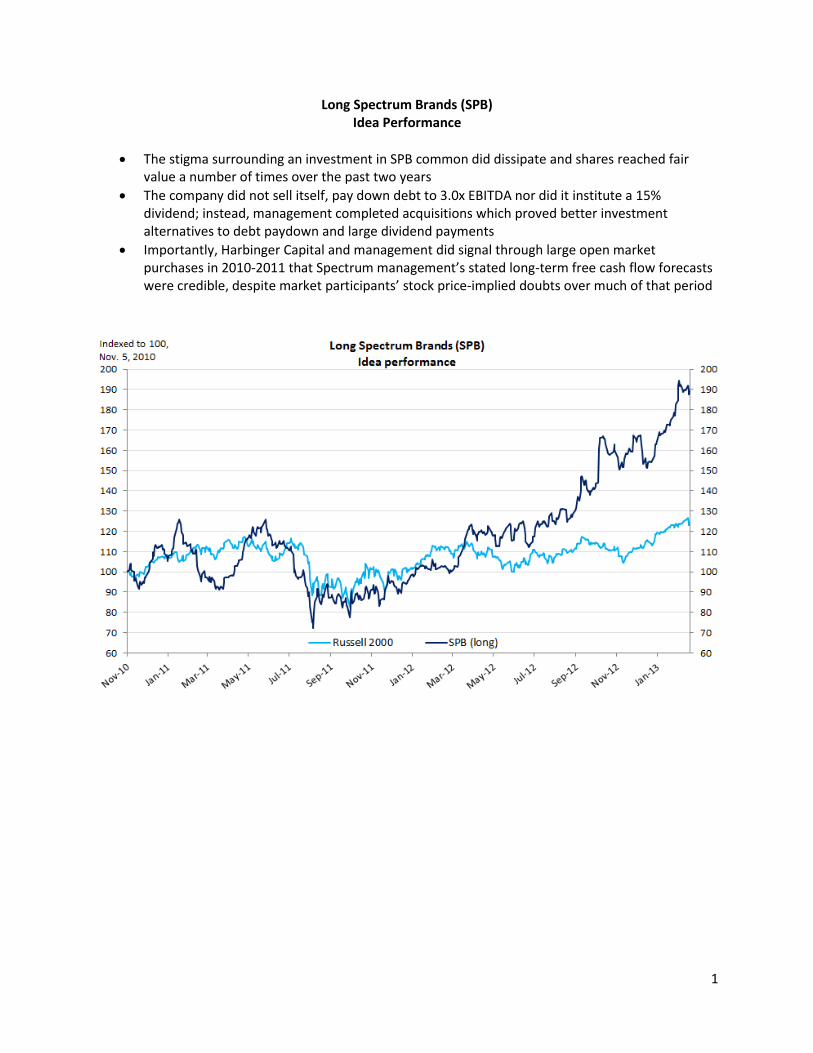
Long Spectrum Brands (SPB) Idea Performance
The stigma surrounding an investment in SPB common did dissipate and shares reached fair value a number of times over the past two years
The company did not sell itself, pay down debt to 3.0x EBITDA nor did it institute a 15% dividend; instead, management completed acquisitions which proved better investment alternatives to debt paydown and large dividend payments
Importantly, Harbinger Capital and management did signal through large open market purchases in 2010-2011 that Spectrum management’s stated long-term free cash flow forecasts were credible, despite market participants’ stock price-implied doubts over much of that period
2
Thesis:
1. Company management has successfully led Spectrum out of bankruptcy and upon successful
integration of recent Russell Hobbs acquisition, will generate better than expected free cash flow
beginning in FY2011. Spectrum emerged from Chapter 11 in August 2009 and has incurred
restructuring expenses, write-downs, non-cash adjustments and acquisition costs related to its
acquisition of Russell Hobbs over the last four troubled years. The red ink has marred the perception
of the business but will not persist past FY2011. While we argue the discount being priced into
shares is likely generated by some combination of this bankruptcy stigma and
illiquidity/concentrated ownership, uncertainty exists regarding the slowly declining consumer
battery business (25% of total sales). The stock price-implied market expectations point to double-
digit annual returns (discount rate=11%) even if Spectrum’s Global Batteries and Personal Care
segment shrinks by 1/3 over the next five years, which we argue is highly unlikely.
2. SPB is underfollowed and concentrated ownership limits broad institutional coverage; however,
careful examination of majority owner’s motives and recent actions suggest a) management’s
above-consensus free cash flow forecasts are credible and b) the bankruptcy stigma/illiquidity
discount priced into shares will disappear in the next 2-3 years upon company sale or institution
of 15%+ dividend. Harbinger Capital owns 67% of float, while hedge funds Avenue Capital and D.E.
Shaw own a combined 20%. Accordingly, average daily volume is only $1.3 million, which has
reduced equity analysts’ incentives to cover the stock. While the majority of Harbinger’s shares
were acquired through a Chapter 11 debt-to-equity conversion and the share-funded acquisition of
Russell Hobbs, the fund, with inside knowledge of the company, bought another 2% in the open
market near current levels. Harbinger’s continued open market purchases have added to what is
already a large illiquid position, suggesting a) the market should heed management’s forecasts for
free cash flow of $155-165m in 2011 and $200m+ in 2012 (8.7x and 7.0x P/FCF) and b) Spectrum is
being groomed to return cash to shareholders through a company sale or dividends within a
reasonable time frame. Company debt will be paid down to management’s stated goal of 3.0x
EBITDA by year-end 2012, at which point the company could pay a 15% dividend. The value of this
cash stream today, assuming an 11% discount rate, is roughly 30% above the current market value.
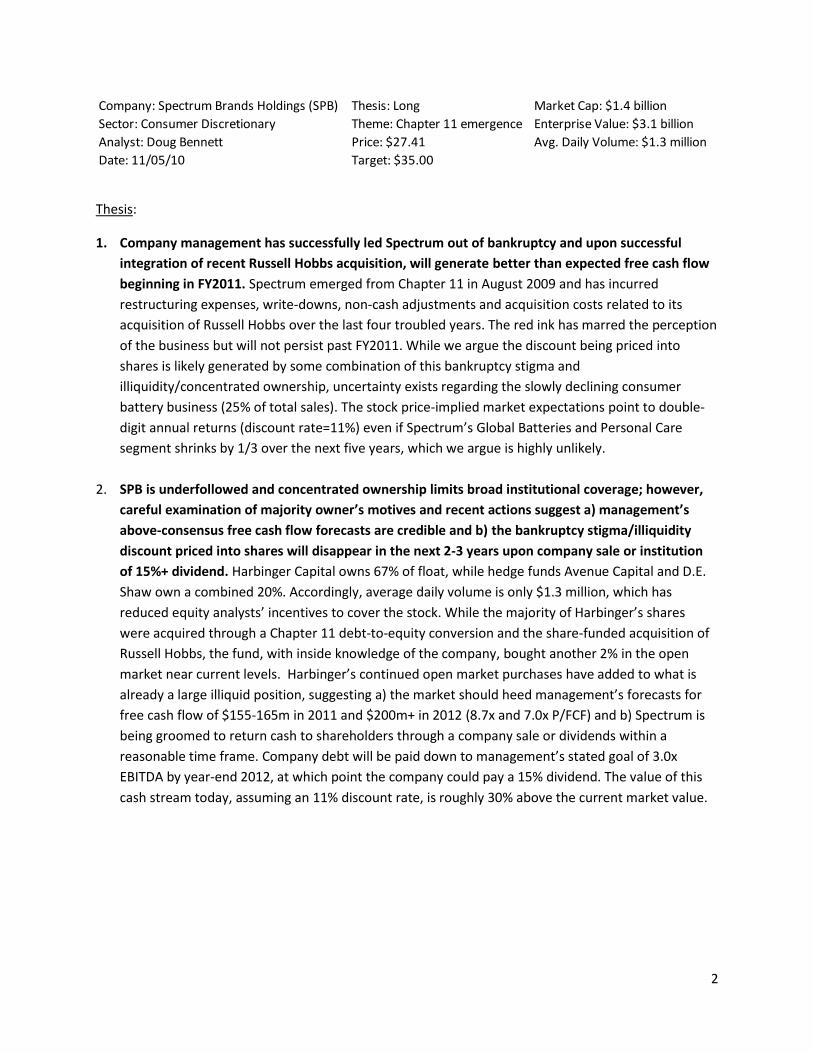
Company: Spectrum Brands Holdings (SPB) Thesis: Long Market Cap: $1.4 billion
Sector: Consumer Discretionary Theme: Chapter 11 emergence Enterprise Value: $3.1 billion
Analyst: Doug Bennett Price: $27.41 Avg. Daily Volume: $1.3 million
Date: 11/05/10 Target: $35.00
3
Company Overview
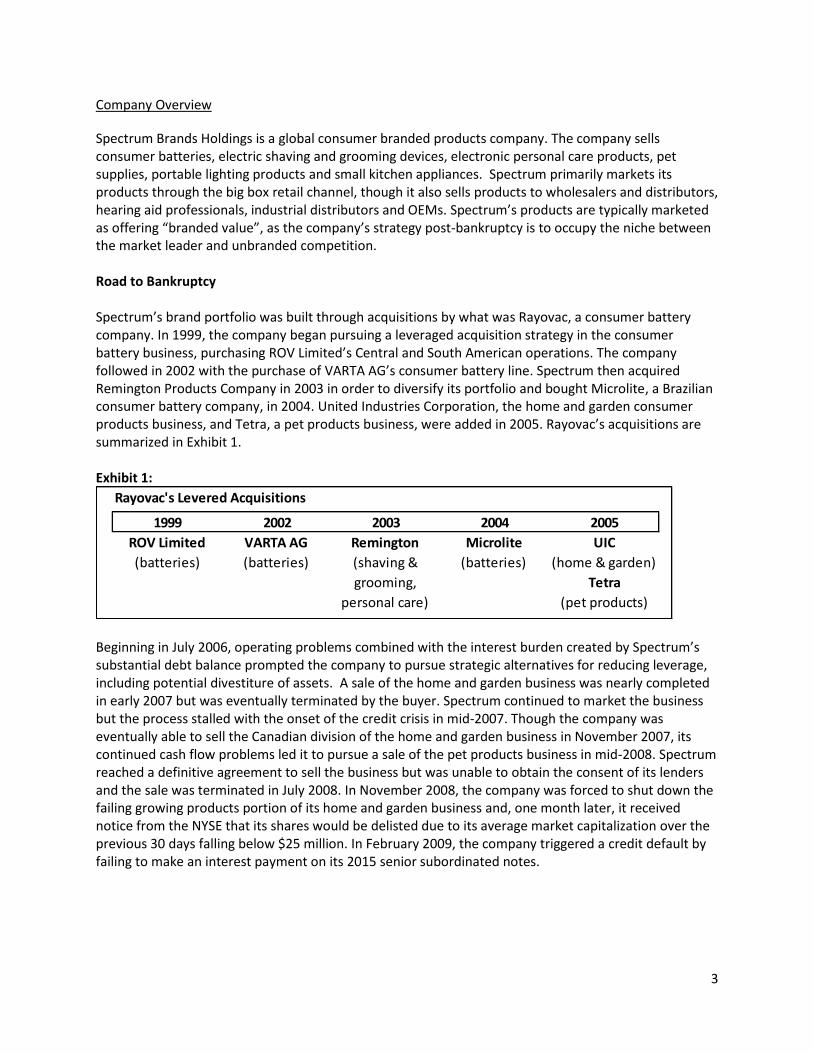
Spectrum Brands Holdings is a global consumer branded products company. The company sells consumer batteries, electric shaving and grooming devices, electronic personal care products, pet supplies, portable lighting products and small kitchen appliances. Spectrum primarily markets its products through the big box retail channel, though it also sells products to wholesalers and distributors, hearing aid professionals, industrial distributors and OEMs. Spectrum’s products are typically marketed as offering “branded value”, as the company’s strategy post-bankruptcy is to occupy the niche between the market leader and unbranded competition. Road to Bankruptcy Spectrum’s brand portfolio was built through acquisitions by what was Rayovac, a consumer battery company. In 1999, the company began pursuing a leveraged acquisition strategy in the consumer battery business, purchasing ROV Limited’s Central and South American operations. The company followed in 2002 with the purchase of VARTA AG’s consumer battery line. Spectrum then acquired Remington Products Company in 2003 in order to diversify its portfolio and bought Microlite, a Brazilian consumer battery company, in 2004. United Industries Corporation, the home and garden consumer products business, and Tetra, a pet products business, were added in 2005. Rayovac’s acquisitions are summarized in Exhibit 1. Exhibit 1:
Beginning in July 2006, operating problems combined with the interest burden created by Spectrum’s substantial debt balance prompted the company to pursue strategic alternatives for reducing leverage, including potential divestiture of assets. A sale of the home and garden business was nearly completed in early 2007 but was eventually terminated by the buyer. Spectrum continued to market the business but the process stalled with the onset of the credit crisis in mid-2007. Though the company was eventually able to sell the Canadian division of the home and garden business in November 2007, its continued cash flow problems led it to pursue a sale of the pet products business in mid-2008. Spectrum reached a definitive agreement to sell the business but was unable to obtain the consent of its lenders and the sale was terminated in July 2008. In November 2008, the company was forced to shut down the failing growing products portion of its home and garden business and, one month later, it received notice from the NYSE that its shares would be delisted due to its average market capitalization over the previous 30 days falling below $25 million. In February 2009, the company triggered a credit default by failing to make an interest payment on its 2015 senior subordinated notes.
Rayovac's Levered Acquisitions
1999 2002 2003 2004 2005
ROV Limited
(batteries)
VARTA AG
(batteries)
Remington
(shaving &
grooming,
personal care)
Microlite
(batteries)
UIC
(home & garden)
Tetra
(pet products)
4
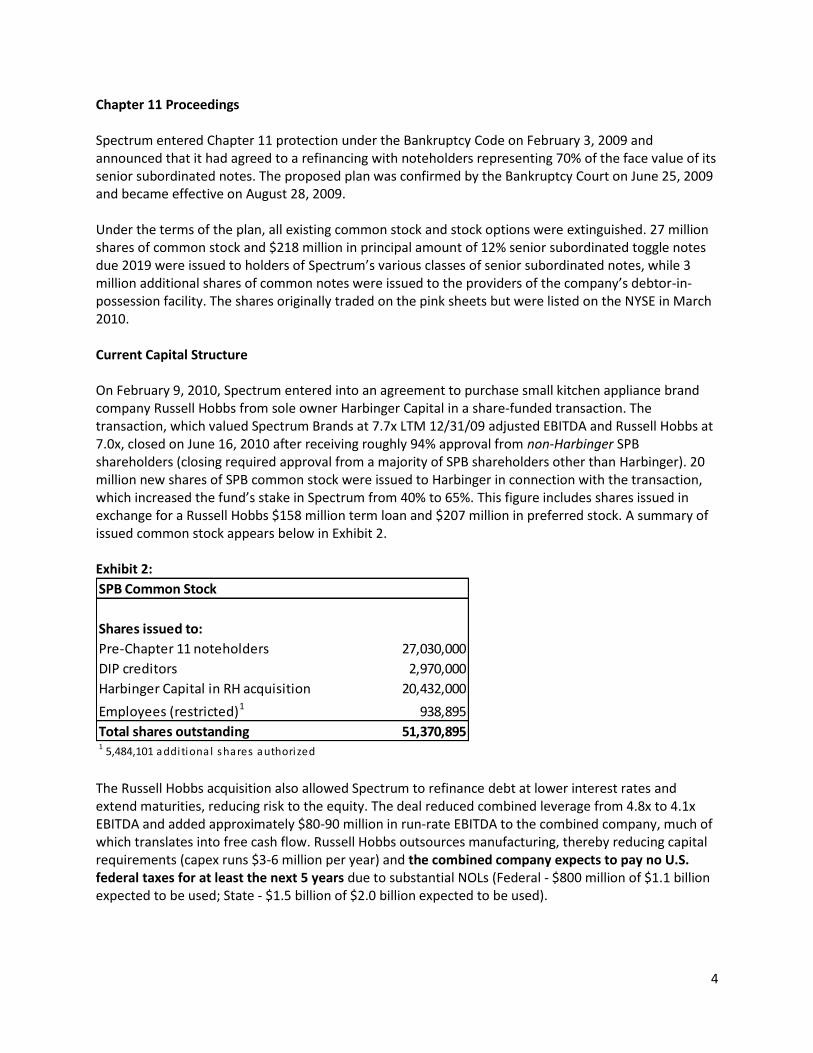
Chapter 11 Proceedings Spectrum entered Chapter 11 protection under the Bankruptcy Code on February 3, 2009 and announced that it had agreed to a refinancing with noteholders representing 70% of the face value of its senior subordinated notes. The proposed plan was confirmed by the Bankruptcy Court on June 25, 2009 and became effective on August 28, 2009. Under the terms of the plan, all existing common stock and stock options were extinguished. 27 million shares of common stock and $218 million in principal amount of 12% senior subordinated toggle notes due 2019 were issued to holders of Spectrum’s various classes of senior subordinated notes, while 3 million additional shares of common notes were issued to the providers of the company’s debtor-in-possession facility. The shares originally traded on the pink sheets but were listed on the NYSE in March 2010. Current Capital Structure On February 9, 2010, Spectrum entered into an agreement to purchase small kitchen appliance brand company Russell Hobbs from sole owner Harbinger Capital in a share-funded transaction. The transaction, which valued Spectrum Brands at 7.7x LTM 12/31/09 adjusted EBITDA and Russell Hobbs at 7.0x, closed on June 16, 2010 after receiving roughly 94% approval from non-Harbinger SPB shareholders (closing required approval from a majority of SPB shareholders other than Harbinger). 20 million new shares of SPB common stock were issued to Harbinger in connection with the transaction, which increased the fund’s stake in Spectrum from 40% to 65%. This figure includes shares issued in exchange for a Russell Hobbs $158 million term loan and $207 million in preferred stock. A summary of issued common stock appears below in Exhibit 2. Exhibit 2:
The Russell Hobbs acquisition also allowed Spectrum to refinance debt at lower interest rates and extend maturities, reducing risk to the equity. The deal reduced combined leverage from 4.8x to 4.1x EBITDA and added approximately $80-90 million in run-rate EBITDA to the combined company, much of which translates into free cash flow. Russell Hobbs outsources manufacturing, thereby reducing capital requirements (capex runs $3-6 million per year) and the combined company expects to pay no U.S. federal taxes for at least the next 5 years due to substantial NOLs (Federal - $800 million of $1.1 billion expected to be used; State - $1.5 billion of $2.0 billion expected to be used).
SPB Common Stock
Shares issued to:
Pre-Chapter 11 noteholders 27,030,000
DIP creditors 2,970,000
Harbinger Capital in RH acquisition 20,432,000
Employees (restricted)1 938,895
Total shares outstanding 51,370,8951 5,484,101 additional shares authorized
5
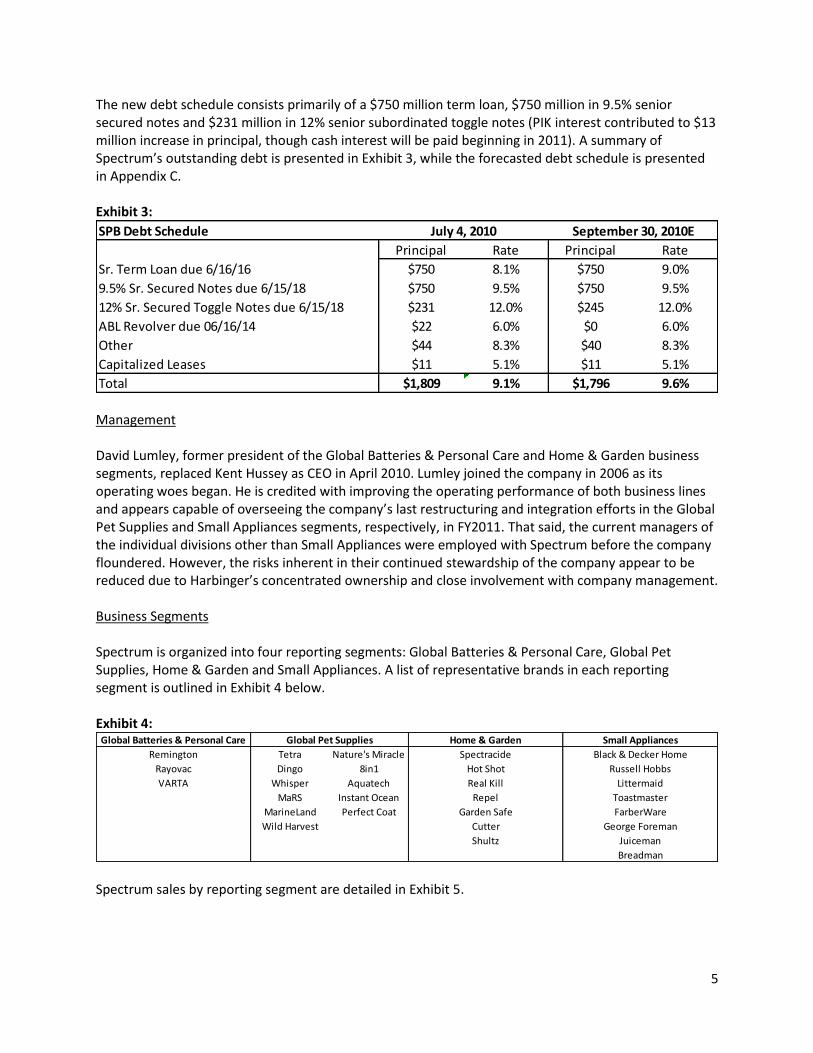
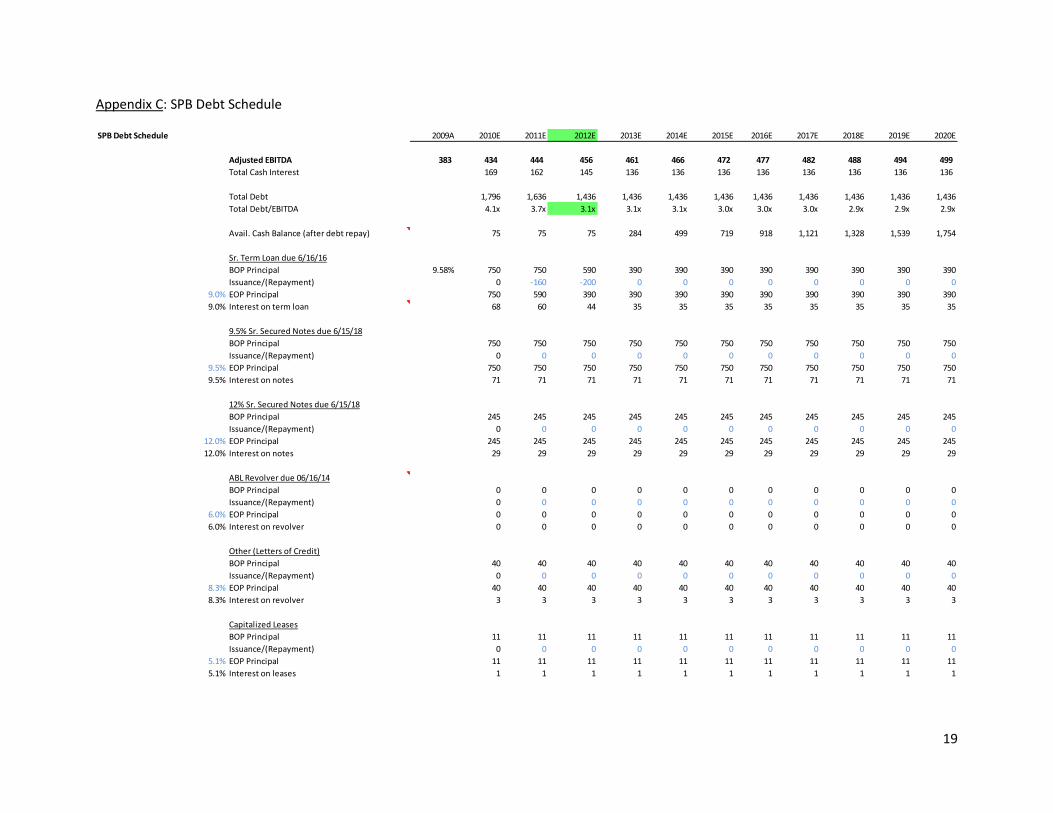
The new debt schedule consists primarily of a $750 million term loan, $750 million in 9.5% senior secured notes and $231 million in 12% senior subordinated toggle notes (PIK interest contributed to $13 million increase in principal, though cash interest will be paid beginning in 2011). A summary of Spectrum’s outstanding debt is presented in Exhibit 3, while the forecasted debt schedule is presented in Appendix C. Exhibit 3:
Management David Lumley, former president of the Global Batteries & Personal Care and Home & Garden business segments, replaced Kent Hussey as CEO in April 2010. Lumley joined the company in 2006 as its operating woes began. He is credited with improving the operating performance of both business lines and appears capable of overseeing the company’s last restructuring and integration efforts in the Global Pet Supplies and Small Appliances segments, respectively, in FY2011. That said, the current managers of the individual divisions other than Small Appliances were employed with Spectrum before the company floundered. However, the risks inherent in their continued stewardship of the company appear to be reduced due to Harbinger’s concentrated ownership and close involvement with company management. Business Segments Spectrum is organized into four reporting segments: Global Batteries & Personal Care, Global Pet Supplies, Home & Garden and Small Appliances. A list of representative brands in each reporting segment is outlined in Exhibit 4 below. Exhibit 4:
Spectrum sales by reporting segment are detailed in Exhibit 5.
SPB Debt Schedule
Principal Rate Principal Rate
Sr. Term Loan due 6/16/16 $750 8.1% $750 9.0%
9.5% Sr. Secured Notes due 6/15/18 $750 9.5% $750 9.5%
12% Sr. Secured Toggle Notes due 6/15/18 $231 12.0% $245 12.0%
ABL Revolver due 06/16/14 $22 6.0% $0 6.0%
Other $44 8.3% $40 8.3%
Capitalized Leases $11 5.1% $11 5.1%
Total $1,809 9.1% $1,796 9.6%
July 4, 2010 September 30, 2010E
Global Batteries & Personal Care Home & Garden Small Appliances
Remington Tetra Nature's Miracle Spectracide Black & Decker Home
Rayovac Dingo 8in1 Hot Shot Russell Hobbs
VARTA Whisper Aquatech Real Kill Littermaid
MaRS Instant Ocean Repel Toastmaster
MarineLand Perfect Coat Garden Safe FarberWare
Wild Harvest Cutter George Foreman
Shultz Juiceman
Breadman
Global Pet Supplies
6
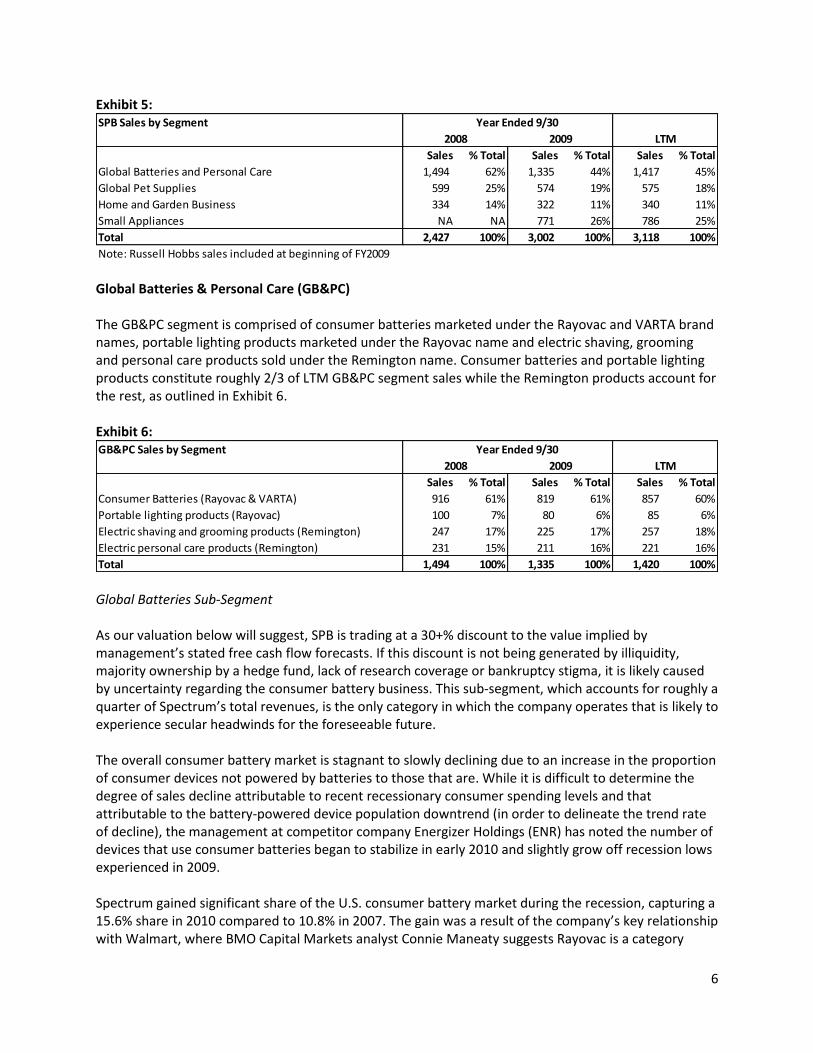
Exhibit 5:
Global Batteries & Personal Care (GB&PC) The GB&PC segment is comprised of consumer batteries marketed under the Rayovac and VARTA brand names, portable lighting products marketed under the Rayovac name and electric shaving, grooming and personal care products sold under the Remington name. Consumer batteries and portable lighting products constitute roughly 2/3 of LTM GB&PC segment sales while the Remington products account for the rest, as outlined in Exhibit 6. Exhibit 6:
Global Batteries Sub-Segment As our valuation below will suggest, SPB is trading at a 30+% discount to the value implied by management’s stated free cash flow forecasts. If this discount is not being generated by illiquidity, majority ownership by a hedge fund, lack of research coverage or bankruptcy stigma, it is likely caused by uncertainty regarding the consumer battery business. This sub-segment, which accounts for roughly a quarter of Spectrum’s total revenues, is the only category in which the company operates that is likely to experience secular headwinds for the foreseeable future. The overall consumer battery market is stagnant to slowly declining due to an increase in the proportion of consumer devices not powered by batteries to those that are. While it is difficult to determine the degree of sales decline attributable to recent recessionary consumer spending levels and that attributable to the battery-powered device population downtrend (in order to delineate the trend rate of decline), the management at competitor company Energizer Holdings (ENR) has noted the number of devices that use consumer batteries began to stabilize in early 2010 and slightly grow off recession lows experienced in 2009. Spectrum gained significant share of the U.S. consumer battery market during the recession, capturing a 15.6% share in 2010 compared to 10.8% in 2007. The gain was a result of the company’s key relationship with Walmart, where BMO Capital Markets analyst Connie Maneaty suggests Rayovac is a category
SPB Sales by Segment
Sales % Total Sales % Total Sales % Total
Global Batteries and Personal Care 1,494 62% 1,335 44% 1,417 45%
Global Pet Supplies 599 25% 574 19% 575 18%
Home and Garden Business 334 14% 322 11% 340 11%
Small Appliances NA NA 771 26% 786 25%
Total 2,427 100% 3,002 100% 3,118 100%
Note: Russell Hobbs sales included at beginning of FY2009
Year Ended 9/30
2008 2009 LTM
GB&PC Sales by Segment
Sales % Total Sales % Total Sales % Total
Consumer Batteries (Rayovac & VARTA) 916 61% 819 61% 857 60%
Portable lighting products (Rayovac) 100 7% 80 6% 85 6%
Electric shaving and grooming products (Remington) 247 17% 225 17% 257 18%
Electric personal care products (Remington) 231 15% 211 16% 221 16%
Total 1,494 100% 1,335 100% 1,420 100%
Year Ended 9/30
2008 2009 LTM
7
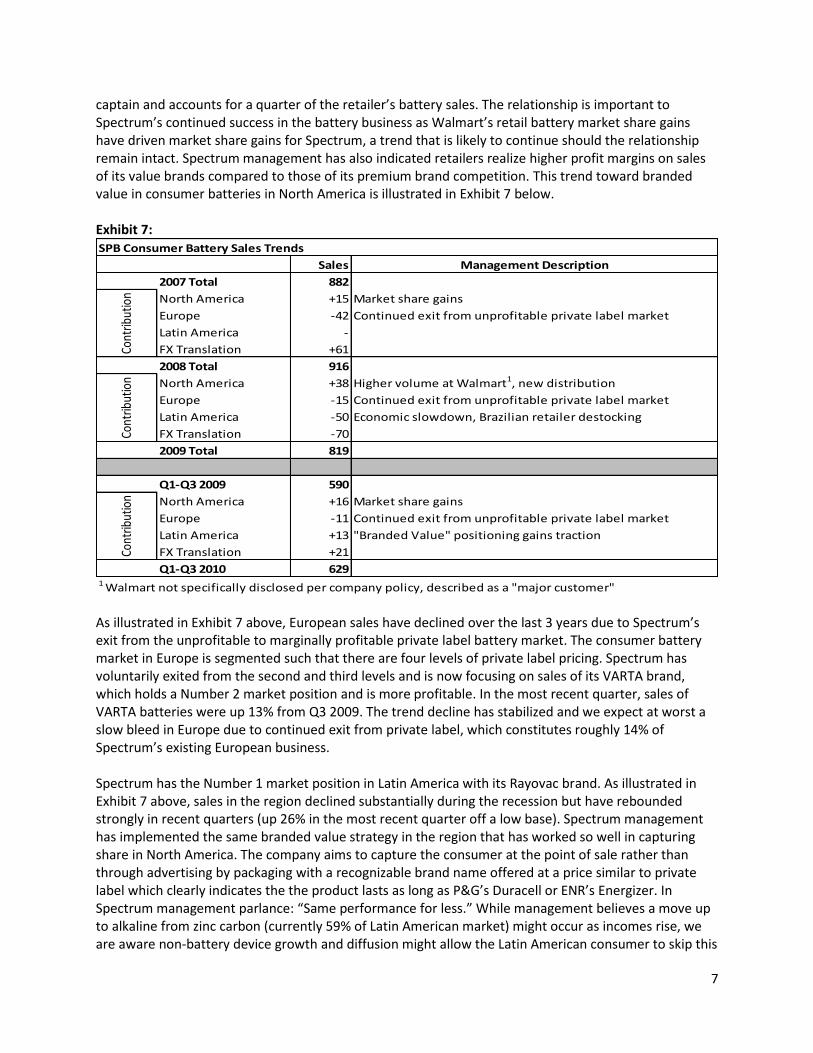
captain and accounts for a quarter of the retailer’s battery sales. The relationship is important to Spectrum’s continued success in the battery business as Walmart’s retail battery market share gains have driven market share gains for Spectrum, a trend that is likely to continue should the relationship remain intact. Spectrum management has also indicated retailers realize higher profit margins on sales of its value brands compared to those of its premium brand competition. This trend toward branded value in consumer batteries in North America is illustrated in Exhibit 7 below. Exhibit 7:
As illustrated in Exhibit 7 above, European sales have declined over the last 3 years due to Spectrum’s exit from the unprofitable to marginally profitable private label battery market. The consumer battery market in Europe is segmented such that there are four levels of private label pricing. Spectrum has voluntarily exited from the second and third levels and is now focusing on sales of its VARTA brand, which holds a Number 2 market position and is more profitable. In the most recent quarter, sales of VARTA batteries were up 13% from Q3 2009. The trend decline has stabilized and we expect at worst a slow bleed in Europe due to continued exit from private label, which constitutes roughly 14% of Spectrum’s existing European business. Spectrum has the Number 1 market position in Latin America with its Rayovac brand. As illustrated in Exhibit 7 above, sales in the region declined substantially during the recession but have rebounded strongly in recent quarters (up 26% in the most recent quarter off a low base). Spectrum management has implemented the same branded value strategy in the region that has worked so well in capturing share in North America. The company aims to capture the consumer at the point of sale rather than through advertising by packaging with a recognizable brand name offered at a price similar to private label which clearly indicates the the product lasts as long as P&G’s Duracell or ENR’s Energizer. In Spectrum management parlance: “Same performance for less.” While management believes a move up to alkaline from zinc carbon (currently 59% of Latin American market) might occur as incomes rise, we are aware non-battery device growth and diffusion might allow the Latin American consumer to skip this
SPB Consumer Battery Sales Trends
Sales Management Description
2007 Total 882
North America +15 Market share gains
Europe -42 Continued exit from unprofitable private label market
Latin America -
FX Translation +61
2008 Total 916
North America +38 Higher volume at Walmart1, new distribution
Europe -15 Continued exit from unprofitable private label market
Latin America -50 Economic slowdown, Brazilian retailer destocking
FX Translation -70
2009 Total 819
Q1-Q3 2009 590
North America +16 Market share gains
Europe -11 Continued exit from unprofitable private label market
Latin America +13 "Branded Value" positioning gains traction
FX Translation +21
Q1-Q3 2010 6291 Walmart not specifically disclosed per company policy, described as a "major customer"
Cont
ribut
ion
Cont
ribut
ion
Cont
ribut
ion
8
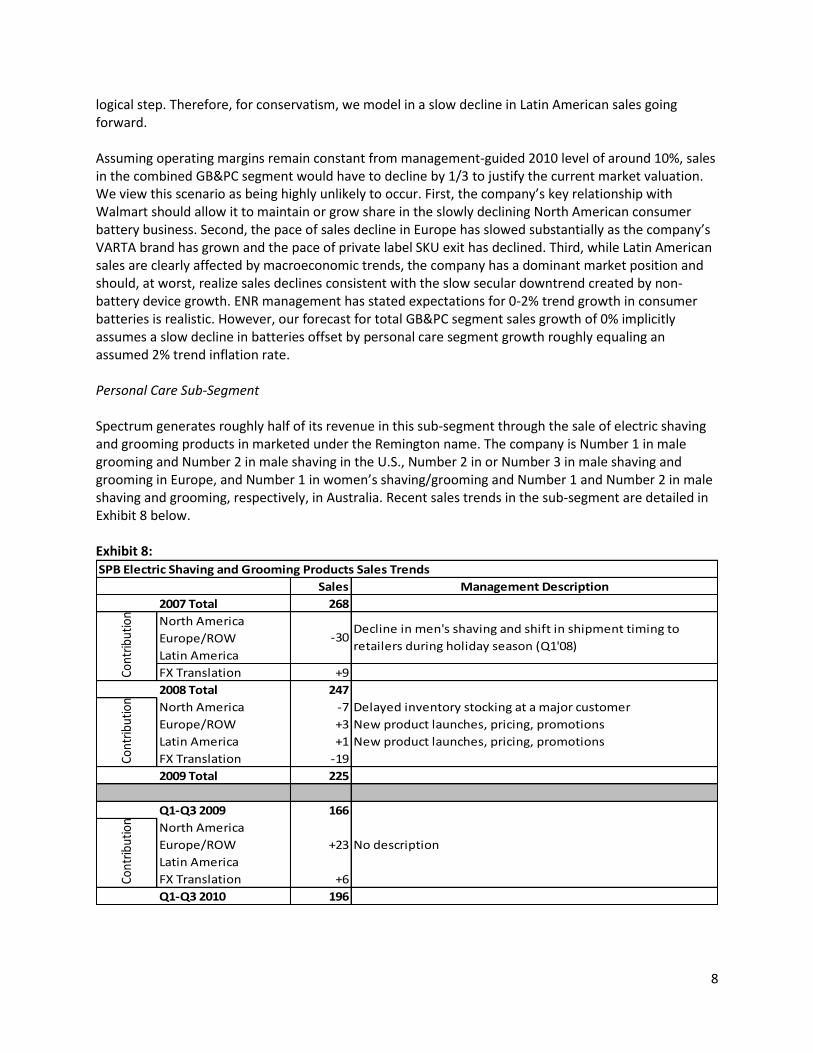
logical step. Therefore, for conservatism, we model in a slow decline in Latin American sales going forward. Assuming operating margins remain constant from management-guided 2010 level of around 10%, sales in the combined GB&PC segment would have to decline by 1/3 to justify the current market valuation. We view this scenario as being highly unlikely to occur. First, the company’s key relationship with Walmart should allow it to maintain or grow share in the slowly declining North American consumer battery business. Second, the pace of sales decline in Europe has slowed substantially as the company’s VARTA brand has grown and the pace of private label SKU exit has declined. Third, while Latin American sales are clearly affected by macroeconomic trends, the company has a dominant market position and should, at worst, realize sales declines consistent with the slow secular downtrend created by non-battery device growth. ENR management has stated expectations for 0-2% trend growth in consumer batteries is realistic. However, our forecast for total GB&PC segment sales growth of 0% implicitly assumes a slow decline in batteries offset by personal care segment growth roughly equaling an assumed 2% trend inflation rate. Personal Care Sub-Segment Spectrum generates roughly half of its revenue in this sub-segment through the sale of electric shaving and grooming products in marketed under the Remington name. The company is Number 1 in male grooming and Number 2 in male shaving in the U.S., Number 2 in or Number 3 in male shaving and grooming in Europe, and Number 1 in women’s shaving/grooming and Number 1 and Number 2 in male shaving and grooming, respectively, in Australia. Recent sales trends in the sub-segment are detailed in Exhibit 8 below. Exhibit 8:
SPB Electric Shaving and Grooming Products Sales Trends
Sales Management Description
2007 Total 268
North America
Europe/ROW
Latin America
FX Translation +9
2008 Total 247
North America -7 Delayed inventory stocking at a major customer
Europe/ROW +3 New product launches, pricing, promotions
Latin America +1 New product launches, pricing, promotions
FX Translation -19
2009 Total 225
Q1-Q3 2009 166
North America
Europe/ROW +23 No description
Latin America
FX Translation +6
Q1-Q3 2010 196
-30
Cont
ribut
ion
Cont
ribut
ion
Decline in men's shaving and shift in shipment timing to
retailers during holiday season (Q1'08)
Cont
ribut
ion
9
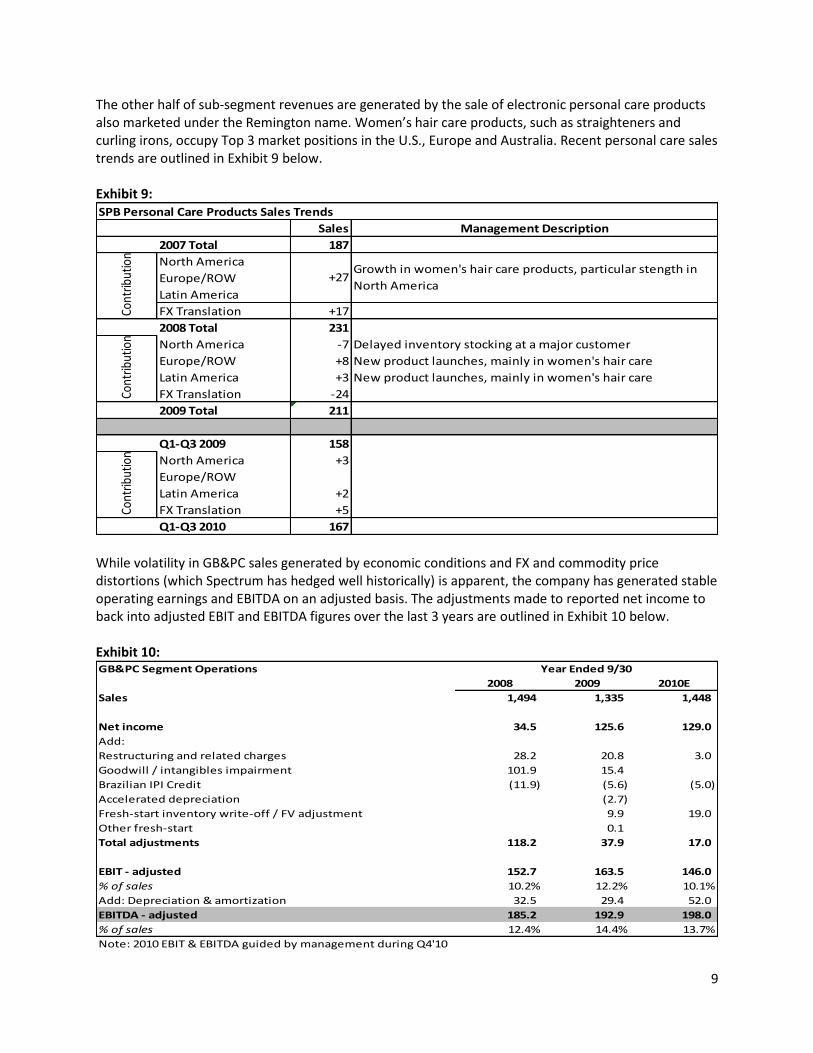
The other half of sub-segment revenues are generated by the sale of electronic personal care products also marketed under the Remington name. Women’s hair care products, such as straighteners and curling irons, occupy Top 3 market positions in the U.S., Europe and Australia. Recent personal care sales trends are outlined in Exhibit 9 below. Exhibit 9:
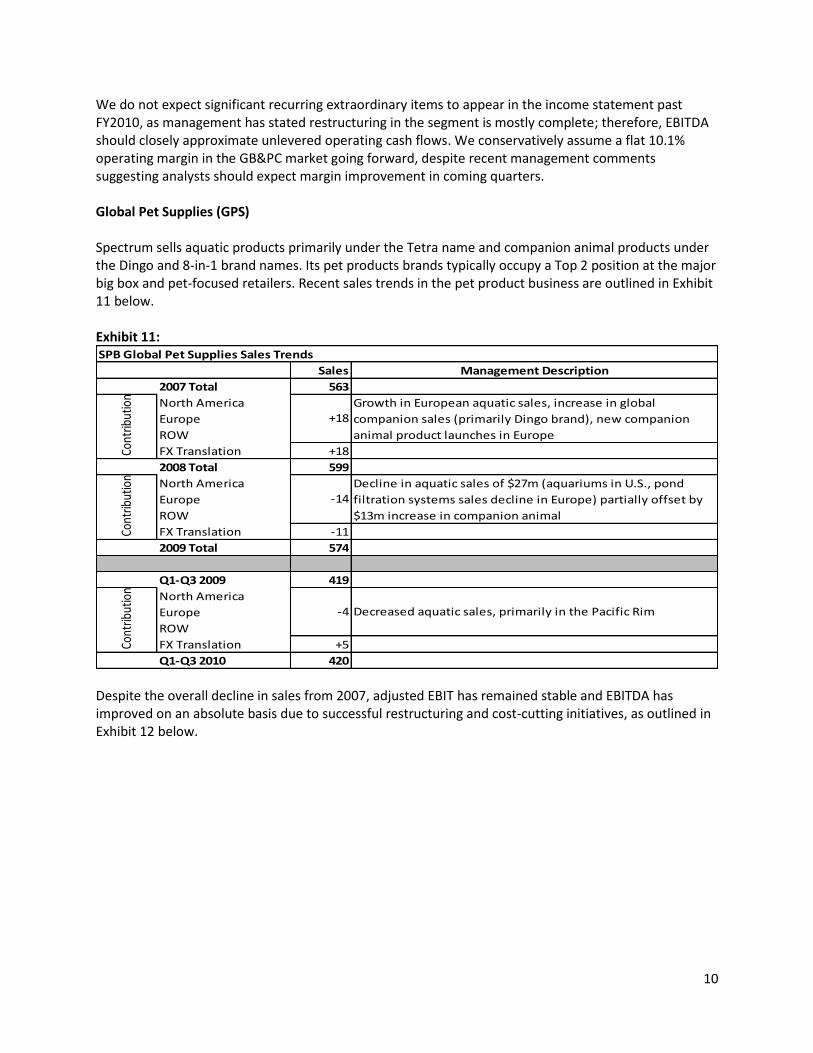
While volatility in GB&PC sales generated by economic conditions and FX and commodity price distortions (which Spectrum has hedged well historically) is apparent, the company has generated stable operating earnings and EBITDA on an adjusted basis. The adjustments made to reported net income to back into adjusted EBIT and EBITDA figures over the last 3 years are outlined in Exhibit 10 below. Exhibit 10:
SPB Personal Care Products Sales Trends
Sales Management Description
2007 Total 187
North America
Europe/ROW
Latin America
FX Translation +17
2008 Total 231
North America -7 Delayed inventory stocking at a major customer
Europe/ROW +8 New product launches, mainly in women's hair care
Latin America +3 New product launches, mainly in women's hair care
FX Translation -24
2009 Total 211
Q1-Q3 2009 158
North America +3
Europe/ROW
Latin America +2
FX Translation +5
Q1-Q3 2010 167
Cont
ribut
ion
Cont
ribut
ion
+27Growth in women's hair care products, particular stength in
North America
Cont
ribut
ion
GB&PC Segment Operations
2008 2009 2010E
Sales 1,494 1,335 1,448
Net income 34.5 125.6 129.0
Add:
Restructuring and related charges 28.2 20.8 3.0
Goodwill / intangibles impairment 101.9 15.4
Brazilian IPI Credit (11.9) (5.6) (5.0)
Accelerated depreciation (2.7)
Fresh-start inventory write-off / FV adjustment 9.9 19.0
Other fresh-start 0.1
Total adjustments 118.2 37.9 17.0
EBIT - adjusted 152.7 163.5 146.0
% of sales 10.2% 12.2% 10.1%
Add: Depreciation & amortization 32.5 29.4 52.0
EBITDA - adjusted 185.2 192.9 198.0
% of sales 12.4% 14.4% 13.7%
Note: 2010 EBIT & EBITDA guided by management during Q4'10
Year Ended 9/30
10
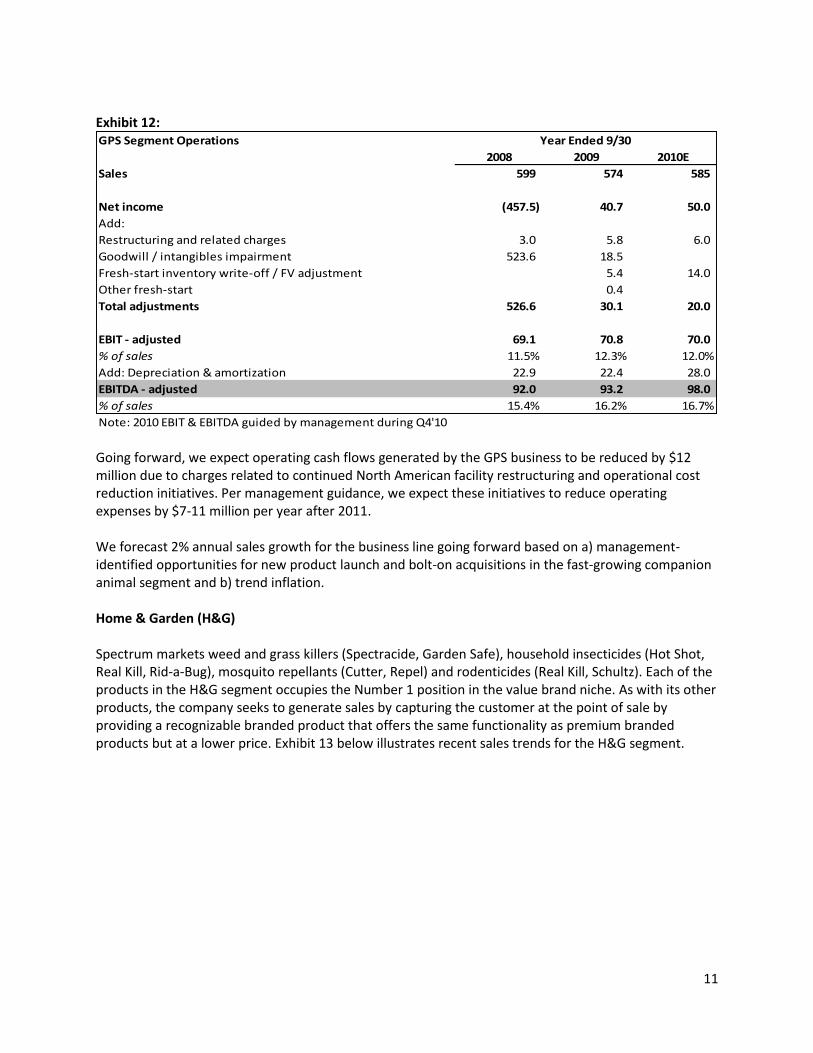
We do not expect significant recurring extraordinary items to appear in the income statement past FY2010, as management has stated restructuring in the segment is mostly complete; therefore, EBITDA should closely approximate unlevered operating cash flows. We conservatively assume a flat 10.1% operating margin in the GB&PC market going forward, despite recent management comments suggesting analysts should expect margin improvement in coming quarters. Global Pet Supplies (GPS) Spectrum sells aquatic products primarily under the Tetra name and companion animal products under the Dingo and 8-in-1 brand names. Its pet products brands typically occupy a Top 2 position at the major big box and pet-focused retailers. Recent sales trends in the pet product business are outlined in Exhibit 11 below. Exhibit 11:
Despite the overall decline in sales from 2007, adjusted EBIT has remained stable and EBITDA has improved on an absolute basis due to successful restructuring and cost-cutting initiatives, as outlined in Exhibit 12 below.
SPB Global Pet Supplies Sales Trends
Sales Management Description
2007 Total 563
North America
Europe
ROW
FX Translation +18
2008 Total 599
North America
Europe
ROW
FX Translation -11
2009 Total 574
Q1-Q3 2009 419
North America
Europe
ROW
FX Translation +5
Q1-Q3 2010 420
Cont
ribut
ion
Cont
ribut
ion
Cont
ribut
ion
+18
Growth in European aquatic sales, increase in global
companion sales (primarily Dingo brand), new companion
animal product launches in Europe
-14
Decline in aquatic sales of $27m (aquariums in U.S., pond
filtration systems sales decline in Europe) partially offset by
$13m increase in companion animal
-4 Decreased aquatic sales, primarily in the Pacific Rim
11
Exhibit 12:
Going forward, we expect operating cash flows generated by the GPS business to be reduced by $12 million due to charges related to continued North American facility restructuring and operational cost reduction initiatives. Per management guidance, we expect these initiatives to reduce operating expenses by $7-11 million per year after 2011. We forecast 2% annual sales growth for the business line going forward based on a) management-identified opportunities for new product launch and bolt-on acquisitions in the fast-growing companion animal segment and b) trend inflation. Home & Garden (H&G) Spectrum markets weed and grass killers (Spectracide, Garden Safe), household insecticides (Hot Shot, Real Kill, Rid-a-Bug), mosquito repellants (Cutter, Repel) and rodenticides (Real Kill, Schultz). Each of the products in the H&G segment occupies the Number 1 position in the value brand niche. As with its other products, the company seeks to generate sales by capturing the customer at the point of sale by providing a recognizable branded product that offers the same functionality as premium branded products but at a lower price. Exhibit 13 below illustrates recent sales trends for the H&G segment.
GPS Segment Operations
2008 2009 2010E
Sales 599 574 585
Net income (457.5) 40.7 50.0
Add:
Restructuring and related charges 3.0 5.8 6.0
Goodwill / intangibles impairment 523.6 18.5
Fresh-start inventory write-off / FV adjustment 5.4 14.0
Other fresh-start 0.4
Total adjustments 526.6 30.1 20.0
EBIT - adjusted 69.1 70.8 70.0
% of sales 11.5% 12.3% 12.0%
Add: Depreciation & amortization 22.9 22.4 28.0
EBITDA - adjusted 92.0 93.2 98.0
% of sales 15.4% 16.2% 16.7%
Note: 2010 EBIT & EBITDA guided by management during Q4'10
Year Ended 9/30
12
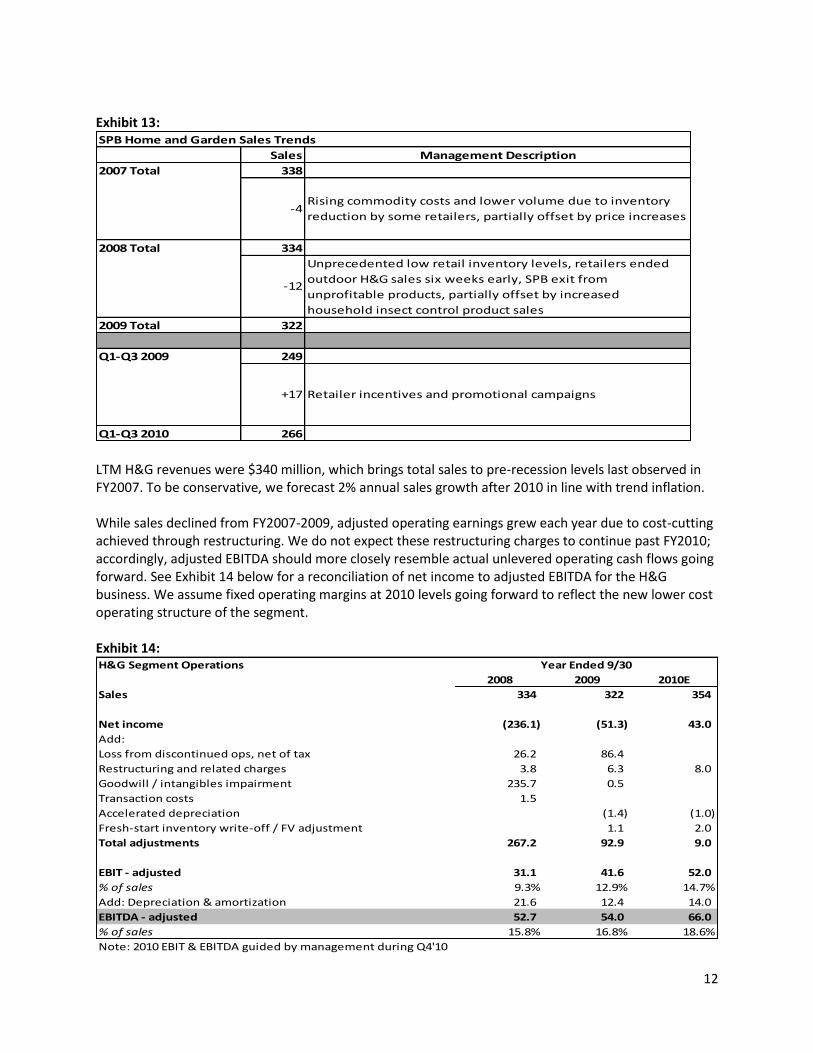
Exhibit 13:
LTM H&G revenues were $340 million, which brings total sales to pre-recession levels last observed in FY2007. To be conservative, we forecast 2% annual sales growth after 2010 in line with trend inflation. While sales declined from FY2007-2009, adjusted operating earnings grew each year due to cost-cutting achieved through restructuring. We do not expect these restructuring charges to continue past FY2010; accordingly, adjusted EBITDA should more closely resemble actual unlevered operating cash flows going forward. See Exhibit 14 below for a reconciliation of net income to adjusted EBITDA for the H&G business. We assume fixed operating margins at 2010 levels going forward to reflect the new lower cost operating structure of the segment. Exhibit 14:
SPB Home and Garden Sales Trends
Sales Management Description
2007 Total 338
2008 Total 334
2009 Total 322
Q1-Q3 2009 249
Q1-Q3 2010 266
Rising commodity costs and lower volume due to inventory
reduction by some retailers, partially offset by price increases
Unprecedented low retail inventory levels, retailers ended
outdoor H&G sales six weeks early, SPB exit from
unprofitable products, partially offset by increased
household insect control product sales
Retailer incentives and promotional campaigns
-4
-12
+17
H&G Segment Operations
2008 2009 2010E
Sales 334 322 354
Net income (236.1) (51.3) 43.0
Add:
Loss from discontinued ops, net of tax 26.2 86.4
Restructuring and related charges 3.8 6.3 8.0
Goodwill / intangibles impairment 235.7 0.5
Transaction costs 1.5
Accelerated depreciation (1.4) (1.0)
Fresh-start inventory write-off / FV adjustment 1.1 2.0
Total adjustments 267.2 92.9 9.0
EBIT - adjusted 31.1 41.6 52.0
% of sales 9.3% 12.9% 14.7%
Add: Depreciation & amortization 21.6 12.4 14.0
EBITDA - adjusted 52.7 54.0 66.0
% of sales 15.8% 16.8% 18.6%
Note: 2010 EBIT & EBITDA guided by management during Q4'10
Year Ended 9/30
13
Small Appliances (SA) The legacy Russell Hobbs business primarily sells small household appliances under the Black & Decker Home, Russell Hobbs, Toastmaster, Farberware, George Foreman, Juiceman and Breadman names in the Americas and Europe. SA products hold Top 2 U.S. market positions in coffee makers, toasters, food processors, toaster ovens, electric grills, griddles, bread makers and irons. Over 50% of SA sales are Black and Decker Home branded products. Spectrum licenses the Black and Decker name and management indicates it maintains a strong relationship with the licensor. Sales in FY2009 were roughly $775 million, while LTM sales were roughly $790 million. We conservatively forecast 2% annual sales growth in line with trend inflation given stable global demand for the segment’s diversified portfolio of small appliances. The SA segment has eliminated 80 underperforming brands and more than 1,000 SKUs since 2007. In so doing, sales declined significantly but adjusted EBITDA has steadily increased from $38 million in 2007 to an expected figure of $84-86 million in FY2010. The segment achieved improved profitability through said SKU reduction and improvements in working capital management. Spectrum management has indicated it expects to achieve $25-30 million in synergies related to the acquisition through IT, back office, warehouse and supply chain consolidation occurring through FY2011. We conservatively haircut the synergy forecast to roughly $15 million and hold operating margins fixed past FY2011.
14
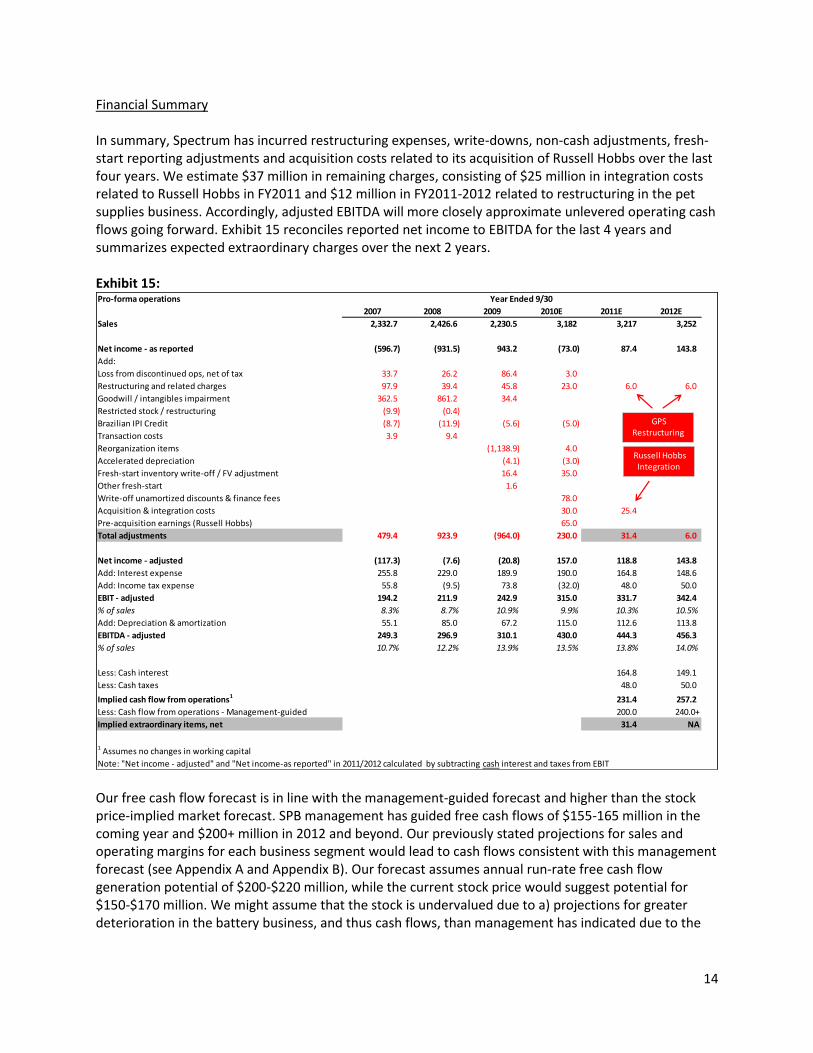
Financial Summary In summary, Spectrum has incurred restructuring expenses, write-downs, non-cash adjustments, fresh-start reporting adjustments and acquisition costs related to its acquisition of Russell Hobbs over the last four years. We estimate $37 million in remaining charges, consisting of $25 million in integration costs related to Russell Hobbs in FY2011 and $12 million in FY2011-2012 related to restructuring in the pet supplies business. Accordingly, adjusted EBITDA will more closely approximate unlevered operating cash flows going forward. Exhibit 15 reconciles reported net income to EBITDA for the last 4 years and summarizes expected extraordinary charges over the next 2 years. Exhibit 15:
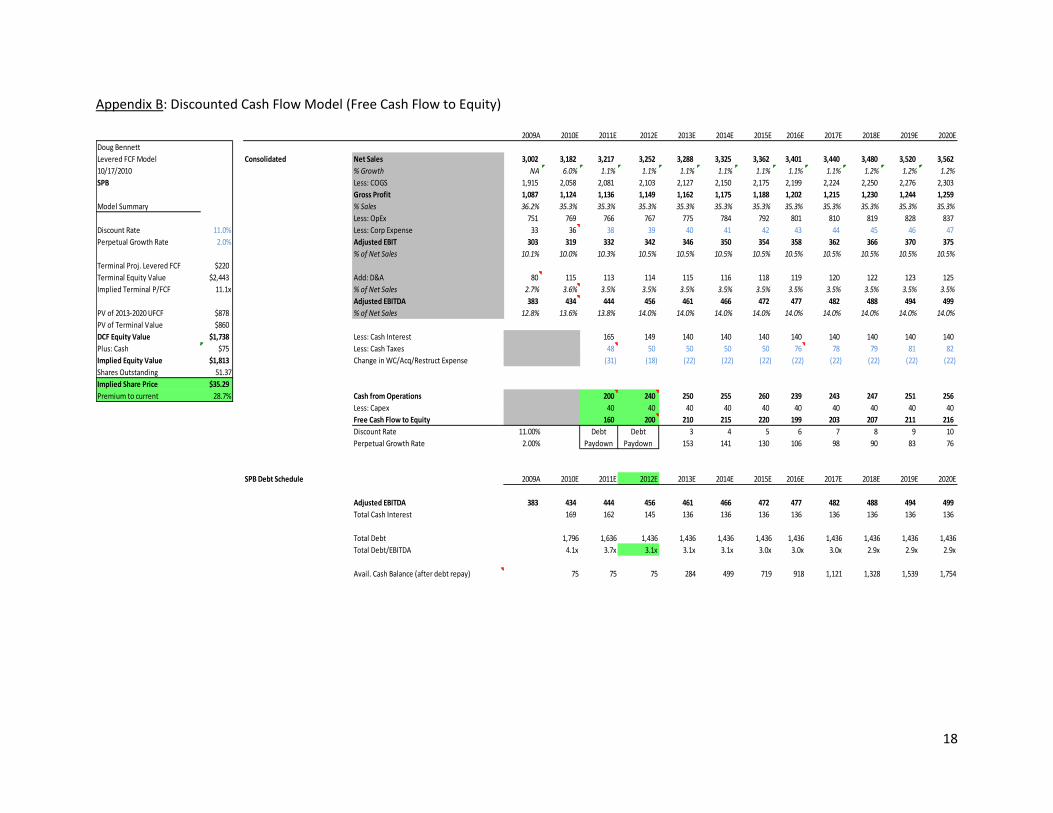
Our free cash flow forecast is in line with the management-guided forecast and higher than the stock price-implied market forecast. SPB management has guided free cash flows of $155-165 million in the coming year and $200+ million in 2012 and beyond. Our previously stated projections for sales and operating margins for each business segment would lead to cash flows consistent with this management forecast (see Appendix A and Appendix B). Our forecast assumes annual run-rate free cash flow generation potential of $200-$220 million, while the current stock price would suggest potential for $150-$170 million. We might assume that the stock is undervalued due to a) projections for greater deterioration in the battery business, and thus cash flows, than management has indicated due to the
Pro-forma operations
2007 2008 2009 2010E 2011E 2012E
Sales 2,332.7 2,426.6 2,230.5 3,182 3,217 3,252
Net income - as reported (596.7) (931.5) 943.2 (73.0) 87.4 143.8
Add:
Loss from discontinued ops, net of tax 33.7 26.2 86.4 3.0
Restructuring and related charges 97.9 39.4 45.8 23.0 6.0 6.0
Goodwill / intangibles impairment 362.5 861.2 34.4
Restricted stock / restructuring (9.9) (0.4)
Brazilian IPI Credit (8.7) (11.9) (5.6) (5.0)
Transaction costs 3.9 9.4
Reorganization items (1,138.9) 4.0
Accelerated depreciation (4.1) (3.0)
Fresh-start inventory write-off / FV adjustment 16.4 35.0
Other fresh-start 1.6
Write-off unamortized discounts & finance fees 78.0
Acquisition & integration costs 30.0 25.4
Pre-acquisition earnings (Russell Hobbs) 65.0
Total adjustments 479.4 923.9 (964.0) 230.0 31.4 6.0
Net income - adjusted (117.3) (7.6) (20.8) 157.0 118.8 143.8
Add: Interest expense 255.8 229.0 189.9 190.0 164.8 148.6
Add: Income tax expense 55.8 (9.5) 73.8 (32.0) 48.0 50.0
EBIT - adjusted 194.2 211.9 242.9 315.0 331.7 342.4
% of sales 8.3% 8.7% 10.9% 9.9% 10.3% 10.5%
Add: Depreciation & amortization 55.1 85.0 67.2 115.0 112.6 113.8
EBITDA - adjusted 249.3 296.9 310.1 430.0 444.3 456.3
% of sales 10.7% 12.2% 13.9% 13.5% 13.8% 14.0%
Less: Cash interest 164.8 149.1
Less: Cash taxes 48.0 50.0
Implied cash flow from operations1 231.4 257.2
Less: Cash flow from operations - Management-guided 200.0 240.0+
Implied extraordinary items, net 31.4 NA
1 Assumes no changes in working capital
Note: "Net income - adjusted" and "Net income-as reported" in 2011/2012 calculated by subtracting cash interest and taxes from EBIT
Year Ended 9/30
GPS Restructuring
Russell Hobbs Integration
15
long-term secular headwinds facing the business or b) existence of a discount related to bankruptcy stigma, concentrated ownership by Harbinger and/or illiquidity. Four members of management recently purchased 2,000 shares each at prices ranging from $23.28-26.34 (~$50k each). It’s been said insiders sell for many reasons but only buy for one: they believe the stock is undervalued. This holds in most cases, though one can imagine a scenario in which the four managers are making nominal investments in the stock relative to their cash compensation or net worth, not on the investment’s merits but in a symbolic gesture conveying confidence or so they might cite the action to critics. So, under this conservative assumption, one can arguably discount the recent management purchases. However, we do not discount continued open market purchases by Harbinger Capital near current levels. An investor in Spectrum common might assume management’s free cash flow projections are credible in part because its majority owner, with inside knowledge of the company, is signaling that it does too through continued purchases into a large illiquid position. Considering this behavioral tell and the conservatism we employed when forecasting segment sales and profitability, we are confident in management’s free cash flow forecast. We assume the stock is undervalued because of the existence of an illiquidity/bankruptcy stigma discount, which we believe will disappear within 2-3 years. Valuation Spectrum stock is illiquid due to concentrated ownership by Harbinger Capital (67%), Avenue Capital (13%) and D.E. Shaw (7%). Roughly $1.3 million worth of shares trade hands daily, which has reduced the incentive for analysts to cover the stock. Only three equity analysts and one credit analyst (all from small shops) cover it, which, combined with Spectrum’s recent bankruptcy and continued losses, has likely further reduced institutional interest in the name. Despite the illiquidity, Harbinger Capital bought another 2% of SPB in the open market from June 23 to
August 31 at prices ranging from $25-$30 per share. A fund owning 65% of a company’s shares would
unlikely add to an already illiquid position in the open market unless they believed the shares were
undervalued (based on inside knowledge of the company) and would reach fair value within a
reasonable time frame. Harbinger cannot sell into the open market; they have to believe the illiquidity
discount priced into the shares will disappear at some point through a sale of the company or are
content with the dividend yield SPB can generate in two years once debt is paid down to 3.0x EBITDA (a
15% dividend yield under conservative assumptions). Either option would move the share price to fair
value.
Considering the need for exits within reasonable time frames for funds like Harbinger, Avenue and D.E.
Shaw, one might assume the cost-cutting, SKU rationalization and debt reduction to align with peer
group is being done to make the company more marketable to a potential acquirer – i.e. Spectrum as a
stable, cash flow generating, “branded value” pure play. In this case, an investor should look at
EV/EBITDA multiples to get an idea what the company might fetch in a sale.
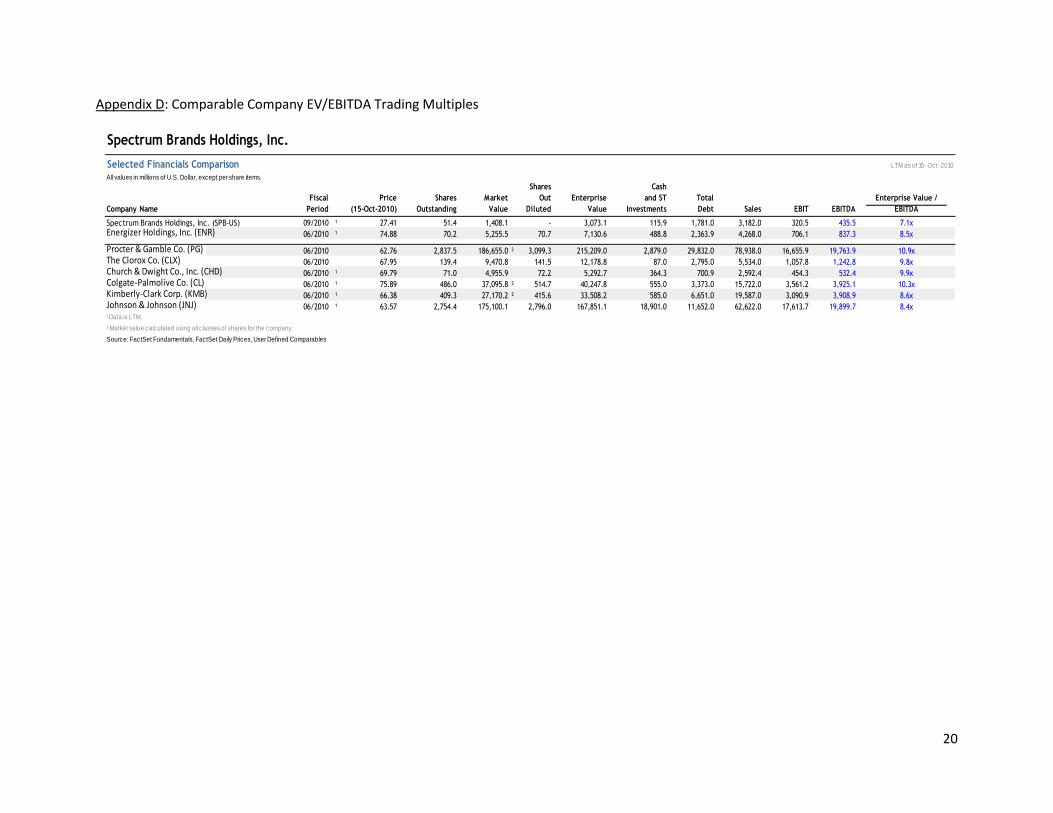
Spectrum’s closest comparable company is Energizer Holdings (ENR), a consumer battery and personal
care branded products company which also sells through the big-box retail channel. ENR carries debt at
2.8x EBITDA and has recently traded in a range of 8.0-8.5x EV/EBITDA (see Appendix D). As illustrated in
16
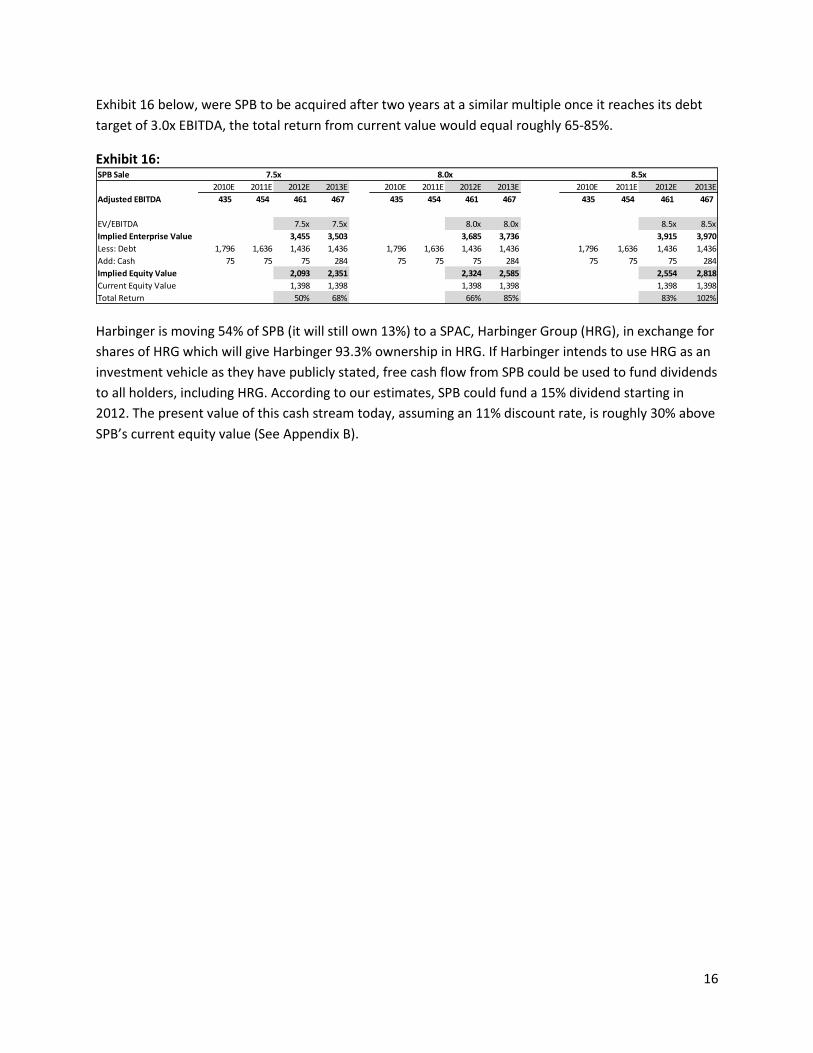
Exhibit 16 below, were SPB to be acquired after two years at a similar multiple once it reaches its debt
target of 3.0x EBITDA, the total return from current value would equal roughly 65-85%.
Exhibit 16:
Harbinger is moving 54% of SPB (it will still own 13%) to a SPAC, Harbinger Group (HRG), in exchange for
shares of HRG which will give Harbinger 93.3% ownership in HRG. If Harbinger intends to use HRG as an
investment vehicle as they have publicly stated, free cash flow from SPB could be used to fund dividends
to all holders, including HRG. According to our estimates, SPB could fund a 15% dividend starting in
2012. The present value of this cash stream today, assuming an 11% discount rate, is roughly 30% above
SPB’s current equity value (See Appendix B).
SPB Sale
2010E 2011E 2012E 2013E 2010E 2011E 2012E 2013E 2010E 2011E 2012E 2013E
Adjusted EBITDA 435 454 461 467 435 454 461 467 435 454 461 467
EV/EBITDA 7.5x 7.5x 8.0x 8.0x 8.5x 8.5x
Implied Enterprise Value 3,455 3,503 3,685 3,736 3,915 3,970
Less: Debt 1,796 1,636 1,436 1,436 1,796 1,636 1,436 1,436 1,796 1,636 1,436 1,436
Add: Cash 75 75 75 284 75 75 75 284 75 75 75 284
Implied Equity Value 2,093 2,351 2,324 2,585 2,554 2,818
Current Equity Value 1,398 1,398 1,398 1,398 1,398 1,398
Total Return 50% 68% 66% 85% 83% 102%
7.5x 8.0x 8.5x
17
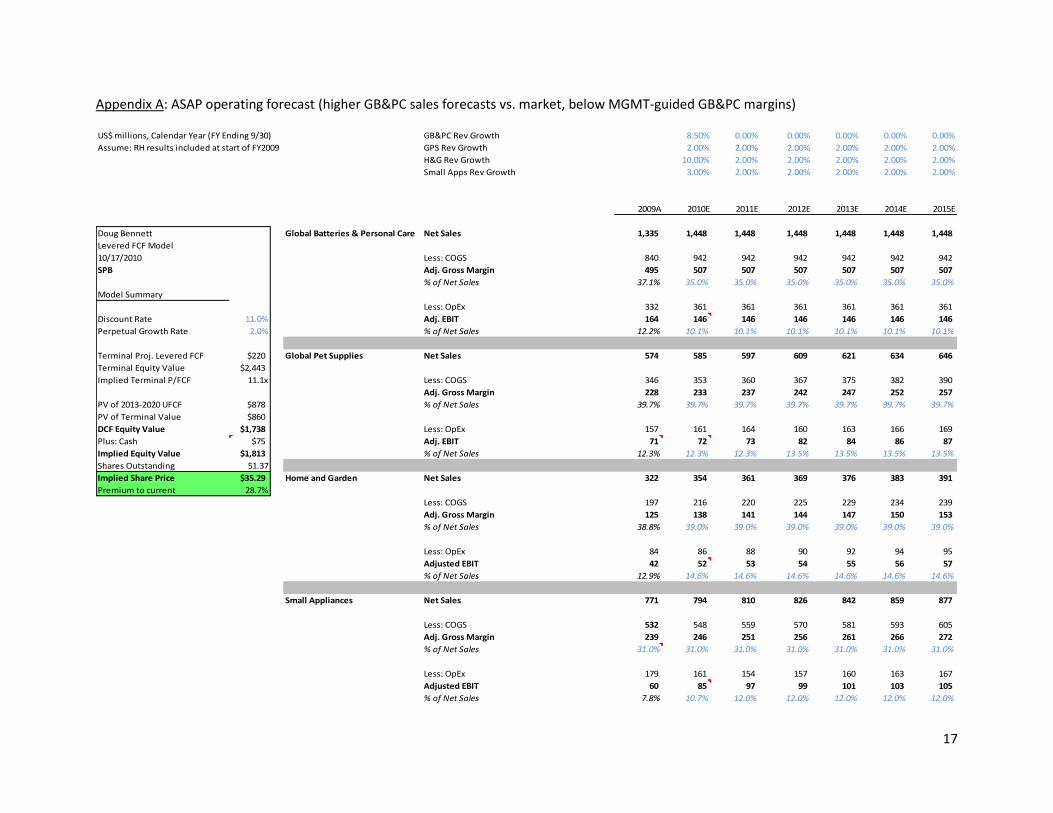
Appendix A: ASAP operating forecast (higher GB&PC sales forecasts vs. market, below MGMT-guided GB&PC margins)
US$ millions, Calendar Year (FY Ending 9/30) GB&PC Rev Growth 8.50% 0.00% 0.00% 0.00% 0.00% 0.00%
Assume: RH results included at start of FY2009 GPS Rev Growth 2.00% 2.00% 2.00% 2.00% 2.00% 2.00%
H&G Rev Growth 10.00% 2.00% 2.00% 2.00% 2.00% 2.00%
Small Apps Rev Growth 3.00% 2.00% 2.00% 2.00% 2.00% 2.00%
2009A 2010E 2011E 2012E 2013E 2014E 2015E
Doug Bennett Global Batteries & Personal Care Net Sales 1,335 1,448 1,448 1,448 1,448 1,448 1,448
Levered FCF Model
10/17/2010 Less: COGS 840 942 942 942 942 942 942
SPB Adj. Gross Margin 495 507 507 507 507 507 507
% of Net Sales 37.1% 35.0% 35.0% 35.0% 35.0% 35.0% 35.0%
Model Summary
Less: OpEx 332 361 361 361 361 361 361
Discount Rate 11.0% Adj. EBIT 164 146 146 146 146 146 146
Perpetual Growth Rate 2.0% % of Net Sales 12.2% 10.1% 10.1% 10.1% 10.1% 10.1% 10.1%
Terminal Proj. Levered FCF $220 Global Pet Supplies Net Sales 574 585 597 609 621 634 646
Terminal Equity Value $2,443
Implied Terminal P/FCF 11.1x Less: COGS 346 353 360 367 375 382 390
Adj. Gross Margin 228 233 237 242 247 252 257
PV of 2013-2020 UFCF $878 % of Net Sales 39.7% 39.7% 39.7% 39.7% 39.7% 39.7% 39.7%
PV of Terminal Value $860
DCF Equity Value $1,738 Less: OpEx 157 161 164 160 163 166 169
Plus: Cash $75 Adj. EBIT 71 72 73 82 84 86 87
Implied Equity Value $1,813 % of Net Sales 12.3% 12.3% 12.3% 13.5% 13.5% 13.5% 13.5%
Shares Outstanding 51.37
Implied Share Price $35.29 Home and Garden Net Sales 322 354 361 369 376 383 391
Premium to current 28.7%
Less: COGS 197 216 220 225 229 234 239
Adj. Gross Margin 125 138 141 144 147 150 153
% of Net Sales 38.8% 39.0% 39.0% 39.0% 39.0% 39.0% 39.0%
Less: OpEx 84 86 88 90 92 94 95
Adjusted EBIT 42 52 53 54 55 56 57
% of Net Sales 12.9% 14.6% 14.6% 14.6% 14.6% 14.6% 14.6%
Small Appliances Net Sales 771 794 810 826 842 859 877
Less: COGS 532 548 559 570 581 593 605
Adj. Gross Margin 239 246 251 256 261 266 272
% of Net Sales 31.0% 31.0% 31.0% 31.0% 31.0% 31.0% 31.0%
Less: OpEx 179 161 154 157 160 163 167
Adjusted EBIT 60 85 97 99 101 103 105
% of Net Sales 7.8% 10.7% 12.0% 12.0% 12.0% 12.0% 12.0%
18
Appendix B: Discounted Cash Flow Model (Free Cash Flow to Equity)
2009A 2010E 2011E 2012E 2013E 2014E 2015E 2016E 2017E 2018E 2019E 2020E
Doug Bennett
Levered FCF Model Consolidated Net Sales 3,002 3,182 3,217 3,252 3,288 3,325 3,362 3,401 3,440 3,480 3,520 3,562
10/17/2010 % Growth NA 6.0% 1.1% 1.1% 1.1% 1.1% 1.1% 1.1% 1.1% 1.2% 1.2% 1.2%
SPB Less: COGS 1,915 2,058 2,081 2,103 2,127 2,150 2,175 2,199 2,224 2,250 2,276 2,303
Gross Profit 1,087 1,124 1,136 1,149 1,162 1,175 1,188 1,202 1,215 1,230 1,244 1,259
Model Summary % Sales 36.2% 35.3% 35.3% 35.3% 35.3% 35.3% 35.3% 35.3% 35.3% 35.3% 35.3% 35.3%
Less: OpEx 751 769 766 767 775 784 792 801 810 819 828 837
Discount Rate 11.0% Less: Corp Expense 33 36 38 39 40 41 42 43 44 45 46 47
Perpetual Growth Rate 2.0% Adjusted EBIT 303 319 332 342 346 350 354 358 362 366 370 375
% of Net Sales 10.1% 10.0% 10.3% 10.5% 10.5% 10.5% 10.5% 10.5% 10.5% 10.5% 10.5% 10.5%
Terminal Proj. Levered FCF $220
Terminal Equity Value $2,443 Add: D&A 80 115 113 114 115 116 118 119 120 122 123 125
Implied Terminal P/FCF 11.1x % of Net Sales 2.7% 3.6% 3.5% 3.5% 3.5% 3.5% 3.5% 3.5% 3.5% 3.5% 3.5% 3.5%
Adjusted EBITDA 383 434 444 456 461 466 472 477 482 488 494 499
PV of 2013-2020 UFCF $878 % of Net Sales 12.8% 13.6% 13.8% 14.0% 14.0% 14.0% 14.0% 14.0% 14.0% 14.0% 14.0% 14.0%
PV of Terminal Value $860
DCF Equity Value $1,738 Less: Cash Interest 165 149 140 140 140 140 140 140 140 140
Plus: Cash $75 Less: Cash Taxes 48 50 50 50 50 76 78 79 81 82
Implied Equity Value $1,813 Change in WC/Acq/Restruct Expense (31) (18) (22) (22) (22) (22) (22) (22) (22) (22)
Shares Outstanding 51.37
Implied Share Price $35.29
Premium to current 28.7% Cash from Operations 200 240 250 255 260 239 243 247 251 256
Less: Capex 40 40 40 40 40 40 40 40 40 40
Free Cash Flow to Equity 160 200 210 215 220 199 203 207 211 216
Discount Rate 11.00% 3 4 5 6 7 8 9 10
Perpetual Growth Rate 2.00% 153 141 130 106 98 90 83 76
SPB Debt Schedule 2009A 2010E 2011E 2012E 2013E 2014E 2015E 2016E 2017E 2018E 2019E 2020E
Adjusted EBITDA 383 434 444 456 461 466 472 477 482 488 494 499
Total Cash Interest 169 162 145 136 136 136 136 136 136 136 136
Total Debt 1,796 1,636 1,436 1,436 1,436 1,436 1,436 1,436 1,436 1,436 1,436
Total Debt/EBITDA 4.1x 3.7x 3.1x 3.1x 3.1x 3.0x 3.0x 3.0x 2.9x 2.9x 2.9x
Avail. Cash Balance (after debt repay) 75 75 75 284 499 719 918 1,121 1,328 1,539 1,754
Debt
Paydown
Debt
Paydown
19
Appendix C: SPB Debt Schedule
SPB Debt Schedule 2009A 2010E 2011E 2012E 2013E 2014E 2015E 2016E 2017E 2018E 2019E 2020E
Adjusted EBITDA 383 434 444 456 461 466 472 477 482 488 494 499
Total Cash Interest 169 162 145 136 136 136 136 136 136 136 136
Total Debt 1,796 1,636 1,436 1,436 1,436 1,436 1,436 1,436 1,436 1,436 1,436
Total Debt/EBITDA 4.1x 3.7x 3.1x 3.1x 3.1x 3.0x 3.0x 3.0x 2.9x 2.9x 2.9x
Avail. Cash Balance (after debt repay) 75 75 75 284 499 719 918 1,121 1,328 1,539 1,754
Sr. Term Loan due 6/16/16
BOP Principal 9.58% 750 750 590 390 390 390 390 390 390 390 390
Issuance/(Repayment) 0 -160 -200 0 0 0 0 0 0 0 0
9.0% EOP Principal 750 590 390 390 390 390 390 390 390 390 390
9.0% Interest on term loan 68 60 44 35 35 35 35 35 35 35 35
9.5% Sr. Secured Notes due 6/15/18
BOP Principal 750 750 750 750 750 750 750 750 750 750 750
Issuance/(Repayment) 0 0 0 0 0 0 0 0 0 0 0
9.5% EOP Principal 750 750 750 750 750 750 750 750 750 750 750
9.5% Interest on notes 71 71 71 71 71 71 71 71 71 71 71
12% Sr. Secured Notes due 6/15/18
BOP Principal 245 245 245 245 245 245 245 245 245 245 245
Issuance/(Repayment) 0 0 0 0 0 0 0 0 0 0 0
12.0% EOP Principal 245 245 245 245 245 245 245 245 245 245 245
12.0% Interest on notes 29 29 29 29 29 29 29 29 29 29 29
ABL Revolver due 06/16/14
BOP Principal 0 0 0 0 0 0 0 0 0 0 0
Issuance/(Repayment) 0 0 0 0 0 0 0 0 0 0 0
6.0% EOP Principal 0 0 0 0 0 0 0 0 0 0 0
6.0% Interest on revolver 0 0 0 0 0 0 0 0 0 0 0
Other (Letters of Credit)
BOP Principal 40 40 40 40 40 40 40 40 40 40 40
Issuance/(Repayment) 0 0 0 0 0 0 0 0 0 0 0
8.3% EOP Principal 40 40 40 40 40 40 40 40 40 40 40
8.3% Interest on revolver 3 3 3 3 3 3 3 3 3 3 3
Capitalized Leases
BOP Principal 11 11 11 11 11 11 11 11 11 11 11
Issuance/(Repayment) 0 0 0 0 0 0 0 0 0 0 0
5.1% EOP Principal 11 11 11 11 11 11 11 11 11 11 11
5.1% Interest on leases 1 1 1 1 1 1 1 1 1 1 1
20
Appendix D: Comparable Company EV/EBITDA Trading Multiples
Spectrum Brands Holdings, Inc.
Selected Financials Comparison LTM as of 15- Oct- 2010
All values in millions of U.S. Dollar, except per share items.
Shares Cash
Fiscal Price Shares Market Out Enterprise and ST Total Enterprise Value /
Company Name Period (15-Oct-2010) Outstanding Value Diluted Value Investments Debt Sales EBIT EBITDA EBITDA
Spectrum Brands Holdings, Inc. (SPB-US) 09/2010 ¹ 27.41 51.4 1,408.1 - 3,073.1 115.9 1,781.0 3,182.0 320.5 435.5 7.1xEnergizer Holdings, Inc. (ENR) 06/2010 ¹ 74.88 70.2 5,255.5 70.7 7,130.6 488.8 2,363.9 4,268.0 706.1 837.3 8.5x
Procter & Gamble Co. (PG) 06/2010 62.76 2,837.5 186,655.0 ² 3,099.3 215,209.0 2,879.0 29,832.0 78,938.0 16,655.9 19,763.9 10.9xThe Clorox Co. (CLX) 06/2010 67.95 139.4 9,470.8 141.5 12,178.8 87.0 2,795.0 5,534.0 1,057.8 1,242.8 9.8xChurch & Dwight Co., Inc. (CHD) 06/2010 ¹ 69.79 71.0 4,955.9 72.2 5,292.7 364.3 700.9 2,592.4 454.3 532.4 9.9xColgate-Palmolive Co. (CL) 06/2010 ¹ 75.89 486.0 37,095.8 ² 514.7 40,247.8 555.0 3,373.0 15,722.0 3,561.2 3,925.1 10.3xKimberly-Clark Corp. (KMB) 06/2010 ¹ 66.38 409.3 27,170.2 ² 415.6 33,508.2 585.0 6,651.0 19,587.0 3,090.9 3,908.9 8.6xJohnson & Johnson (JNJ) 06/2010 ¹ 63.57 2,754.4 175,100.1 2,796.0 167,851.1 18,901.0 11,652.0 62,622.0 17,613.7 19,899.7 8.4x¹ Data is LTM.
² Market value calculated using all c lasses of shares for the company.
Source: FactSet Fundamentals, FactSet Daily Prices, User Defined Comparables
21
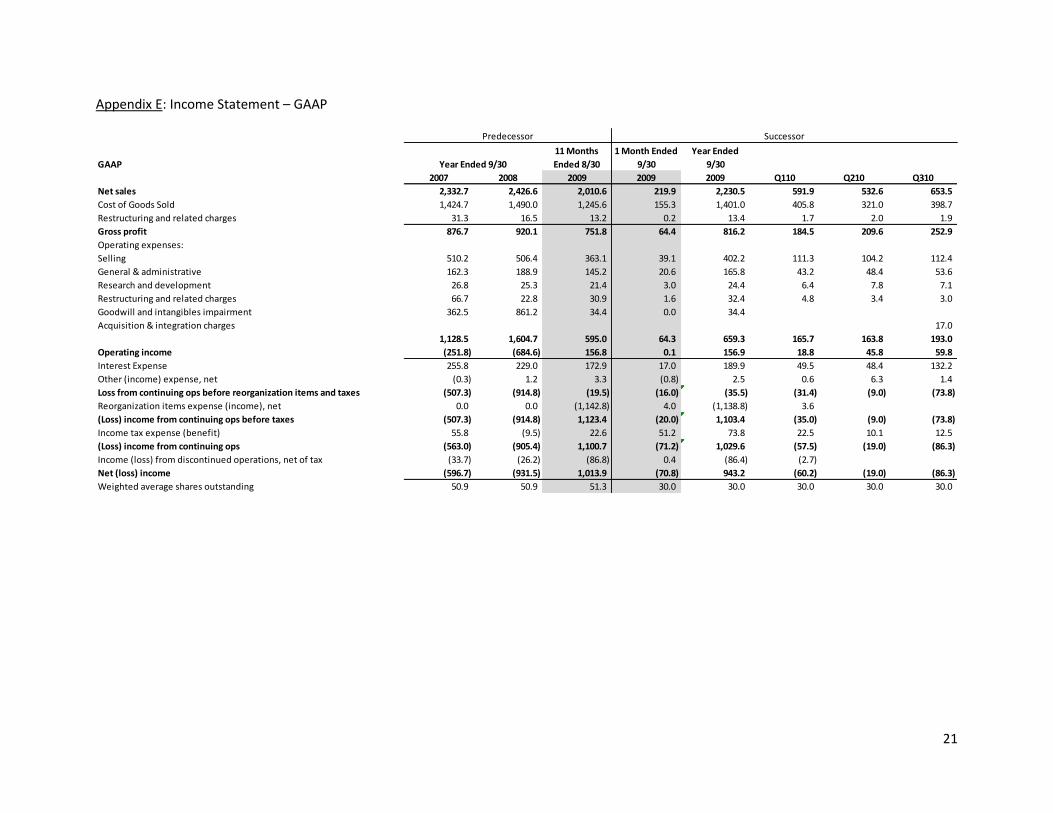
Appendix E: Income Statement – GAAP
GAAP
11 Months
Ended 8/30
1 Month Ended
9/30
Year Ended
9/30
2007 2008 2009 2009 2009 Q110 Q210 Q310
Net sales 2,332.7 2,426.6 2,010.6 219.9 2,230.5 591.9 532.6 653.5
Cost of Goods Sold 1,424.7 1,490.0 1,245.6 155.3 1,401.0 405.8 321.0 398.7
Restructuring and related charges 31.3 16.5 13.2 0.2 13.4 1.7 2.0 1.9
Gross profit 876.7 920.1 751.8 64.4 816.2 184.5 209.6 252.9
Operating expenses:
Selling 510.2 506.4 363.1 39.1 402.2 111.3 104.2 112.4
General & administrative 162.3 188.9 145.2 20.6 165.8 43.2 48.4 53.6
Research and development 26.8 25.3 21.4 3.0 24.4 6.4 7.8 7.1
Restructuring and related charges 66.7 22.8 30.9 1.6 32.4 4.8 3.4 3.0
Goodwill and intangibles impairment 362.5 861.2 34.4 0.0 34.4
Acquisition & integration charges 17.0
1,128.5 1,604.7 595.0 64.3 659.3 165.7 163.8 193.0
Operating income (251.8) (684.6) 156.8 0.1 156.9 18.8 45.8 59.8
Interest Expense 255.8 229.0 172.9 17.0 189.9 49.5 48.4 132.2
Other (income) expense, net (0.3) 1.2 3.3 (0.8) 2.5 0.6 6.3 1.4
Loss from continuing ops before reorganization items and taxes (507.3) (914.8) (19.5) (16.0) (35.5) (31.4) (9.0) (73.8)
Reorganization items expense (income), net 0.0 0.0 (1,142.8) 4.0 (1,138.8) 3.6
(Loss) income from continuing ops before taxes (507.3) (914.8) 1,123.4 (20.0) 1,103.4 (35.0) (9.0) (73.8)
Income tax expense (benefit) 55.8 (9.5) 22.6 51.2 73.8 22.5 10.1 12.5
(Loss) income from continuing ops (563.0) (905.4) 1,100.7 (71.2) 1,029.6 (57.5) (19.0) (86.3)
Income (loss) from discontinued operations, net of tax (33.7) (26.2) (86.8) 0.4 (86.4) (2.7)
Net (loss) income (596.7) (931.5) 1,013.9 (70.8) 943.2 (60.2) (19.0) (86.3)
Weighted average shares outstanding 50.9 50.9 51.3 30.0 30.0 30.0 30.0 30.0
Year Ended 9/30
Predecessor Successor
22
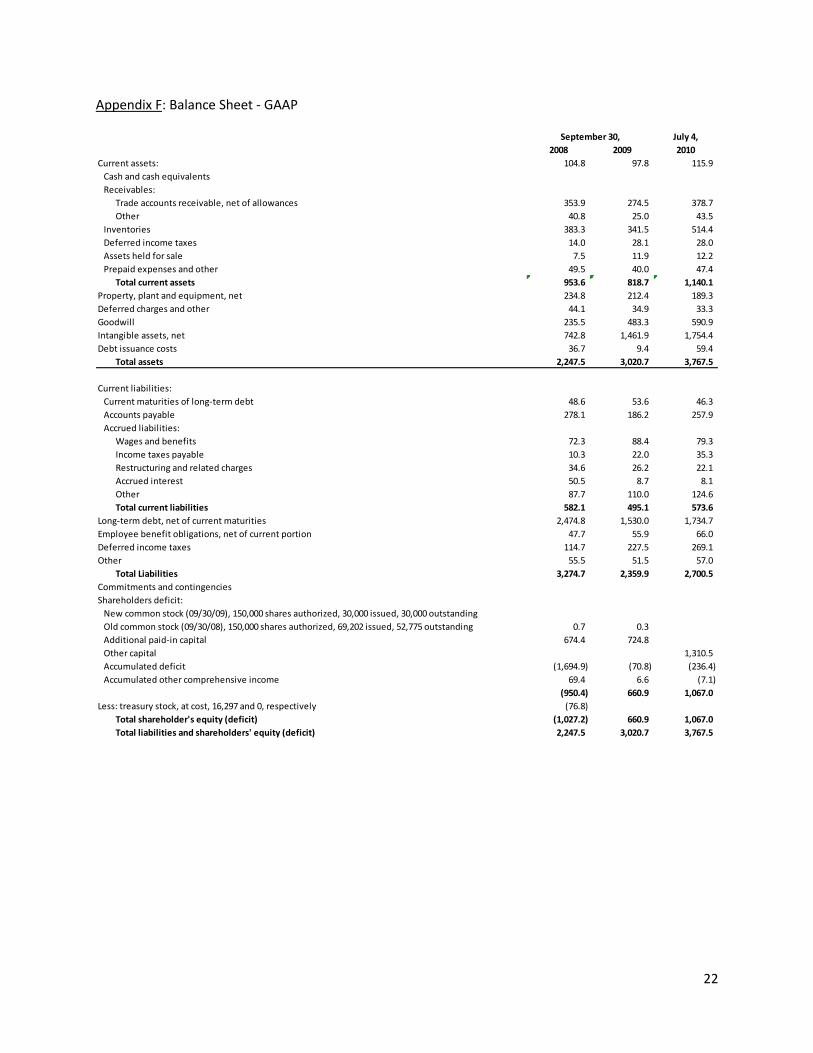
Appendix F: Balance Sheet - GAAP
July 4,
2008 2009 2010
Current assets: 104.8 97.8 115.9
Cash and cash equivalents
Receivables:
Trade accounts receivable, net of allowances 353.9 274.5 378.7
Other 40.8 25.0 43.5
Inventories 383.3 341.5 514.4
Deferred income taxes 14.0 28.1 28.0
Assets held for sale 7.5 11.9 12.2
Prepaid expenses and other 49.5 40.0 47.4
Total current assets 953.6 818.7 1,140.1
Property, plant and equipment, net 234.8 212.4 189.3
Deferred charges and other 44.1 34.9 33.3
Goodwill 235.5 483.3 590.9
Intangible assets, net 742.8 1,461.9 1,754.4
Debt issuance costs 36.7 9.4 59.4
Total assets 2,247.5 3,020.7 3,767.5
Current liabilities:
Current maturities of long-term debt 48.6 53.6 46.3
Accounts payable 278.1 186.2 257.9
Accrued liabilities:
Wages and benefits 72.3 88.4 79.3
Income taxes payable 10.3 22.0 35.3
Restructuring and related charges 34.6 26.2 22.1
Accrued interest 50.5 8.7 8.1
Other 87.7 110.0 124.6
Total current liabilities 582.1 495.1 573.6
Long-term debt, net of current maturities 2,474.8 1,530.0 1,734.7
Employee benefit obligations, net of current portion 47.7 55.9 66.0
Deferred income taxes 114.7 227.5 269.1
Other 55.5 51.5 57.0
Total Liabilities 3,274.7 2,359.9 2,700.5
Commitments and contingencies
Shareholders deficit:
New common stock (09/30/09), 150,000 shares authorized, 30,000 issued, 30,000 outstanding
Old common stock (09/30/08), 150,000 shares authorized, 69,202 issued, 52,775 outstanding 0.7 0.3
Additional paid-in capital 674.4 724.8
Other capital 1,310.5
Accumulated deficit (1,694.9) (70.8) (236.4)
Accumulated other comprehensive income 69.4 6.6 (7.1)
(950.4) 660.9 1,067.0
Less: treasury stock, at cost, 16,297 and 0, respectively (76.8)
Total shareholder's equity (deficit) (1,027.2) 660.9 1,067.0
Total liabilities and shareholders' equity (deficit) 2,247.5 3,020.7 3,767.5
September 30,