Embed Size (px)
Citation preview
Long Term Economic Growth
FIN 30220: Macroeconomics
GDP
Time
Trend (Average growth)“Business Cycle” (deviations from average growth)
Recall that we can take GDP for the US and decompose it into “Trend” and “Cycle”
This set of notes focuses solely on the trend!
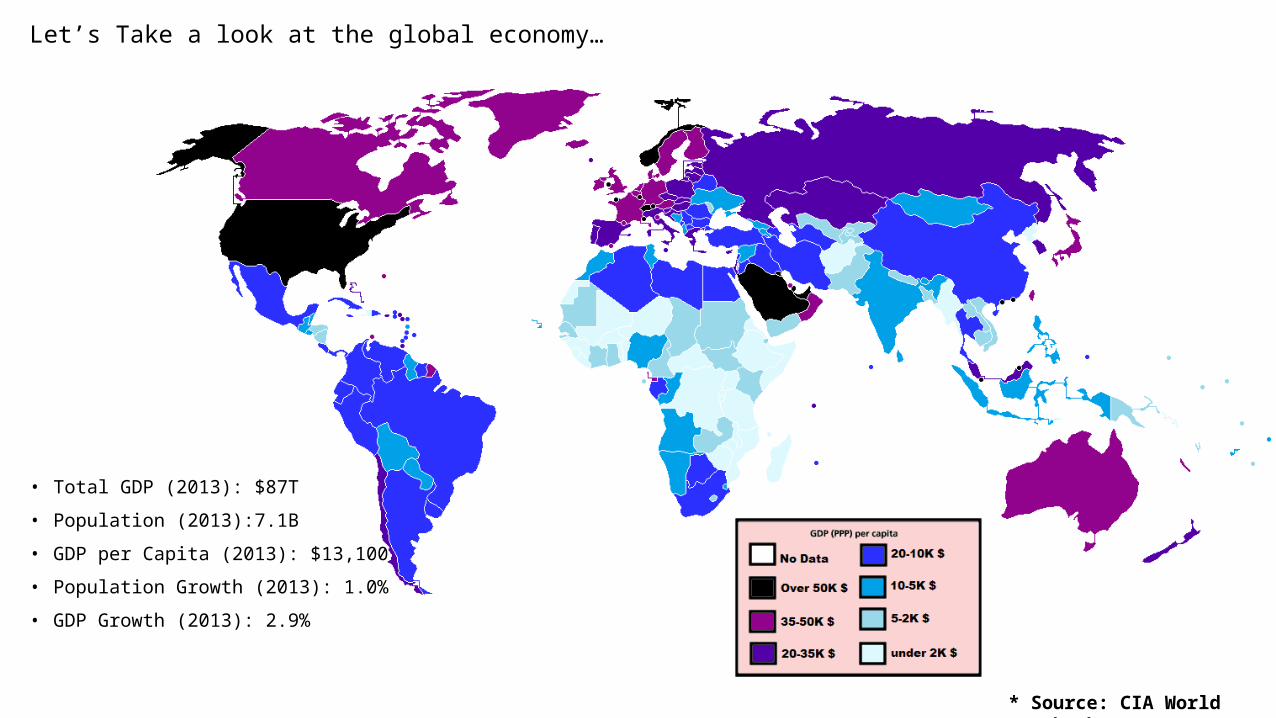
• Total GDP (2013): $87T
• Population (2013):7.1B
• GDP per Capita (2013): $13,100
• Population Growth (2013): 1.0%
• GDP Growth (2013): 2.9%
* Source: CIA World Factbook
Let’s Take a look at the global economy…
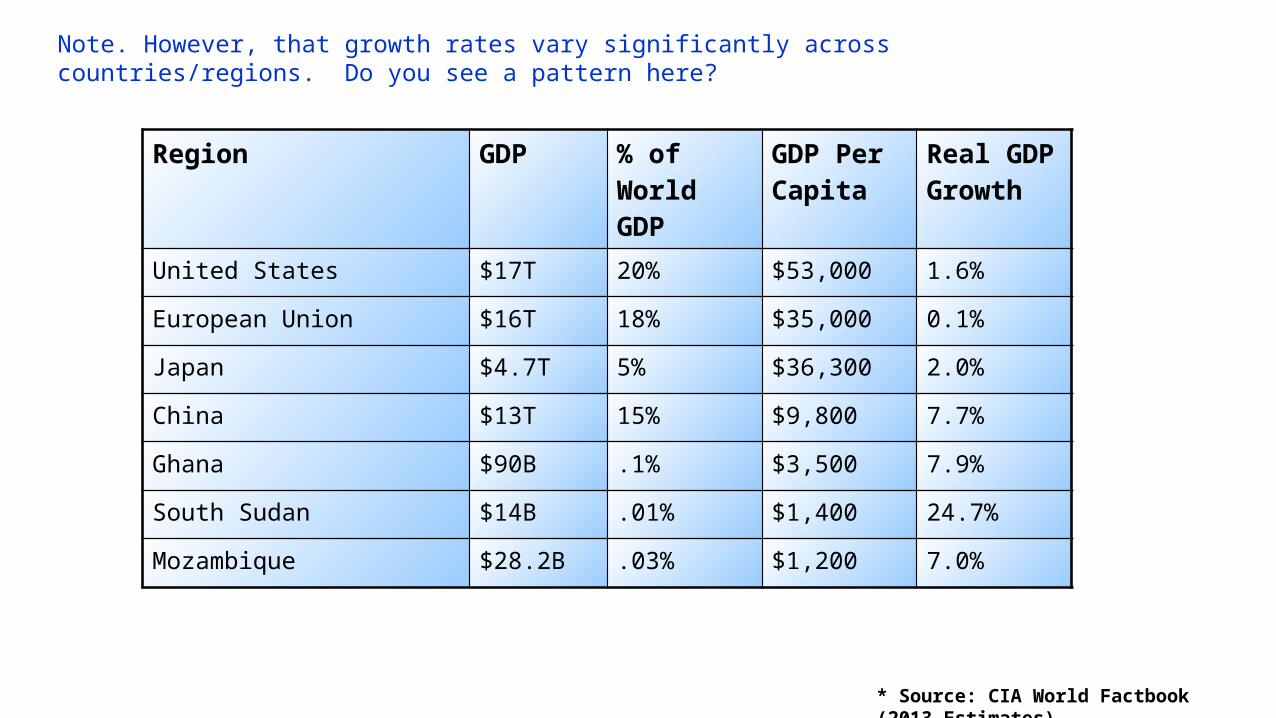
Region GDP % of World GDP
GDP Per Capita
Real GDP Growth
United States $17T 20% $53,000 1.6%
European Union $16T 18% $35,000 0.1%
Japan $4.7T 5% $36,300 2.0%
China $13T 15% $9,800 7.7%
Ghana $90B .1% $3,500 7.9%
South Sudan $14B .01% $1,400 24.7%
Mozambique $28.2B .03% $1,200 7.0%
* Source: CIA World Factbook (2013 Estimates)
Note. However, that growth rates vary significantly across countries/regions. Do you see a pattern here?
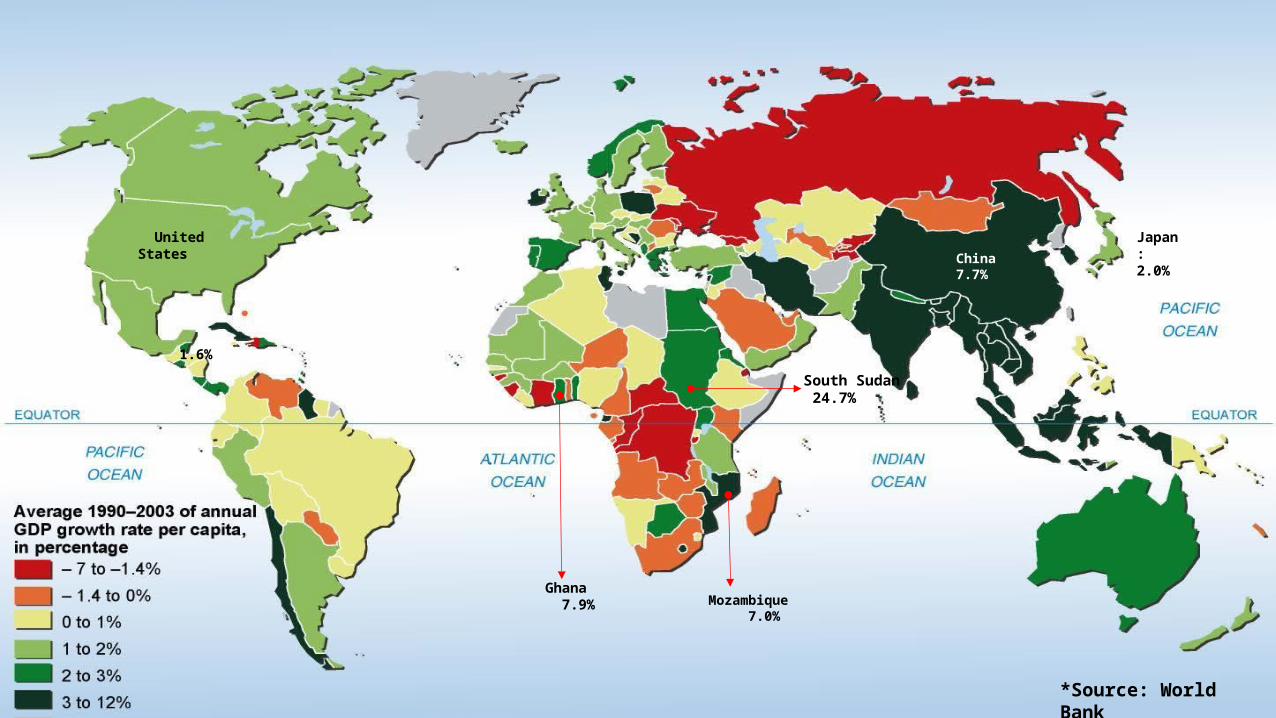
*Source: World Bank
Ghana 7.9% Mozambique
7.0%
South Sudan 24.7%
China7.7%
Japan: 2.0%
United States
1.6%
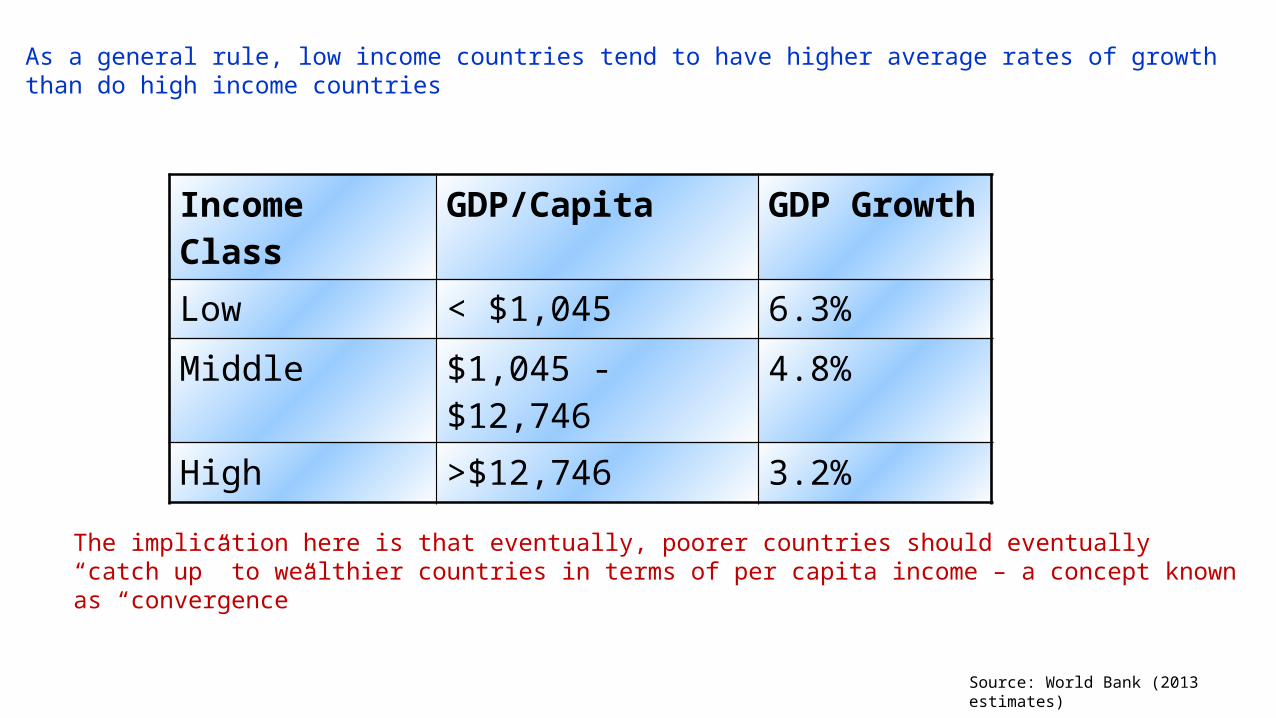
Income Class GDP/Capita GDP Growth
Low < $1,045 6.3%
Middle $1,045 - $12,746 4.8%
High >$12,746 3.2%
The implication here is that eventually, poorer countries should eventually “catch up” to wealthier countries in terms of per capita income – a concept known as “convergence”
Source: World Bank (2013 estimates)
As a general rule, low income countries tend to have higher average rates of growth than do high income countries
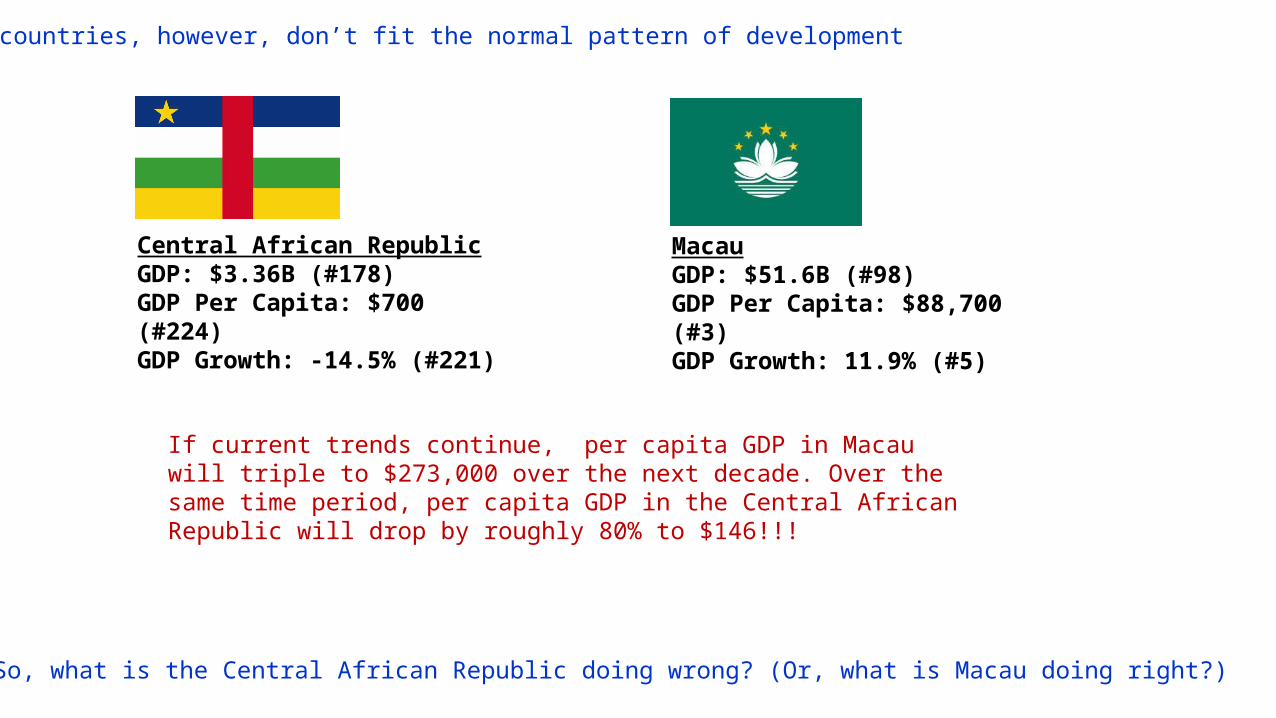
Some countries, however, don’t fit the normal pattern of development
Central African RepublicGDP: $3.36B (#178)GDP Per Capita: $700 (#224)GDP Growth: -14.5% (#221)
MacauGDP: $51.6B (#98)GDP Per Capita: $88,700 (#3)GDP Growth: 11.9% (#5)
So, what is the Central African Republic doing wrong? (Or, what is Macau doing right?)
If current trends continue, per capita GDP in Macau will triple to $273,000 over the next decade. Over the same time period, per capita GDP in the Central African Republic will drop by roughly 80% to $146!!!
Nicholas Kaldor1908-1986
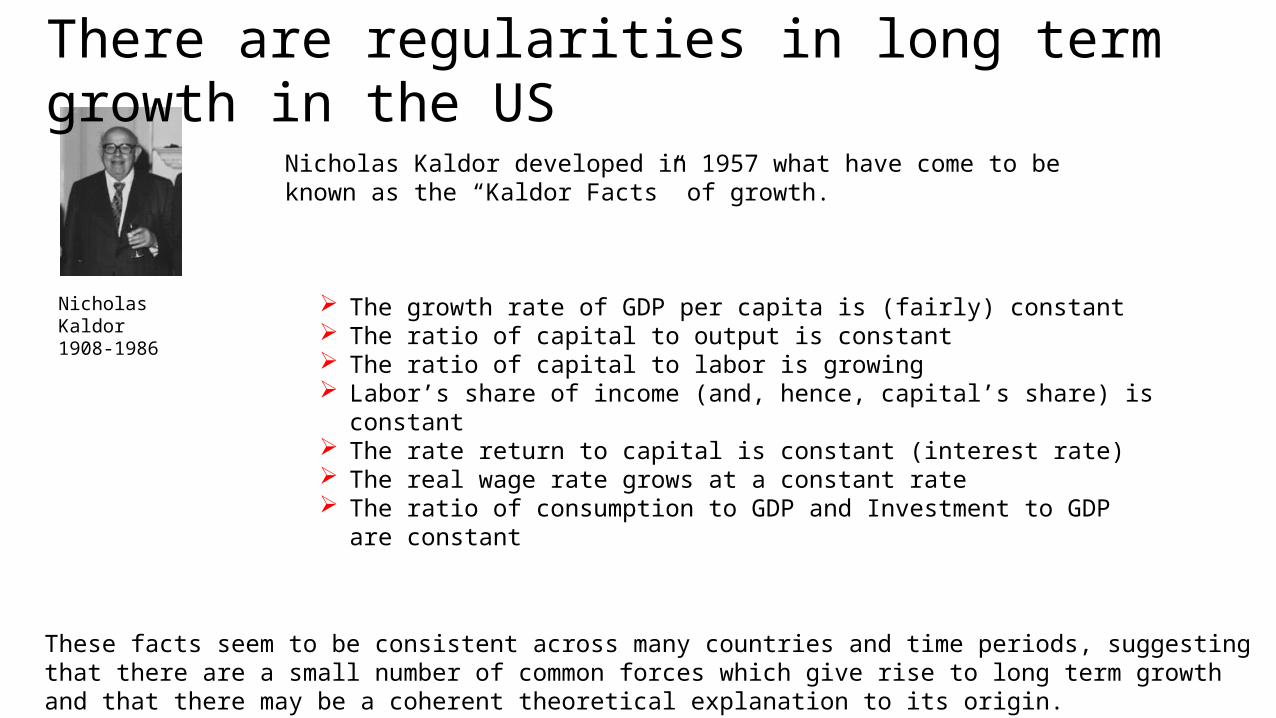
Nicholas Kaldor developed in 1957 what have come to be known as the “Kaldor Facts” of growth.
The growth rate of GDP per capita is (fairly) constant The ratio of capital to output is constant The ratio of capital to labor is growing Labor’s share of income (and, hence, capital’s share) is constant The rate return to capital is constant (interest rate) The real wage rate grows at a constant rate The ratio of consumption to GDP and Investment to GDP are constant
These facts seem to be consistent across many countries and time periods, suggesting that there are a small number of common forces which give rise to long term growth and that there may be a coherent theoretical explanation to its origin.
There are regularities in long term growth in the US
1961-01-01 1971-01-01 1981-01-01 1991-01-01 2001-01-01 2011-01-01
-6
-4
-2
0
2
4
6
8
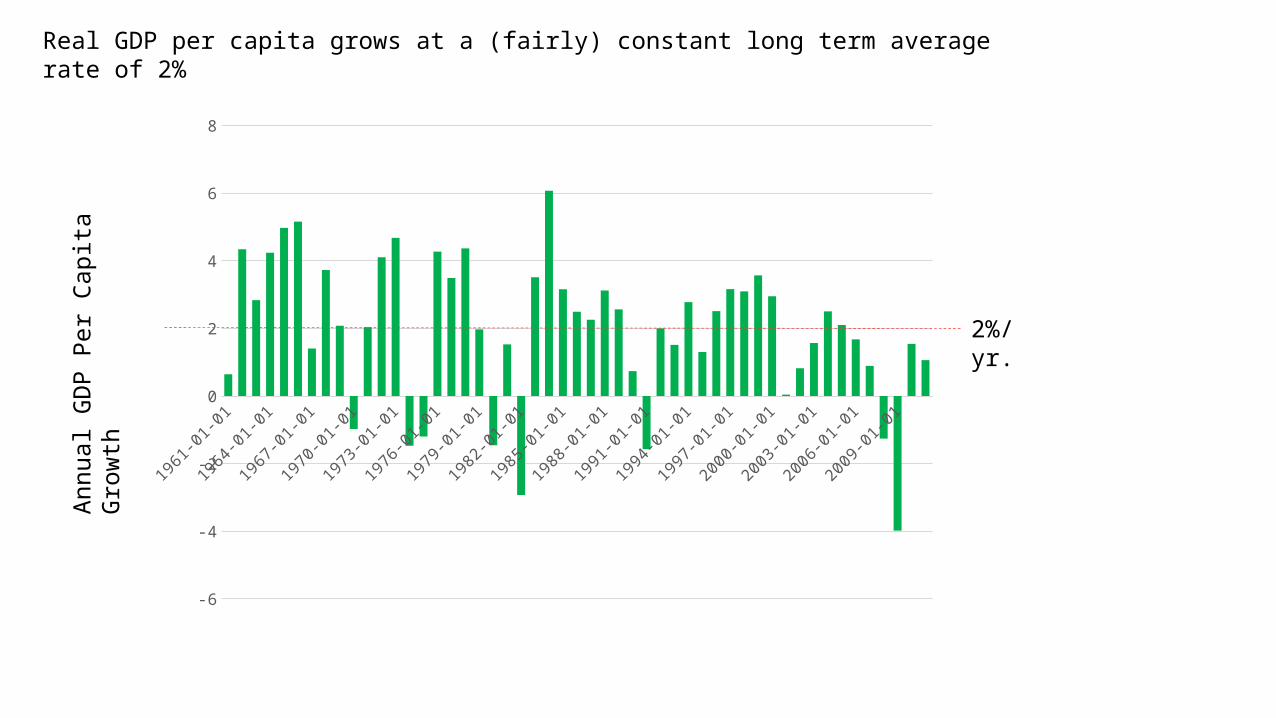
2%/yr.
Real GDP per capita grows at a (fairly) constant long term average rate of 2%
Annu
al G
DP
Per C
apita
Gro
wth
1948 1963 1978 19931.6
1.8
2
2.2
2.4
2.6
2.8
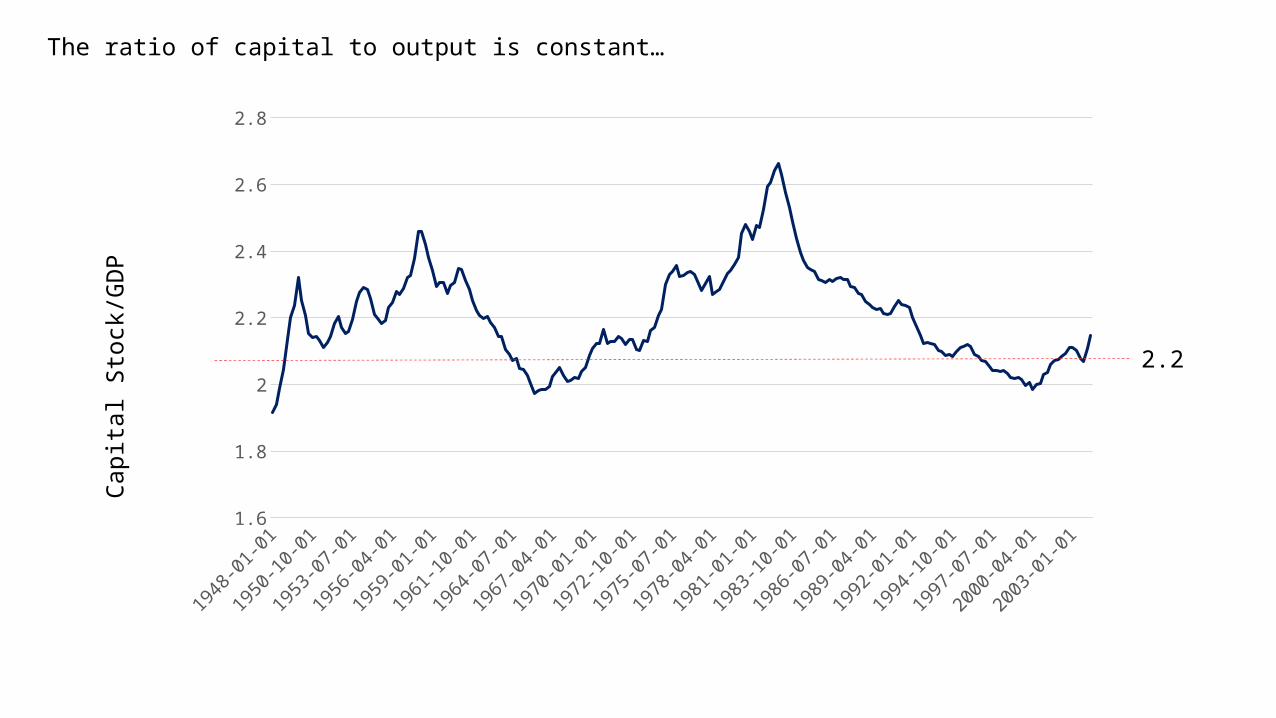
2.2
The ratio of capital to output is constant…
Capi
tal S
tock
/GD
P
1947 1963 1979 1995 20110
0.1
0.2
0.3
0.4
0.5
0.6
0.7
0.8
0
0.02
0.04
0.06
0.08
0.1
0.12
0.14
0.16
0.18
0.2
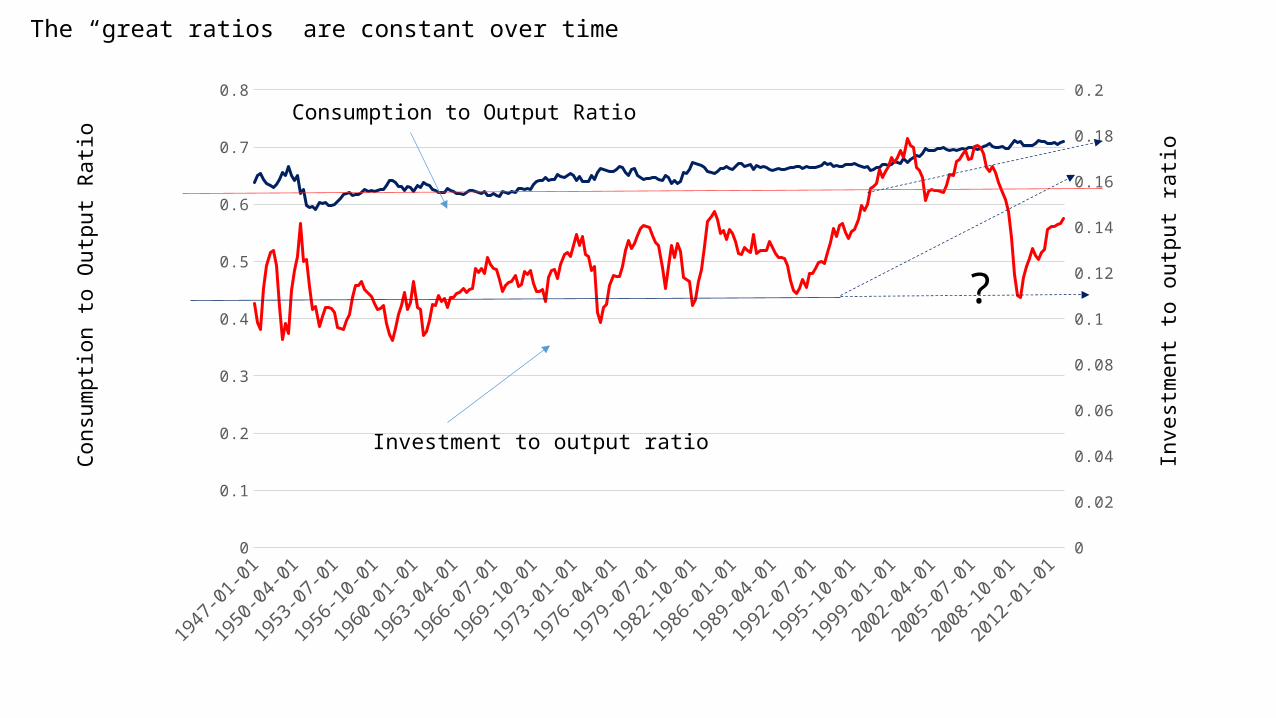
Investment to output ratio
Inve
stm
ent t
o ou
tput
ratio
Cons
umpti
on to
Out
put R
atio
Consumption to Output Ratio
The “great ratios” are constant over time
?
1948 1963 1978 19930
0.05
0.1
0.15
0.2
0.25
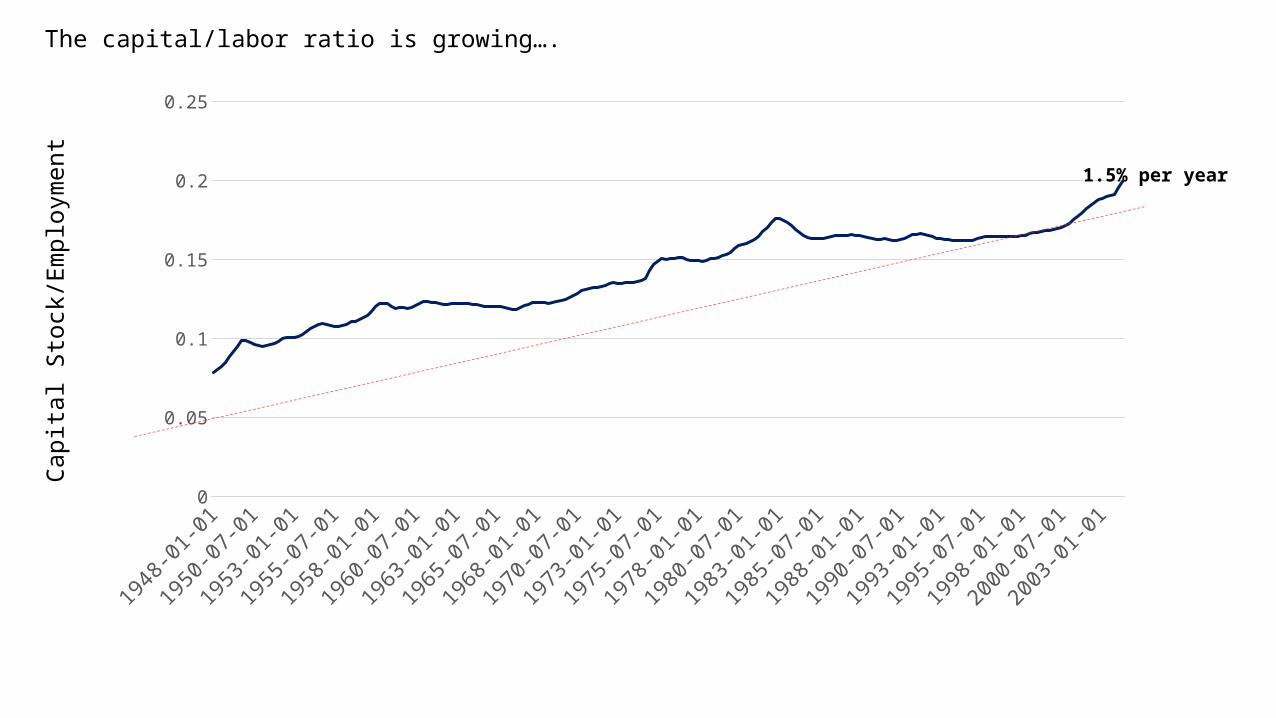
The capital/labor ratio is growing….Ca
pita
l Sto
ck/E
mpl
oym
ent
1.5% per year
1947 1952 1957 1962 1967 1972 1977 1982 1987 1992 1997 2002 2007 20120
50
100
150
200
250
300
350
400
450
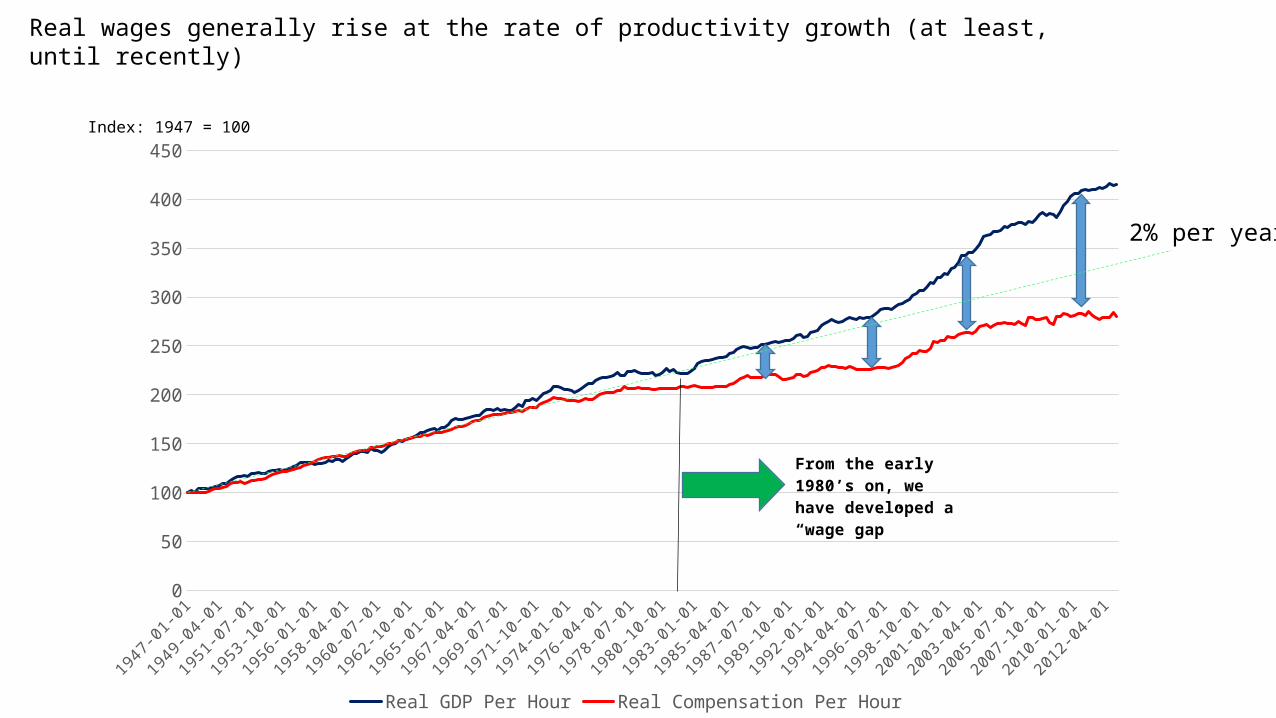
Real GDP Per Hour Real Compensation Per Hour
From the early 1980’s on, we have developed a “wage gap”
Index: 1947 = 100
Real wages generally rise at the rate of productivity growth (at least, until recently)
2% per year
1947 1952 1957 1962 1967 1972 1977 1982 1987 1992 1997 2002 2007 201256
58
60
62
64
66
68
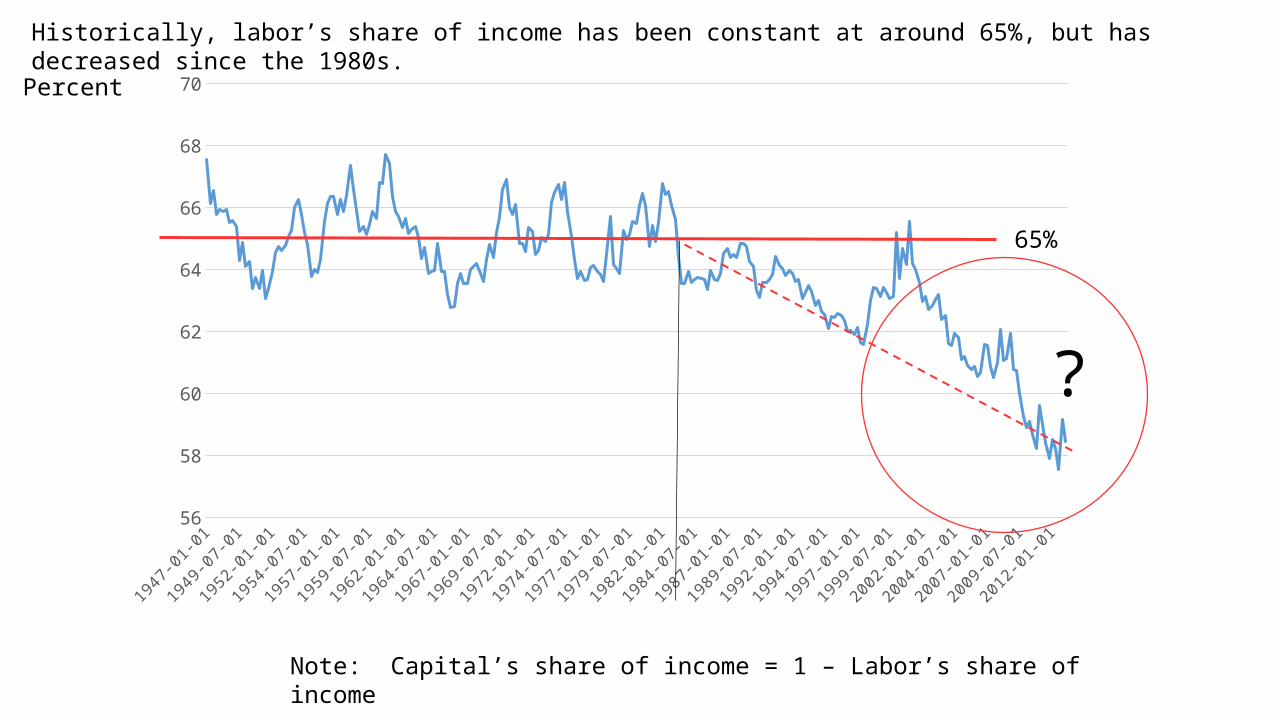
70Percent
65%
?
Historically, labor’s share of income has been constant at around 65%, but has decreased since the 1980s.
Note: Capital’s share of income = 1 – Labor’s share of income
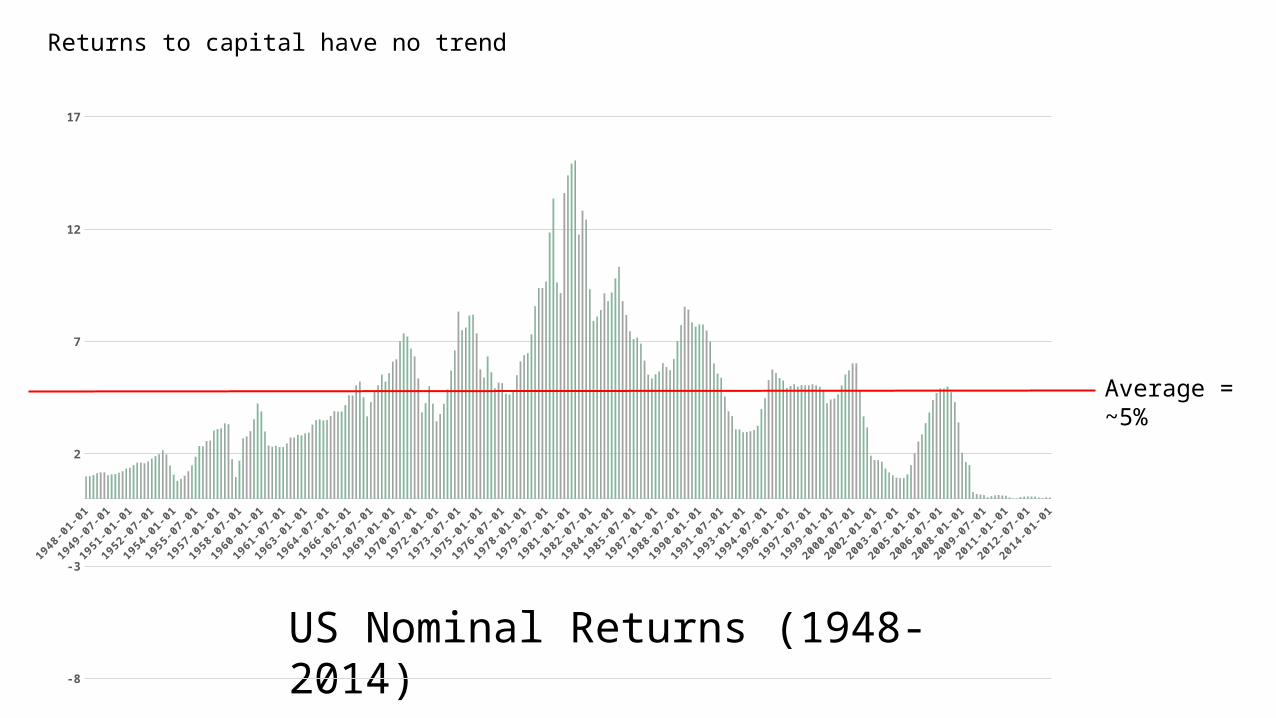
US Nominal Returns (1948-2014)
1948 1958 1968 1978 1988 1998 2008
-8
-3
2
7
12
17
Average = ~5%
Returns to capital have no trend
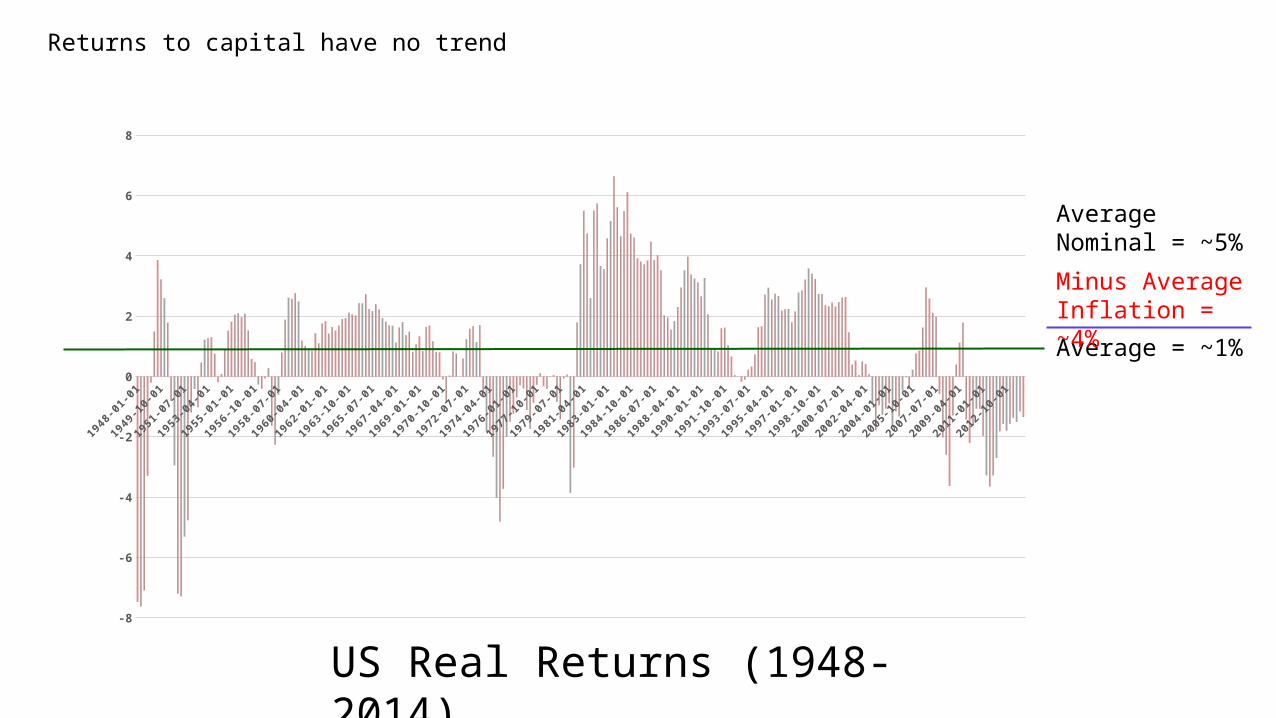
US Real Returns (1948-2014)
1948 1958 1968 1978 1988 1998 2008
-8
-6
-4
-2
0
2
4
6
8
Average = ~1%
Returns to capital have no trend
Average Nominal = ~5%
Minus Average Inflation = ~4%
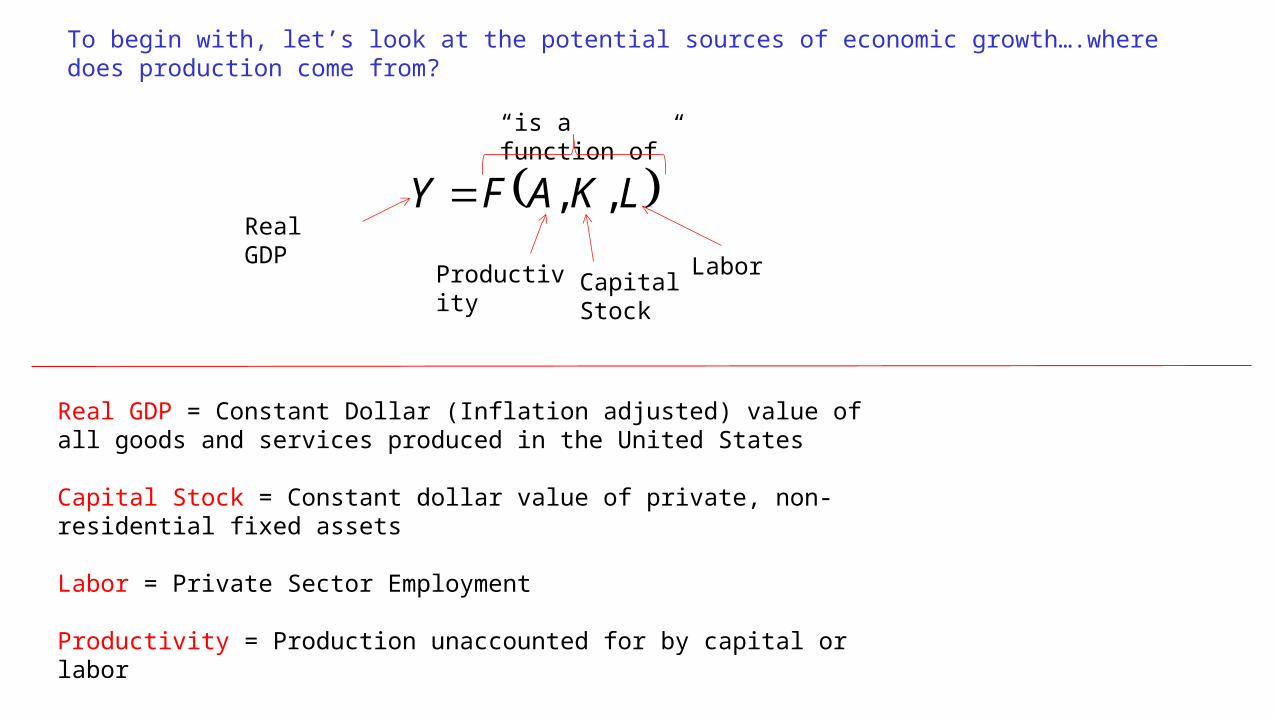
To begin with, let’s look at the potential sources of economic growth….where does production come from?
LKAFY ,,Real GDP
“is a function of”
Productivity Capital Stock
Labor
Real GDP = Constant Dollar (Inflation adjusted) value of all goods and services produced in the United States
Capital Stock = Constant dollar value of private, non-residential fixed assets
Labor = Private Sector Employment
Productivity = Production unaccounted for by capital or labor
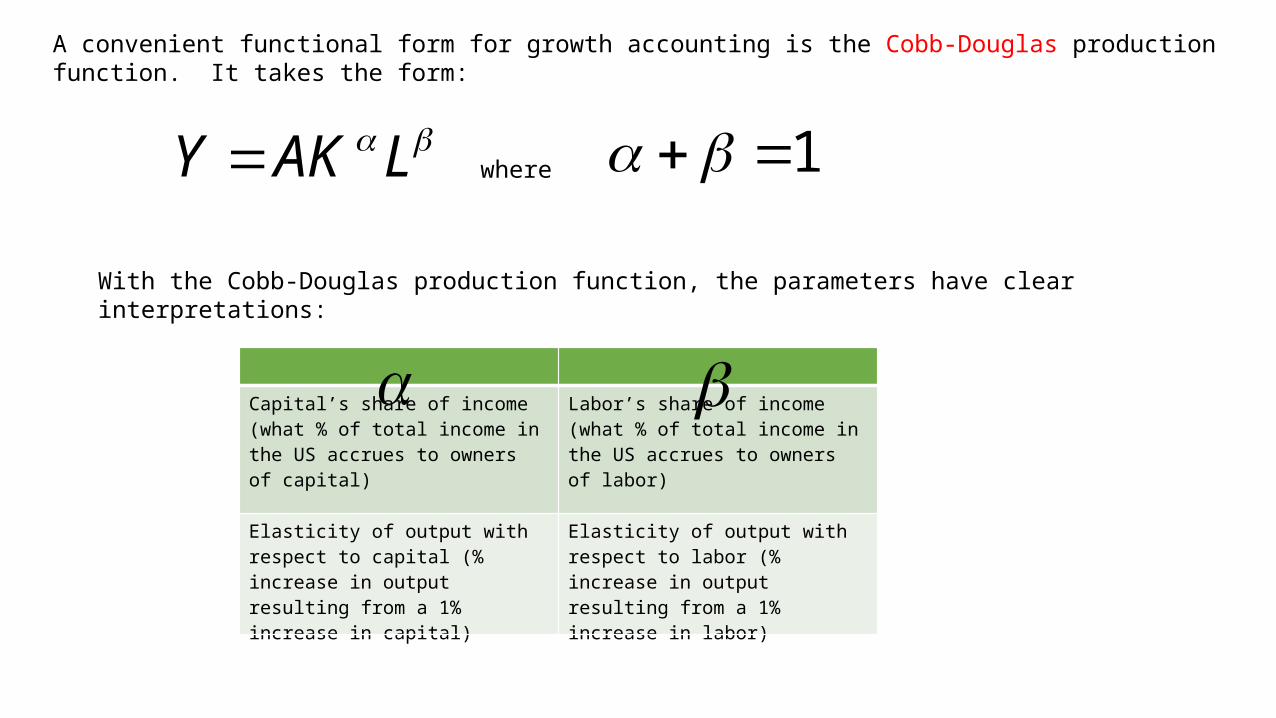
A convenient functional form for growth accounting is the Cobb-Douglas production function. It takes the form:
LAKY where 1
With the Cobb-Douglas production function, the parameters have clear interpretations:
Capital’s share of income (what % of total income in the US accrues to owners of capital)
Labor’s share of income (what % of total income in the US accrues to owners of labor)
Elasticity of output with respect to capital (% increase in output resulting from a 1% increase in capital)
Elasticity of output with respect to labor (% increase in output resulting from a 1% increase in labor)
3
2
3
1
LAKY
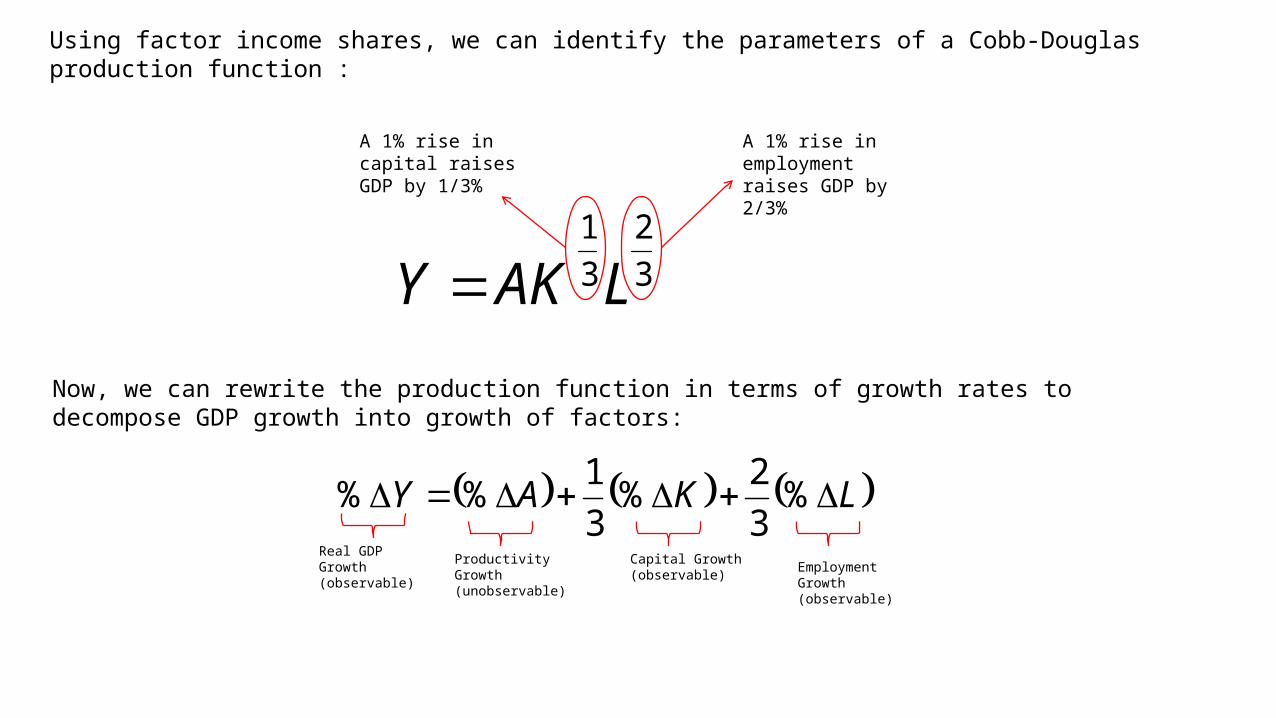
Using factor income shares, we can identify the parameters of a Cobb-Douglas production function :
A 1% rise in employment raises GDP by 2/3%
A 1% rise in capital raises GDP by 1/3%
Now, we can rewrite the production function in terms of growth rates to decompose GDP growth into growth of factors:
LKAY %3
2%
3
1%%
Real GDP Growth (observable) Employment
Growth (observable)
Capital Growth (observable)
Productivity Growth (unobservable)
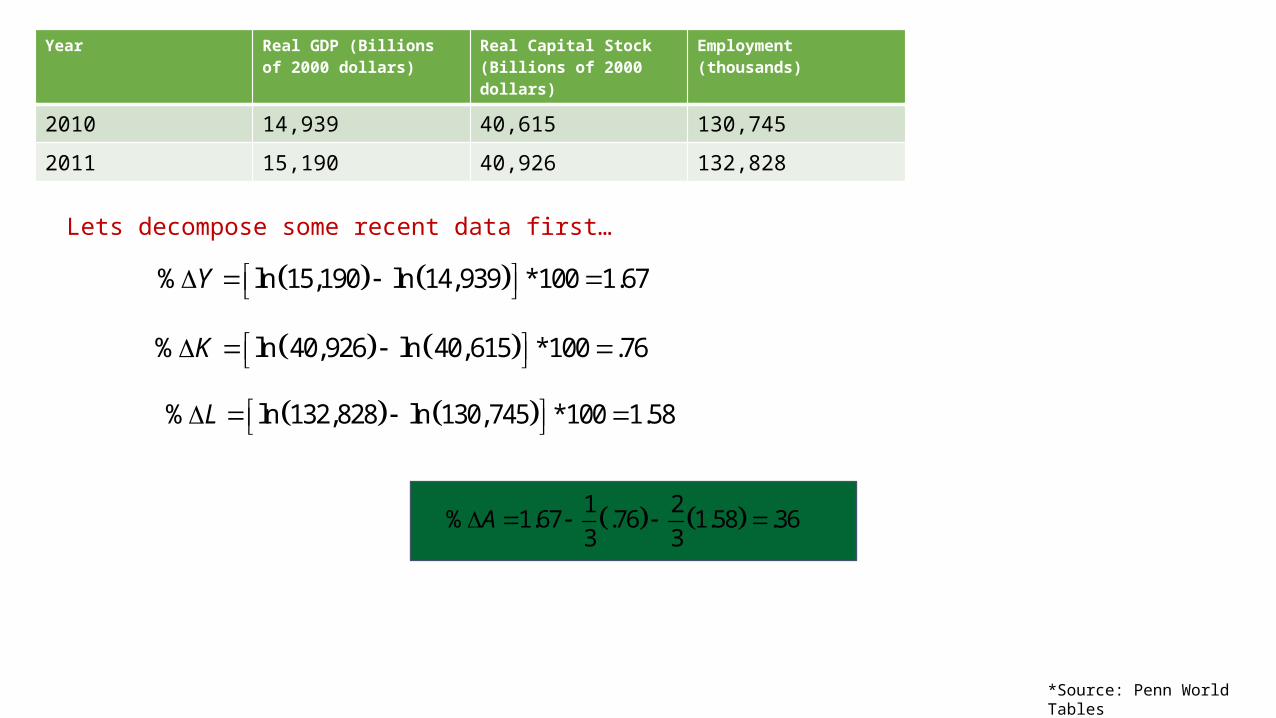
Year Real GDP (Billions of 2000 dollars)
Real Capital Stock (Billions of 2000 dollars)
Employment (thousands)
2010 14,939 40,615 130,745
2011 15,190 40,926 132,828
Lets decompose some recent data first…
% ln 15,190 ln 14,939 *100 1.67Y
% ln 132,828 ln 130,745 *100 1.58L
1 2% 1.67 .76 1.58 .36
3 3A
% ln 40,926 ln 40,615 *100 .76K
*Source: Penn World Tables
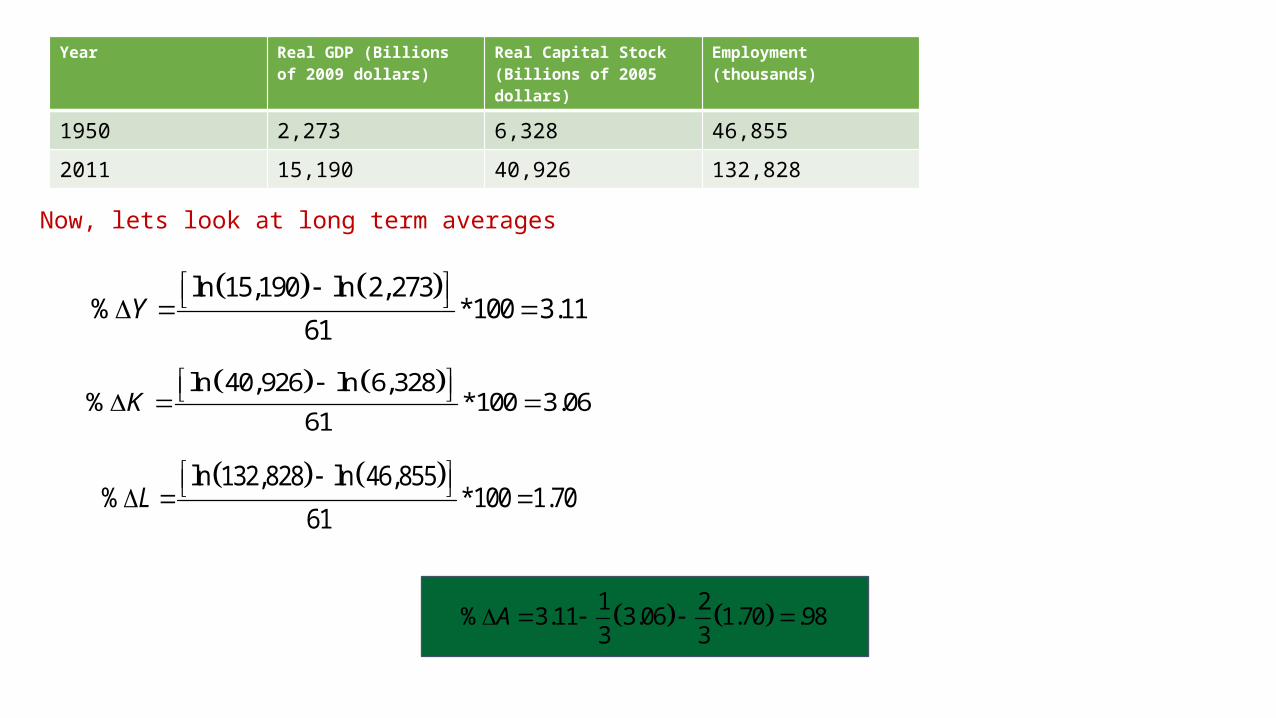
Year Real GDP (Billions of 2009 dollars)
Real Capital Stock (Billions of 2005 dollars)
Employment (thousands)
1950 2,273 6,328 46,855
2011 15,190 40,926 132,828
Now, lets look at long term averages
ln 15,190 ln 2,273% *100 3.11
61Y
ln 40,926 ln 6,328% *100 3.06
61K
ln 132,828 ln 46,855% *100 1.70
61L
1 2% 3.11 3.06 1.70 .98
3 3A
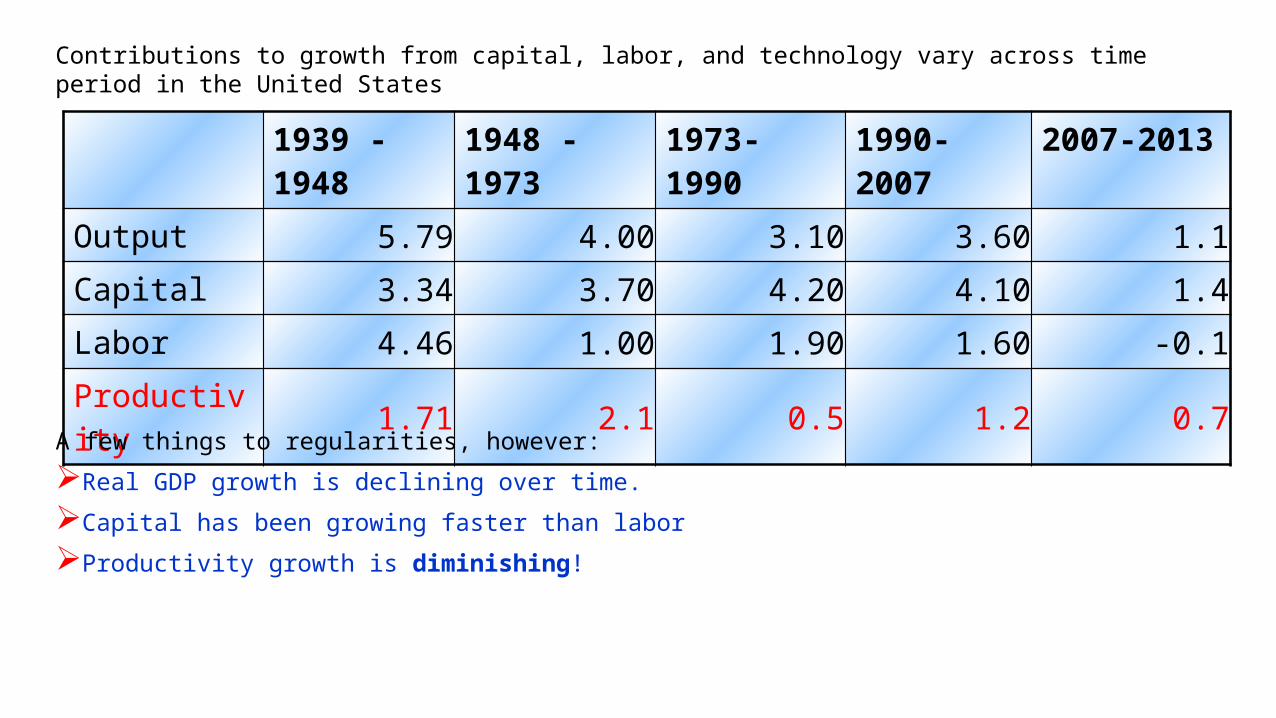
1939 - 1948 1948 - 1973 1973-1990 1990-2007 2007-2013
Output 5.79 4.00 3.10 3.60 1.1
Capital 3.34 3.70 4.20 4.10 1.4
Labor 4.46 1.00 1.90 1.60 -0.1
Productivity 1.71 2.1 0.5 1.2 0.7
A few things to regularities, however:
Real GDP growth is declining over time.
Capital has been growing faster than labor
Productivity growth is diminishing!
Contributions to growth from capital, labor, and technology vary across time period in the United States

In fact, productivity growth has been declining since WWIIA
nnua
l Gro
wth
"You can see the computer age everywhere but in the productivity statistics."
*Robert Solow, 1987
Nobel Prize, 1987
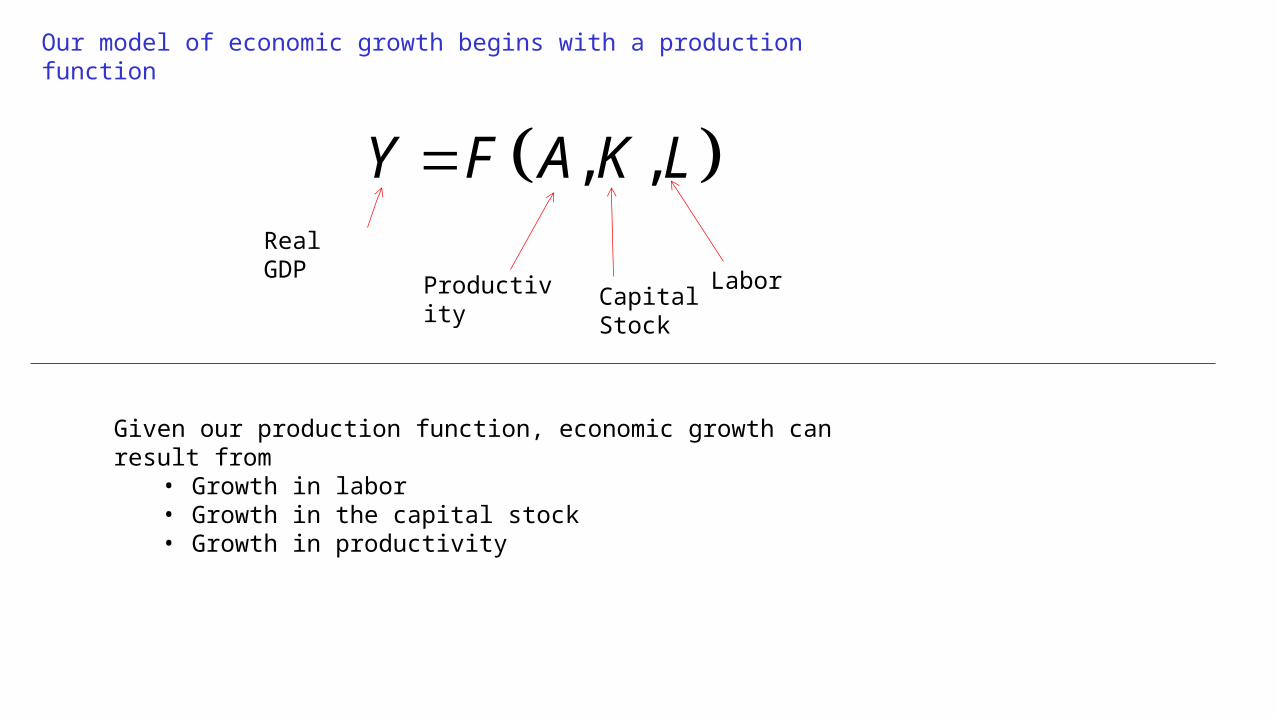
Our model of economic growth begins with a production function
Real GDP
Productivity Capital Stock
Labor
Given our production function, economic growth can result from • Growth in labor• Growth in the capital stock• Growth in productivity
, ,Y F A K L
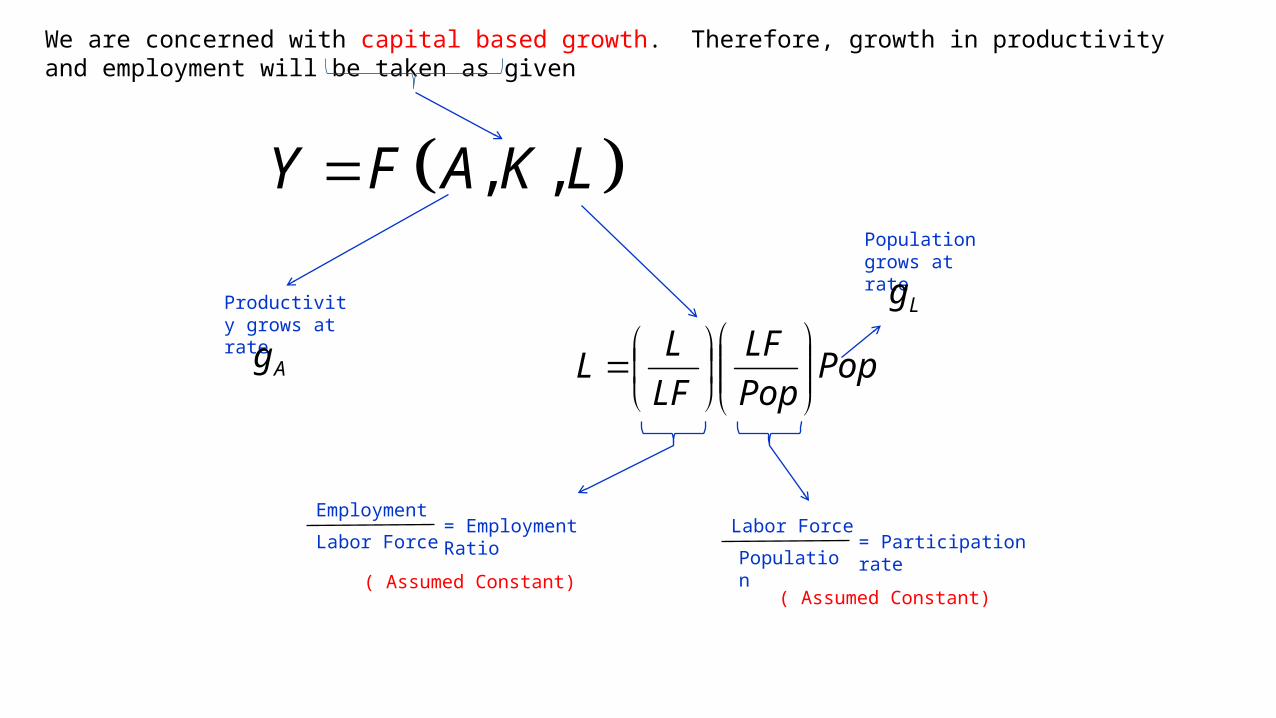
We are concerned with capital based growth. Therefore, growth in productivity and employment will be taken as given
Productivity grows at rate
Ag PopPop
LF
LF
LL
Population grows at rate
Lg
Employment
Labor Force= Employment Ratio
( Assumed Constant)
Labor Force
Population= Participation rate
( Assumed Constant)
, ,Y F A K L
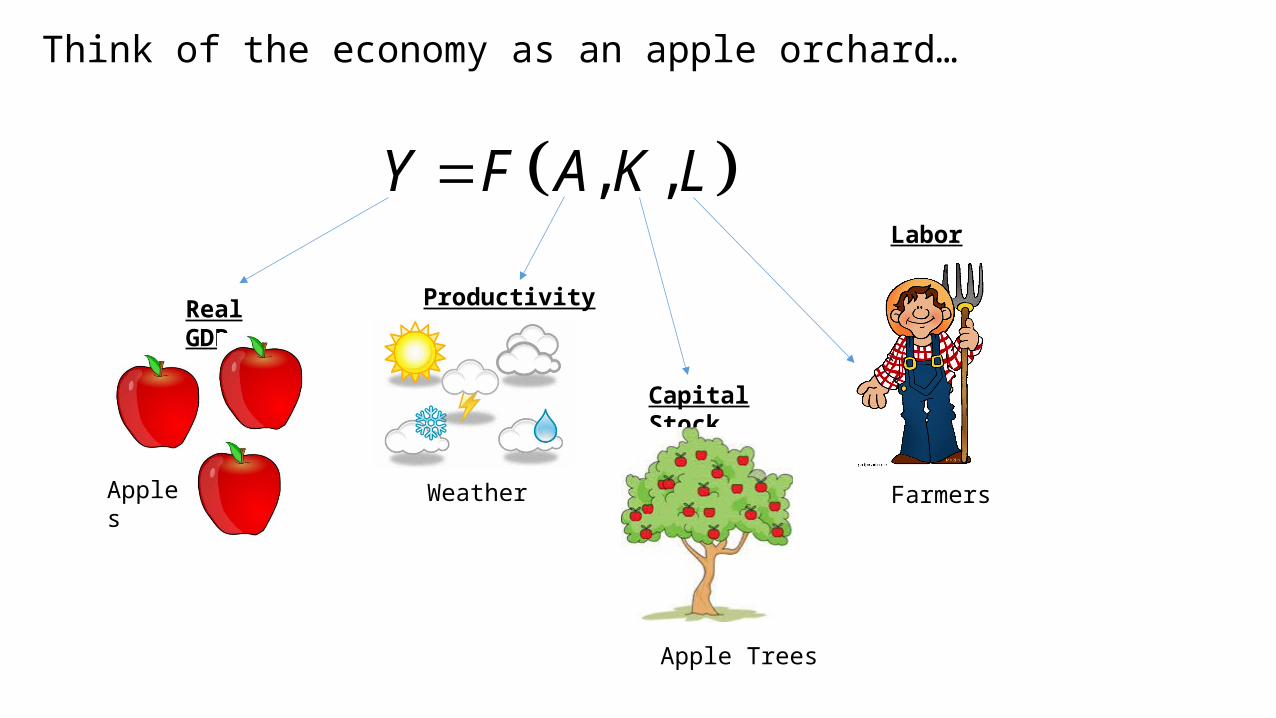
Think of the economy as an apple orchard…
, ,Y F A K L
Real GDP
Apples
Capital Stock
Apple Trees
Labor
Farmers
Productivity
Weather
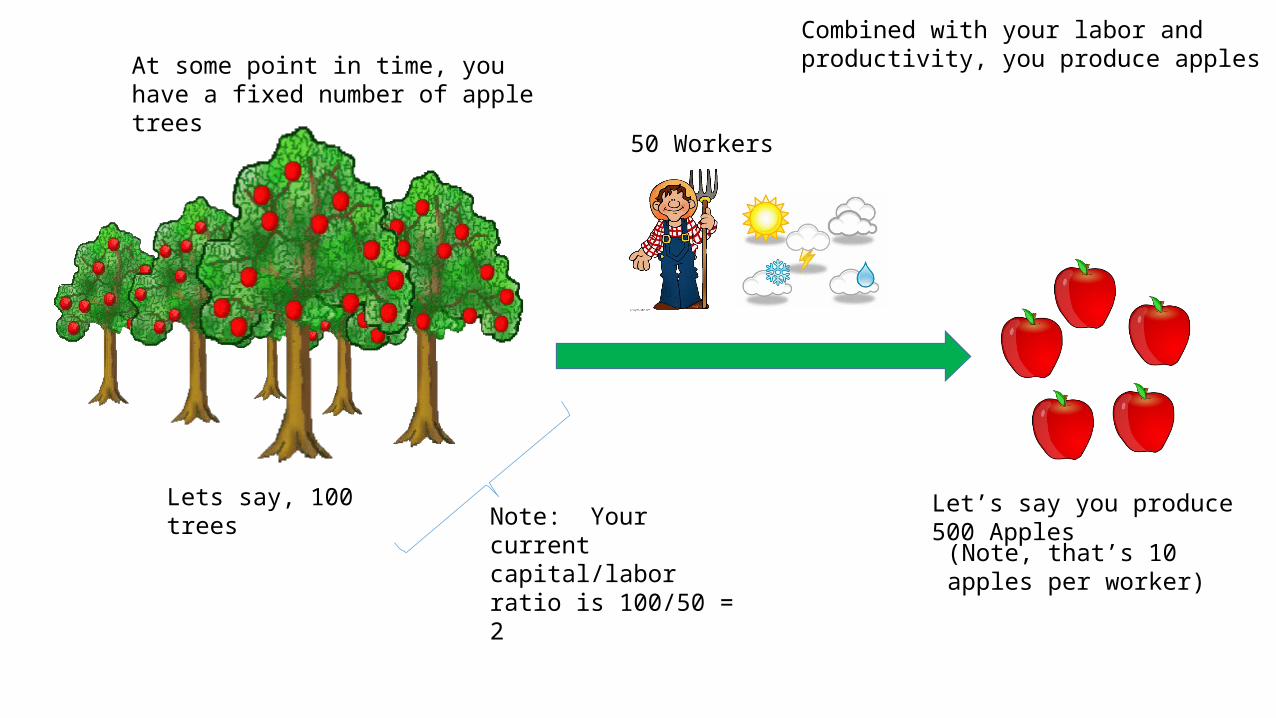
At some point in time, you have a fixed number of apple trees
Lets say, 100 trees
50 Workers
Combined with your labor and productivity, you produce apples
Note: Your current capital/labor ratio is 100/50 = 2
Let’s say you produce 500 Apples
(Note, that’s 10 apples per worker)
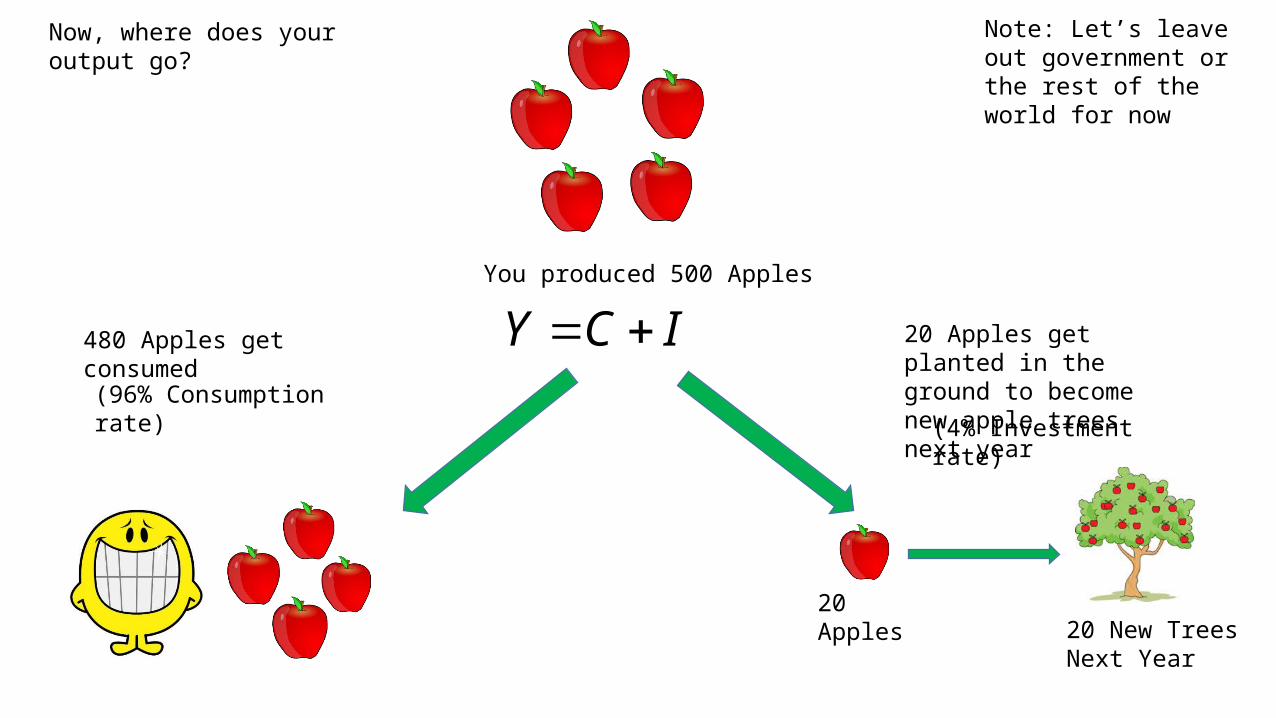
You produced 500 Apples
Y C I
Now, where does your output go?
480 Apples get consumed 20 Apples get planted in the ground to become new apple trees next year
20 Apples20 New Trees Next Year
(96% Consumption rate)(4% Investment rate)
Note: Let’s leave out government or the rest of the world for now
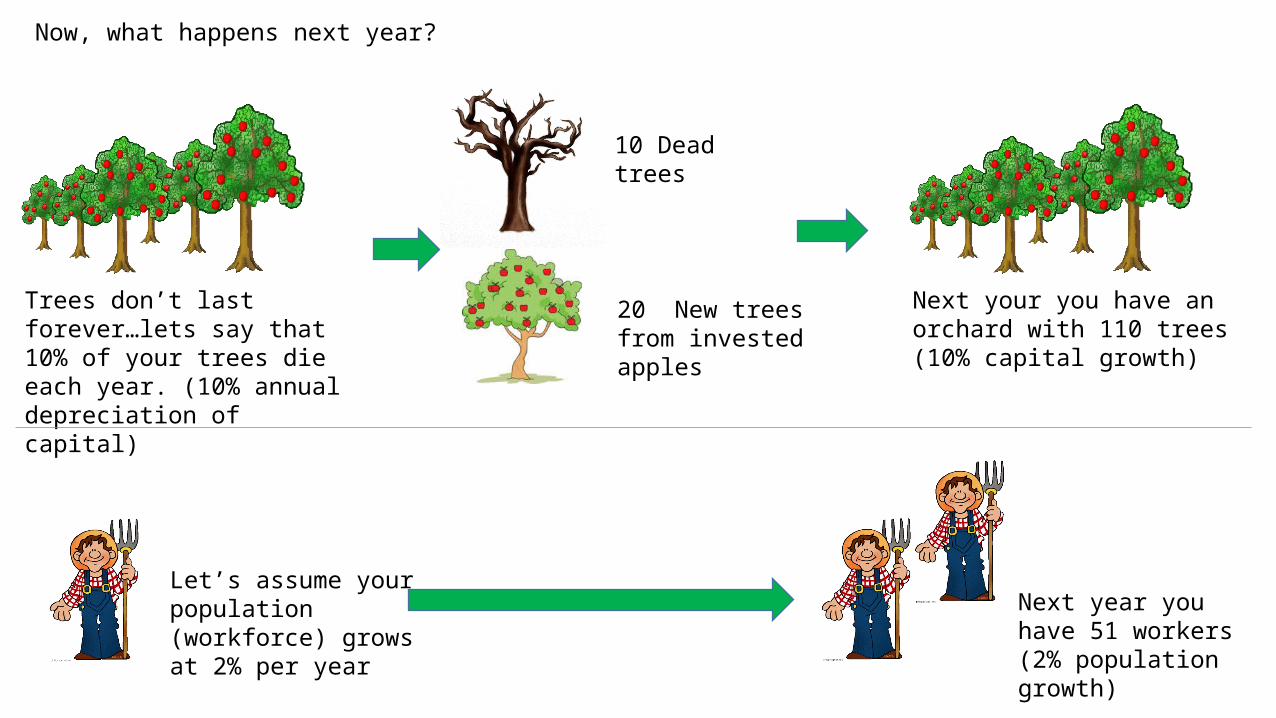
Now, what happens next year?
Trees don’t last forever…lets say that 10% of your trees die each year. (10% annual depreciation of capital)
10 Dead trees
20 New trees from invested apples
Next your you have an orchard with 110 trees (10% capital growth)
Let’s assume your population (workforce) grows at 2% per year
Next year you have 51 workers (2% population growth)
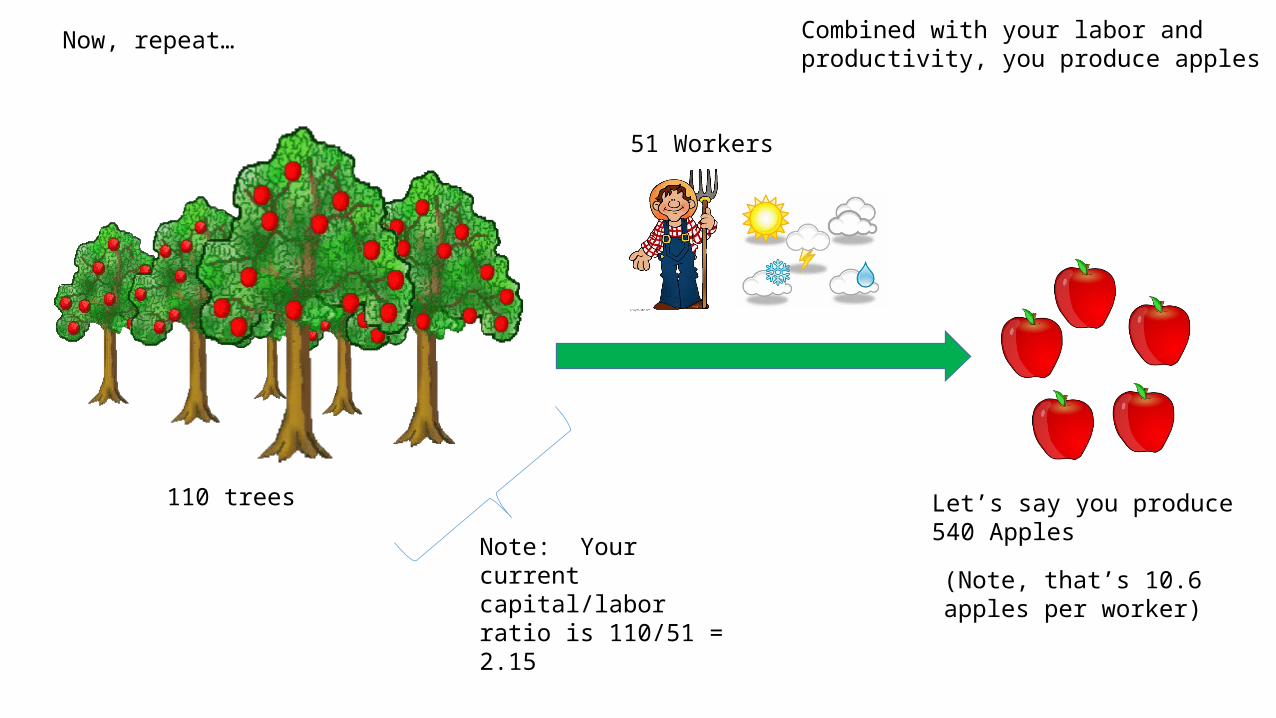
Now, repeat…
110 trees
51 Workers
Combined with your labor and productivity, you produce apples
Note: Your current capital/labor ratio is 110/51 = 2.15
Let’s say you produce 540 Apples
(Note, that’s 10.6 apples per worker)
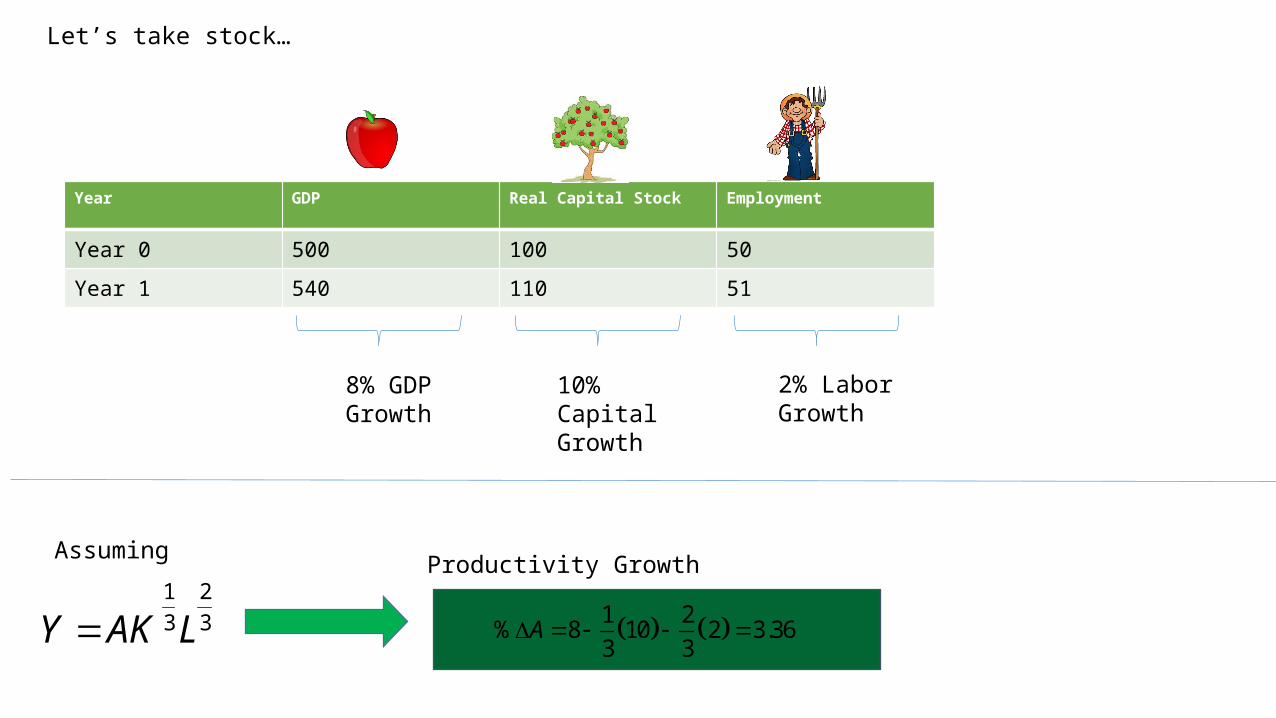
Year GDP Real Capital Stock Employment
Year 0 500 100 50
Year 1 540 110 51
Let’s take stock…
8% GDP Growth
10% Capital Growth
2% Labor Growth
1 2% 8 10 2 3.36
3 3A
Productivity GrowthAssuming
3
2
3
1
LAKY
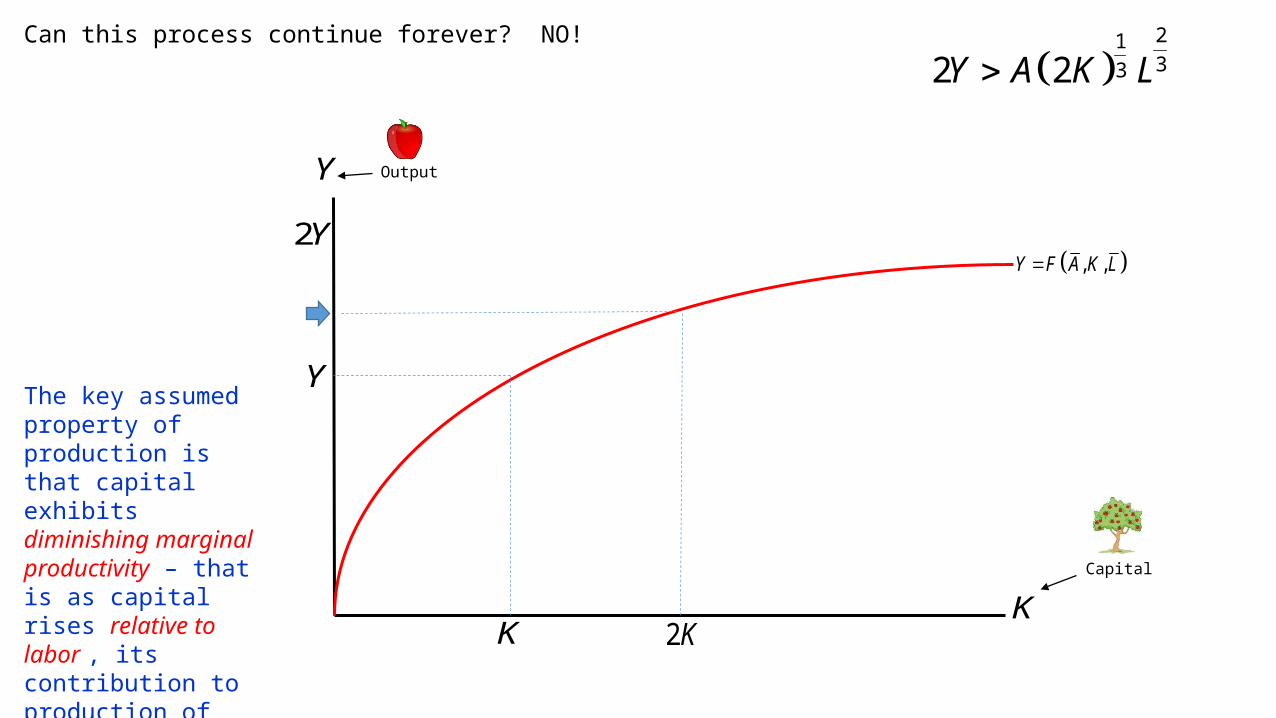
Can this process continue forever? NO!
, ,Y F A K L
Y
K
Capital
Output
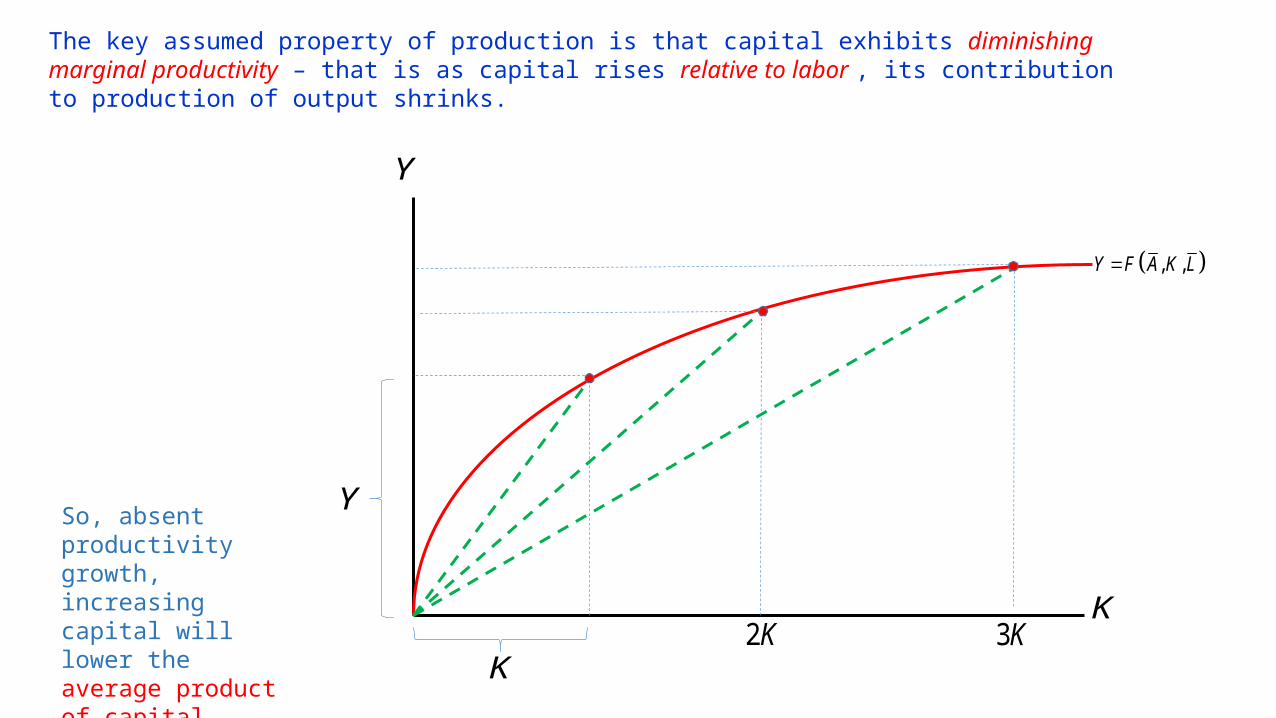
The key assumed property of production is that capital exhibits diminishing marginal productivity – that is as capital rises relative to labor , its contribution to production of output shrinks
21332 2Y A K L
K 2K
Y
2Y
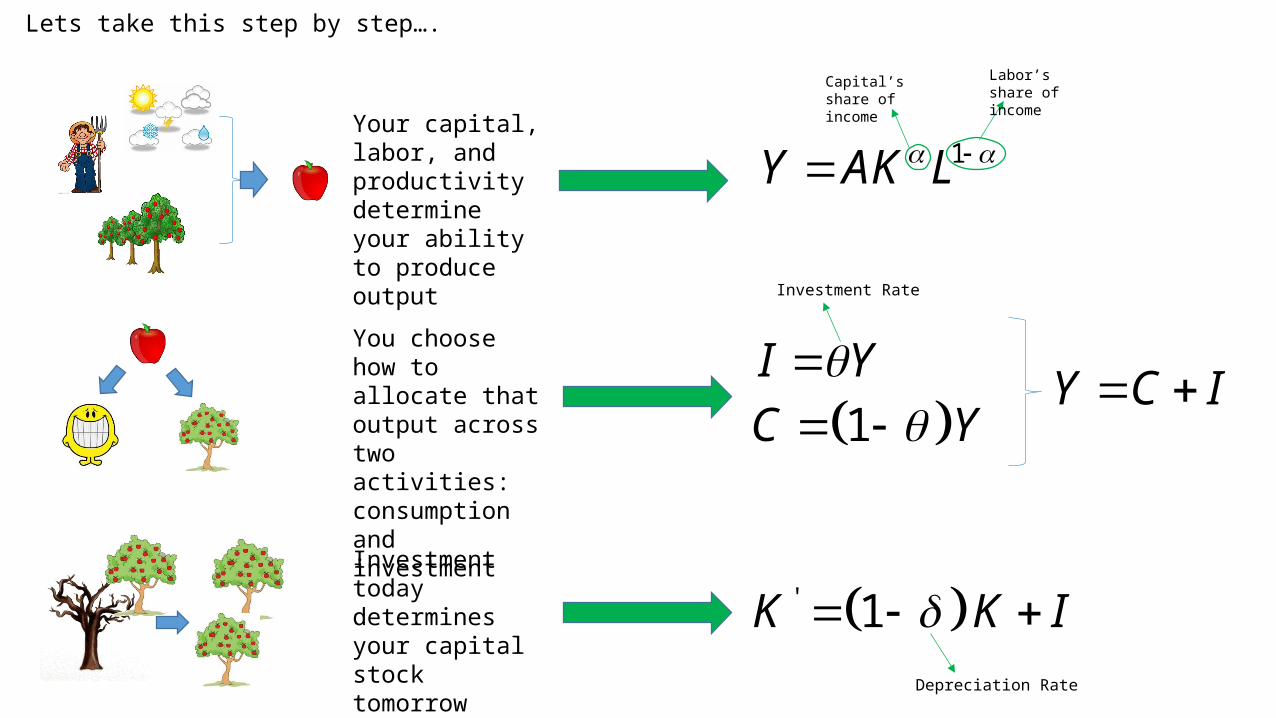
Lets take this step by step….
Your capital, labor, and productivity determine your ability to produce output
1Y AK L
You choose how to allocate that output across two activities: consumption and investment
1C Y Y C I
Investment today determines your capital stock tomorrow
' 1K K I
I Y
Capital’s share of income
Labor’s share of income
Investment Rate
Depreciation Rate
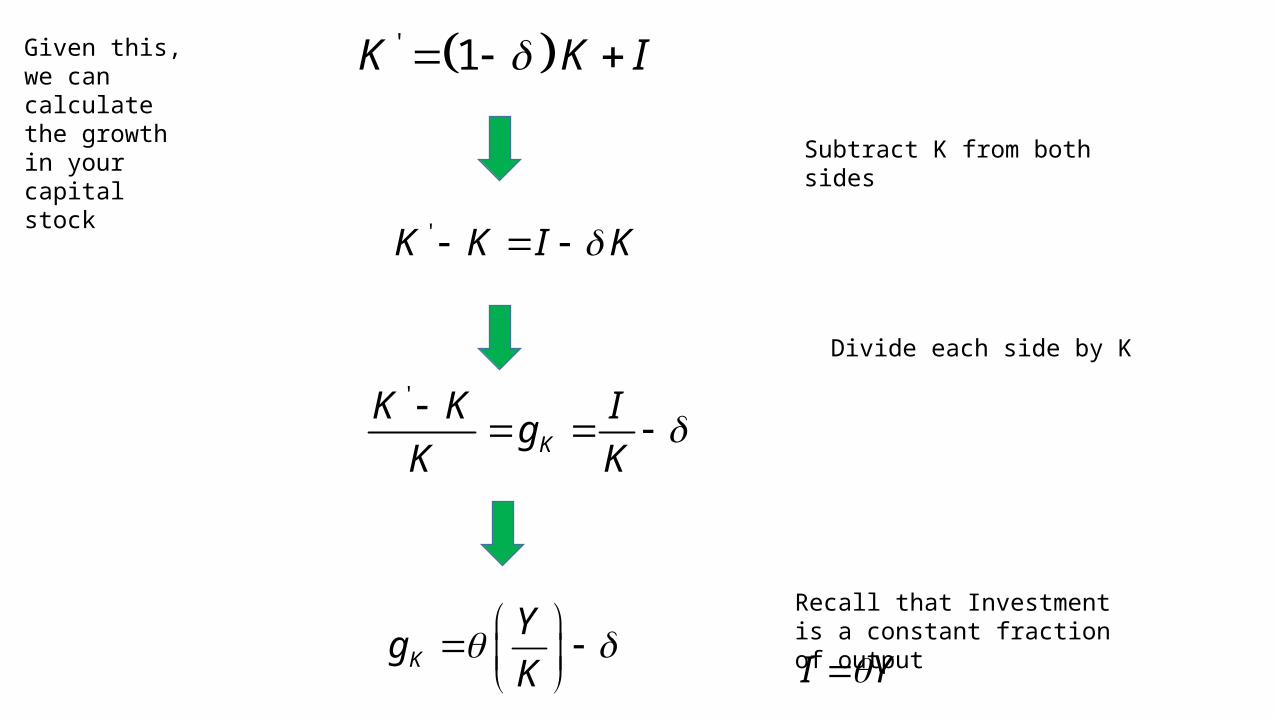
Given this, we can calculate the growth in your capital stock
' 1K K I
'
K
K K Ig
K K
'K K I K
Subtract K from both sides
Divide each side by K
K
Yg
K
Recall that Investment is a constant fraction of output
I Y
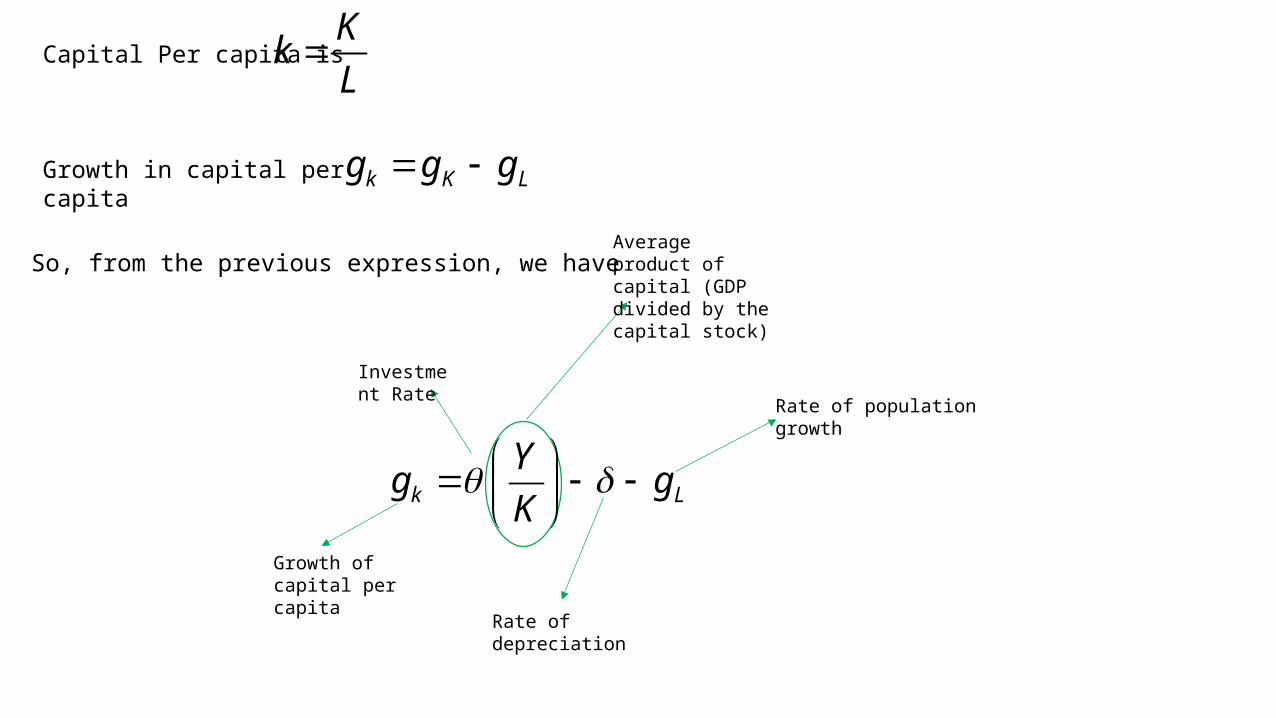
Capital Per capita is K
kL
Growth in capital per capita k K Lg g g
So, from the previous expression, we have
k L
Yg g
K
Growth of capital per capita
Investment Rate
Average product of capital (GDP divided by the capital stock)
Rate of depreciation
Rate of population growth
, ,Y F A K L
Y
K
The key assumed property of production is that capital exhibits diminishing marginal productivity – that is as capital rises relative to labor , its contribution to production of output shrinks.
K2K
Y
3K
So, absent productivity growth, increasing capital will lower the average product of capital
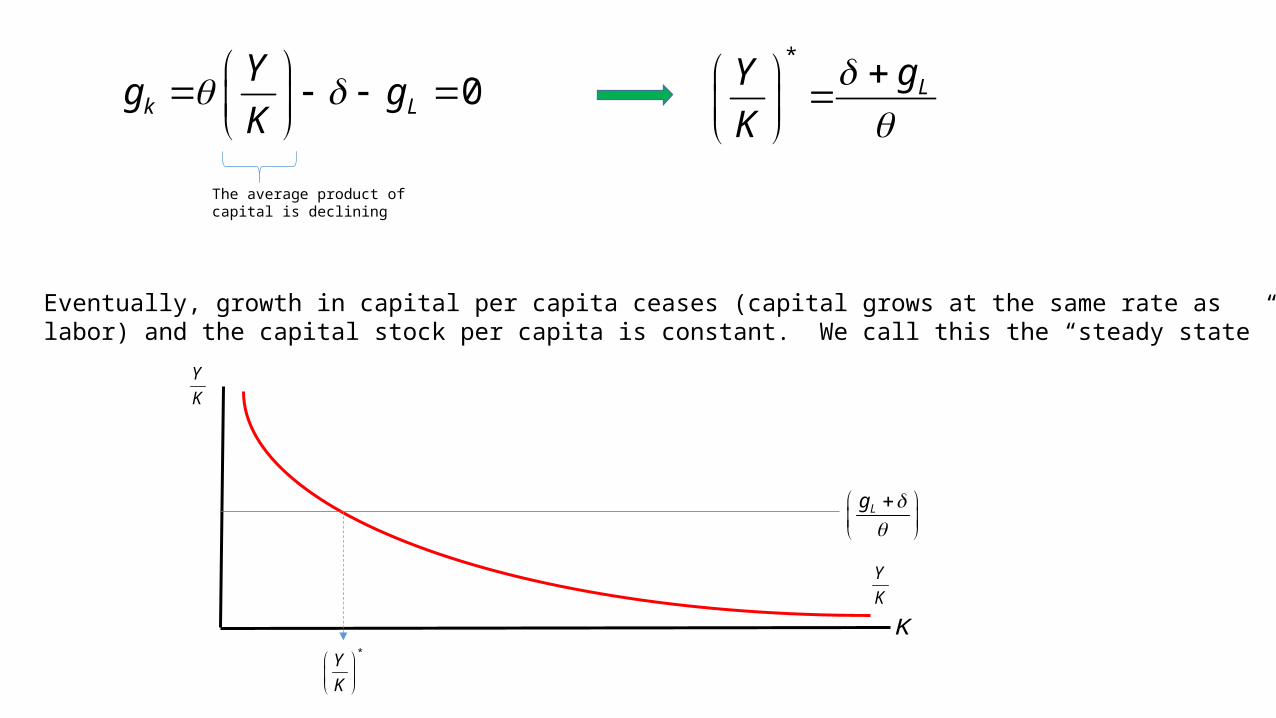
0k L
Yg g
K
The average product of capital is declining
Eventually, growth in capital per capita ceases (capital grows at the same rate as labor) and the capital stock per capita is constant. We call this the “steady state”
Y
K
K
Y
K
Lg
*Y
K
*
LgY
K
, ,Y F A K L
Y
KK
Y
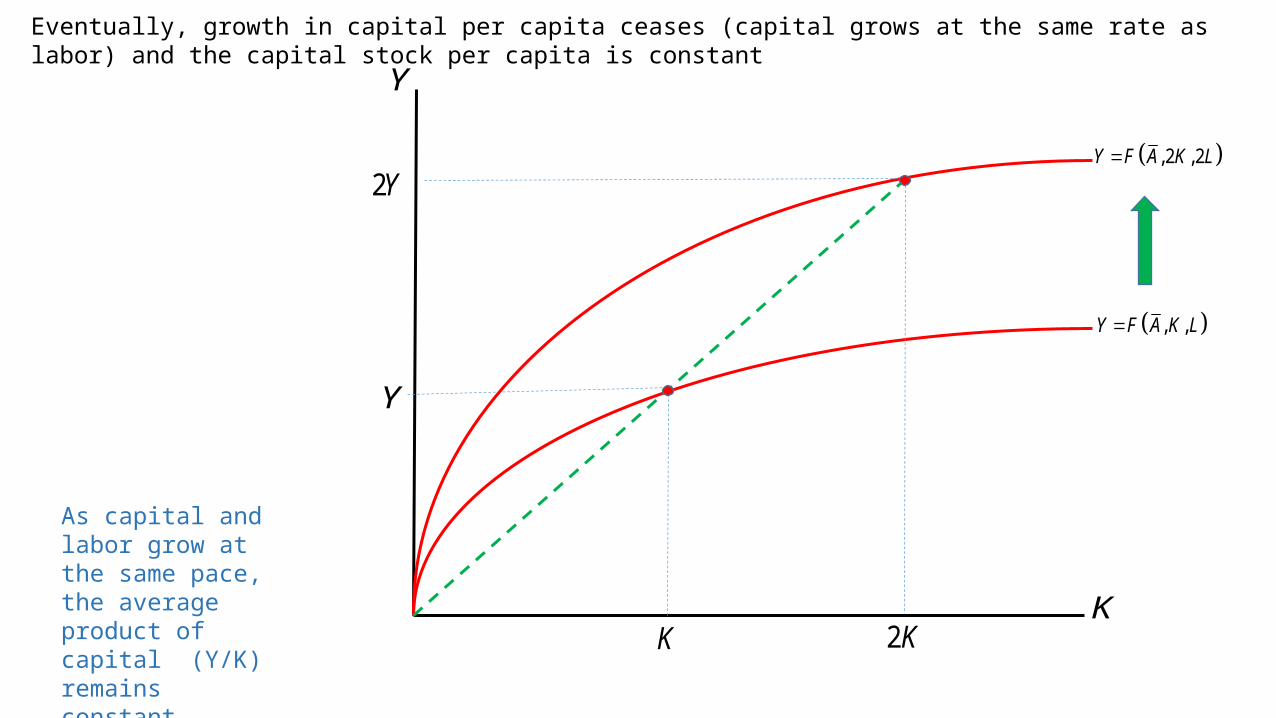
As capital and labor grow at the same pace, the average product of capital (Y/K) remains constant
, 2 , 2Y F A K L
2K
2Y
Eventually, growth in capital per capita ceases (capital grows at the same rate as labor) and the capital stock per capita is constant
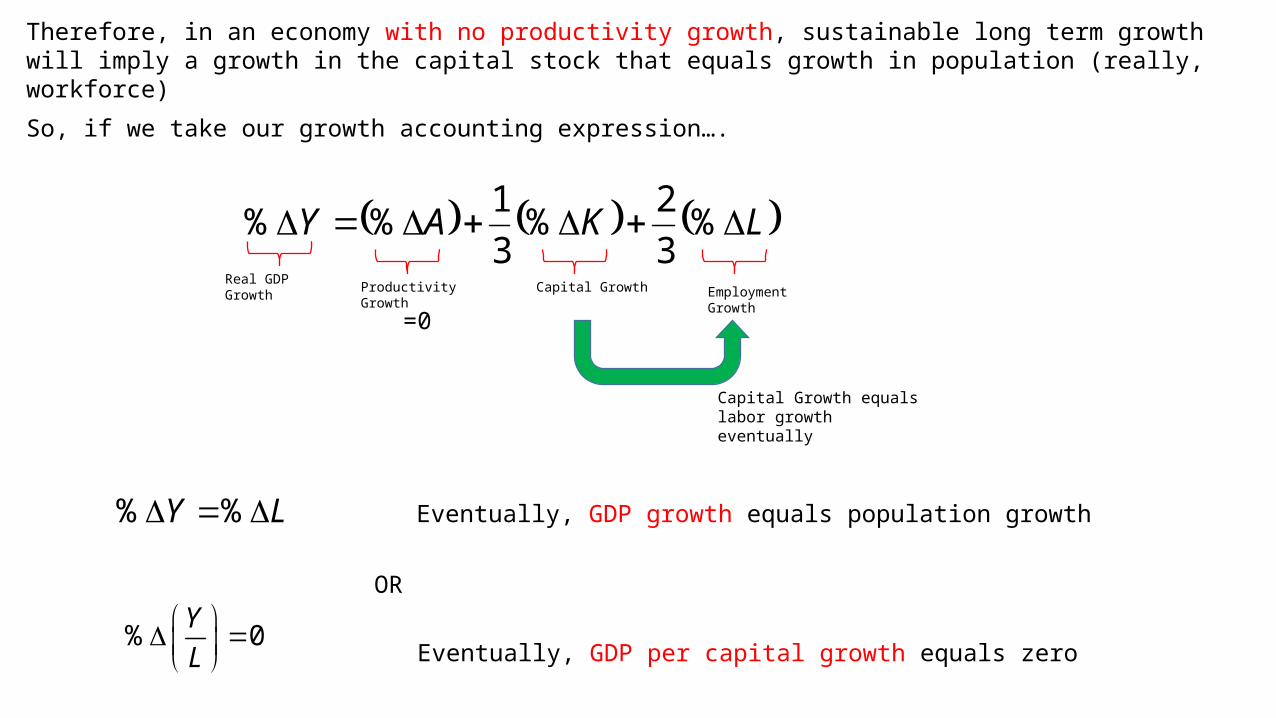
Therefore, in an economy with no productivity growth, sustainable long term growth will imply a growth in the capital stock that equals growth in population (really, workforce)
LKAY %3
2%
3
1%%
Real GDP GrowthEmployment Growth
Capital GrowthProductivity Growth
So, if we take our growth accounting expression….
Capital Growth equals labor growth eventually
% %Y L
% 0Y
L
OR
Eventually, GDP growth equals population growth
Eventually, GDP per capital growth equals zero
=0
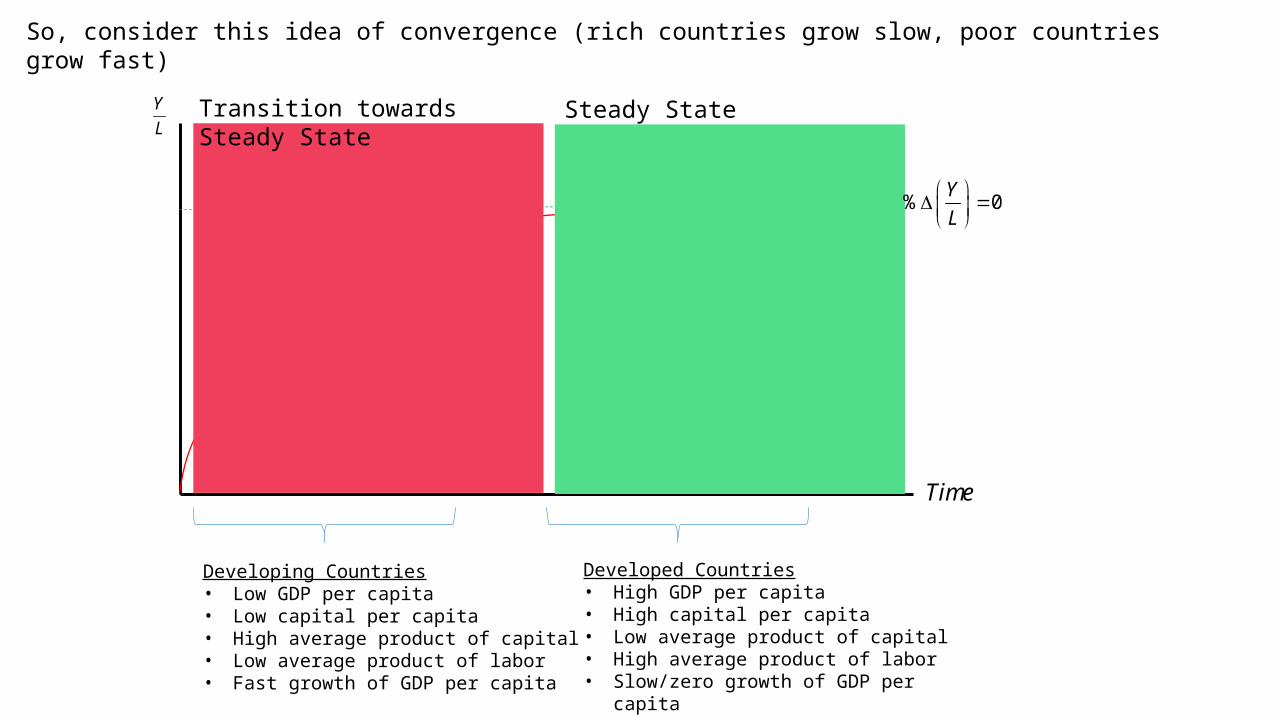
So, consider this idea of convergence (rich countries grow slow, poor countries grow fast)
Y
L
% 0Y
L
Time
Developing Countries• Low GDP per capita• Low capital per capita• High average product of capital• Low average product of labor• Fast growth of GDP per capita
Developed Countries• High GDP per capita• High capital per capita• Low average product of capital• High average product of labor• Slow/zero growth of GDP per capita
Steady StateTransition towards Steady State
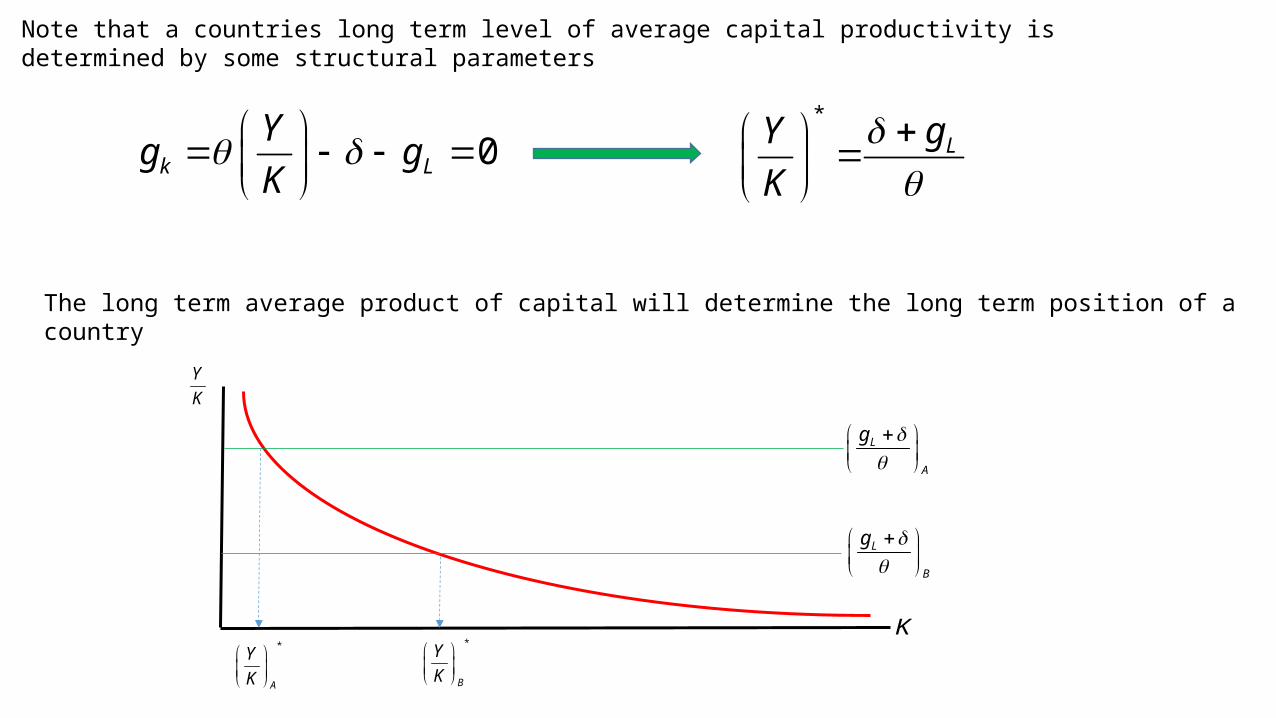
Note that a countries long term level of average capital productivity is determined by some structural parameters
0k L
Yg g
K
K
Y
K
L
A
g
*
A
Y
K
L
B
g
*
B
Y
K
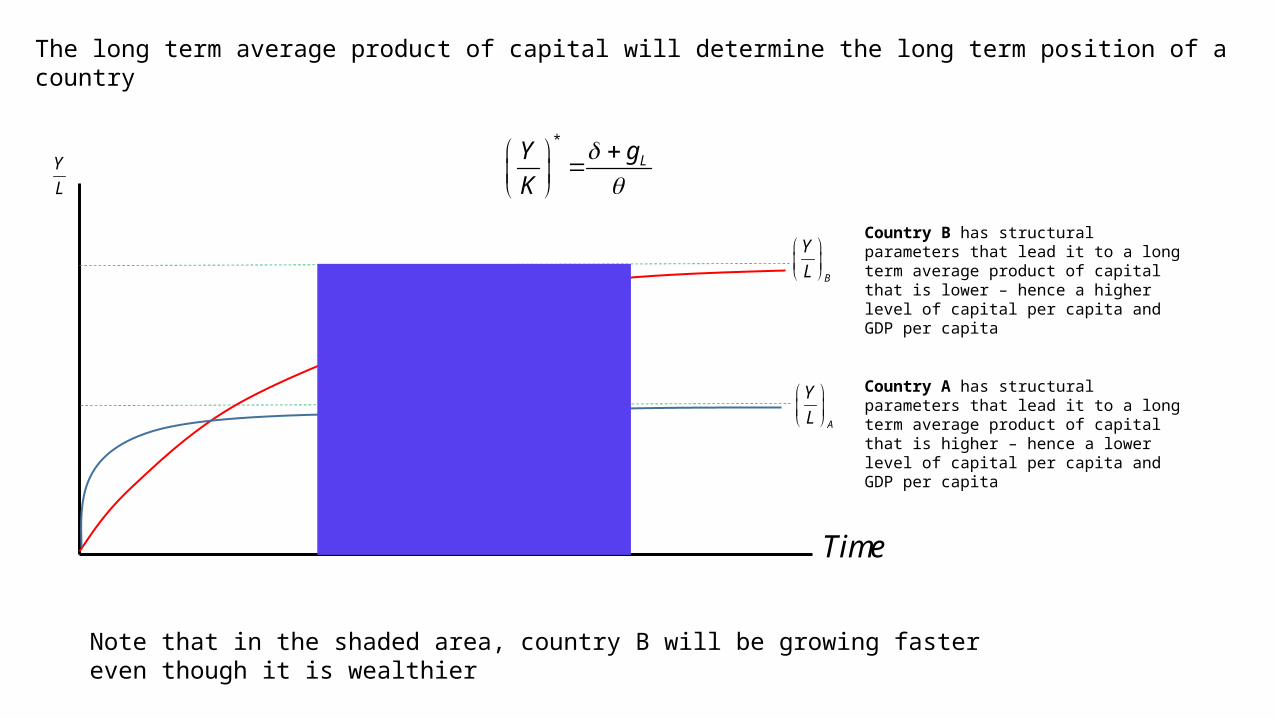
The long term average product of capital will determine the long term position of a country
*
LgY
K
Time
Y
L
A
Y
L
B
Y
L
Country A has structural parameters that lead it to a long term average product of capital that is higher – hence a lower level of capital per capita and GDP per capita
Country B has structural parameters that lead it to a long term average product of capital that is lower – hence a higher level of capital per capita and GDP per capita
Note that in the shaded area, country B will be growing faster even though it is wealthier
The long term average product of capital will determine the long term position of a country
*
LgY
K
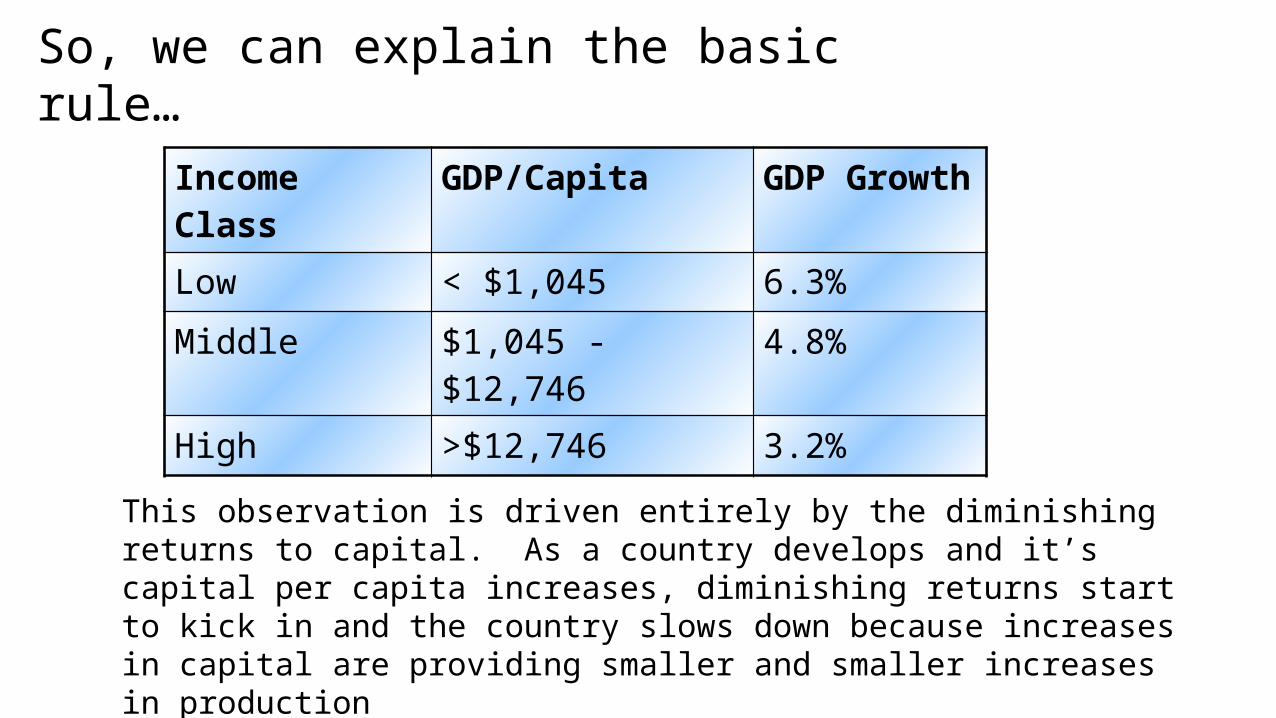
Income Class GDP/Capita GDP Growth
Low < $1,045 6.3%
Middle $1,045 - $12,746 4.8%
High >$12,746 3.2%
So, we can explain the basic rule…
This observation is driven entirely by the diminishing returns to capital. As a country develops and it’s capital per capita increases, diminishing returns start to kick in and the country slows down because increases in capital are providing smaller and smaller increases in production
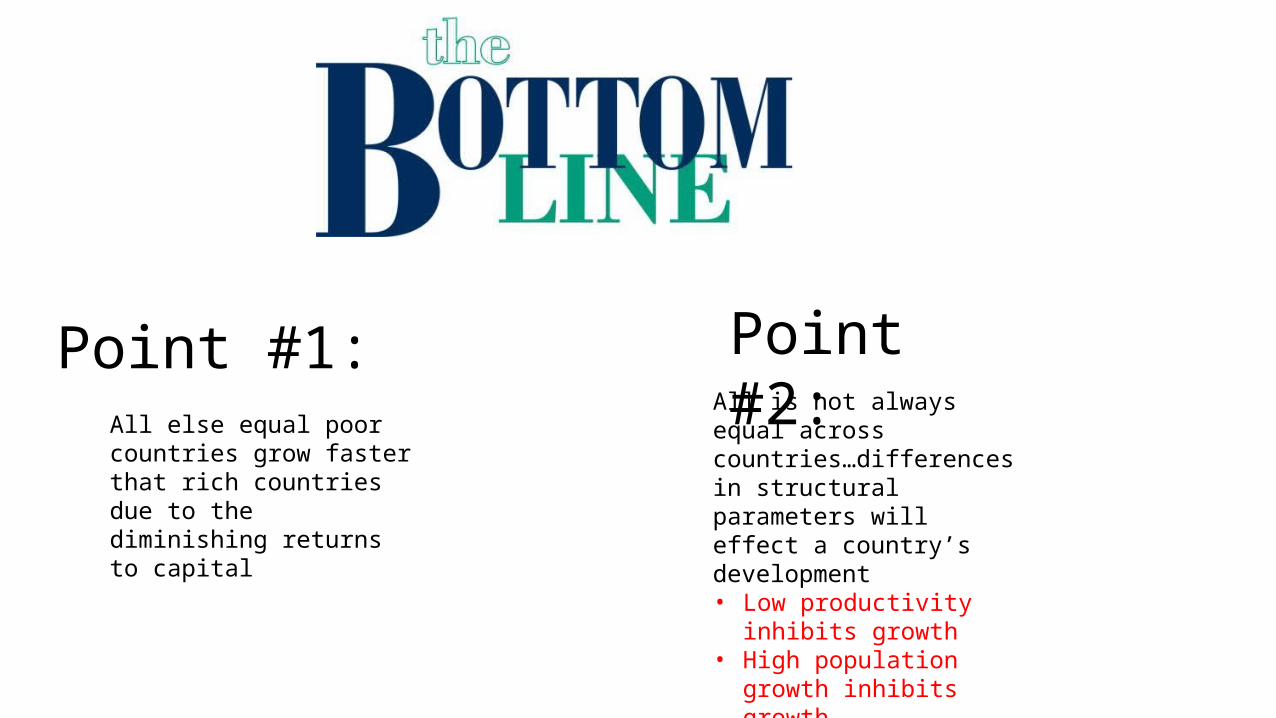
All else equal poor countries grow faster that rich countries due to the diminishing returns to capital
Point #1: Point #2:All is not always equal across countries…differences in structural parameters will effect a country’s development• Low productivity inhibits
growth• High population growth
inhibits growth• Low investment rates inhibit
growth
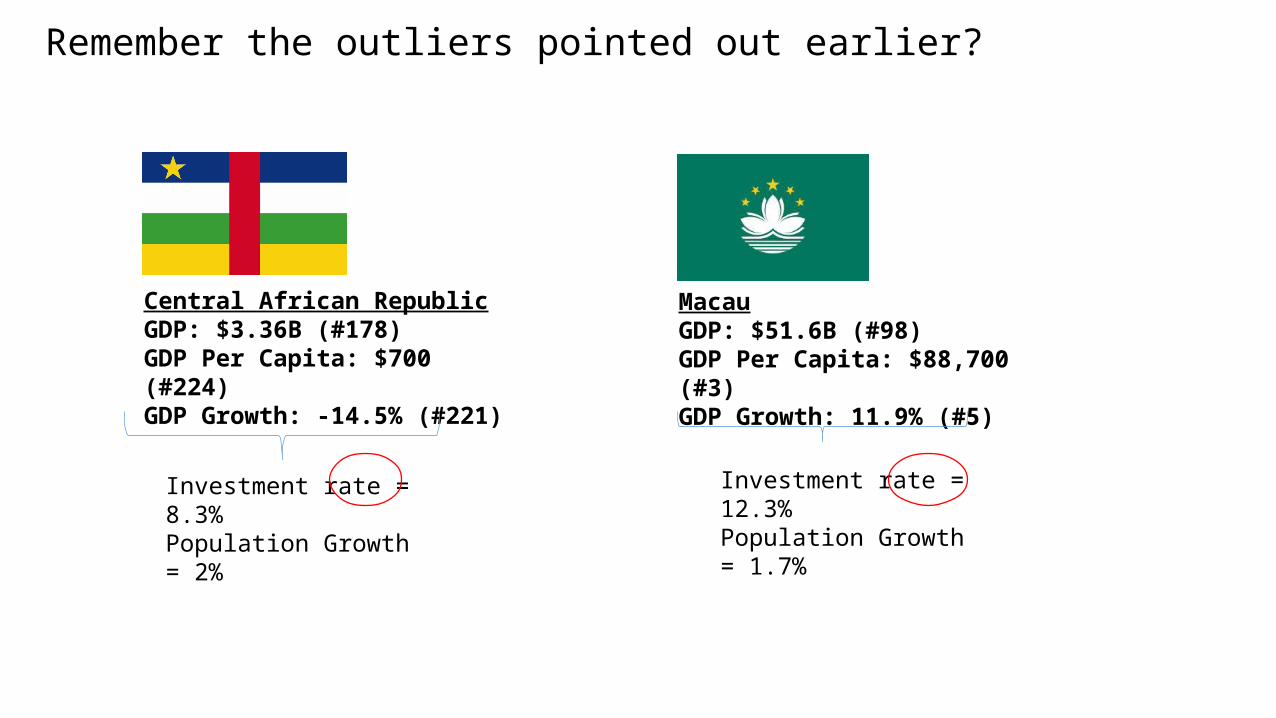
Remember the outliers pointed out earlier?
Central African RepublicGDP: $3.36B (#178)GDP Per Capita: $700 (#224)GDP Growth: -14.5% (#221)
Investment rate = 8.3%Population Growth = 2%
MacauGDP: $51.6B (#98)GDP Per Capita: $88,700 (#3)GDP Growth: 11.9% (#5)
Investment rate = 12.3%Population Growth = 1.7%
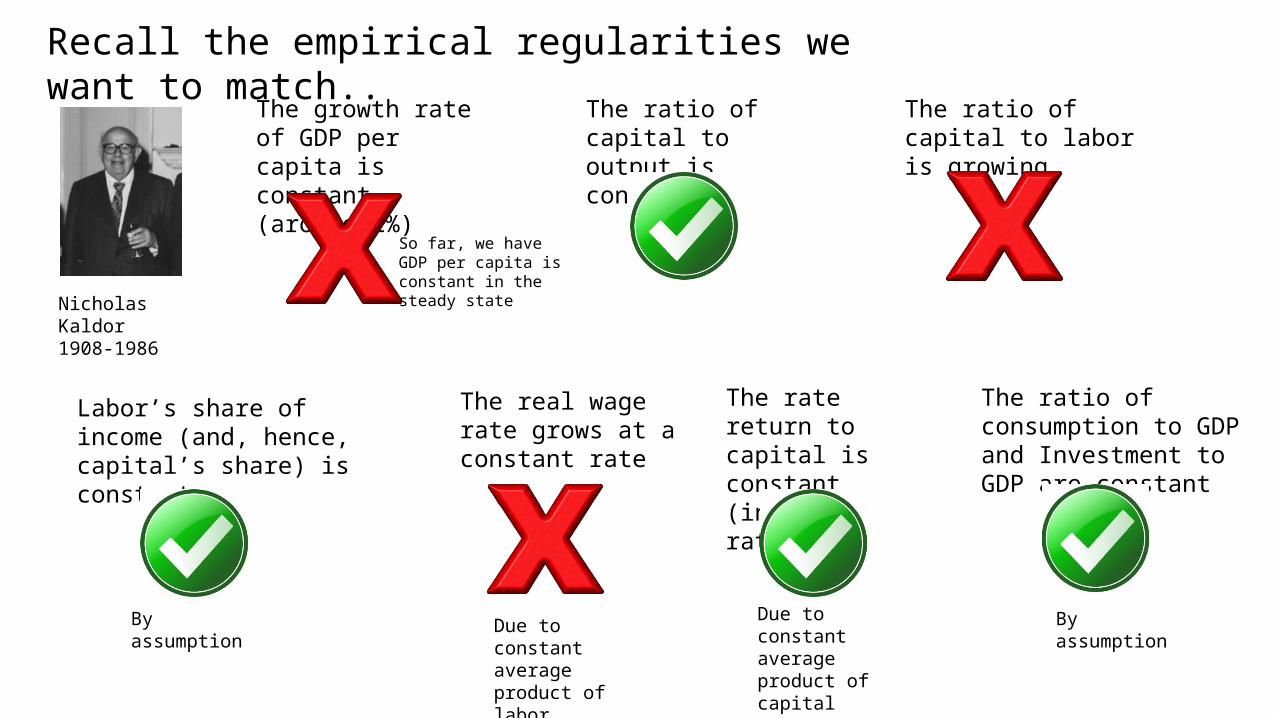
Nicholas Kaldor1908-1986
Recall the empirical regularities we want to match..
The growth rate of GDP per capita is constant (around 2%)
The ratio of capital to output is constant
The ratio of capital to labor is growing
The ratio of consumption to GDP and Investment to GDP are constant
The real wage rate grows at a constant rate
The rate return to capital is constant (interest rate)
Labor’s share of income (and, hence, capital’s share) is constant
So far, we have GDP per capita is constant in the steady state
By assumption By assumptionDue to constant average product of capital
Due to constant average product of labor
, ,Y F A K L
Y
K
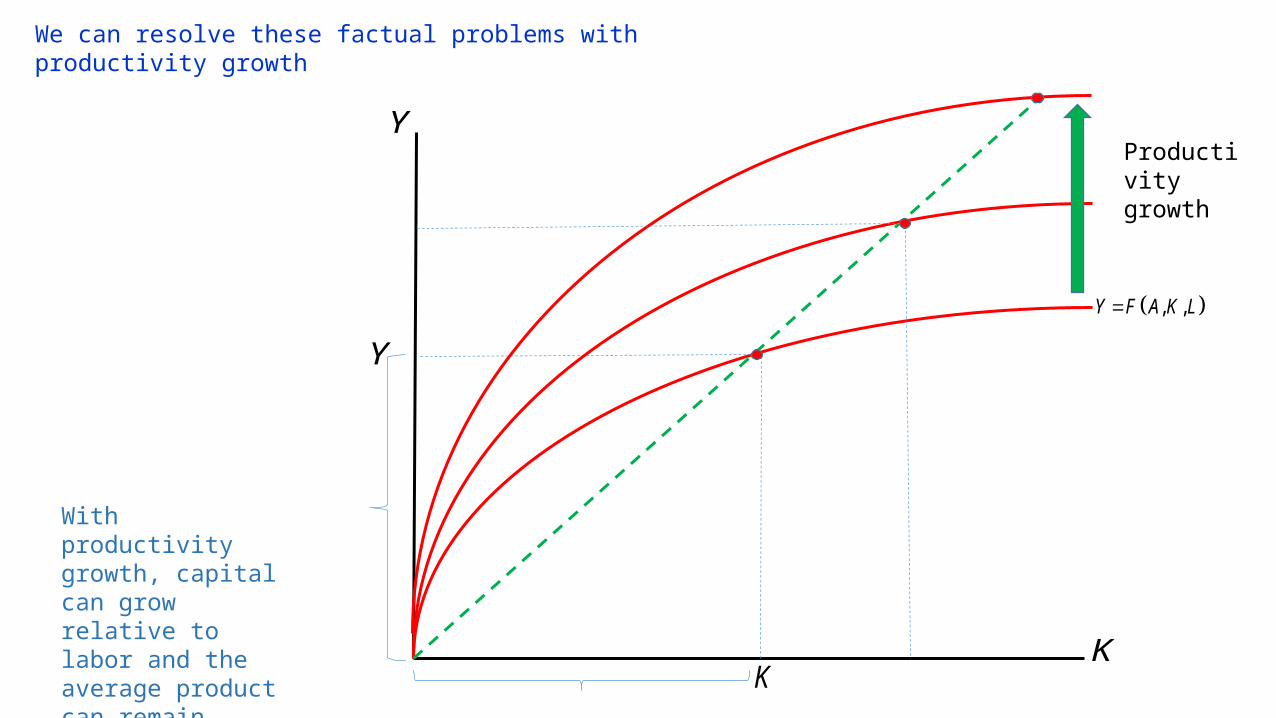
We can resolve these factual problems with productivity growth
K
Y
With productivity growth, capital can grow relative to labor and the average product can remain constant!
Productivity growth
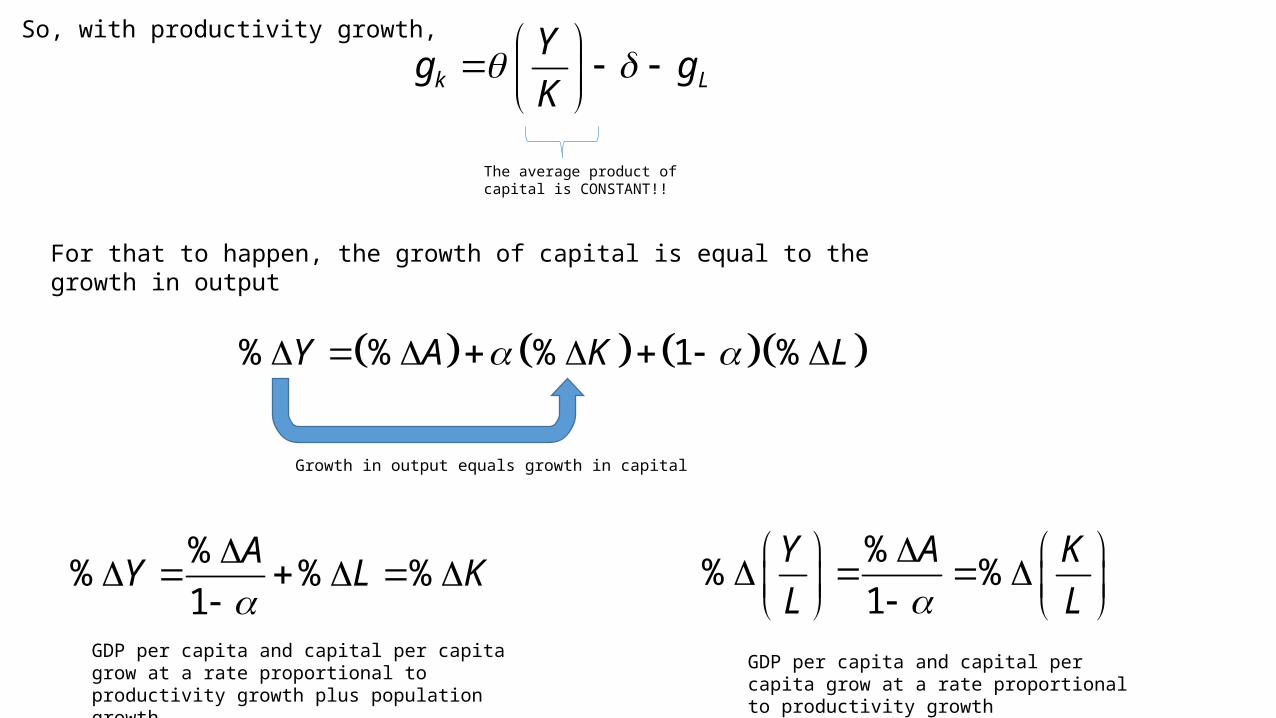
So, with productivity growth,
k L
Yg g
K
The average product of capital is CONSTANT!!
For that to happen, the growth of capital is equal to the growth in output
% % % 1 %Y A K L
Growth in output equals growth in capital
%% % %
1
AY L K
%% %
1
Y A K
L L
GDP per capita and capital per capita grow at a rate proportional to productivity growth
GDP per capita and capital per capita grow at a rate proportional to productivity growth plus population growth
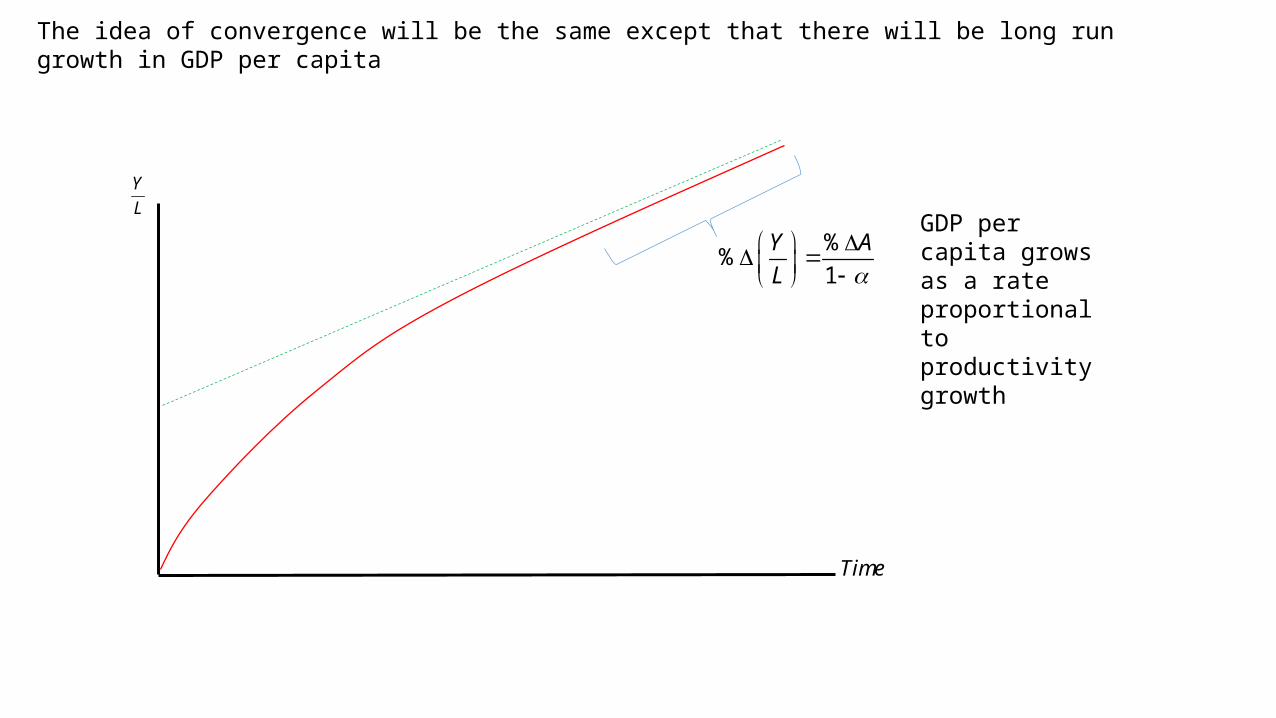
The idea of convergence will be the same except that there will be long run growth in GDP per capita
Time
Y
L
%%
1
Y A
L
GDP per capita grows as a rate proportional to productivity growth
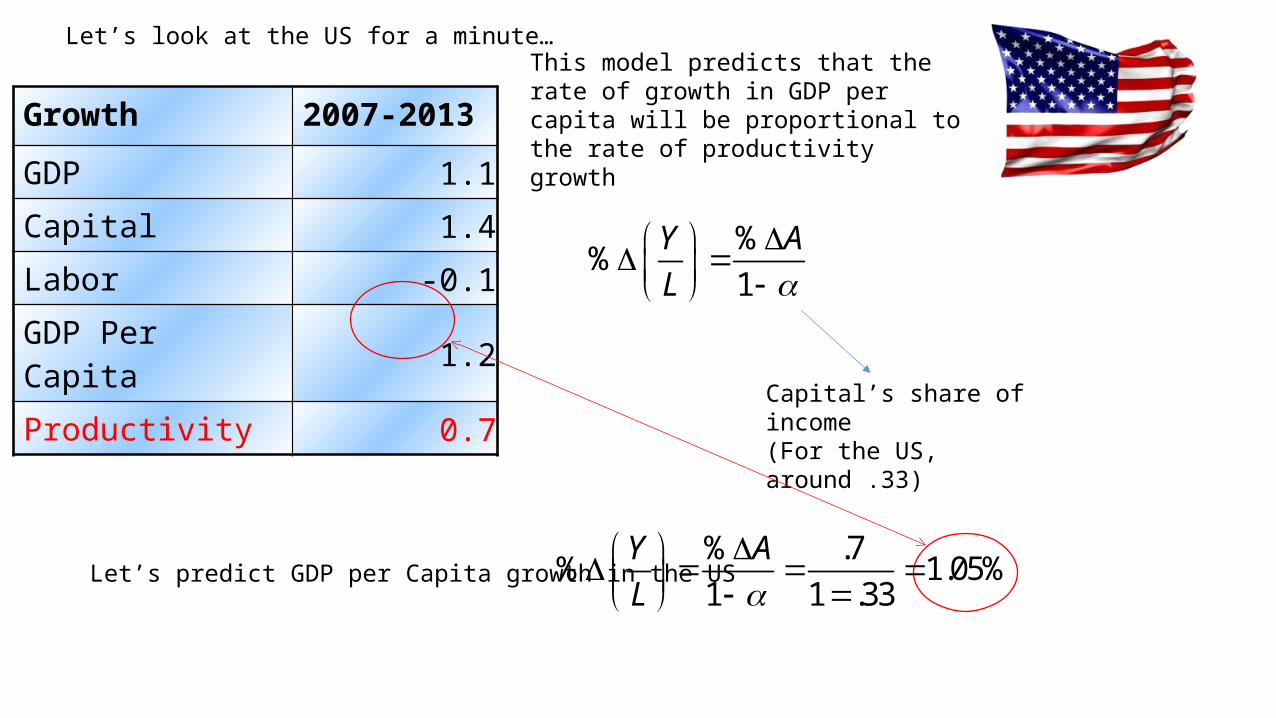
Growth 2007-2013
GDP 1.1
Capital 1.4
Labor -0.1
GDP Per Capita 1.2
Productivity 0.7
Let’s look at the US for a minute…This model predicts that the rate of growth in GDP per capita will be proportional to the rate of productivity growth
%%
1
Y A
L
Capital’s share of income (For the US, around .33)
% .7% 1.05%
1 1 .33
Y A
L
Let’s predict GDP per Capita growth in the US
K
L
Y
L
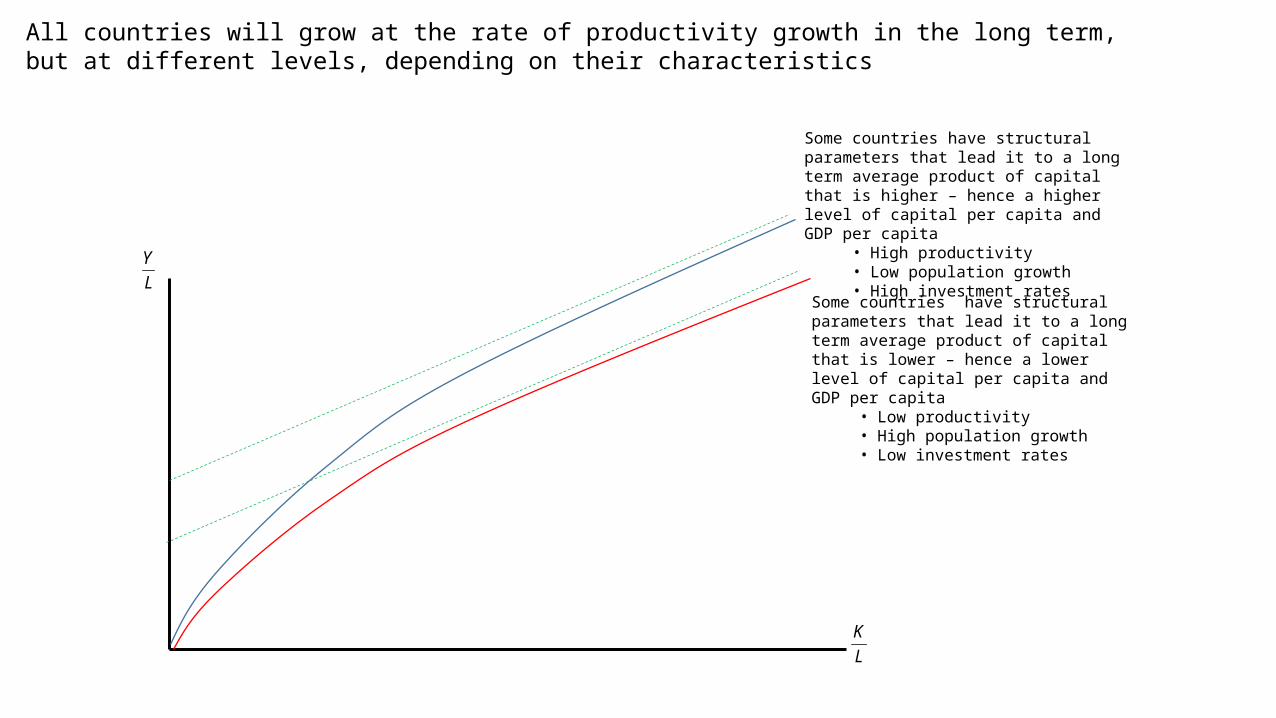
All countries will grow at the rate of productivity growth in the long term, but at different levels, depending on their characteristics
Some countries have structural parameters that lead it to a long term average product of capital that is lower – hence a lower level of capital per capita and GDP per capita
• Low productivity• High population growth• Low investment rates
Some countries have structural parameters that lead it to a long term average product of capital that is higher – hence a higher level of capital per capita and GDP per capita
• High productivity• Low population growth• High investment rates
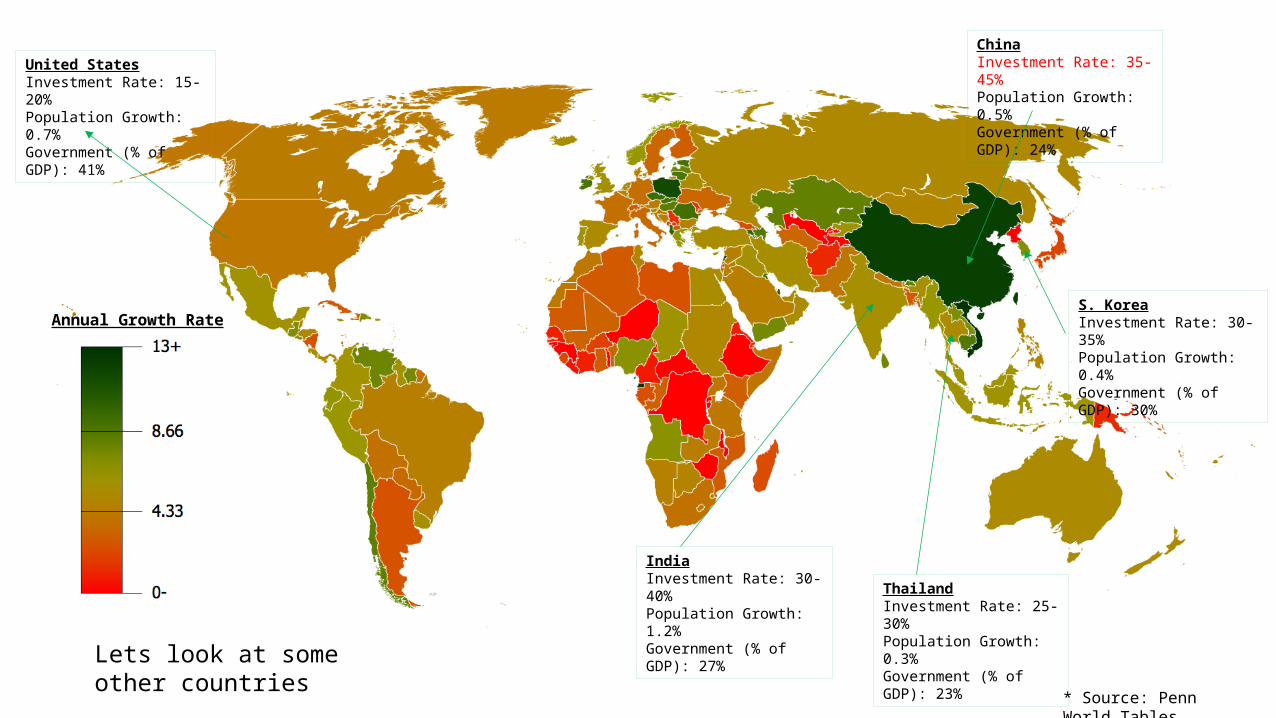
United StatesInvestment Rate: 15-20%Population Growth: 0.7%Government (% of GDP): 41%
ChinaInvestment Rate: 35-45%Population Growth: 0.5%Government (% of GDP): 24%
IndiaInvestment Rate: 30-40%Population Growth: 1.2%Government (% of GDP): 27%
S. KoreaInvestment Rate: 30-35%Population Growth: 0.4%Government (% of GDP): 30%
Annual Growth Rate
ThailandInvestment Rate: 25-30%Population Growth: 0.3%Government (% of GDP): 23%
Lets look at some other countries
* Source: Penn World Tables
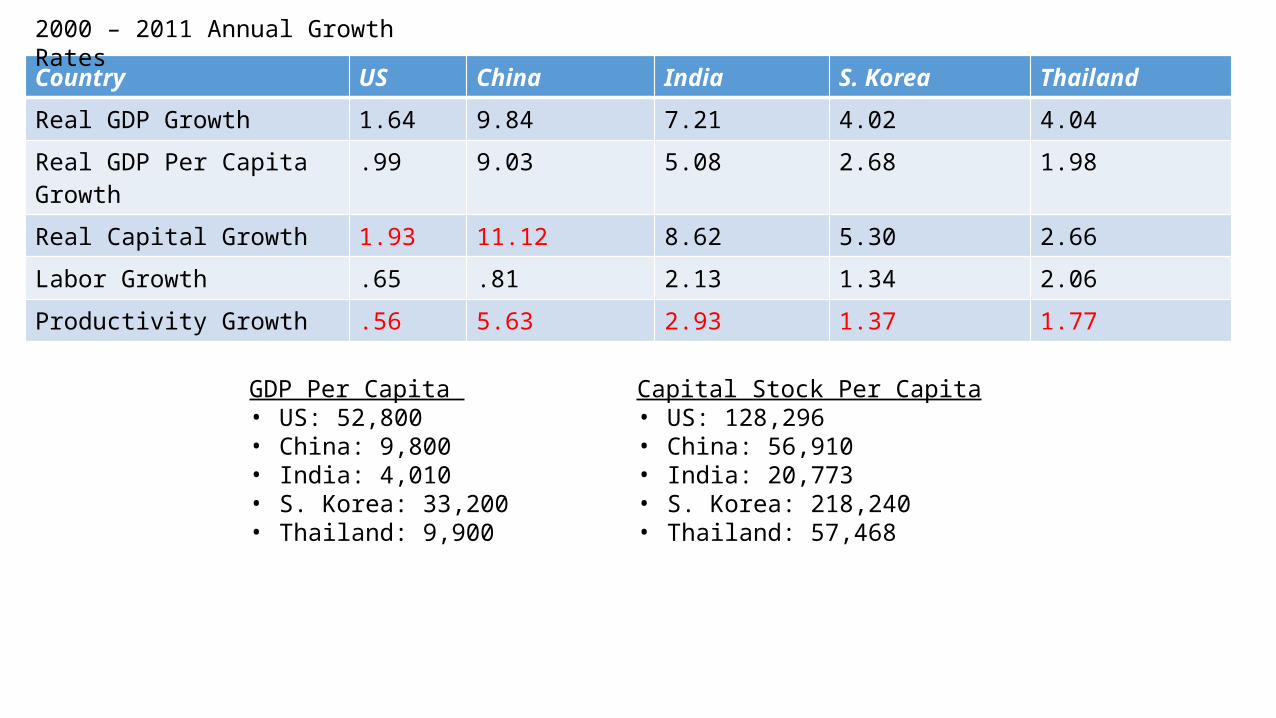
Country US China India S. Korea Thailand
Real GDP Growth 1.64 9.84 7.21 4.02 4.04
Real GDP Per Capita Growth .99 9.03 5.08 2.68 1.98
Real Capital Growth 1.93 11.12 8.62 5.30 2.66
Labor Growth .65 .81 2.13 1.34 2.06
Productivity Growth .56 5.63 2.93 1.37 1.77
2000 – 2011 Annual Growth Rates
GDP Per Capita • US: 52,800• China: 9,800• India: 4,010• S. Korea: 33,200• Thailand: 9,900
Capital Stock Per Capita• US: 128,296• China: 56,910• India: 20,773• S. Korea: 218,240• Thailand: 57,468
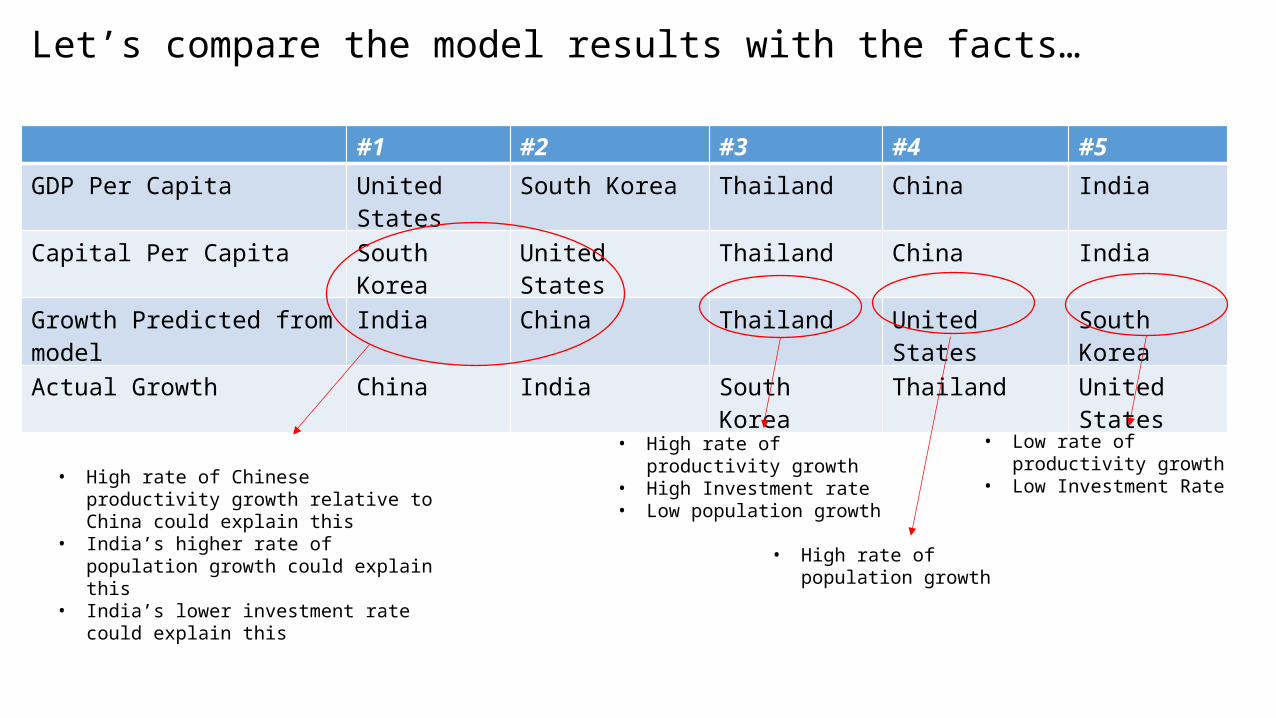
Let’s compare the model results with the facts…
#1 #2 #3 #4 #5
GDP Per Capita United States South Korea Thailand China India
Capital Per Capita South Korea United States Thailand China India
Growth Predicted from model India China Thailand United States South Korea
Actual Growth China India South Korea Thailand United States
• High rate of Chinese productivity growth relative to China could explain this
• India’s higher rate of population growth could explain this
• India’s lower investment rate could explain this
• Low rate of productivity growth• Low Investment Rate
• High rate of productivity growth• High Investment rate • Low population growth
• High rate of population growth
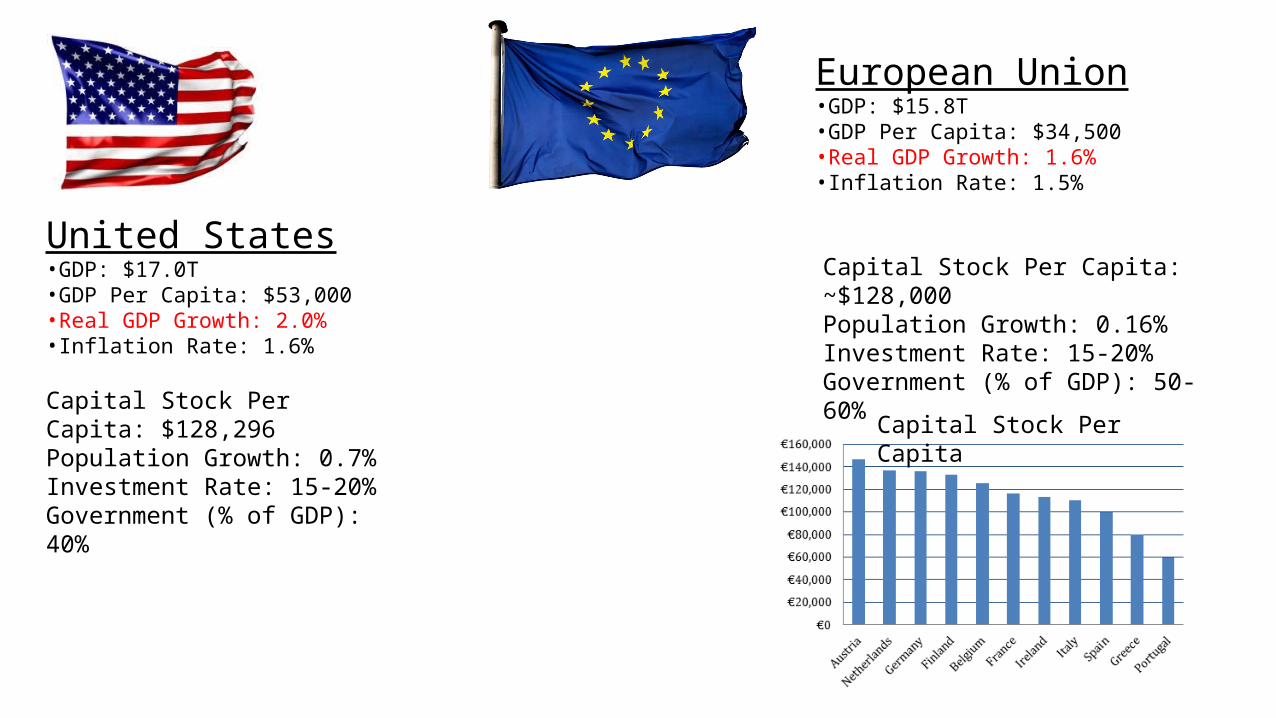
Capital Stock Per Capita: $128,296 Population Growth: 0.7% Investment Rate: 15-20%Government (% of GDP): 40%
Capital Stock Per Capita: ~$128,000Population Growth: 0.16% Investment Rate: 15-20%Government (% of GDP): 50-60%
United States•GDP: $17.0T•GDP Per Capita: $53,000•Real GDP Growth: 2.0%•Inflation Rate: 1.6%
European Union•GDP: $15.8T•GDP Per Capita: $34,500•Real GDP Growth: 1.6%•Inflation Rate: 1.5%
Capital Stock Per Capita
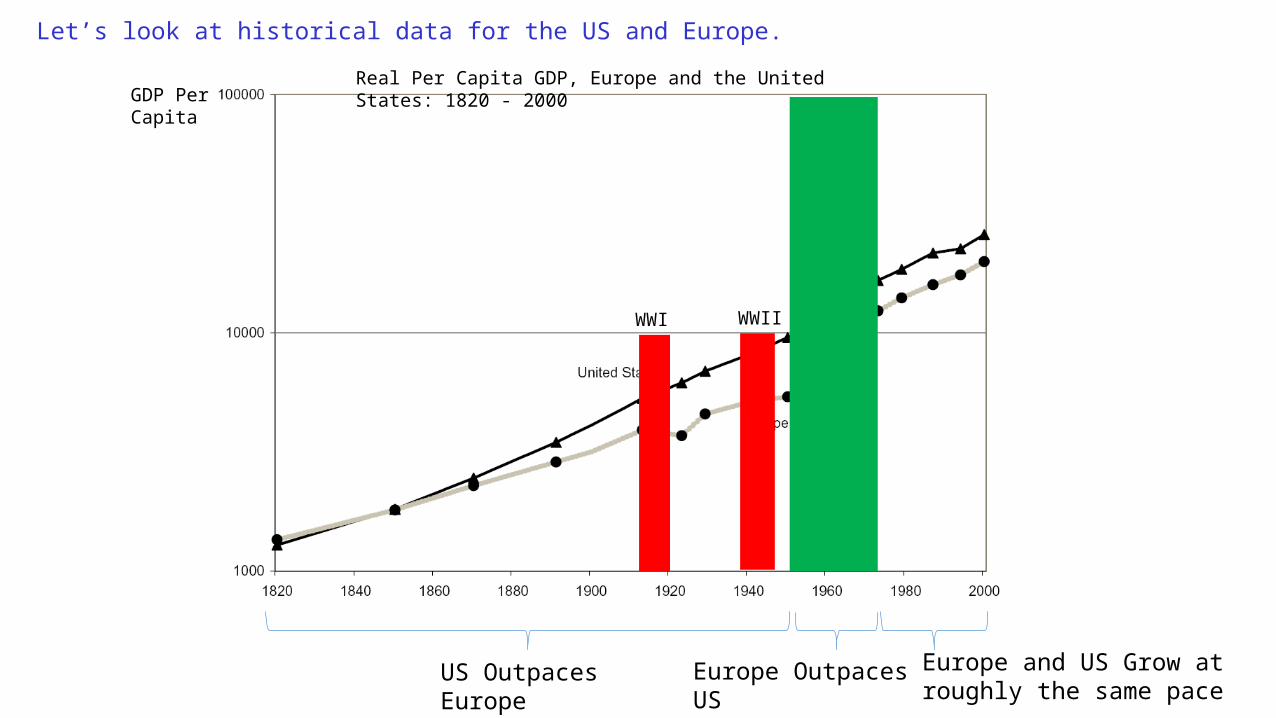
Let’s look at historical data for the US and Europe.
WWI WWII
GDP Per Capita
US Outpaces Europe Europe Outpaces US Europe and US Grow at roughly the same pace
Real Per Capita GDP, Europe and the United States: 1820 - 2000

Here’s American productivity relative to European productivity.
Country Labor Productivity (2004) *
Productivity Growth (1989 -2000)
Productivity Growth (2000-2005)
USA 100 1.7% 2.5%
Germany 92 1.7% 1.0%
France 107 1.5% 1.3%
Italy 92 1.7% 0.0%
England 87 1.8% 2.0%
* USA = 100** Source: OECD
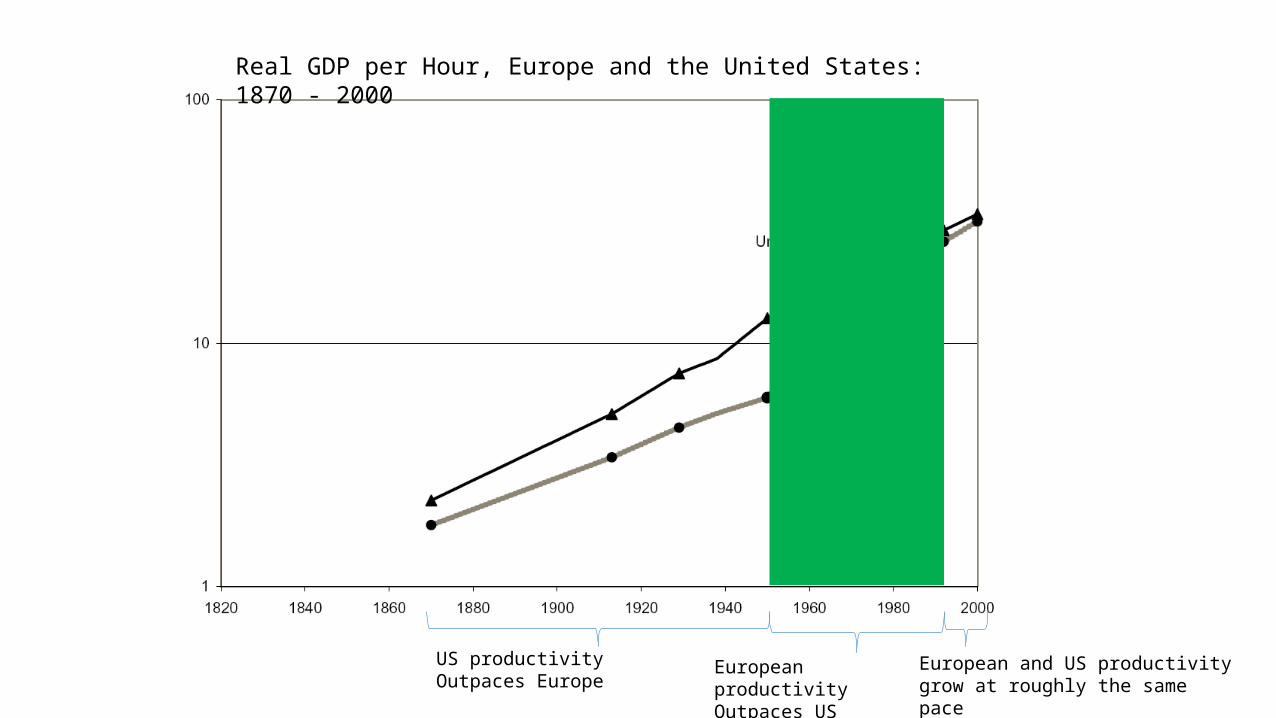
Real GDP per Hour, Europe and the United States: 1870 - 2000
US productivity Outpaces Europe
European productivity Outpaces US
European and US productivity grow at roughly the same pace
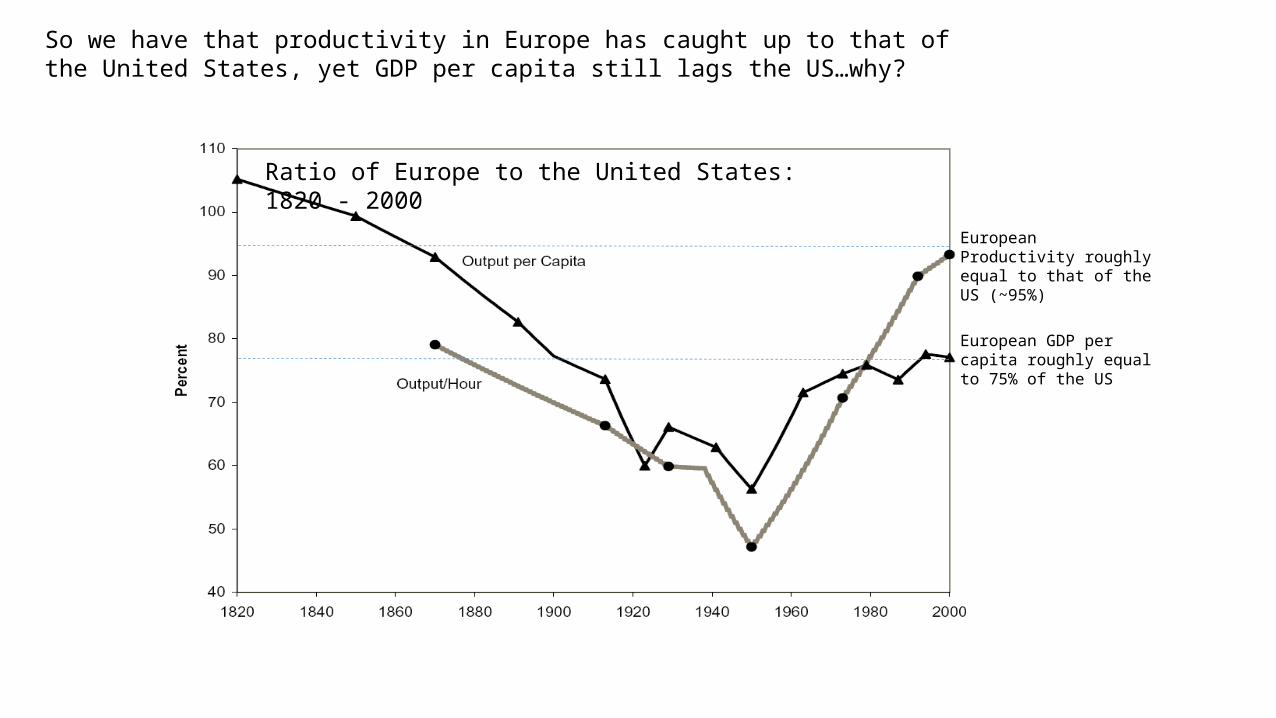
Ratio of Europe to the United States: 1820 - 2000
European Productivity roughly equal to that of the US (~95%)
European GDP per capita roughly equal to 75% of the US
So we have that productivity in Europe has caught up to that of the United States, yet GDP per capita still lags the US…why?
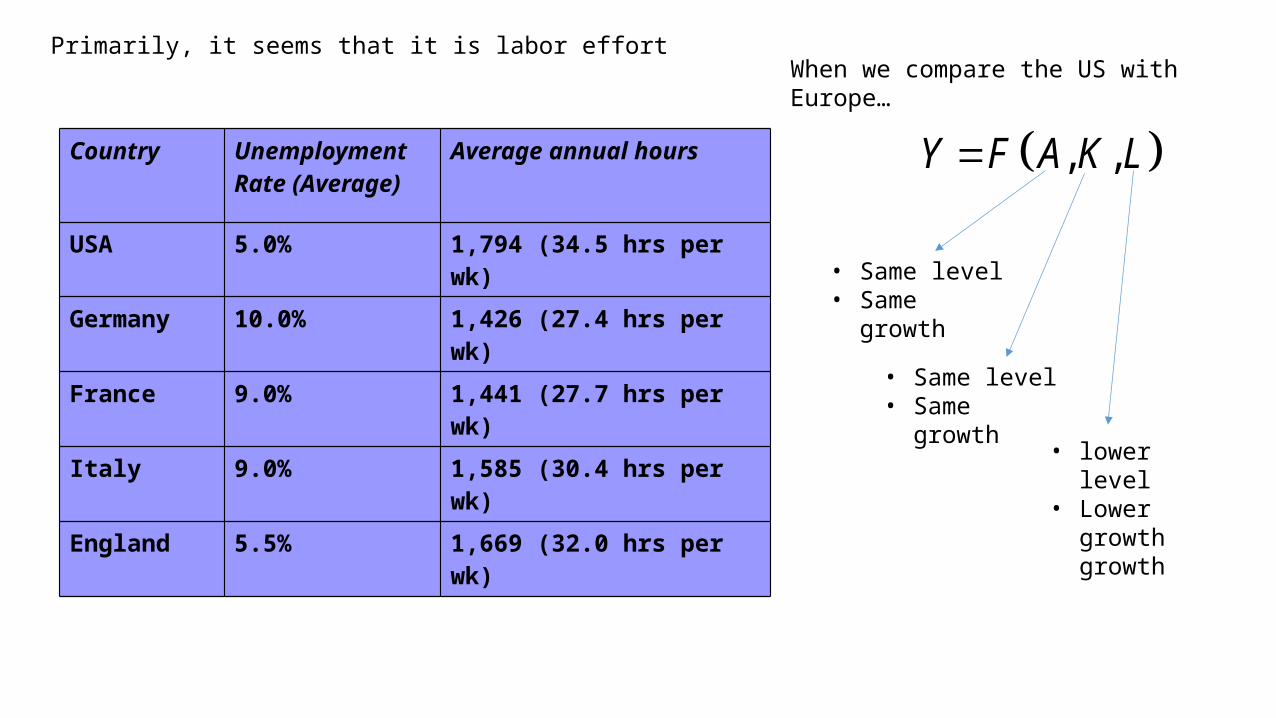
Country Unemployment Rate (Average)
Average annual hours
USA 5.0% 1,794 (34.5 hrs per wk)
Germany 10.0% 1,426 (27.4 hrs per wk)
France 9.0% 1,441 (27.7 hrs per wk)
Italy 9.0% 1,585 (30.4 hrs per wk)
England 5.5% 1,669 (32.0 hrs per wk)
Primarily, it seems that it is labor effort
, ,Y F A K L
When we compare the US with Europe…
• Same level• Same growth
• Same level• Same growth
• lower level• Lower growth
growth
K
L
Y
L
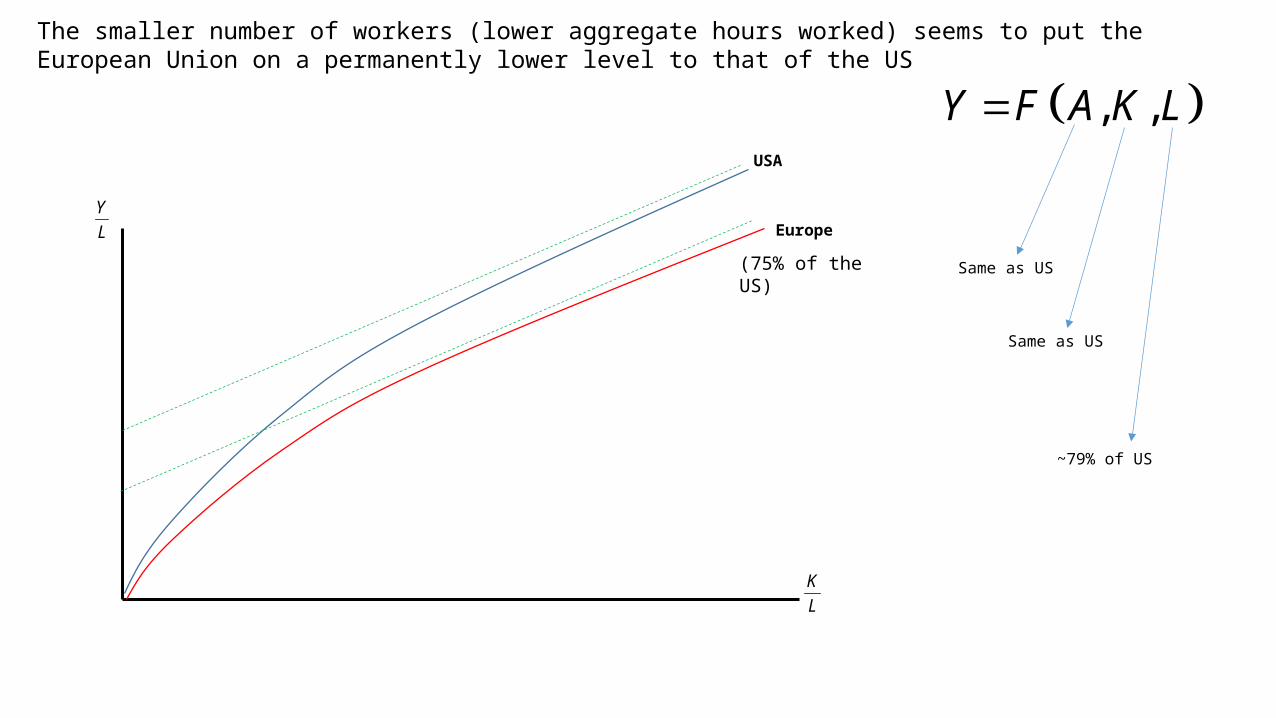
The smaller number of workers (lower aggregate hours worked) seems to put the European Union on a permanently lower level to that of the US
USA
Europe
, ,Y F A K L
(75% of the US) Same as US
Same as US
~79% of US