Embed Size (px)
Citation preview
Low Energy Desalination with Pressure-Retarded Osmosis
Amy E. Childress, Professor Department of Civil and Environmental Engineering
University of Southern California
CalDesal San Diego, CA
October 3, 2013
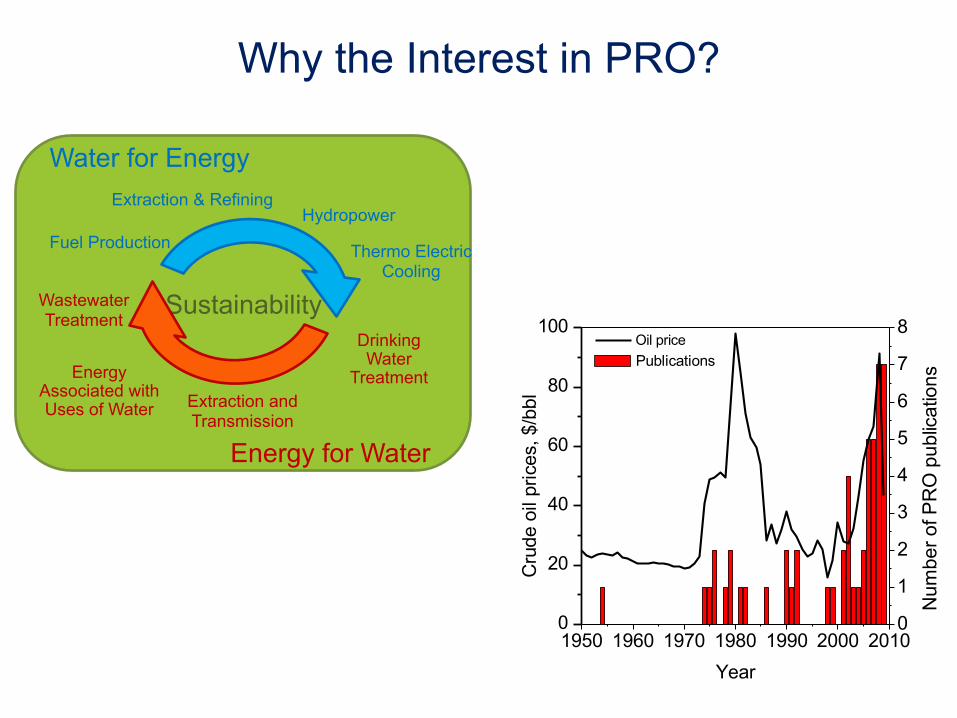
Why the Interest in PRO?
Sustainability
Energy for Water
Water for Energy
Fuel Production
Extraction & Refining Hydropower
Thermo Electric Cooling
Extraction and Transmission
Drinking Water
Treatment Energy Associated with Uses of Water
Wastewater Treatment
1950 1960 1970 1980 1990 2000 20100
1
2
3
4
5
6
7
8
Cru
de o
il pr
ices
, $/b
bl
Year
Publications
0
20
40
60
80
100
Num
ber o
f PR
O p
ublic
atio
ns
Oil price

First experimental (10 kW) installation November 24, 2009
Investing in and inspiring PRO and FO membrane and module development
PRO in the News Statkraft – Norwegian state-owned electric company
3
Power density: 1.5 W/m2
Target: 5 W/m2
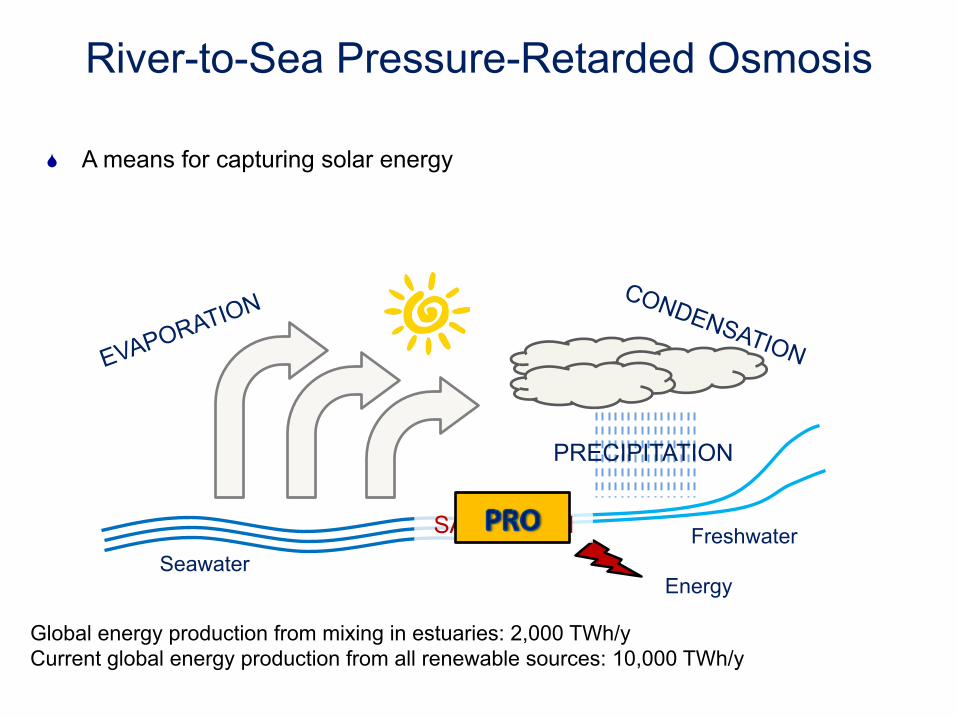
Global energy production from mixing in estuaries: 2,000 TWh/y Current global energy production from all renewable sources: 10,000 TWh/y
Energy Seawater
Freshwater
PRECIPITATION
SALINATION
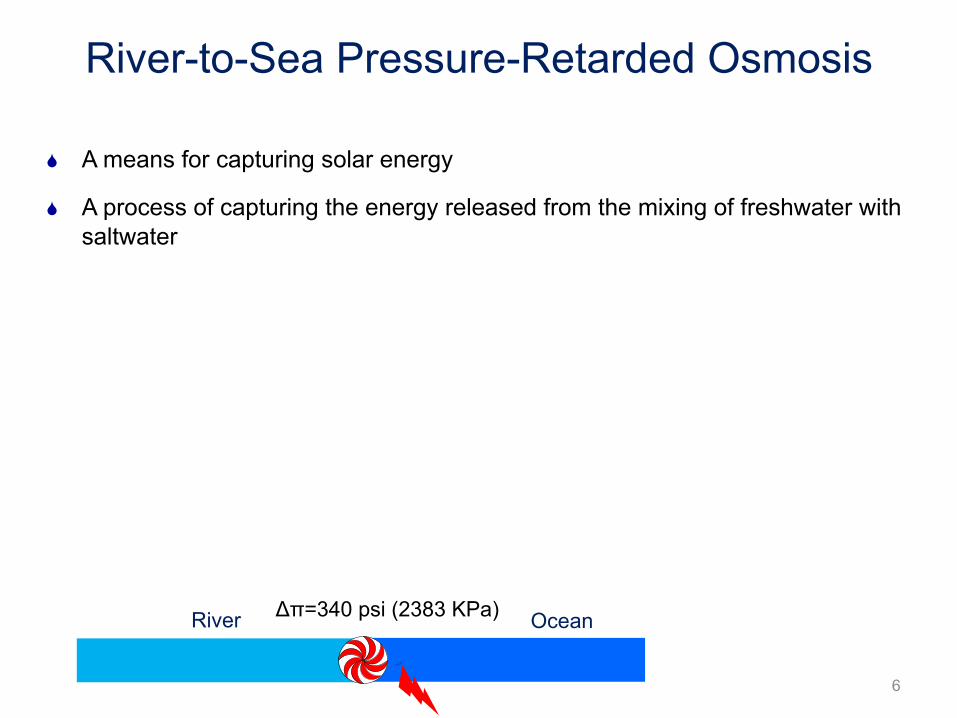
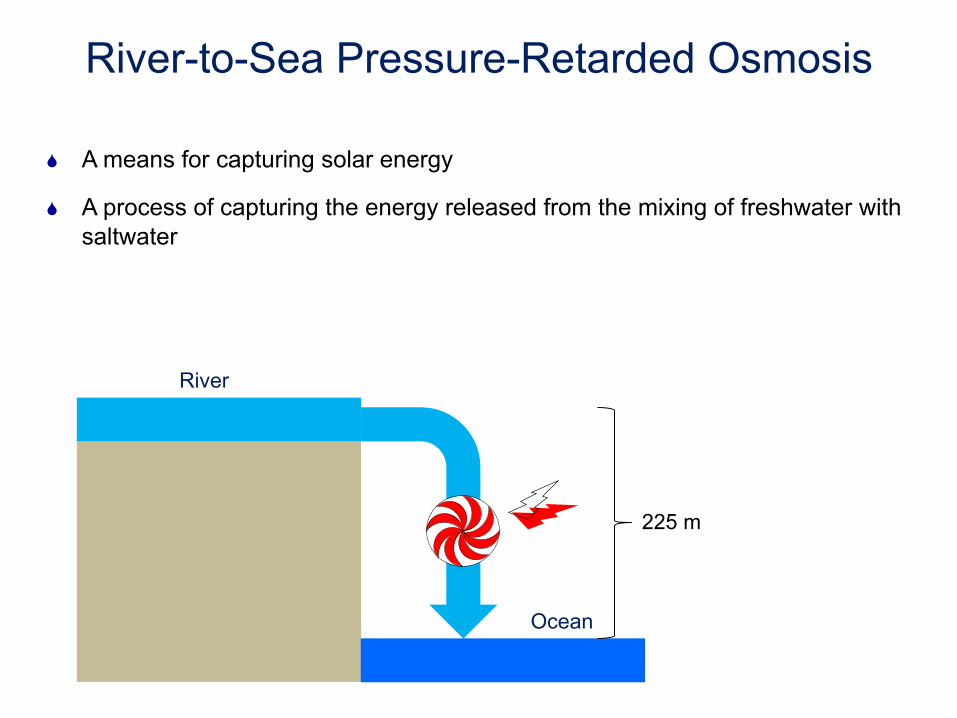
River-to-Sea Pressure-Retarded Osmosis
S A means for capturing solar energy
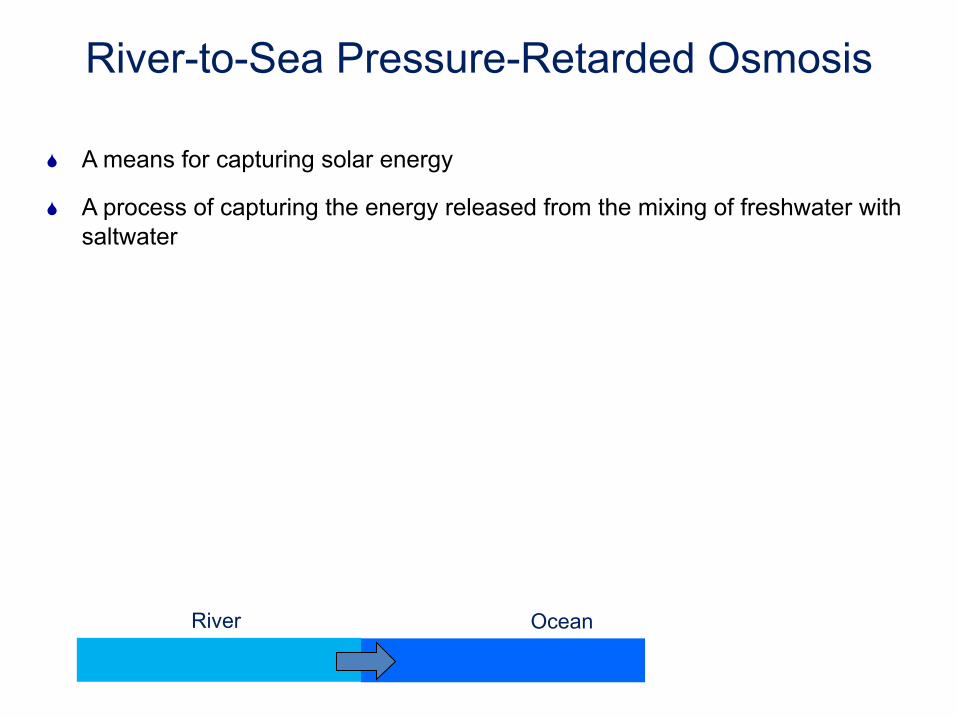
River Ocean
S A means for capturing solar energy
S A process of capturing the energy released from the mixing of freshwater with saltwater
River-to-Sea Pressure-Retarded Osmosis
River Ocean
S A means for capturing solar energy
S A process of capturing the energy released from the mixing of freshwater with saltwater
River-to-Sea Pressure-Retarded Osmosis
6
Δπ=340 psi (2383 KPa)
River
Ocean
225 m
S A means for capturing solar energy
S A process of capturing the energy released from the mixing of freshwater with saltwater
River-to-Sea Pressure-Retarded Osmosis
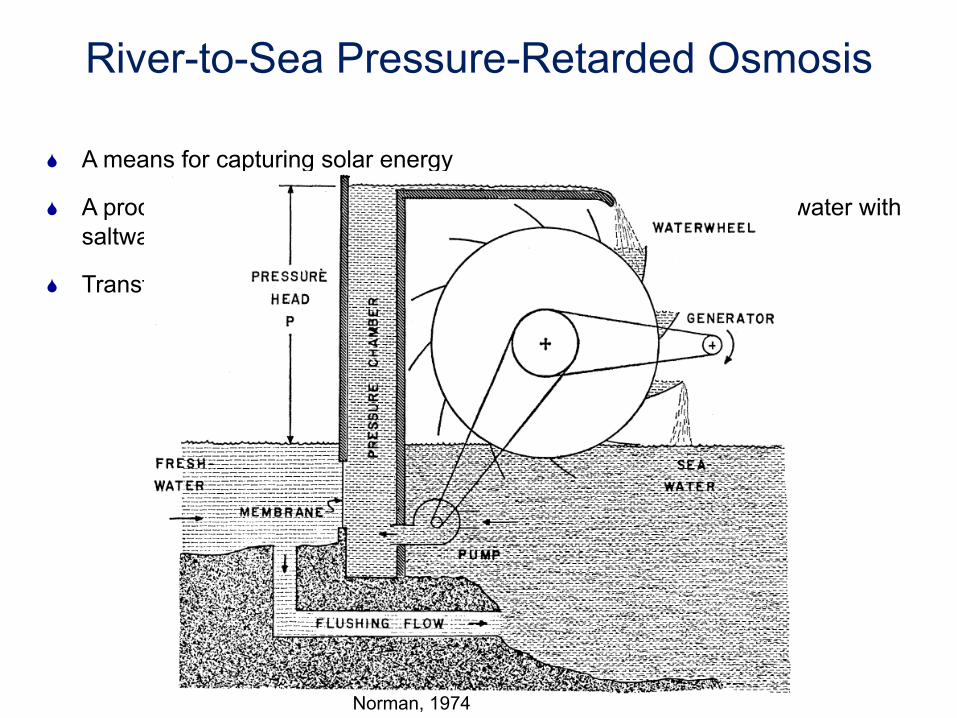
S A means for capturing solar energy
S A process of capturing the energy released from the mixing of freshwater with saltwater
S Transformation of chemical potential to hydraulic potential
River-to-Sea Pressure-Retarded Osmosis
Norman, 1974
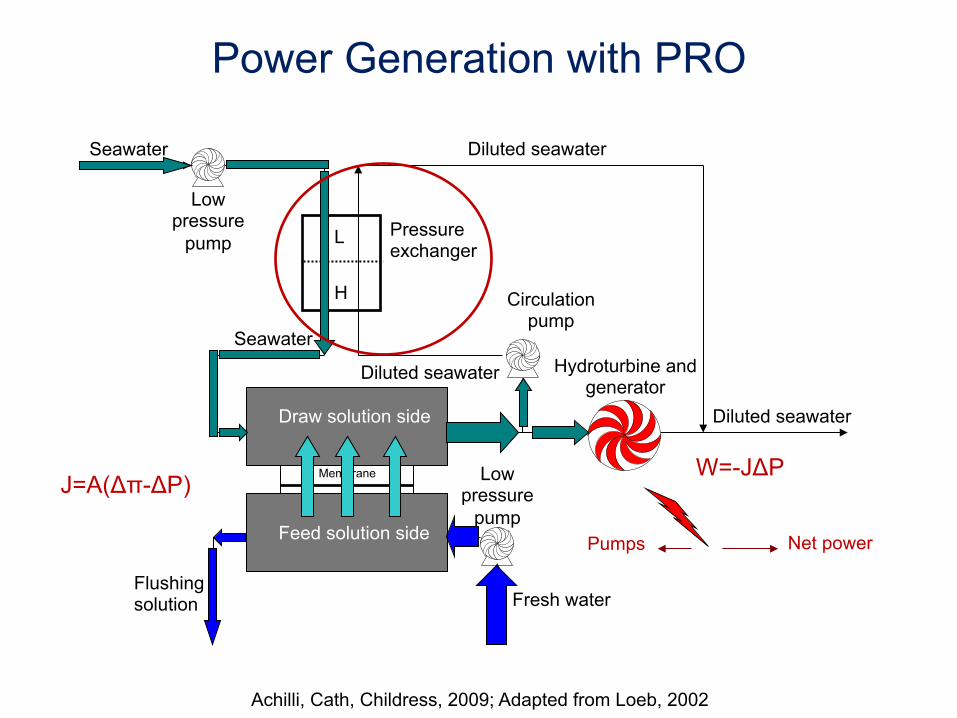
Achilli, Cath, Childress, 2009; Adapted from Loeb, 2002
Diluted seawater
Low pressure
pump
Low pressure
pump
Seawater
Pressure exchanger
Circulation pump
Diluted seawater
Fresh water Flushing solution
Hydroturbine and generator
Draw solution side
Feed solution side
Seawater
Diluted seawater
Pumps
Membrane
Net power
H
L
Power Generation with PRO
J=A(Δπ-ΔP) W=-JΔP
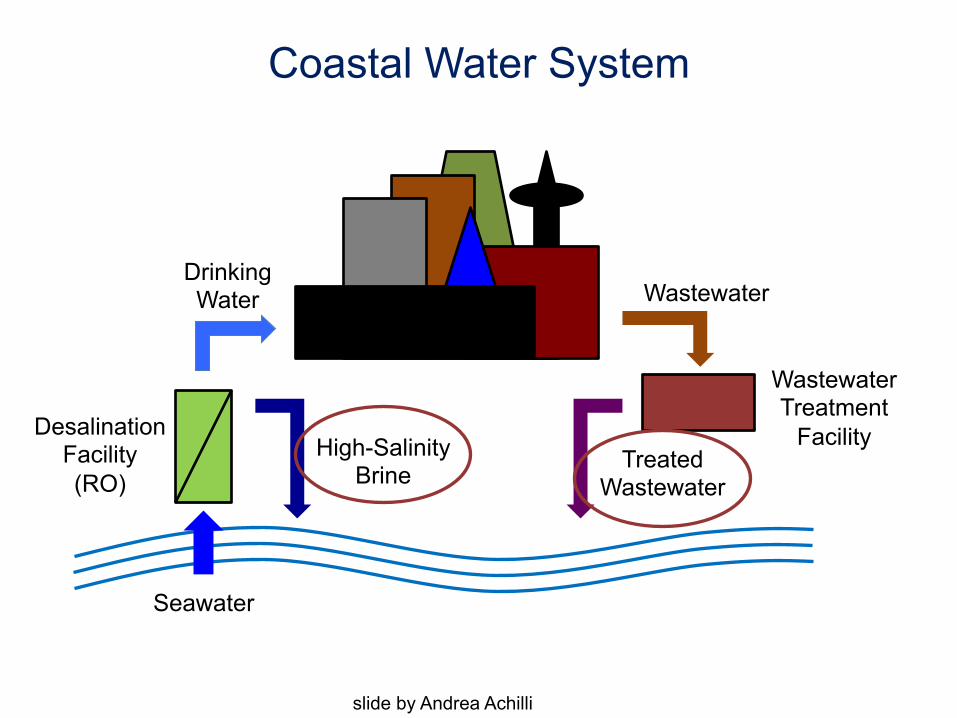
Coastal Water System
Seawater
Desalination Facility (RO)
Drinking Water
High-Salinity Brine
Wastewater Treatment
Facility
Wastewater
Treated Wastewater
slide by Andrea Achilli
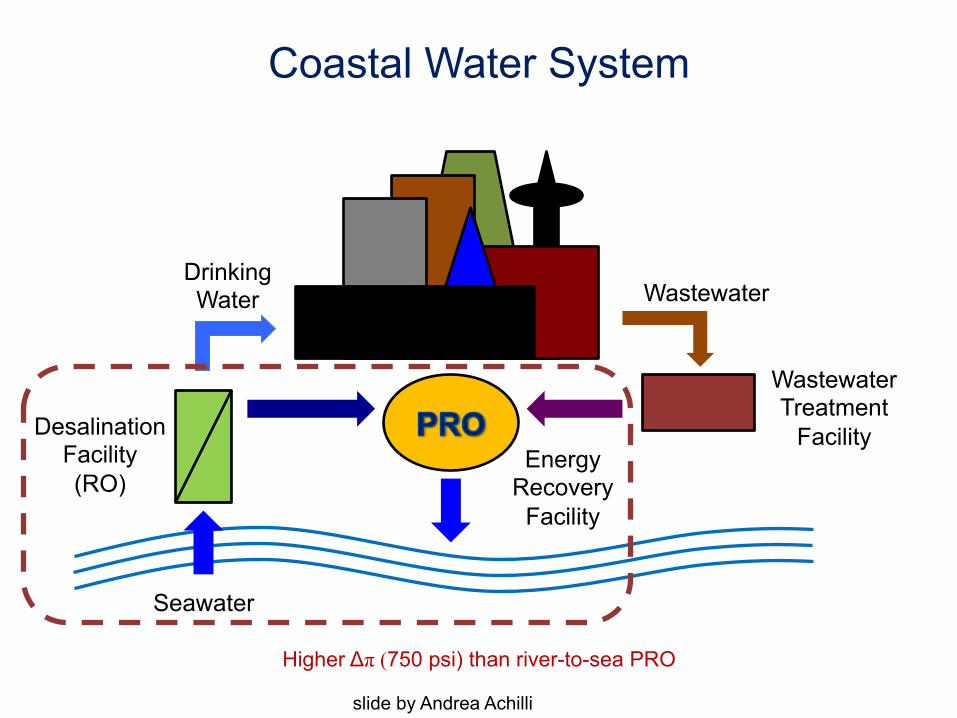
Coastal Water System
Seawater
Desalination Facility (RO)
Drinking Water
Wastewater Treatment
Facility
Wastewater
Energy Recovery
Facility
Higher Δπ (750 psi) than river-to-sea PRO
slide by Andrea Achilli
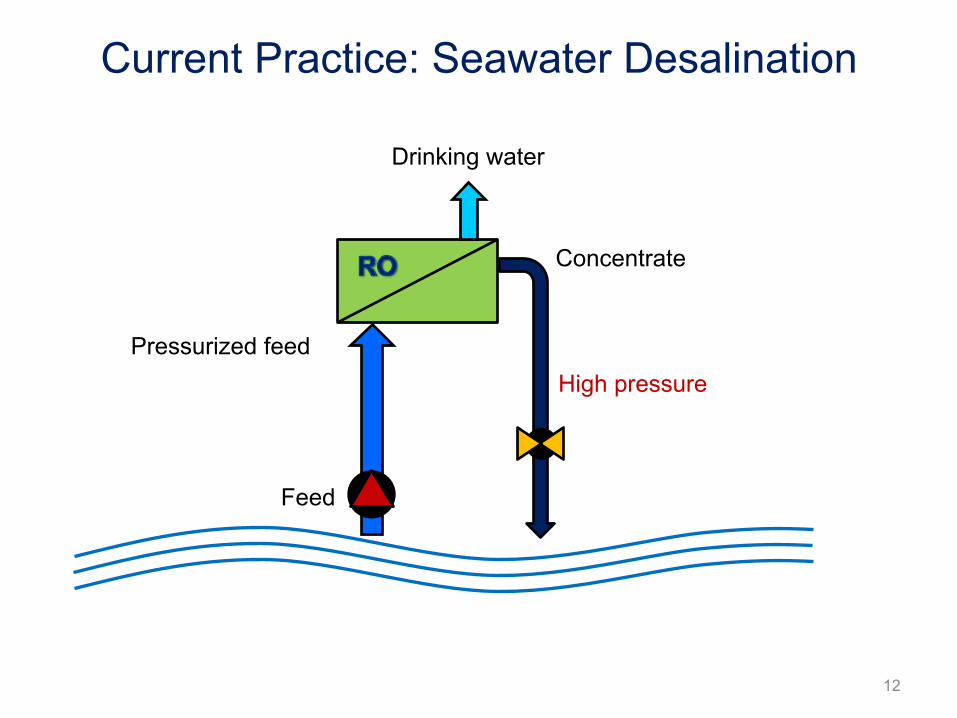
Drinking water
Concentrate
High pressure
Feed
Pressurized feed
Current Practice: Seawater Desalination
12
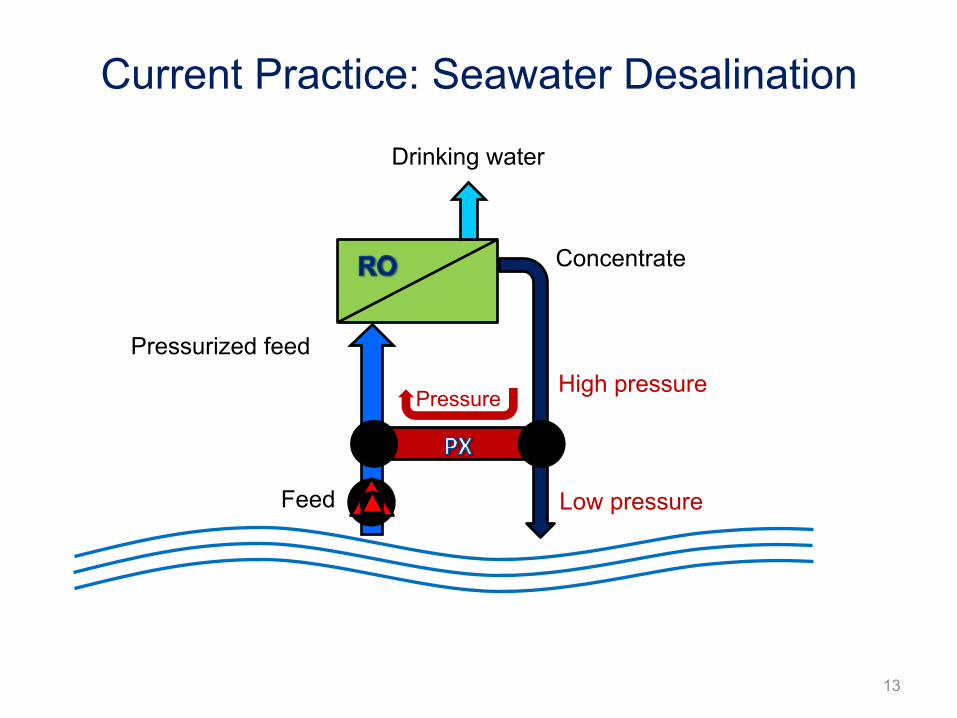
Drinking water
Concentrate
High pressure
Low pressure
Pressure
Feed
Pressurized feed
Current Practice: Seawater Desalination
13
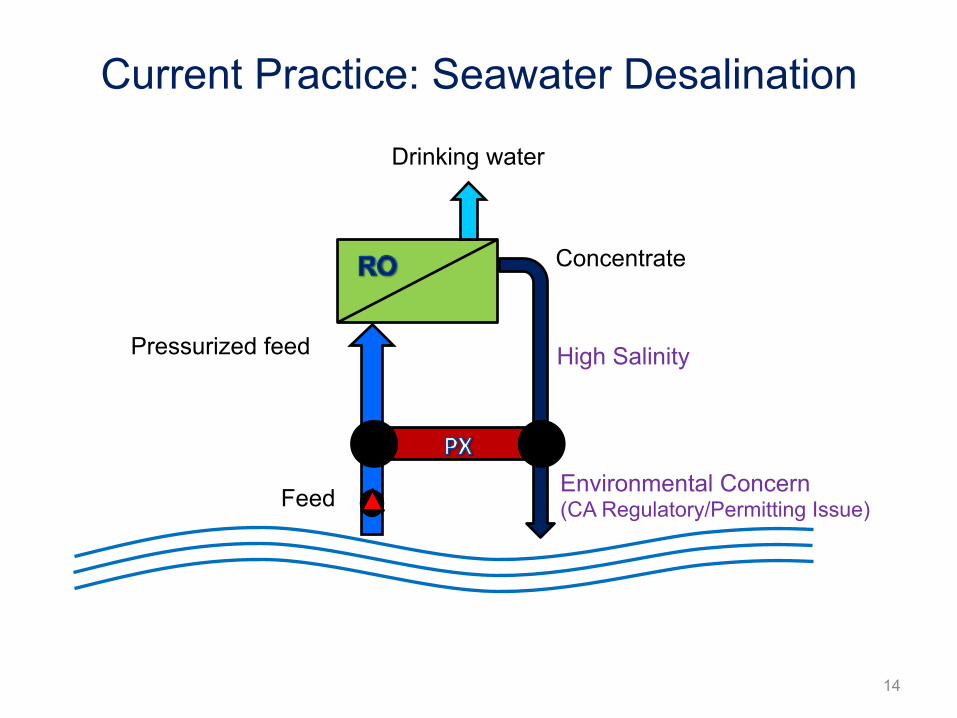
Drinking water
Concentrate
High Salinity
Environmental Concern (CA Regulatory/Permitting Issue) Feed
Pressurized feed
Current Practice: Seawater Desalination
14
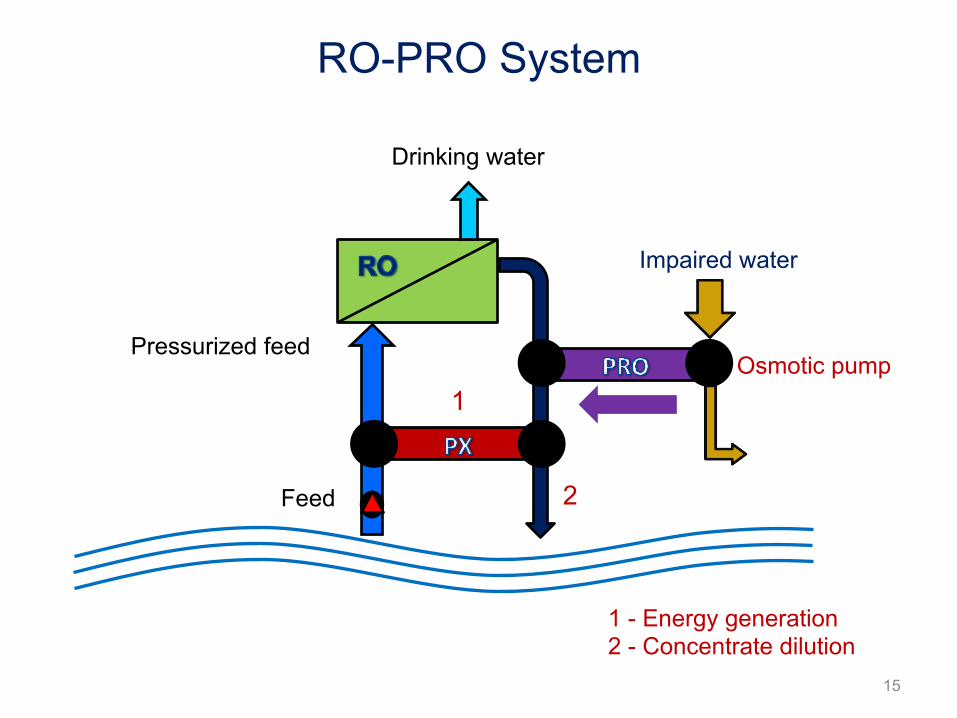
Drinking water
High pressure
Impaired water
Osmotic pump
1 - Energy generation 2 - Concentrate dilution
1
2 Feed
Pressurized feed
RO-PRO System
15
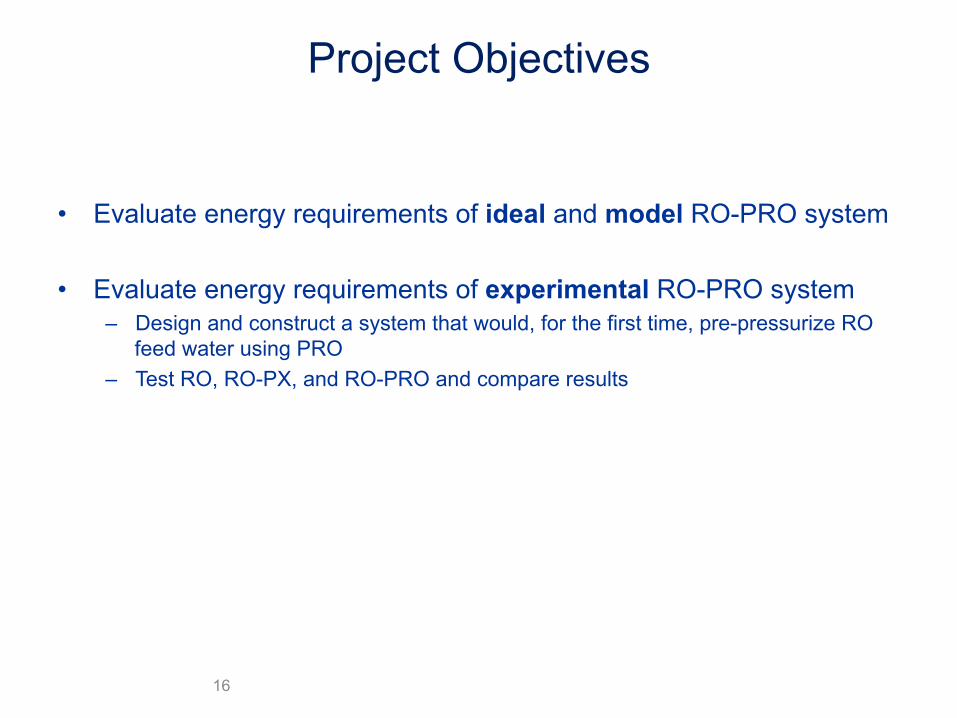
Project Objectives
• Evaluate energy requirements of ideal and model RO-PRO system
• Evaluate energy requirements of experimental RO-PRO system – Design and construct a system that would, for the first time, pre-pressurize RO
feed water using PRO – Test RO, RO-PX, and RO-PRO and compare results
16
0 20 40 60 80 100-3.0
-2.5
-2.0
-1.5
-1.0
-0.5
0.0
SER
O,th
(kW
h/m
3 )
Recovery (%)
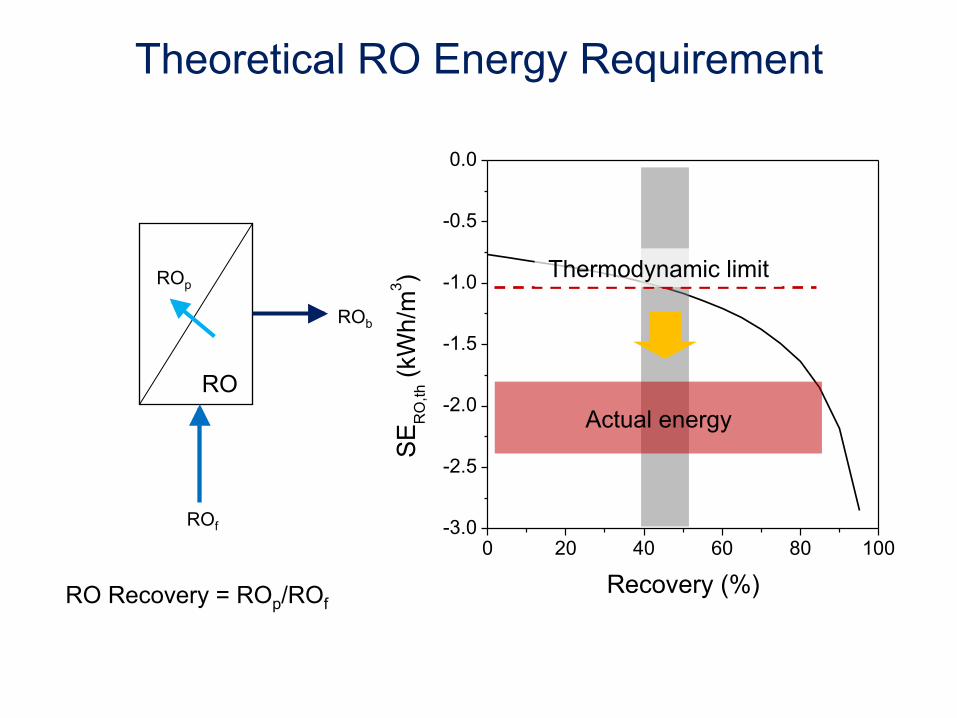
Theoretical RO Energy Requirement
RO
ROf
ROb
ROp
RO Recovery = ROp/ROf
Thermodynamic limit
Actual energy
0 20 40 60 80 1000.0
0.5
1.0
1.5
2.0
2.5
3.0
SEP
RO
,th (k
Wh/
m3 )
Dilution (%)
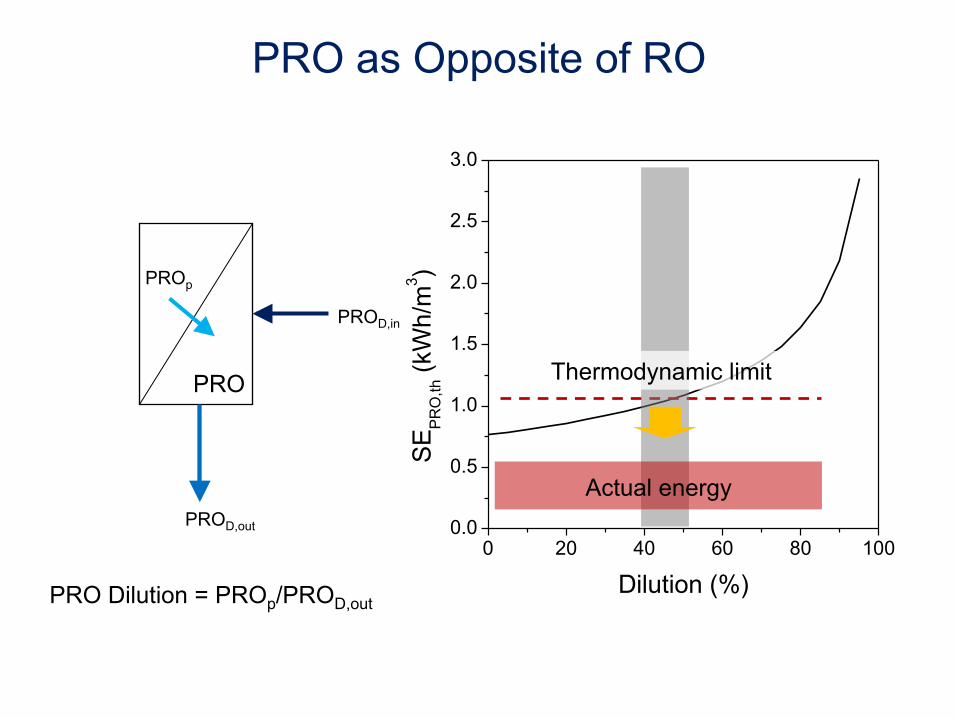
PRO as Opposite of RO
PRO
PROD,out
PROD,in
PROp
PRO Dilution = PROp/PROD,out
Actual energy
Thermodynamic limit
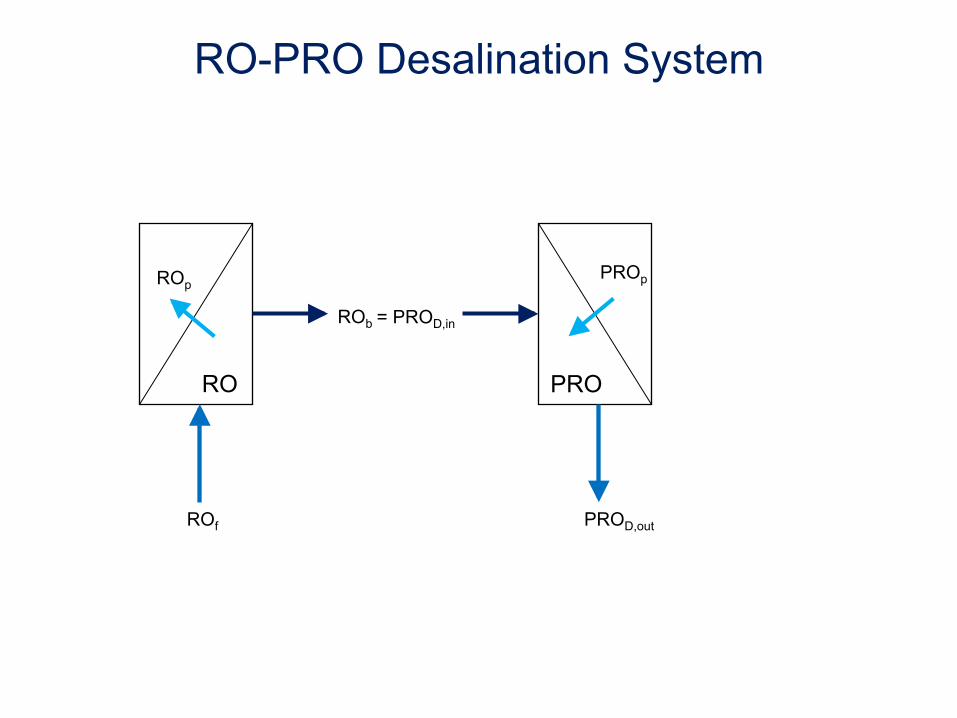
RO-PRO Desalination System
RO
ROf
ROb
ROp
PRO
PROD,out
= PROD,in
PROp
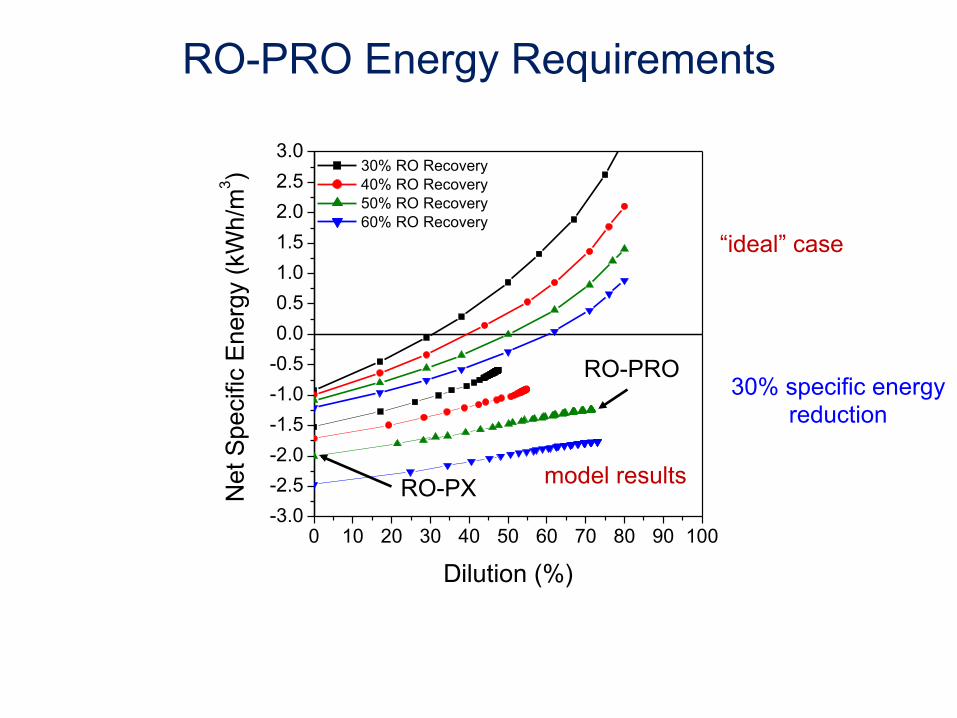
0 10 20 30 40 50 60 70 80 90 100-3.0-2.5-2.0-1.5-1.0-0.50.00.51.01.52.02.53.0
Net
Spe
cific
Ene
rgy
(kW
h/m
3 )
Dilution (%)
30% RO Recovery 40% RO Recovery 50% RO Recovery 60% RO Recovery
RO-PX
30% specific energy reduction
RO-PRO Energy Requirements
RO-PRO
“ideal” case
model results
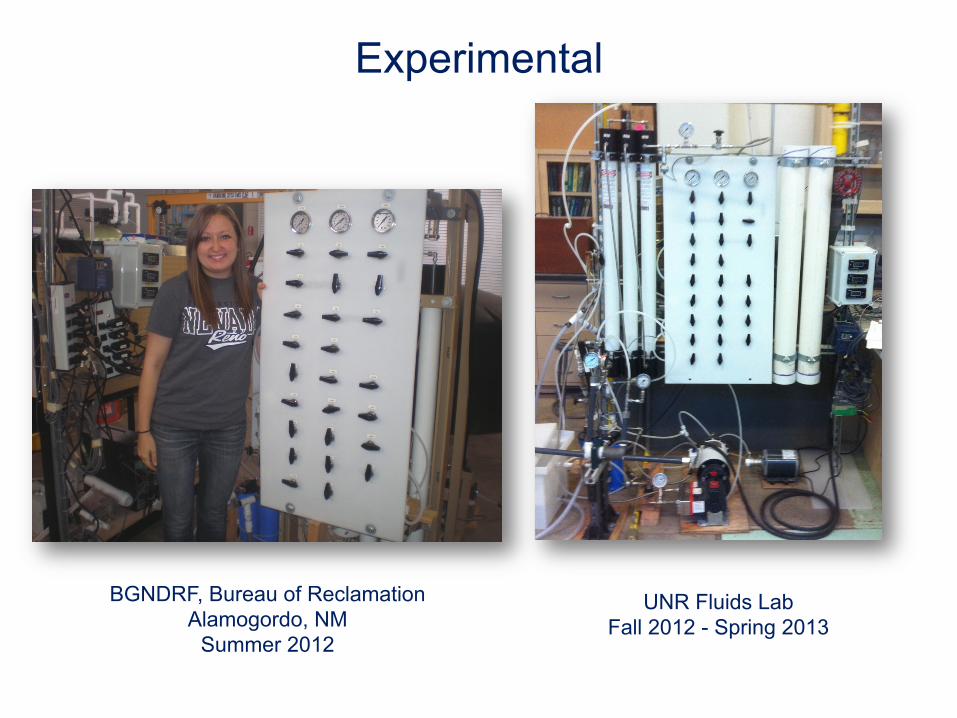
Experimental
BGNDRF, Bureau of Reclamation Alamogordo, NM
Summer 2012
UNR Fluids Lab Fall 2012 - Spring 2013
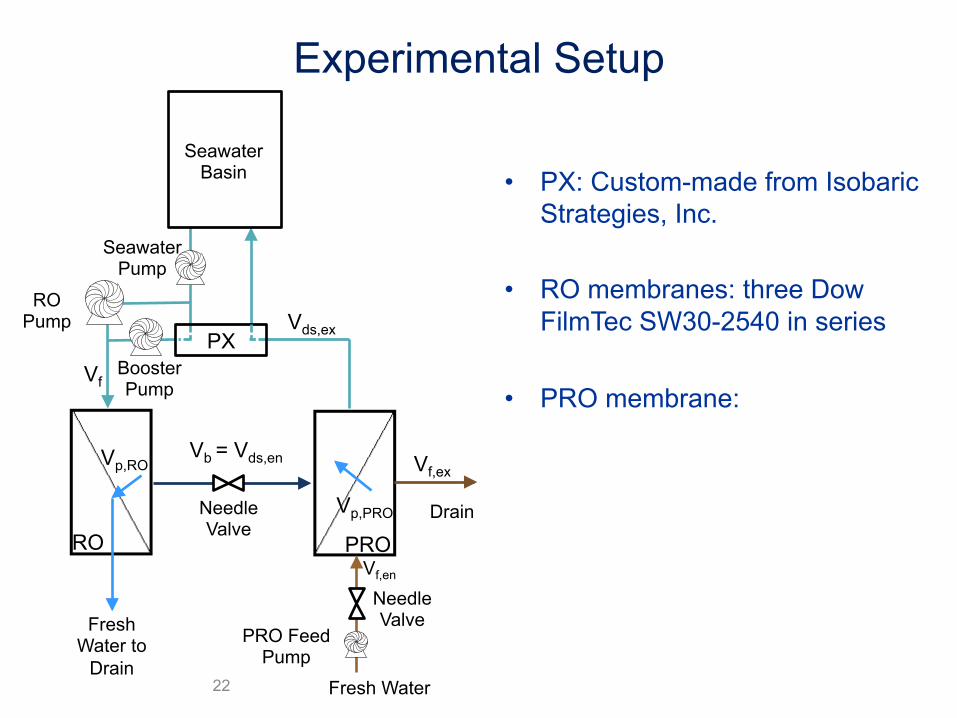
Experimental Setup
• PX: Custom-made from Isobaric Strategies, Inc.
• RO membranes: three Dow FilmTec SW30-2540 in series
• PRO membrane:
22
PX Vds,ex
Vb = Vds,en
PRO RO Vp,PRO
Vp,RO
Seawater Basin
Fresh Water to
Drain
Vf,en
Fresh Water
Vf,ex
Drain Needle Valve
Needle Valve
Seawater Pump
Booster Pump
RO Pump
PRO Feed Pump
Vf
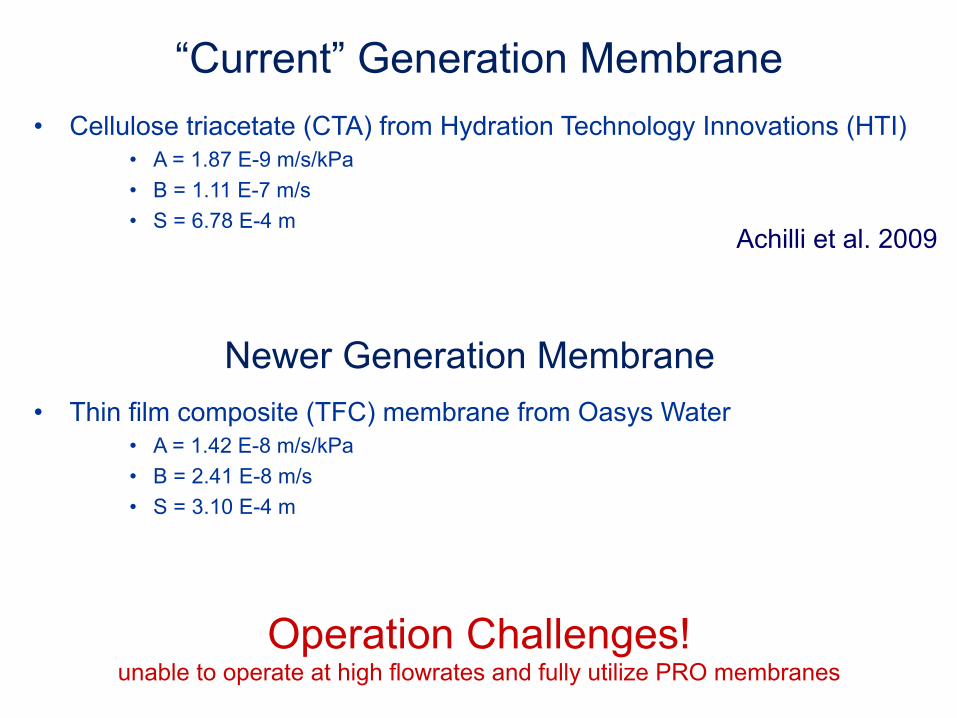
• Cellulose triacetate (CTA) from Hydration Technology Innovations (HTI) • A = 1.87 E-9 m/s/kPa • B = 1.11 E-7 m/s • S = 6.78 E-4 m
“Current” Generation Membrane
Achilli et al. 2009
• Thin film composite (TFC) membrane from Oasys Water • A = 1.42 E-8 m/s/kPa • B = 2.41 E-8 m/s • S = 3.10 E-4 m
Newer Generation Membrane
Operation Challenges! unable to operate at high flowrates and fully utilize PRO membranes
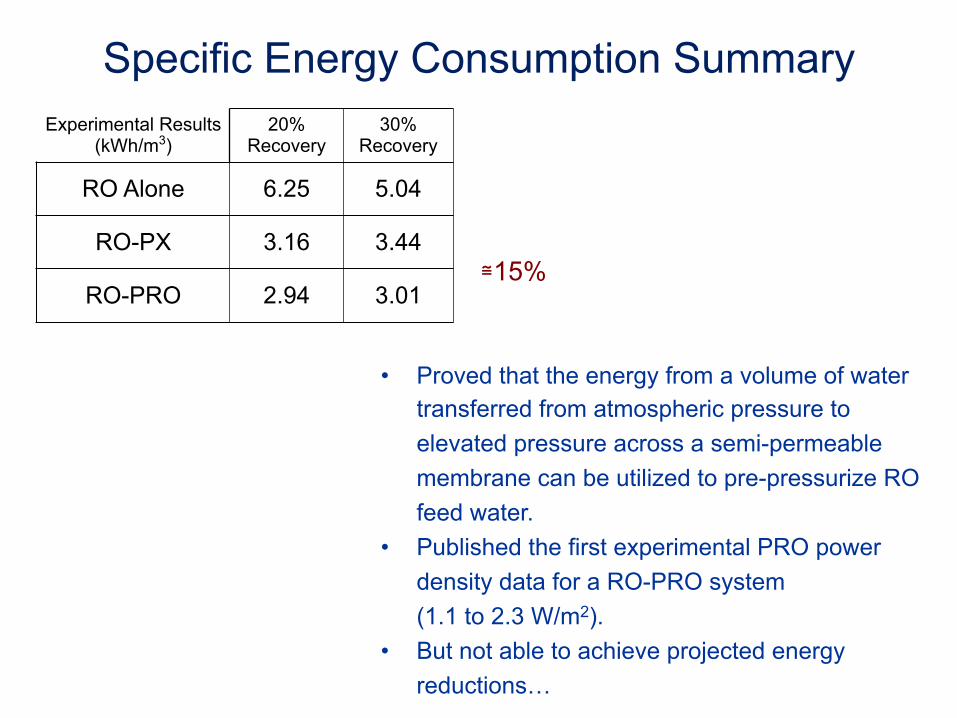
Experimental Results (kWh/m3)
20% Recovery
30% Recovery
RO Alone 6.25 5.04
RO-PX 3.16 3.44
RO-PRO 2.94 3.01
Specific Energy Consumption Summary
• Proved that the energy from a volume of water transferred from atmospheric pressure to elevated pressure across a semi-permeable membrane can be utilized to pre-pressurize RO feed water.
• Published the first experimental PRO power density data for a RO-PRO system (1.1 to 2.3 W/m2).
• But not able to achieve projected energy reductions…
≅15%
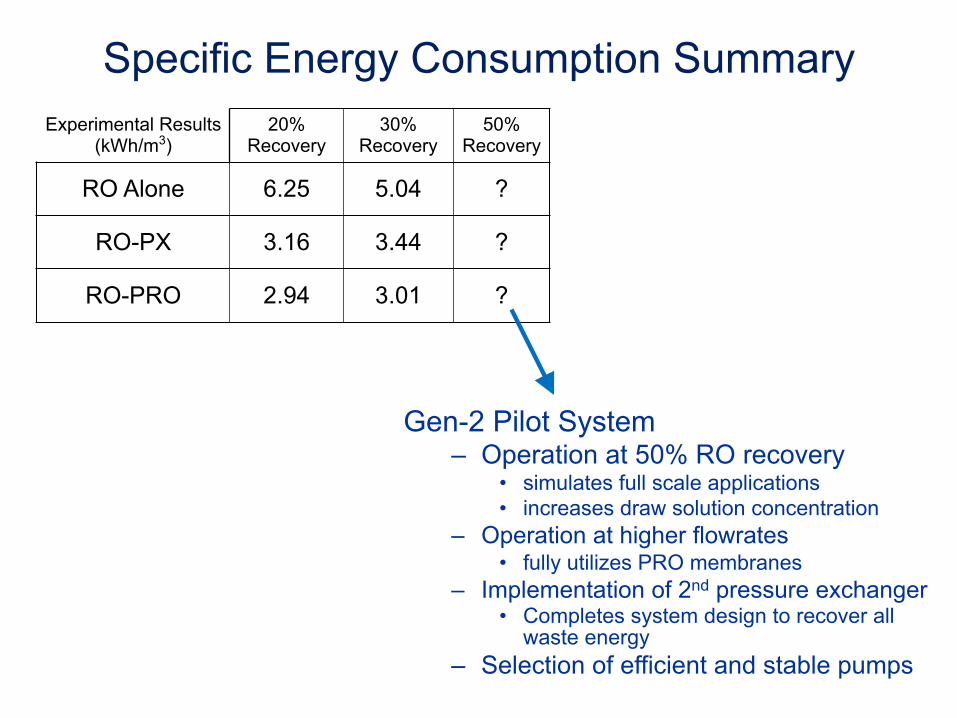
Experimental Results (kWh/m3)
20% Recovery
30% Recovery
50% Recovery
RO Alone 6.25 5.04 ?
RO-PX 3.16 3.44 ?
RO-PRO 2.94 3.01 ?
Specific Energy Consumption Summary
Gen-2 Pilot System – Operation at 50% RO recovery
• simulates full scale applications • increases draw solution concentration
– Operation at higher flowrates • fully utilizes PRO membranes
– Implementation of 2nd pressure exchanger • Completes system design to recover all
waste energy – Selection of efficient and stable pumps
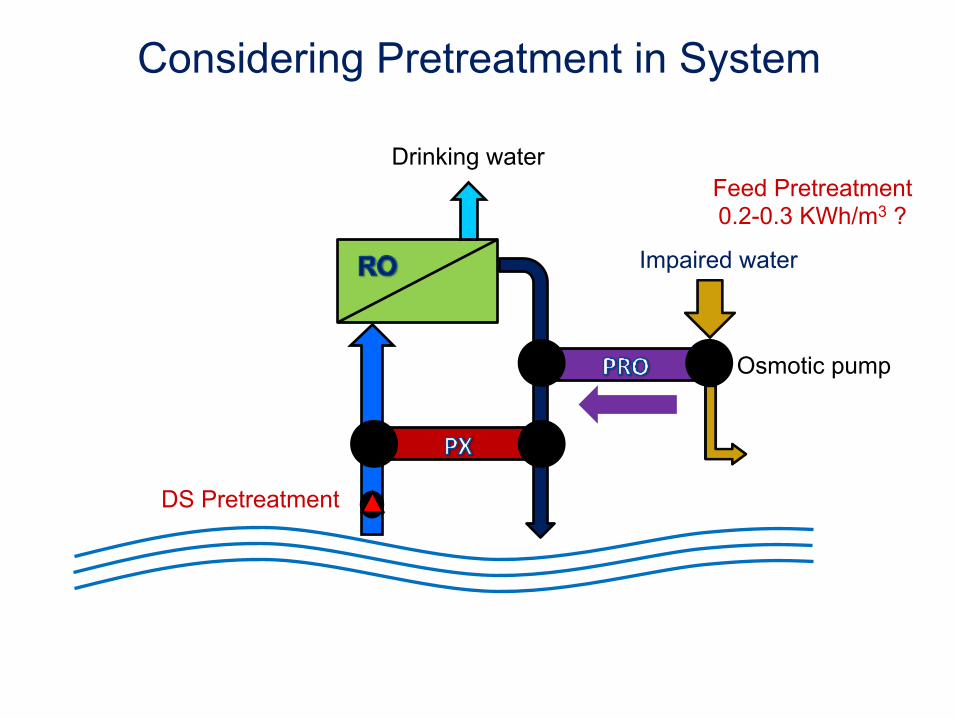
Drinking water
High pressure
Impaired water
Osmotic pump
DS Pretreatment
Considering Pretreatment in System
Feed Pretreatment 0.2-0.3 KWh/m3 ?
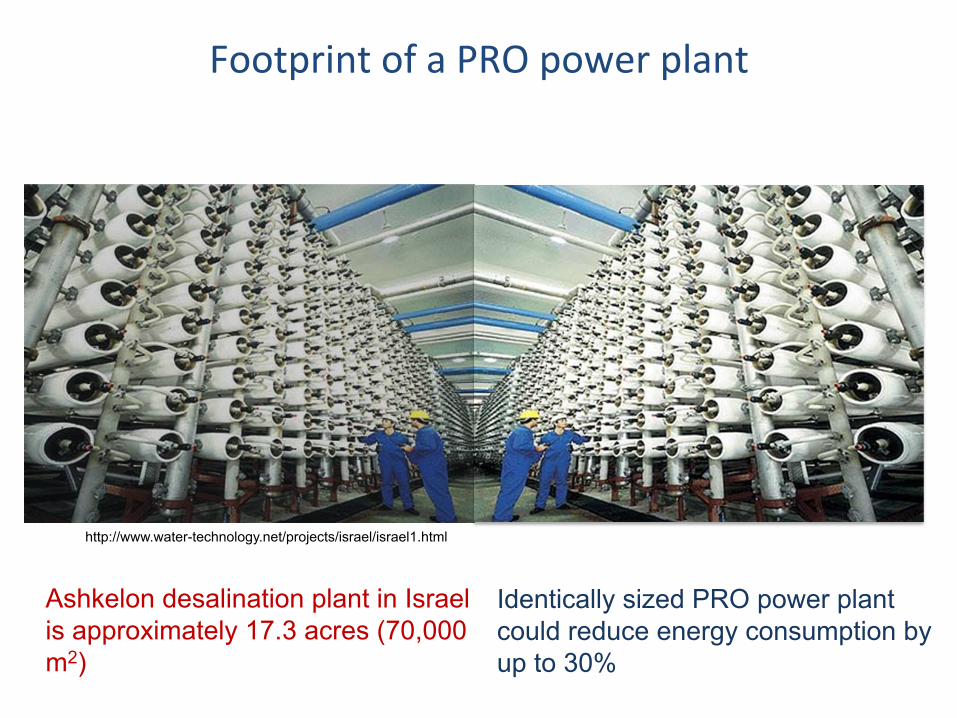
Ashkelon desalination plant in Israel is approximately 17.3 acres (70,000 m2)
Identically sized PRO power plant could reduce energy consumption by up to 30%
http://www.water-technology.net/projects/israel/israel1.html
Footprint of a PRO power plant
28
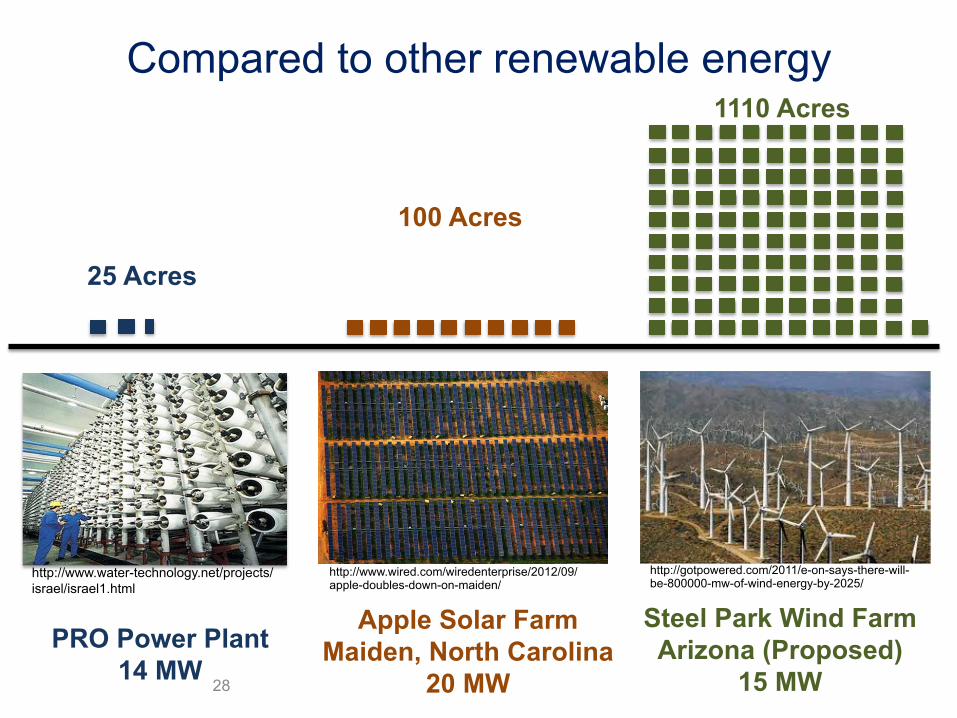
Compared to other renewable energy
http://gotpowered.com/2011/e-on-says-there-will-be-800000-mw-of-wind-energy-by-2025/
Steel Park Wind Farm Arizona (Proposed)
15 MW
1110 Acres
http://www.wired.com/wiredenterprise/2012/09/apple-doubles-down-on-maiden/
Apple Solar Farm Maiden, North Carolina
20 MW
100 Acres
http://www.water-technology.net/projects/israel/israel1.html
PRO Power Plant 14 MW
25 Acres
Final Remarks
• A subsidized renewable energy market, such as currently exists in the EU, may be needed until membrane and module technology gaps can be filled
• Higher salinity gradient in RO-PRO system is likely to make RO-PRO a more promising component of an alternative energy portfolio than river-to-sea PRO systems; RO-PRO system also provides concentrate dilution
• PRO membranes have improved an order of magnitude over past 3 years, but still need: • Commercial competition for membranes
• New membrane modules / packing
Acknowledgements
• US Bureau of Reclamation
• Oasys Water
• Hydration Technology Innovations
• Isobarix
• Dr. Andrea Achilli, Jeri Prante, and Dr. Sage Hiibel