Embed Size (px)
Citation preview

1
How we got here, why it matters, and how states and school systems can compensate teachers fairly and strategically
Nicole Katz, Kate Wright Apfelbaum, Stephen Frank, and Karen Hawley Miles
Low Teacher Salaries 101
June 2018UPDATED
Low Teacher Salaries 101 3Low Teacher Salaries 1012
After the 2008 recession, real inflation-adjusted per-pupil funding dipped in more than 30 states, with over 20 states losing more than 5 percent of their K-12 per-pupil funding. Given the 140 percent increase in per-pupil spending nationally from 1970 to 2014–15, this recent decline may be a momentary blip. However, in the face of teacher strikes and shortages across the country, a deeper look reveals several reasons why some states might need to be concerned about their current levels of K-12 per-pupil funding and how they allocate these dollars.
Although inflation-adjusted per-pupil spending grew in the last three decades, relatively little went toward real salary increases for teachers.1 Across the country, average inflation-adjusted teacher salaries have remained largely stagnant since the 1990s and even declined in the majority of states in recent years. Current average teacher salaries in many states don’t even cover the basic needs of a family, given the local cost of living.2 Simultaneously, the supply of teachers is changing in ways that impact student learning;3 enrollment in teacher preparation courses is decreasing and teacher attrition is rising, triggering a sharp uptick in the number of states forced to hire teachers without basic credentials to fill vacancies.4
In order to create schools and systems that promote excellence and equity for all students, districts and states need to both consider how much they invest in education and spark more strategic redesign around how well those resources are used. In states where funding and investment patterns have resulted in dissatisfaction with the quality or quantity of teacher applicants, this would include carefully benchmarking compensation levels to comparable opportunities available to high-achieving college graduates. It will also require most states to modernize and restructure teacher compensation and career opportunities, and to rethink existing staffing and other practices to make the most of scarce public resources. In states with significant labor market challenges and few existing resources to address the challenge, it will likely require additional investment in K-12 education.
Introduction
Low Teacher Salaries 101 3
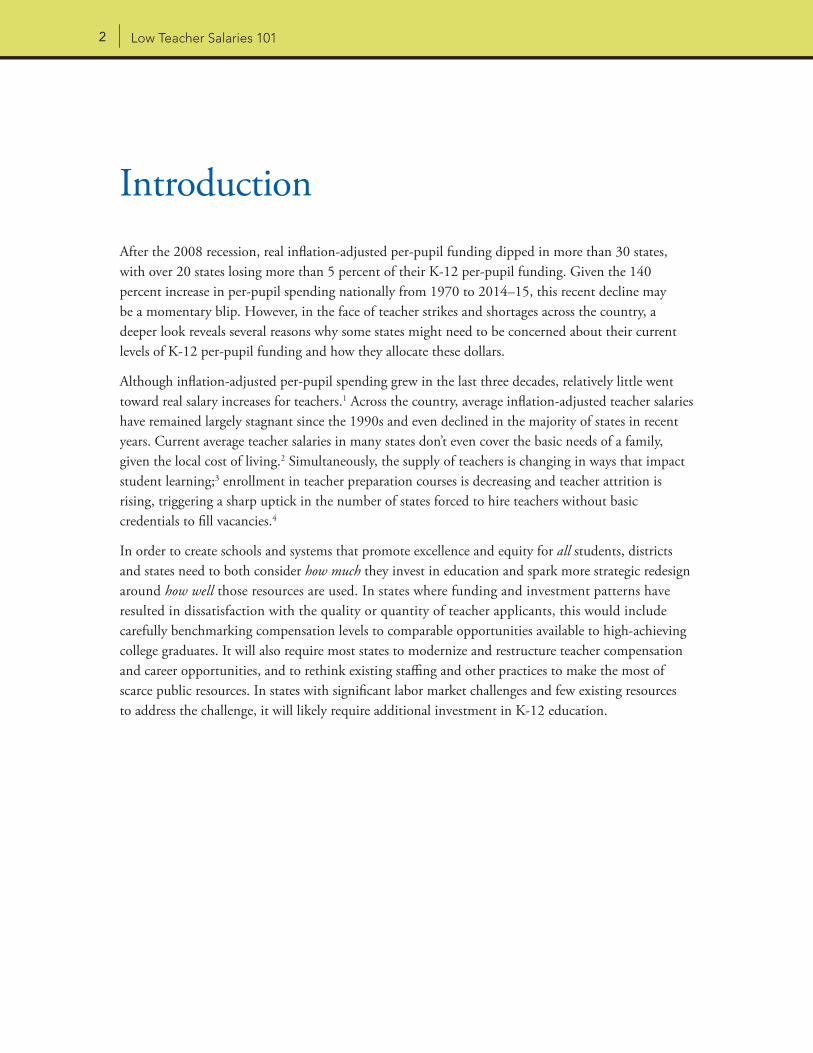
More money, more peopleFrom 1969–70 until 2014–15 (the most recent year of data available), per-pupil spending increased nationally by more than 140 percent after adjusting for inflation.5 The national gross domestic product (GDP) grew at a similar rate over this period and largely fueled this steady and continuous increase. Education spending has remained relatively steady at 3.25 percent of GDP since the early 1970s (see Figure 1). This trend suggests education spending may continue to increase in line with economic growth as the economy continues to recover from the recession.
What did this increase in K-12 spending buy? Between the 1969–70 and 2014–15 school years, over half of the more than $6,700 inflation-adjusted increase in per-pupil spending went toward instruction (55.6 percent of total increase), roughly a third went toward school services (32.7 percent), and the remainder was split between administration (9.5 percent) and plant operation and maintenance (2.2 percent). The increased spending on instruction primarily went toward adding
1970 1975 1980 1985 1990 1995 20152000 2005 2010
Year
$0
Per-
pup
il ex
pen
ditu
res
in 2
014–
15 d
olla
rs
Tota
l K–1
2 ex
pen
ditu
re a
s p
erce
nt o
f GD
P
$2,000
$4,000
$6,000
$8,000
$10,000
$12,000
$14,000
0%
1%
2%
3%
4%
5%
K–12 spending as % GDPK–12 dollar-per-pupil expenditures
Recession andpost-recession
FIGURE 1 Real inflation-adjusted national public K–12 expenditures, compared to percent of GDP6
Note: Expenditures shown include instruction, support services, food services, and enterprise operations, and exclude capital outlay and interest on debt.
Source: ERS analysis using data from NCES Table 236.55. Total and current expenditures per pupil in public elementary and secondary schools: Selected years, 1919–20 through 2013–14; NCES Table 236.10. Summary of expenditures for public elementary and secondary education and other related programs, by purpose: Selected years, 1919–20 through 2013-14; NCES Revenues and Expenditures for Public Elementary and Secondary Education: School Year 2014–15 (Fiscal Year 2015); NCES Table 106.70. Gross domestic product price index, Consumer Price Index, education price indexes, and federal budget composite deflator: Selected years, 1919 through 2015
2007–2014
Low Teacher Salaries 101 5Low Teacher Salaries 1014
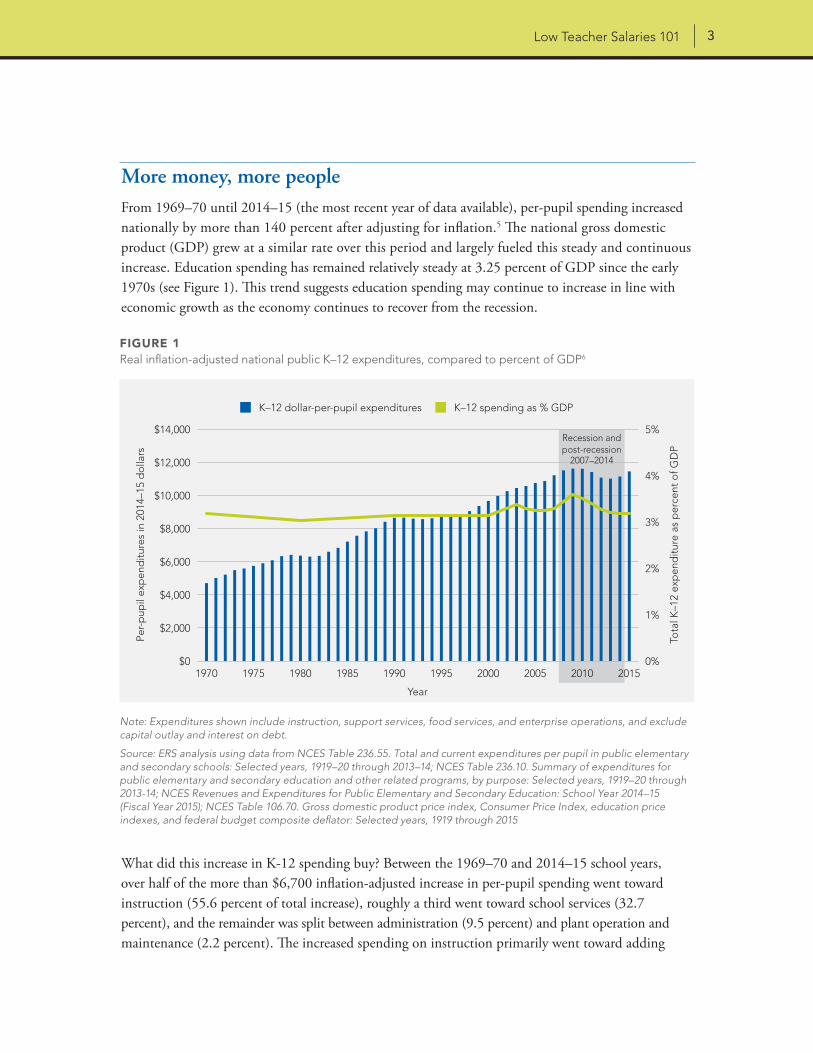
teaching and non-teaching staff. Non-teaching positions that grew included roles like librarians, paraprofessionals, and instructional coordinators. Although student enrollment increased by about five million students during this time, staffing levels grew at a faster rate, drastically reducing both pupil-to-staff and pupil-to-teacher ratios.7 As shown in Figure 2 below, the number of staff per student increased over 70 percent in total and nearly 40 percent for teachers per student since 1970.
As the number of staff in schools grew, real teacher salaries rose a mere 7 percent since 1970 and have remained largely flat since 1990.8 Additionally, while real inflation-adjusted teacher salaries have remained roughly constant since the early 1990s, the percentage of total teacher compensation going toward benefits increased nearly 20 percent during that same time period.9 This means that as per-pupil spending steadily grew, much of this increase that went to instruction focused primarily on increasing staff in schools as well as increasing teacher benefits rather than increasing teacher salaries.
FIGURE 2 Staff per 100 students and teachers per 100 students over time, compared to changes in teacher salary
1969–70
7.3
Fall 1980
5.3
$48.5K
10.2
Fall 1990
5.8
$58.9K
10.9
Fall 2015
6.2
$58.1K
12.7
Fall 2000
6.2
$59.0K
12.1
Fall 2010
6.3
$59.9K
12.5
–1
Staf
f or
teac
hers
per
100
stu
den
ts
Ave
rag
e te
ache
r sa
lary
in 2
015–
16 d
olla
rs
1
3
5
7
9
11
13
$0
$100,000
$10,000
$20,000
$30,000
$40,000
$50,000
$60,000
$70,000
$80,000
$90,000
Teachers per 100 students Average teacher salaryStaff members per 100 students
4.5
$54.4K
13.7: 1 9.8: 1 9.2: 1 8.3: 1 8.0: 1 7.9: 1Pupil-to-staff ratio
22.3: 1 18.7: 1 17.2: 1 16.0: 1 16.0: 1 16.1: 1Pupil-to-teacher ratio
Source: ERS analysis using data from NCES Table 213.10. Staff employed in public elementary and secondary school systems, by type of assignment: Selected years, 1949–50 through fall 2015; NCES Table 208.20. Public and private elementary and secondary teachers, enrollment, pupil/teacher ratios, and new teacher hires: Selected years, fall 1955 through fall 2025; NCES Table 211.50. Estimated average annual salary of teachers in public elementary and secondary schools: Selected years,1959–60 through 2015–16
5
Low Teacher Salaries 101 5
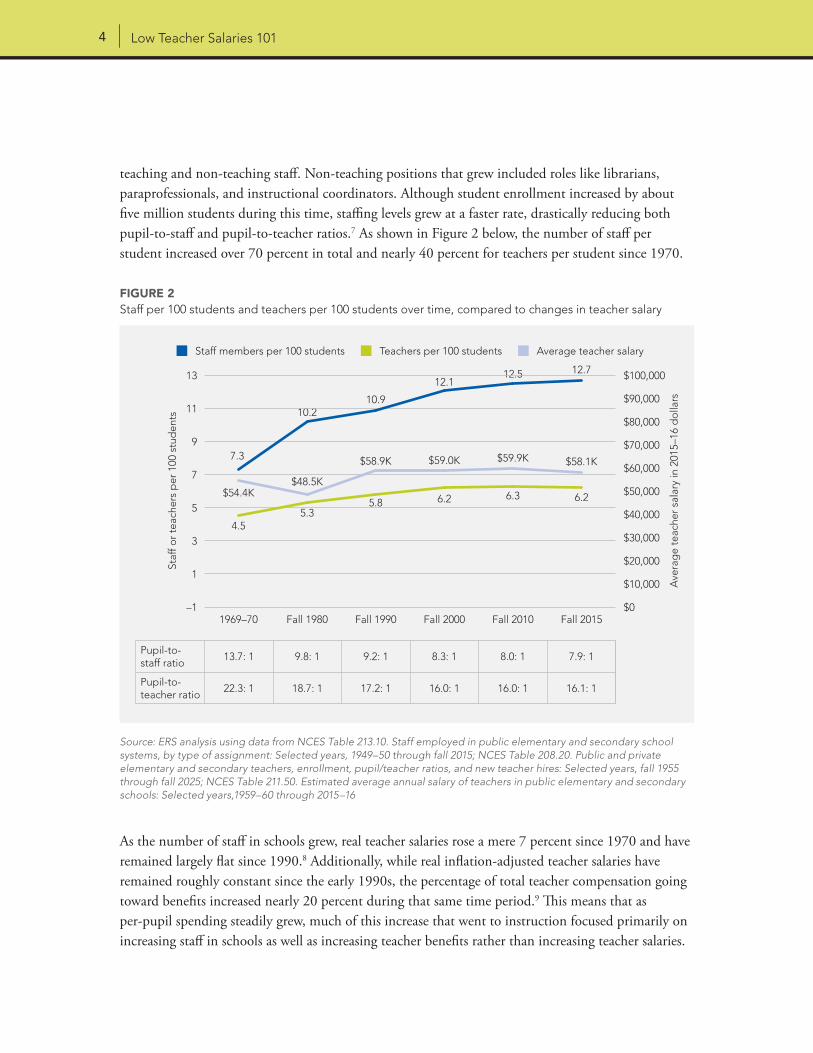
The gap widens between “have” and “have-not” states—especially for teacher salariesAs tax revenues fell during the recession in 2008, the steady historical rise in K-12 spending took a dip as inflation-adjusted per-pupil funding decreased in 32 states.10 Twenty-one states lost 5 percent or more of their per-pupil funding, and five of those states lost 10 percent or more of their funding (see Appendix for a state-by-state list of changes in per-pupil funding).
This funding level decline hit some states harder than others, especially those where funding was low before the recession. As shown in Figure 3, the states in the bottom quartile of K-12 funding in 2009–10 lost significantly more than other states in terms of percentage and total inflation-adjusted dollars-per-pupil after adjusting for geography. In contrast, average inflation-adjusted per-pupil revenue in the highest-funded states actually increased over that time period, widening the gap between the “have” and “have-not” states in education funding.
1 2 3 4
Quartiles based on 2009–10 per-pupil geography-adjusted revenue
$0
$5,000
$10,000
$15,000
$20,000
$25,000
$10,826
–6.1% –3.2% –2.9% 2.7%
$10,127
$13,100 $12,723
$15,457 $14,987
$18,892 $19,111
Average of 2014–15 per-pupil revenue (adjusted for geography)
Average of 2009–10 per-pupil revenue (adjusted for geography, in 2014–15 dollars)
Average change ininflation-adjustedper-pupil revenue2009–10 to 2014–15
FIGURE 3 Change in inflation-adjusted per-pupil revenue, 2009–10 to 2014–15
Source: ERS analysis using data from NCES Elementary and Secondary Information System http://nces.ed.gov/ccd/elsi/, Revenue per pupil by source 1987–88 through 2013–14; NCES Revenues and Expenditures for Public Elementary and Secondary Education: School Year 2014–15 (Fiscal Year 2015); NCES Comparable Wage Index; NCES Table 106.70. Gross domestic product price index, Consumer Price Index, education price indexes, and federal budget composite deflator: Selected years, 1919 through 2015
Low Teacher Salaries 101 7Low Teacher Salaries 1016
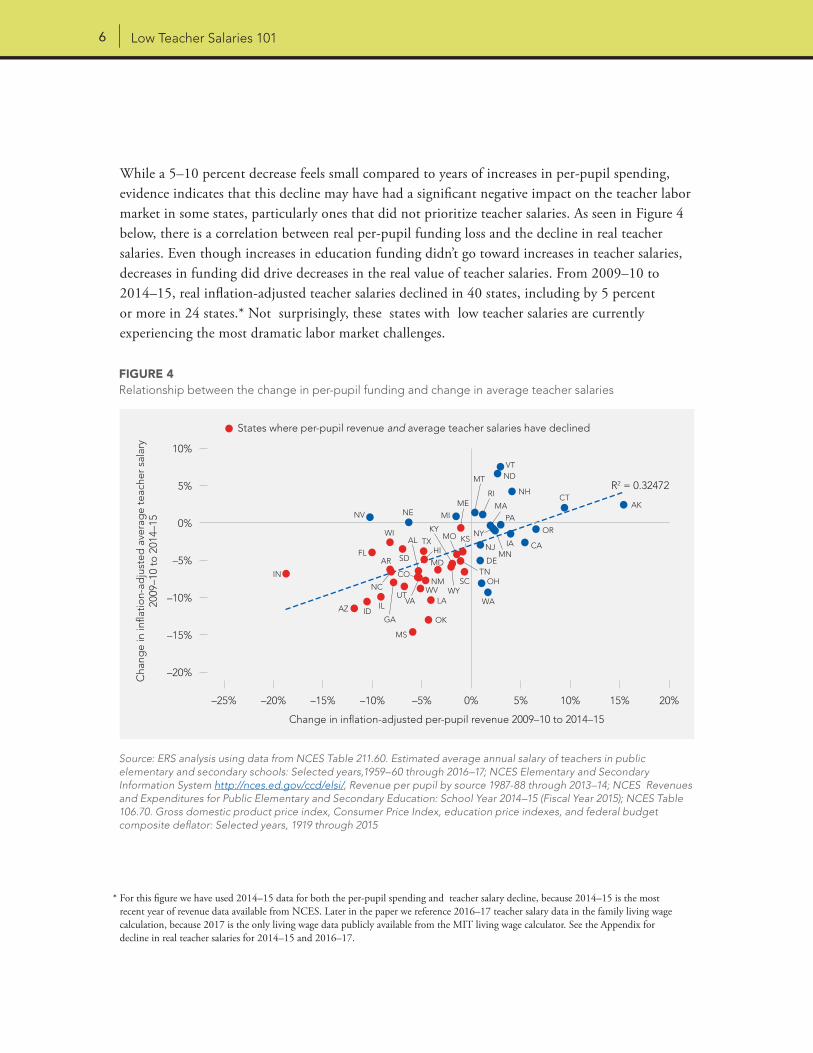
While a 5–10 percent decrease feels small compared to years of increases in per-pupil spending, evidence indicates that this decline may have had a significant negative impact on the teacher labor market in some states, particularly ones that did not prioritize teacher salaries. As seen in Figure 4 below, there is a correlation between real per-pupil funding loss and the decline in real teacher salaries. Even though increases in education funding didn’t go toward increases in teacher salaries, decreases in funding did drive decreases in the real value of teacher salaries. From 2009–10 to 2014–15, real inflation-adjusted teacher salaries declined in 40 states, including by 5 percent or more in 24 states.* Not surprisingly, these states with low teacher salaries are currently experiencing the most dramatic labor market challenges.
FIGURE 4 Relationship between the change in per-pupil funding and change in average teacher salaries
Source: ERS analysis using data from NCES Table 211.60. Estimated average annual salary of teachers in public elementary and secondary schools: Selected years,1959–60 through 2016–17; NCES Elementary and Secondary Information System http://nces.ed.gov/ccd/elsi/, Revenue per pupil by source 1987-88 through 2013–14; NCES Revenues and Expenditures for Public Elementary and Secondary Education: School Year 2014–15 (Fiscal Year 2015); NCES Table 106.70. Gross domestic product price index, Consumer Price Index, education price indexes, and federal budget composite deflator: Selected years, 1919 through 2015
* For this figure we have used 2014–15 data for both the per-pupil spending and teacher salary decline, because 2014–15 is the most recent year of revenue data available from NCES. Later in the paper we reference 2016–17 teacher salary data in the family living wage calculation, because 2017 is the only living wage data publicly available from the MIT living wage calculator. See the Appendix for decline in real teacher salaries for 2014–15 and 2016–17.
Cha
nge
in in
flatio
n-ad
just
ed a
vera
ge
teac
her
sala
ry20
09–1
0 to
201
4–15
–15%
–10%
–5%
–20%
5%
10%
0%
0%–25% –20% –15% –10% –5% 5% 15% 20%10%
Change in inflation-adjusted per-pupil revenue 2009–10 to 2014–15
R2 = 0.32472
States where per-pupil revenue and average teacher salaries have declined
IN
HITX
NC
NE
SD
NV
KS
ME
MD
MA
NH
VTNDMT
MI
MO
MN
NMWV
KY
LA
MS
IDIL
CA
OR
IA
PA
CT
DETN
SCWY
OH
WA
OK
NJ
NY
FL
AL
AZ
AR
WI
GA
UTVA
CO
AKRI
Low Teacher Salaries 101 7
Low salaries—combined with low funding levels—make teaching less attractiveSeveral recent studies, accounting for factors such as hours worked, gender, and race, conclude that teacher salaries today are between 14 percent and 25 percent lower than those for other professions available to college graduates.11 As inflation-adjusted teacher salaries remained flat nationally over time—and have declined in many states—this salary gap between teachers and other comparable professions has grown significantly. After controlling for factors such as education and number of weeks worked per year, one study from the Economic Policy Institute found that teachers earned 8.4 percent less than similar workers in 1998.12 By 2015, that gap had grown to 17 percent.13
The desirability of any profession is linked to what’s called the “value proposition”— the tangible and intangible value of the profession that include total compensation, working conditions, and opportunities for growth, among others.14 Although we focus here on teacher salaries, states and districts should also consider whether investing in other pieces of the value proposition might make more difference.15 For example, we know from other studies that significant increases in salary don’t motivate teachers with other career options to stay in schools in high-crime areas, with a principal who is struggling, or with high principal turnover.16
However, many states do not even provide teachers with a family living wage (explored in more detail below), and this is happening most often in the states with the lowest funding levels. This has two implications. First, with such low spending levels, teachers will be less likely to have strong working conditions and other supports that would enhance the teaching job. Second, states will have less opportunity to shift spending from other areas to pay for increased compensation.
Mounting evidence suggests that the growing gap between teacher salary levels and other professions is contributing to local teacher shortages. As states recovered from the 2008 recession and districts began hiring teachers again to restore pre-recession pupil-teacher ratios, most struggled to find sufficient numbers of qualified teachers to fill positions.17 Virtually all states report large numbers of subject areas in which they are not receiving sufficient qualified applicants, including in fields such as elementary education, where there is typically a surfeit of job aspirants.18 The pipeline of teacher applicants is also lower, based on the sharp decline (from 684,000 to 419,000 students from 2011 to 2015) in the number of U.S. college students enrolling in teacher certification programs.19 The number of long-term crisis substitutes, emergency or provisionally certified teacher hires, and unfilled vacant positions in schools has dramatically risen over the past several years across the country, and particularly in low-income and rural communities.20 This problem will continue to grow as teacher attrition and student enrollment continue to rise.21
Low Teacher Salaries 101 9Low Teacher Salaries 1018
WHAT ABOUT BENEFITS?
The analysis thus far describes the salary gap between teachers and similar workers and does not account for differences in benefits. However, while benefits do represent a higher percentage of total compensation for teachers than for other professions, the dollar value of benefits is largely the same due to the significantly lower baseline of teacher salaries.22 Thus, teacher benefits don’t help to close the compensation gap.23
Overall, teacher compensation does include significantly higher costs of pension retirement benefits compared to the private sector. But unfortunately for teachers, rising retirement costs often don’t result in greater retirement payouts for teachers. As extensive analysis by Bellwether Education Partners makes clear, this happens because, unlike in the private sector, most states don’t tie individual teacher pension payouts to a teacher’s contributions over time. Instead, payouts can rise or fall based on a state’s calculations of what is required to pay down debt and maintain future payouts.24
Additionally, many teachers will never see the long-term payout of their costly contributions. In most states, teachers need to serve for 20 years or more just to break even on their total contributions plus interest; in 10 states, it will take teachers more than 30 years just to hit that point.25 Nationally, only about a quarter of teachers will ever reach the break-even point, with even fewer than that in half of states.26 Thus while retirement benefits are expensive to states, they are not all that generous to teachers, and most teachers don’t ever reap the full cost or benefit of those high contributions. These retirement costs reduce the available total compensation that could be going toward teacher salaries; teachers’ salaries could rise by more than 5 percent in 36 states if those states had no debt costs associated with their retirement systems.27
Bringing teachers above the family living wageTo understand how the average teacher salary compares to the income required to raise a family, we used the “living wage” metric maintained by Dr. Amy Glasmeier at the Massachusetts Institute of Technology (MIT). The MIT researchers calculate the living wage as the minimum income needed to cover basic expenses (including food, child care, medical costs, housing, transportation and a miscellaneous “other”) based on local costs and across a variety of family structures.28 For our analysis, we calculated what a single earner would need to make to support a family at this bare minimum level. To do this, we created a weighted, blended metric using the MIT living wage for one- and two- parent households with a single salary earner and 1–3 children. We call this metric a “family living wage.” We then calculated the gap between the family living wage and the average salary of each state’s teacher workforce. (See the Appendix for a more detailed description of this methodology and associated assumptions.)
Low Teacher Salaries 101 9
To be clear, this “minimum income” approach is a lower bar than the salary gap described in the section above, which compares teachers to other professions, controlling for education and hours worked. Yet even using this “lower bar” approach, in more than half of states average teacher salaries are below a family living wage. This aligns with what other research has found—for example, the Center for American Progress found that in 35 states, teachers with 10 years of experience or more who head families of four would qualify for multiple public assistance programs to make ends meet.29
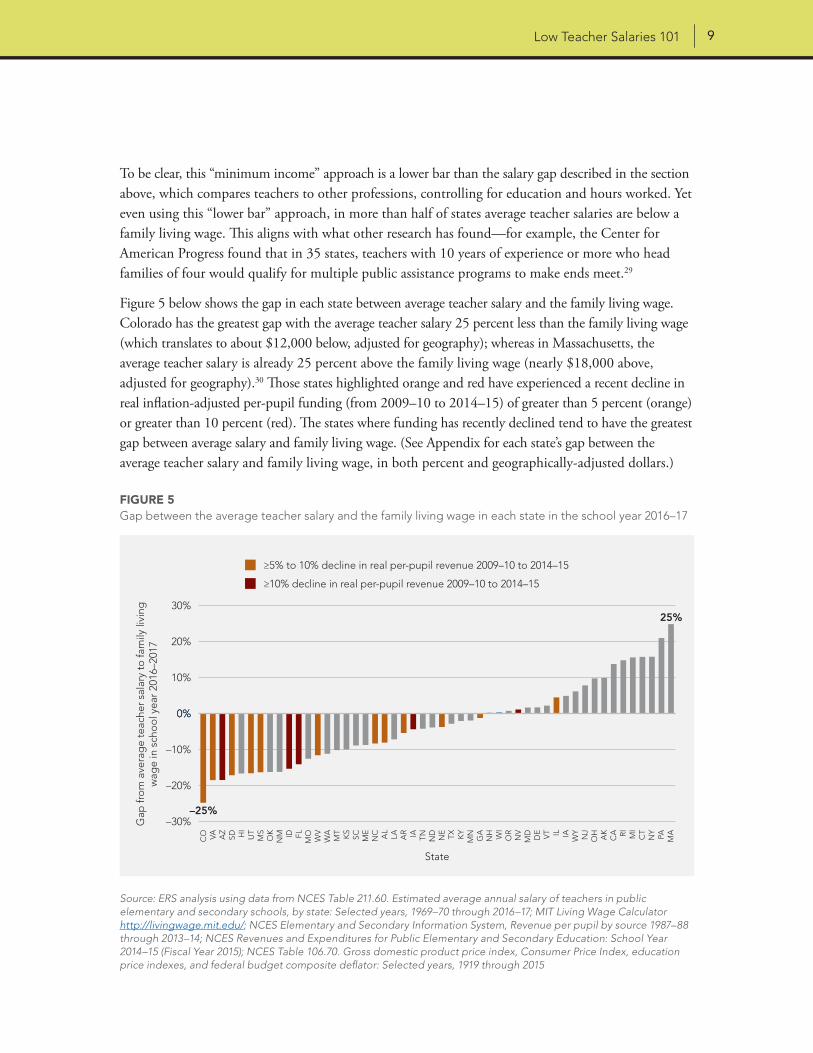
Figure 5 below shows the gap in each state between average teacher salary and the family living wage. Colorado has the greatest gap with the average teacher salary 25 percent less than the family living wage (which translates to about $12,000 below, adjusted for geography); whereas in Massachusetts, the average teacher salary is already 25 percent above the family living wage (nearly $18,000 above, adjusted for geography).30 Those states highlighted orange and red have experienced a recent decline in real inflation-adjusted per-pupil funding (from 2009–10 to 2014–15) of greater than 5 percent (orange) or greater than 10 percent (red). The states where funding has recently declined tend to have the greatest gap between average salary and family living wage. (See Appendix for each state’s gap between the average teacher salary and family living wage, in both percent and geographically-adjusted dollars.)
FIGURE 5 Gap between the average teacher salary and the family living wage in each state in the school year 2016–17
Source: ERS analysis using data from NCES Table 211.60. Estimated average annual salary of teachers in public elementary and secondary schools, by state: Selected years, 1969–70 through 2016–17; MIT Living Wage Calculator http://livingwage.mit.edu/; NCES Elementary and Secondary Information System, Revenue per pupil by source 1987–88 through 2013–14; NCES Revenues and Expenditures for Public Elementary and Secondary Education: School Year 2014–15 (Fiscal Year 2015); NCES Table 106.70. Gross domestic product price index, Consumer Price Index, education price indexes, and federal budget composite deflator: Selected years, 1919 through 2015
–30%Gap
fro
m a
vera
ge
teac
her
sala
ry t
o fa
mily
livi
ngw
age
in s
cho
ol y
ear
2016
–201
7
–20%
–10%
10%
30%
20%
CO VA AZ
SD HI
UT
MS
OK
NM ID FL
MO
WV
WA
MT
KS
SC ME
NC AL
LA AR IA TN ND
NE
TX KY
MN
GA
NH WI
OR
NV
MD
DE VT IL IA WY
NJ
OH AK
CA RI
MI
CT
NY
PA MA
–25%
25%
State
≥10% decline in real per-pupil revenue 2009–10 to 2014–15
≥5% to 10% decline in real per-pupil revenue 2009–10 to 2014–15
0%0%
Low Teacher Salaries 101 11Low Teacher Salaries 10110
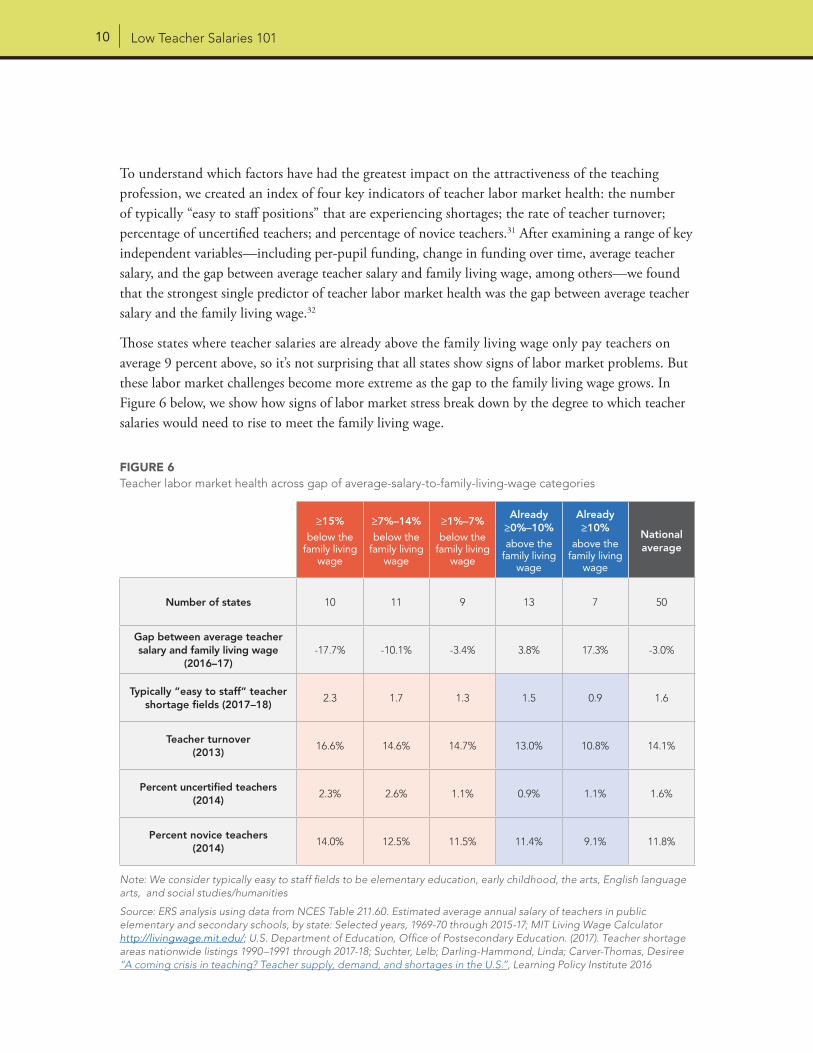
To understand which factors have had the greatest impact on the attractiveness of the teaching profession, we created an index of four key indicators of teacher labor market health: the number of typically “easy to staff positions” that are experiencing shortages; the rate of teacher turnover; percentage of uncertified teachers; and percentage of novice teachers.31 After examining a range of key independent variables—including per-pupil funding, change in funding over time, average teacher salary, and the gap between average teacher salary and family living wage, among others—we found that the strongest single predictor of teacher labor market health was the gap between average teacher salary and the family living wage.32
Those states where teacher salaries are already above the family living wage only pay teachers on average 9 percent above, so it’s not surprising that all states show signs of labor market problems. But these labor market challenges become more extreme as the gap to the family living wage grows. In Figure 6 below, we show how signs of labor market stress break down by the degree to which teacher salaries would need to rise to meet the family living wage.
FIGURE 6 Teacher labor market health across gap of average-salary-to-family-living-wage categories
Note: We consider typically easy to staff fields to be elementary education, early childhood, the arts, English language arts, and social studies/humanities
Source: ERS analysis using data from NCES Table 211.60. Estimated average annual salary of teachers in public elementary and secondary schools, by state: Selected years, 1969-70 through 2015-17; MIT Living Wage Calculator http://livingwage.mit.edu/; U.S. Department of Education, Office of Postsecondary Education. (2017). Teacher shortage areas nationwide listings 1990–1991 through 2017-18; Suchter, Lelb; Darling-Hammond, Linda; Carver-Thomas, Desiree “A coming crisis in teaching? Teacher supply, demand, and shortages in the U.S.”, Learning Policy Institute 2016
≥15%
below the family living
wage
≥7%–14%
below the family living
wage
≥1%–7%
below the family living
wage
Already ≥0%–10%
above the family living
wage
Already ≥10%
above the family living
wage
National average
Number of states 10 11 9 13 7 50
Gap between average teacher salary and family living wage
(2016–17)-17.7% -10.1% -3.4% 3.8% 17.3% -3.0%
Typically “easy to staff” teacher shortage fields (2017–18)
2.3 1.7 1.3 1.5 0.9 1.6
Teacher turnover (2013)
16.6% 14.6% 14.7% 13.0% 10.8% 14.1%
Percent uncertified teachers (2014)
2.3% 2.6% 1.1% 0.9% 1.1% 1.6%
Percent novice teachers (2014)
14.0% 12.5% 11.5% 11.4% 9.1% 11.8%
Low Teacher Salaries 101 11
Those states with the largest increase needed to pay teachers a family living wage showed the most significant signs of an unhealthy labor market for teachers. Compared to the states that pay teachers more than 10 percent above the family living wage, those where average teacher salaries are more than 15 percent below the family living wage had about 2.5 times the number of “easy to staff” shortage areas (2.3 versus 0.9). Those states also had an average teacher turnover rate of 16.6 percent, 54 percent higher than in states with average teacher salaries more than 10 percent above the family living wage (16.6 versus 10.8 percent). Finally, states where average teacher salaries are farthest below the family living wage had more than twice the percentage of uncertified teachers (2.3 percent versus 1.1 percent) and a more than 50 percent higher rate of novice teachers (14.0 percent versus 9.1 percent).
Some states will need to raise revenue to increase teacher salariesAs states continue to recover from the 2008 recession and per-pupil revenue begins to return to pre-recession levels, states suffering from teacher labor market challenges must prioritize investing those dollars in teacher salaries. However, given the historic decline in real teacher salaries even prior to the recession, this is likely not enough. To address their labor market challenges, states need to find ways to increase teacher salaries to ensure they are at or above the family living wage, either by shifting current revenue or by raising new revenue. One way for states to shift revenue toward teacher salaries would be by reducing staffing levels, which have increased significantly over the last several decades, particularly for non-teaching staff. States would need to consider the extent to which current staffing levels are strategic, for both teachers and non-teaching positions, particularly in those cases where staffing levels exceed the national median or relevant comparison states. In these instances, technology can also be leveraged, both to effectively target student need and to create smaller student group sizes.
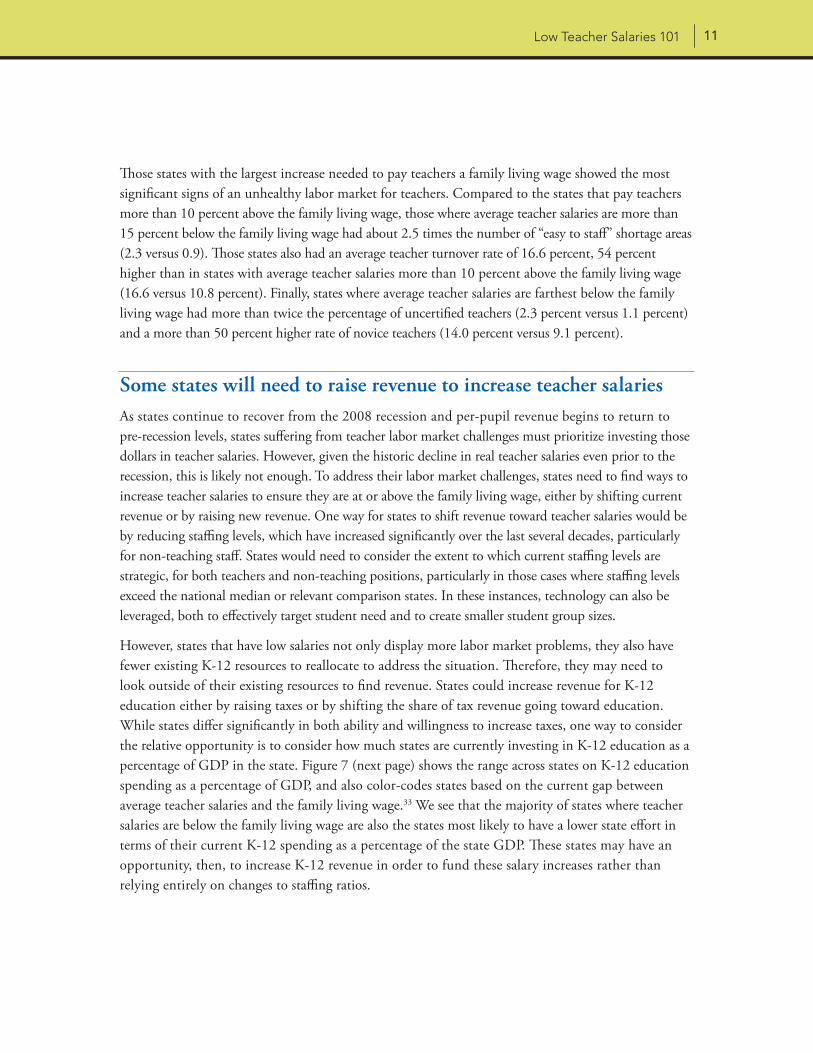
However, states that have low salaries not only display more labor market problems, they also have fewer existing K-12 resources to reallocate to address the situation. Therefore, they may need to look outside of their existing resources to find revenue. States could increase revenue for K-12 education either by raising taxes or by shifting the share of tax revenue going toward education. While states differ significantly in both ability and willingness to increase taxes, one way to consider the relative opportunity is to consider how much states are currently investing in K-12 education as a percentage of GDP in the state. Figure 7 (next page) shows the range across states on K-12 education spending as a percentage of GDP, and also color-codes states based on the current gap between average teacher salaries and the family living wage.33 We see that the majority of states where teacher salaries are below the family living wage are also the states most likely to have a lower state effort in terms of their current K-12 spending as a percentage of the state GDP. These states may have an opportunity, then, to increase K-12 revenue in order to fund these salary increases rather than relying entirely on changes to staffing ratios.
≥15%
below the family living
wage
≥7%–14%
below the family living
wage
≥1%–7%
below the family living
wage
Already ≥0%–10%
above the family living
wage
Already ≥10%
above the family living
wage
National average
Number of states 10 11 9 13 7 50
Gap between average teacher salary and family living wage
(2016–17)-17.7% -10.1% -3.4% 3.8% 17.3% -3.0%
Typically “easy to staff” teacher shortage fields (2017–18)
2.3 1.7 1.3 1.5 0.9 1.6
Teacher turnover (2013)
16.6% 14.6% 14.7% 13.0% 10.8% 14.1%
Percent uncertified teachers (2014)
2.3% 2.6% 1.1% 0.9% 1.1% 1.6%
Percent novice teachers (2014)
14.0% 12.5% 11.5% 11.4% 9.1% 11.8%
Low Teacher Salaries 101 13Low Teacher Salaries 10112
0%Stat
e an
d lo
cal K
-12
reve
nue
as p
erce
nt o
f sta
teG
DP
in 2
014-
2015
2%
1%
4%
6%
5%
NC
ND SD TN FL CA
DE
WA
CO NV
OK
AZ HI
OR
VA ID TX UT
LA IL AL
NE IN IA GA
MA
MO W
IK
YM
TM
NM
SN
MO
HM
D MI
KS
NH PA AR
SC RI
NY
CT
WV
ME
WY
AK
NJ
VT
2.4%
5.4%
3%
Median = 3.3%
State
≥1%–7% below family living wage ≥7%–14% below family living wage ≥15% below family living wage
Already more than 10% above family living wage Already ≥0%–10% above family living wage
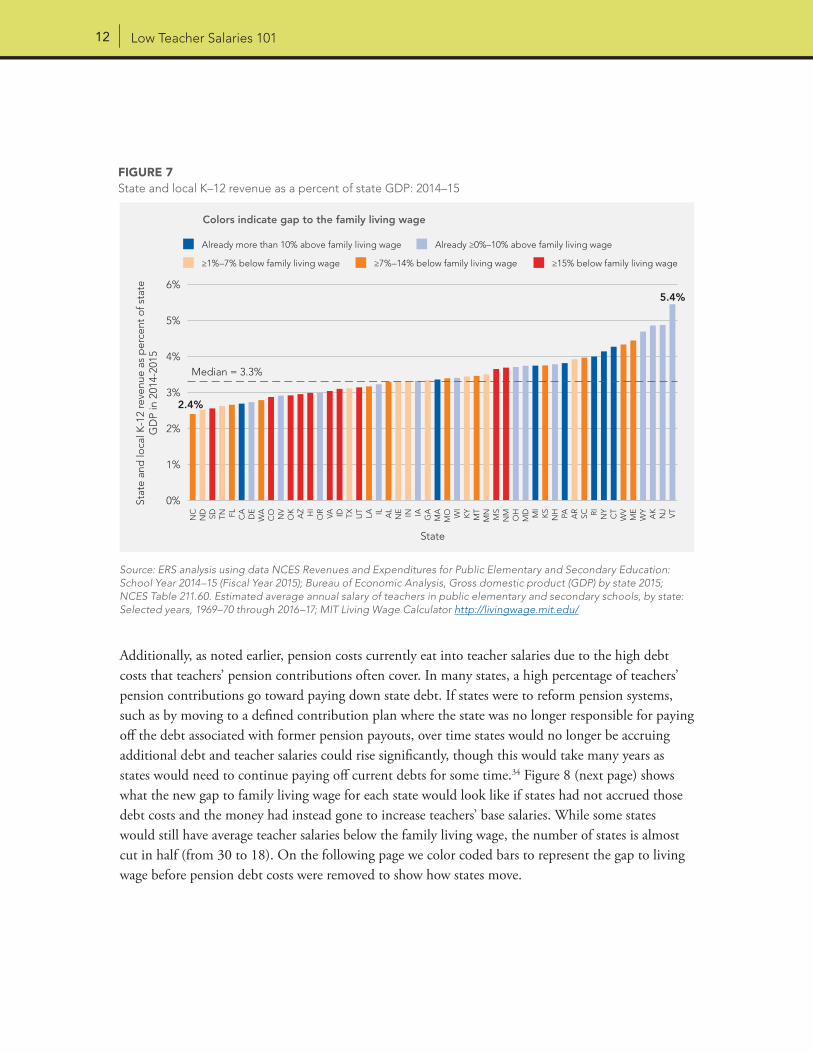
Additionally, as noted earlier, pension costs currently eat into teacher salaries due to the high debt costs that teachers’ pension contributions often cover. In many states, a high percentage of teachers’ pension contributions go toward paying down state debt. If states were to reform pension systems, such as by moving to a defined contribution plan where the state was no longer responsible for paying off the debt associated with former pension payouts, over time states would no longer be accruing additional debt and teacher salaries could rise significantly, though this would take many years as states would need to continue paying off current debts for some time.34 Figure 8 (next page) shows what the new gap to family living wage for each state would look like if states had not accrued those debt costs and the money had instead gone to increase teachers’ base salaries. While some states would still have average teacher salaries below the family living wage, the number of states is almost cut in half (from 30 to 18). On the following page we color coded bars to represent the gap to living wage before pension debt costs were removed to show how states move.
FIGURE 7 State and local K–12 revenue as a percent of state GDP: 2014–15
Source: ERS analysis using data NCES Revenues and Expenditures for Public Elementary and Secondary Education: School Year 2014–15 (Fiscal Year 2015); Bureau of Economic Analysis, Gross domestic product (GDP) by state 2015; NCES Table 211.60. Estimated average annual salary of teachers in public elementary and secondary schools, by state: Selected years, 1969–70 through 2016–17; MIT Living Wage Calculator http://livingwage.mit.edu/
Colors indicate gap to the family living wage
Low Teacher Salaries 101 13
–20%
Gap
fro
m a
vera
ge
teac
her
sala
ry t
o fa
mily
livi
ng w
age
afte
r re
mo
ving
pen
sio
n d
ebt
cost
s
–10%
30%
40%
20%
70%
50%
60%
SD OK ID FL VA CO AZ
MO UT
WA HI
NC
MS
NM IN MT
TN SC AL
KS
AR
TX DE
ND
GA
NE
MN
NV
NH IA
WV
WY VT
OR
MD LA KY
NJ
CA IL RI
MI
CT
PA MA
AK
–15%
64%
10%
State
0%
≥1%–7% below family living wage ≥7%–14% below family living wage ≥15% below family living wage
Already more than 10% above family living wage Already 1%–10% above family living wage
Recommendations for increasing teacher salary in new waysWhile many factors shape a state’s teacher labor market, the following recommendations are specifically tied to compensation reform. As states take on teacher compensation reform, they must create plans that address the entire value proposition for teachers—including salary, benefits, and working conditions—rather than merely putting more money into the same existing structures. States can leverage this reform opportunity to maximize the impact on student performance.
1. Invest new revenue in teacher salaries benchmarked against comparable professions, rather than staff increases. As spending rises with GDP growth, instead of adding services and staff, states and districts can make a paradigm shift by raising teacher salaries to keep pace with benchmarks from comparable professions—which, over time, may cause teacher salaries to rise
FIGURE 8 Gap from average teacher salary 2016–17 to family living wage after removing pension debt costs
Note: According to the Bellwether Education Partners report cited below, four states—Maine, New York, Ohio, and Wisconsin—do not identify what portion of employer contributions go toward debt costs.
Source: ERS analysis using data from NCES Table 211.60. Estimated average annual salary of teachers in public elementary and secondary schools, by state: Selected years, 1969–70 through 2016–17; MIT Living Wage Calculator http://livingwage.mit.edu/; Aldeman, Chad. “The Pension Pac-Man: How Pension Debt Eats Away at Teacher Salaries” Bellwether Education Partners. May 2016
Colors indicate gap to the family living wage, prior to removing pension debt cost (see Figure 5)
Low Teacher Salaries 101 15Low Teacher Salaries 10114
relative to inflation. This strategy may be particularly salient in states currently experiencing pressure to restore school staff to pre-recession levels, or in states where indicators of a teacher shortage are already high. The benefits of increasing staff should be weighed carefully against any immediate need to increase salaries to establish a healthy teacher pipeline.
2. Rethink teacher compensation structures: For example, consider “frontloading” teacher compensation or tying teacher role, responsibility, and contribution to salaries. Across the country, lockstep raises for teachers and legacy pension plans “backload” teacher compensation. By shifting raises forward to earlier in a teacher’s career and shifting to defined contribution (such as 403B) retirement plans that vest more quickly and do not penalize teachers who move across state lines during their careers, states might create significantly higher salaries for younger teachers at proportionately less cost than by simply adding salary investments on top of existing compensation practices which do not appear to serve teachers or taxpayers particularly well.35 “Frontloading” teacher compensation by increasing starting salaries and reducing the number of annual step increases while increasing their size could make the labor market more attractive to young teachers.36 By helping them meet salary benchmarks and reach a family living wage sooner, frontloading could encourage a higher percentage of teachers to remain in the profession.
States and districts can expand the role of high-performing teachers and those who take on greater challenges, rewarding them with stipends and leadership opportunities.37 By increasing the number of promotion and career pathways available to effective teachers and those who take on more challenging roles and deprioritizing the importance of bureaucratic lock-step raises that apply to all teachers regardless of effectiveness, states can enhance the ability of schools and districts to attract and retain top performers as well as exit those ineffective teachers who continue to struggle despite enhanced support.38
3. Link salary reform to other key initiatives to improve teaching and learning. In select states across the country, short school days or years, or various union provisions can sometimes hinder districts’ ability to manage workforce issues or to enact innovative staffing or grouping practices. States that have a short school day or year, for instance, might consider tying any catch-up salary increases to expanded instructional time, whether a longer day or year or both. As states invest to close the salary gap between teachers and other professions that are open to college graduates, they can leverage those salary increases as an opportunity to invest in other important reform initiatives, such as extending the school day or year and increasing time for teacher professional learning and collaboration.39
Low Teacher Salaries 101 15
ConclusionWhile small from a historical perspective, the recent decline in education funding appears to be exacerbating the growing teacher shortage and hindering efforts to address ongoing equity issues. This situation gives a clear call to action to state actors and stakeholders: To provide excellent education to all students, states must focus on how much they spend to support education and also find new ways to improve how well resources are used in local education agencies.
States struggling to attract and retain high-quality teachers need to act now to improve the overall attractiveness of the profession, particularly for their least experienced teachers, who have the highest turnover. Raising teacher salaries may have a long-term impact on the types of teachers states attract and retain and, ultimately, on student performance. Additionally, states may also need to fundamentally reexamine the way they deliver education to significantly improve the attractiveness of the profession and have the greatest impact on student outcomes. Creating this strong value proposition will require redesigning schools—organizing people, time, and money differently. For example, schedules must provide time for teachers to work and learn together, and for students to get enough time and teacher attention in areas where they’re struggling. Novice teachers must be protected from the most challenging assignments, and get the support they need, until they have fully mastered their skills. Attracting better teachers and improving results will require deliberate attention to the structure of compensation, with a mix of benefits, salary, and quality of work life that balances the need to invest in salary with the need to ensure that teachers have more practicable, rewarding jobs with more time to work together and plan individually.
How well: A long-term focus for all statesAny attempt to increase per-pupil funding for education should be preceded by an examination of how well states and districts are spending the resources they already have. In the past, the growth of the U.S. economy has fueled significant increases in per-pupil spending. By and large, these increases have gone to increase staff or services, while allowing teacher salaries to decline relative to other professions. States that reallocate their existing investments to attract and retain effective teachers are likely to see significant improvements in the cost-effectiveness of their K-12 investments and over time in their student performance.
But this is not the only initiative states can or must take to improve their use of resources. Our work with districts across the country reveals that relatively few K-12 resources are determined by deliberate, strategic choices. Instead, the distribution of people, time, and money is determined by fundamental structures—such as step and lane salary schedules or one-teacher, one-size-fits-all classrooms—that usually have little to do with effective practice. Indeed, research suggests that many of these often expensive practices have little to no impact on student outcomes.
17Low Teacher Salaries 10116
Fostering transformational improvement in resource effectiveness requires more than investing in cost efficiency studies or the occasional return on investment study to determine which programs can be safely cut. States must work instead to create an altered legal and policy context in which local districts and schools have both the autonomy and the support they need to change the fundamental structures that drive resource allocation, and then to reallocate their scarce resources to meet their priority needs in ways that are likely to improve student outcomes. States can even improve the effectiveness of resource use by evolving how they collect data to better support local resource decision-making.40
The current unhealthy state of the labor market for teachers is a challenge that states must meet, but it is also an opportunity for states to leverage the required salary increases for teachers to modernize the teaching profession and to adopt new structures and practices for staffing and scheduling that foster innovation and lead to more effective use of all K-12 resources—and ultimately student achievement.
Acknowledgements
This work resulted from the efforts of numerous people, both within and outside of ERS. We are
grateful to thought leaders who gave us insightful feedback on drafts of this paper: Chad Aldeman
and Rebecca Sibilia.
And we would like to gratefully acknowledge the many ERS team members who contributed
to this work in its various stages of development: David Rosenberg, Airian Williams, Christina
Baumgardner, Courtney Hitchcock, Jordan Ascher, JaMaar Everett, Danielle Smith, Melissa Galvez,
Alyssa Fry, Renée Sullivan, and Taran Raghuram.
Finally, we are grateful to the William and Flora Hewlett Foundation for its support, which allows
us to explore these concepts deeply. As always, we are indebted to and inspired by ERS partner
districts whose data and experience continue to inform our analysis and thinking. ERS is solely
responsible for the ideas presented in this paper, as well as any errors.
17
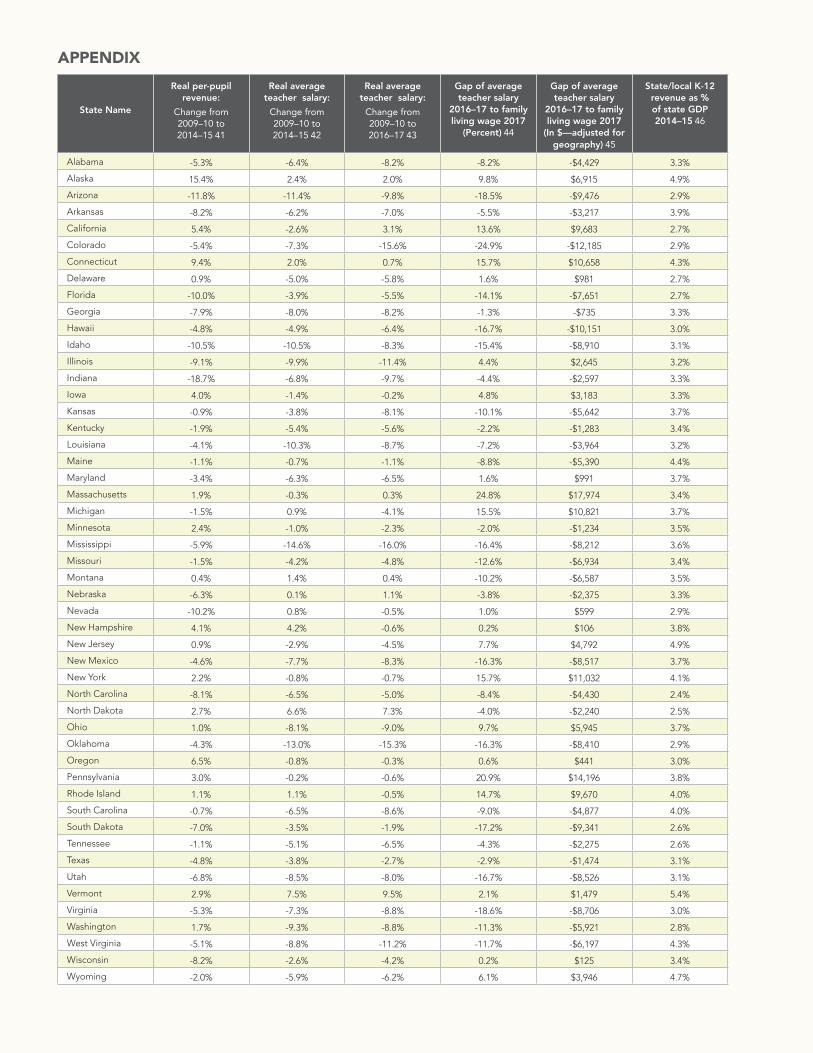
APPENDIX
State Name
Real per-pupil revenue:
Change from 2009–10 to 2014–15 41
Real average teacher salary:
Change from 2009–10 to 2014–15 42
Real average teacher salary:
Change from 2009–10 to 2016–17 43
Gap of average teacher salary
2016–17 to family living wage 2017
(Percent) 44
Gap of average teacher salary
2016–17 to family living wage 2017
(In $—adjusted for geography) 45
State/local K-12 revenue as % of state GDP 2014–15 46
Alabama -5.3% -6.4% -8.2% -8.2% -$4,429 3.3%
Alaska 15.4% 2.4% 2.0% 9.8% $6,915 4.9%
Arizona -11.8% -11.4% -9.8% -18.5% -$9,476 2.9%
Arkansas -8.2% -6.2% -7.0% -5.5% -$3,217 3.9%
California 5.4% -2.6% 3.1% 13.6% $9,683 2.7%
Colorado -5.4% -7.3% -15.6% -24.9% -$12,185 2.9%
Connecticut 9.4% 2.0% 0.7% 15.7% $10,658 4.3%
Delaware 0.9% -5.0% -5.8% 1.6% $981 2.7%
Florida -10.0% -3.9% -5.5% -14.1% -$7,651 2.7%
Georgia -7.9% -8.0% -8.2% -1.3% -$735 3.3%
Hawaii -4.8% -4.9% -6.4% -16.7% -$10,151 3.0%
Idaho -10.5% -10.5% -8.3% -15.4% -$8,910 3.1%
Illinois -9.1% -9.9% -11.4% 4.4% $2,645 3.2%
Indiana -18.7% -6.8% -9.7% -4.4% -$2,597 3.3%
Iowa 4.0% -1.4% -0.2% 4.8% $3,183 3.3%
Kansas -0.9% -3.8% -8.1% -10.1% -$5,642 3.7%
Kentucky -1.9% -5.4% -5.6% -2.2% -$1,283 3.4%
Louisiana -4.1% -10.3% -8.7% -7.2% -$3,964 3.2%
Maine -1.1% -0.7% -1.1% -8.8% -$5,390 4.4%
Maryland -3.4% -6.3% -6.5% 1.6% $991 3.7%
Massachusetts 1.9% -0.3% 0.3% 24.8% $17,974 3.4%
Michigan -1.5% 0.9% -4.1% 15.5% $10,821 3.7%
Minnesota 2.4% -1.0% -2.3% -2.0% -$1,234 3.5%
Mississippi -5.9% -14.6% -16.0% -16.4% -$8,212 3.6%
Missouri -1.5% -4.2% -4.8% -12.6% -$6,934 3.4%
Montana 0.4% 1.4% 0.4% -10.2% -$6,587 3.5%
Nebraska -6.3% 0.1% 1.1% -3.8% -$2,375 3.3%
Nevada -10.2% 0.8% -0.5% 1.0% $599 2.9%
New Hampshire 4.1% 4.2% -0.6% 0.2% $106 3.8%
New Jersey 0.9% -2.9% -4.5% 7.7% $4,792 4.9%
New Mexico -4.6% -7.7% -8.3% -16.3% -$8,517 3.7%
New York 2.2% -0.8% -0.7% 15.7% $11,032 4.1%
North Carolina -8.1% -6.5% -5.0% -8.4% -$4,430 2.4%
North Dakota 2.7% 6.6% 7.3% -4.0% -$2,240 2.5%
Ohio 1.0% -8.1% -9.0% 9.7% $5,945 3.7%
Oklahoma -4.3% -13.0% -15.3% -16.3% -$8,410 2.9%
Oregon 6.5% -0.8% -0.3% 0.6% $441 3.0%
Pennsylvania 3.0% -0.2% -0.6% 20.9% $14,196 3.8%
Rhode Island 1.1% 1.1% -0.5% 14.7% $9,670 4.0%
South Carolina -0.7% -6.5% -8.6% -9.0% -$4,877 4.0%
South Dakota -7.0% -3.5% -1.9% -17.2% -$9,341 2.6%
Tennessee -1.1% -5.1% -6.5% -4.3% -$2,275 2.6%
Texas -4.8% -3.8% -2.7% -2.9% -$1,474 3.1%
Utah -6.8% -8.5% -8.0% -16.7% -$8,526 3.1%
Vermont 2.9% 7.5% 9.5% 2.1% $1,479 5.4%
Virginia -5.3% -7.3% -8.8% -18.6% -$8,706 3.0%
Washington 1.7% -9.3% -8.8% -11.3% -$5,921 2.8%
West Virginia -5.1% -8.8% -11.2% -11.7% -$6,197 4.3%
Wisconsin -8.2% -2.6% -4.2% 0.2% $125 3.4%
Wyoming -2.0% -5.9% -6.2% 6.1% $3,946 4.7%
Low Teacher Salaries 101 19Low Teacher Salaries 10118
TECHNICAL APPENDIXMethodology & Assumptions for the Application of MIT Living Wage Metrics to Average Teacher Salary by State
Our analysis of the gap between average teacher salary and family living wage is based upon data from the Living Wage Calculator. The calculator was originally created by Tracey Farrigan at Penn State in 2003, and is now maintained by Dr. Amy Glasmeier at the Massachusetts Institute of Technology (MIT), with the support of Open Data Nation and West Arete. The living wage calculations therein are intended to represent the minimum income needed to cover very basic needs (food, child care, medical costs, housing, transportation and a miscellaneous “other”) across a variety of family structures (single adults and pairs; families with one or two parents and one to three children). The technical paper that explains the methodology stipulates the following: “The living wage model does not allow for what many consider the basic necessities enjoyed by many Americans. It does not budget funds for pre-prepared meals or those eaten in restaurants. It does not include money for entertainment nor does it does not allocate leisure time for unpaid vacations or holidays. Lastly, it does not provide a financial means for planning for the future through savings and investment or for the purchase of capital assets (e.g. provisions for retirement or home purchases).”47
We wanted to determine whether the average teacher salary in each state would enable a teacher to meet the bare minimum expenses for his or her family, as a way to “benchmark” the real-life value of a teacher salary. Therefore, we created a “family living wage” metric by calculating the weighted average of MIT’s reported living wage for all single-earner scenarios of both one- and two-parent households, with one to three kids. For weights, we assume that 31 percent of families are single parent families and that 22 percent of families have one child; 41 percent have two, and 37 percent have three, which come from research on the distribution of these family types nationally according to the US Census and the Pew Research Center.48 We then calculated the gap between this family living wage and the average salary of each state’s teacher workforce. We understand that there is more than one way to compare teacher pay to the living wage thresholds, and that more precise weighting of family types for just teachers or relevant population subsets could yield more precise estimates. We encourage those interested to engage directly with the MIT data and share with us their observations and perspectives. We also hope this metric will be used in combination with others such as local compensation packages for comparable professions.
Low Teacher Salaries 101 19
ENDNOTES
1. NCES Table 211.60. Estimated average annual salary of teachers in public elementary and secondary schools, by state: Selected years, 1969–70 through 2015–16, https://nces.ed.gov/programs/digest/d16/tables/dt16_211.60.asp.
2. ERS analysis using data from NCES Table 211.60. Estimated average annual salary of teachers in public elementary and secondary schools, by state: Selected years, 1969–70 through 2016–17 https://nces.ed.gov/programs/digest/d16/tables/dt16_211.60.asp; Glasmeier, Dr. Amy K. and the Massachusetts Institute of Technology, “MIT Living Wage Calculator,” Massachusetts Institute of Technology, 2018, http://livingwage.mit.edu/.
3. Ronfeldt, M., Loeb, S., & Wyckoff, J., “How teacher turnover harms student achievement,” American Educational Research Journal 50, no. 1 (2013): 4–36.
4. Sutcher, L., Darling-Hammond, L., and Carver-Thomas, D., “A Coming Crisis in Teaching? Teacher Supply, Demand, and Shortages in the U.S.,” The Learning Policy Institute, Sept. 15, 2016, https://learningpolicyinstitute.org/product/coming-crisis-teaching; Darling-Hammond, L., Furger, R., Shields, P. M., & Sutcher, L., “Addressing California’s Emerging Teacher Shortage: An Analysis of Sources and Solutions,” Learning Policy Institute, 2016, https://learningpolicyinstitute.org/product/addressing-californias-emerging-teacher-shortage. Educator Recruitment & Retention Task Force, “Educator retention and recruitment report,” Arizona Department of Education, 2015; Nix, Naomi, “Why Oklahoma is racing to put nearly 1,000 uncertified teachers in its classrooms,” The Seventy Four, December 1, 2015, https://www.the74million.org/article/why-oklahoma-is-racing-to-put-nearly-1000-uncertified-teachers-in-its-classrooms/.
5. ERS analysis using data from NCES Table 236.55. Total and current expenditures per pupil in public elementary and secondary schools: Selected years, 1919–20 through 2013–14; NCES Revenues and Expenditures for Public Elementary and Secondary Education: School Year 2014–15 (Fiscal Year 2015); NCES Table 106.70. Gross domestic product price index, Consumer Price Index, education price indexes, and federal budget composite deflator: Selected years, 1919 through 2015.
6. Expenditures shown include instruction, support services, food services, and enterprise operations, and exclude capital outlay and interest on debt.
7. ERS analysis using data from NCES Table 203.40, Enrollment in public elementary and secondary schools, by level, grade, and state or jurisdiction: Fall 2014; NCES State Comparisons of Education Statistics: 1969–70 to 1996–97; http://www.edchoice.org/wp-content/uploads/2015/07/11-2012-Staffing-Surge-WEB.pdf.
8. NCES Table 211.50. Estimated average annual salary of teachers in public elementary and secondary schools, by state: Selected years, 1959–60 through 2015–16.
9. Bureau of Labor Statistics Employer Costs for Employee Compensation 2003; Historical Listing (Annual), 1986–2001; Employer Costs for Employee Compensation Historical Listing (Quarterly), 2002–2003; Employer Costs for Employee Compensation Historical Listing, March 2004-December 2017.
10. ERS analysis using data from NCES Elementary and Secondary Information System, http://nces.ed.gov/ccd/elsi/; Revenue per pupil by source 1987–88 through 2013–14; NCES Table 106.70. Gross domestic product price index, Consumer Price Index, education price indexes, and federal budget composite deflator: Selected years, 1919 through 2015.
11. Allegretto, Sylvia and Mishel, Lawrence, “The Teacher Pay Gap Is Wider Than Ever,” Economic Policy Institute, Aug. 9, 2016, https://www.epi.org/publication/the-teacher-pay-gap-is-wider-than-ever-teachers-pay-continues-to-fall-further-behind-pay-of-comparable-workers/.
Low Teacher Salaries 101 21Low Teacher Salaries 10120
12. Ibid. Note: From the report: “Figure compares weekly wages. Regression-adjusted estimates include controls for age (quartic), education, race/ethnicity, geographical region, marital status, and gender for the pooled sample. Data are for workers age 18–64 with positive wages (excluding self-employed workers). Non-imputed data are not available for 1994 and 1995; data points for these years have been extrapolated and are represented by dotted lines.”
13. Allegretto, Sylvia, and Mishel, Lawrence, “The Teacher Pay Gap Is Wider Than Ever,” Economic Policy Institute, Aug. 9, 2016, https://www.epi.org/publication/the-teacher-pay-gap-is-wider-than-ever-teachers-pay-continues-to-fall-further-behind-pay-of-comparable-workers/. Note: Regression-adjusted estimates include controls for age (quartic), education, race/ethnicity, geographical region, marital status, and gender for the pooled sample. Data are for workers age 18–64 with positive wages (excluding self-employed workers). Non-imputed data are not available for 1994 and 1995; data points for these years have been extrapolated and are represented by dotted lines.”
14. Ibid
15. Miles, Karen Hawley, Pennington, Kaitlin, and Bloom, David, “Do More, Add More, Earn More,” Education Resource Strategies and the Center for American Progress, Feb. 2015, https://www.erstrategies.org/tap/do_more_add_more_earn_more.
16. Shields, Regis Anne; Lewis, Chris, “Rethinking the Value Proposition to Improve Teaching Effectiveness,” Education Resource Strategies, Dec. 2012, https://www.erstrategies.org/tap/rethinking_the_value_proposition.
17. Sutcher, L., Darling-Hammond, L., and Carver-Thomas, D., “A Coming Crisis in Teaching? Teacher Supply, Demand, and Shortages in the U.S.,” The Learning Policy Institute, Sept. 15, 2016, https://learningpolicyinstitute.org/product/coming-crisis-teaching.
18. U.S. Department of Education, Office of Postsecondary Education. “Teacher shortage areas nationwide listings 1990–1991 through 2017–18, 2017,”; Hale, Lee. “Behind the shortage of special education teachers: Long hours, crushing paperwork,” National Public Radio, Nov. 9 2015, http://www.npr.org/sections/ed/2015/11/09/436588372/behind-the-shortage-of-special-ed-teachers-long-hours-crushing-paperwork.
19. US Department of Education, National Teacher Preparation Database, 2017 Title II Report. Part of the Higher Education Act. https://title2.ed.gov/Public/Home.aspx.
20. “Believe & Prepare: Louisiana’s Next Generation Educators,” Louisiana Department of Education, Oct. 2016, https://www.louisianabelieves.com/docs/default-source/teaching/2017-believe-and-prepare-rural-report.pdf?sfvrsn=6.
21. Sutcher, L., Darling-Hammond, L., and Carver-Thomas, D., “A Coming Crisis in Teaching? Teacher Supply, Demand, and Shortages in the U.S.,” The Learning Policy Institute, Sept. 15, 2016, https://learningpolicyinstitute.org/product/coming-crisis-teaching.
22. Source: ERS analysis of data from Bureau of Labor Statistics, Employer Costs for Employee Compensation database.
23. Schmitz, Kirsten and Aldeman, Chad, “Retirement Reality Check: Grading State Teacher Pension Plans,” Bellwether Education Partners, June 2017, https://www.teacherpensions.org/resource/retirement-reality-check-grading-state-teacher-pension-plans.
24. Aldeman, Chad, “The Pension Pac-Man: How Pension Debt Eats Away at Teacher Salaries,” Bellwether Education Partners, May 2016, https://bellwethereducation.org/publication/pension-pac-man-how-pension-debt-eats-away-teacher-salaries; Aldeman, Chad and Johnson, Richard W., “Negative Returns: How State Pensions Shortchange Teachers,” Bellwether Education Partners, September 2015, https://www.teacherpensions.org/resource/negative-returns-how-state-pensions-shortchange-teachers.
Low Teacher Salaries 101 21
25. Aldeman, Chad, and Johnson, Richard W., “Negative Returns: How State Pensions Shortchange Teachers,” Bellwether Education Partners, September 2015, https://www.teacherpensions.org/resource/negative-returns-how-state-pensions-shortchange-teachers.
26. Schmitz, Kirsten and Aldeman, Chad, “Retirement Reality Check: Grading State Teacher Pension Plans,” Bellwether Education Partners, June 2017, https://www.teacherpensions.org/resource/retirement-reality-check-grading-state-teacher-pension-plans.
27. Aldeman, Chad, “The Pension Pac-Man: How Pension Debt Eats Away at Teacher Salaries,” Bellwether Education Partners, May 2016, https://bellwethereducation.org/publication/pension-pac-man-how-pension-debt-eats-away-teacher-salaries.
28. Glasmeier, Dr. Amy K., and the Massachusetts Institute of Technology, “MIT Living Wage Calculator,” Massachusetts Institute of Technology, 2018, http://livingwage.mit.edu/.
29. Boser, Ulric and Straus Chelsea, “Mid- and Late-Career Teachers Struggle with Paltry Incomes,” Center for American Progress, July 23 2014, https://cdn.americanprogress.org/wp-content/uploads/2014/07/teachersalaries-brief.pdf.
30. Geographic adjustments based on NCES Comparable Wage Index, http://bush.tamu.edu/research/faculty/Taylor_CWI/.
31. We calculated this index by finding, for each of these indicators, the number of standard deviations from average, and then averaged those four standard deviations together without any additional weights. The range for this index was a low of -1.78 for Arizona to a high of 1.11 for Washington.
32. Our regression model explained 45 percent of the variation in teacher labor market health across states. Independently, the gap between average teacher salary and family living wage had a 0.53 correlation with the labor market health index.
33. ERS analysis using data NCES Revenues and Expenditures for Public Elementary and Secondary Education: School Year 2014–15 (Fiscal Year 2015); Bureau of Economic Analysis, Gross domestic product (GDP) by state 2015; NCES Table 211.60. Estimated average annual salary of teachers in public elementary and secondary schools, by state: Selected years, 1969–70 through 2015–16; MIT Living Wage Calculator, http://livingwage.mit.edu/.
34. Aldeman, Chad, “The Pension Pac-Man: How Pension Debt Eats Away at Teacher Salaries,” Bellwether Education Partners, May 2016, https://bellwethereducation.org/publication/pension-pac-man-how-pension-debt-eats-away-teacher-salaries.
35. “Strategic Redesign of Teacher Compensation,” Education Resource Strategies https://www.erstrategies.org/tap/strategic_design_of_teacher_compensation. Education Resource Strategies. 2013. “Misfit Structures and Lost Opportunities.” https://www.erstrategies.org/tap/misfit_structures_lost_opportunities.
36. Miles, Karen Hawley (2016). “Effectively Integrating Teacher Leadership into the System.” Education Resource Strategies. https://www.erstrategies.org/news/effectively_integrating_teacher_leadership_into_the_system. Education Resource Strategies (2016). “The Teacher Compensation Calculator.” https://www.erstrategies.org/tap/teacher_compensation_calculator.
37. Shields, Regis Anne and Lewis, Chris (2012). “Rethinking the Value Proposition to Improve Teaching Effectiveness.” https://www.erstrategies.org/tap/rethinking_the_value_proposition.
38. Center for American Progress and Education Resource Strategies (2015). Do More, Add More, Earn More. https://www.erstrategies.org/tap/do_more_add_more_earn_more.
39. Miles, Karen Hawley; Ferris, Kristen; and Green, Genevieve Quist (2017). Designing Schools That Work. Education Resource Strategies. https://www.erstrategies.org/tap/designing_schools_that_work.
40. Frank, Stephen and Trawick-Smith, Joe (2014). Spinning Straw into Gold. Education Resource Strategies. https://www.erstrategies.org/cms/files/2392-spinning-straw-into-gold-paper.pdf.
Low Teacher Salaries 101 PBLow Teacher Salaries 10122
41. ERS analysis using data from NCES Elementary and Secondary Information System, http://nces.ed.gov/ccd/elsi/, Revenue per pupil by source 1987–88 through 2013–14; NCES Revenues and Expenditures for Public Elementary and Secondary Education: School Year 2014–15 (Fiscal Year 2015); NCES Table 106.70. Gross domestic product price index, Consumer Price Index, education price indexes, and federal budget composite deflator: Selected years, 1919 through 2015.
42. ERS analysis using data from NCES Table 211.60. Estimated average annual salary of teachers in public elementary and secondary schools, by state: Selected years, 1969–70 through 2015–16.
43. ERS analysis using data from NCES Table 211.60. Estimated average annual salary of teachers in public elementary and secondary schools, by state: Selected years, 1969–70 through 2016–17.
44. ERS analysis using data from NCES Table 211.60. Estimated average annual salary of teachers in public elementary and secondary schools, by state: Selected years, 1969–70 through 2016–17; MIT Living Wage Calculator, http://livingwage.mit.edu/.
45. ERS analysis using data from NCES Table 211.60. Estimated average annual salary of teachers in public elementary and secondary schools, by state: Selected years, 1969–70 through 2016–17; MIT Living Wage Calculator, http://livingwage.mit.edu/; NCES Comparable Wage Index, http://bush.tamu.edu/research/faculty/Taylor_CWI/.
46. ERS analysis using data NCES Revenues and Expenditures for Public Elementary and Secondary Education: School Year 2014–15 (Fiscal Year 2015); Bureau of Economic Analysis, Gross domestic product (GDP) by state, 2015.
47. Glasmeier, Dr. Amy K., and the Massachusetts Institute of Technology, “Living Wage Calculator: User Guide and Technical Notes,” Massachusetts Institute of Technology, 2018, http://livingwage.mit.edu/resources/Living-Wage-User-Guide-and-Technical-Notes-2017.pdf.
48. “The Majority of Children Live With Two Parents, Census Bureau Reports” The U.S. Census Bureau. November 2016. https://www.census.gov/newsroom/press-releases/2016/cb16-192.html; Livingston, Gretchen. “Family Size Among Mothers.” Pew Research Center. May 2015. http://www.pewsocialtrends.org/2015/05/07/family-size-among-mothers/.