Embed Size (px)
Citation preview
INTRODUCTIONWhile the U.S. economy has shown some signs ofrecovery—the U.S. unemployment rate has dipped below 8 percent from 10 percent three years ago—the economicoutlook for many working families is bleak. New data fromthe U.S. Census Bureau show that the number of low-income working families in the United States increased to10.4 million in 2011, up from 10.2 million a year earlier.2This means that nearly one third of all working families—32 percent—may not have enough money to meet basicneeds. At the same time, inequality among workingfamilies is increasing, as higher-income families receive alarger share of income relative to families at the bottom ofthe income distribution.
The total number of people in low-income working familiesnow stands at 47.5 million and could reach 50 million in thenext few years. That’s roughly equivalent to the totalnumber of people living in California, Oregon, andWashington combined. Although many people are returningto work, they are often taking jobs with lower wages andless job security, compared with the middle-class jobs theyheld before the economic downturn.3 These low-wage jobstypically offer limited opportunities for advancement, few (ifany) benefits, and create challenges for parents trying tobalance work and family responsibilities.
Supported by the Annie E. Casey, Ford, Joyce, and Kresgefoundations, The Working Poor Families Project (WPFP) isa national initiative to strengthen state policies that canassist families striving to work their way into the middleclass and achieve economic security. This data brief, based
LOW-INCOME WORKING FAMILIES: THE GROWINGECONOMIC GAP
Brandon Roberts, Deborah Povich and Mark Mather1
Working Poor Families Project | www.workingpoorfamilies.org | (301) 657-1480
THE WORKING POOR FAMILIES PROJECTPOLICY BRIEF WINTER 2012-2013
Key Findings for 2011
The number of low-incomeworking families in the UnitedStates increased to 10.4 millionin 2011, up from 10.2 million in 2010.
The total number of people inlow-income working familiesnow stands at 47.5 million.
In 2011, there were 23.5million children in low-incomeworking families.
There are 10 states, spreadacross the U.S., where theshare of low-income workingfamilies increased by 5percentage points or morebetween 2007 and 2011.
The richest 20 percent ofworking families took homenearly half (48 percent) of all income, while those in thebottom 20 percent received less than 5 percent of theeconomic pie.
2Working Poor Families Project | www.workingpoorfamilies.org
on new 2011 data from the U.S. Census Bureau’sAmerican Community Survey, provides a snapshotof low-income working families in America andhighlights the growing economic divide betweenworking families at the top and bottom of theeconomic ladder. Meeting the needs of theseworkers and their children—and providing theseworkers with opportunities for better employment—is critical for putting the United States on a pathtoward economic stability and growth.
AS ECONOMY RECOVERS, MANY WORKINGFAMILIES LEFT BEHINDThere are several signs that the U.S. economy isbouncing back, if slowly, from the 2007-2009 GreatRecession and its aftermath. The unemploymentrate is down sharply from its double-digit peak inOctober 2009. The stock market has recoveredmost of its losses, with the Dow Jones Industrial
Average doubling from its recent low in March2009. The housing market has shown signs ofrecovery, with promising trends in home prices,sales, and construction. And after three years ofsteady increases, the official poverty rateremained flat in 2011 at 15 percent.
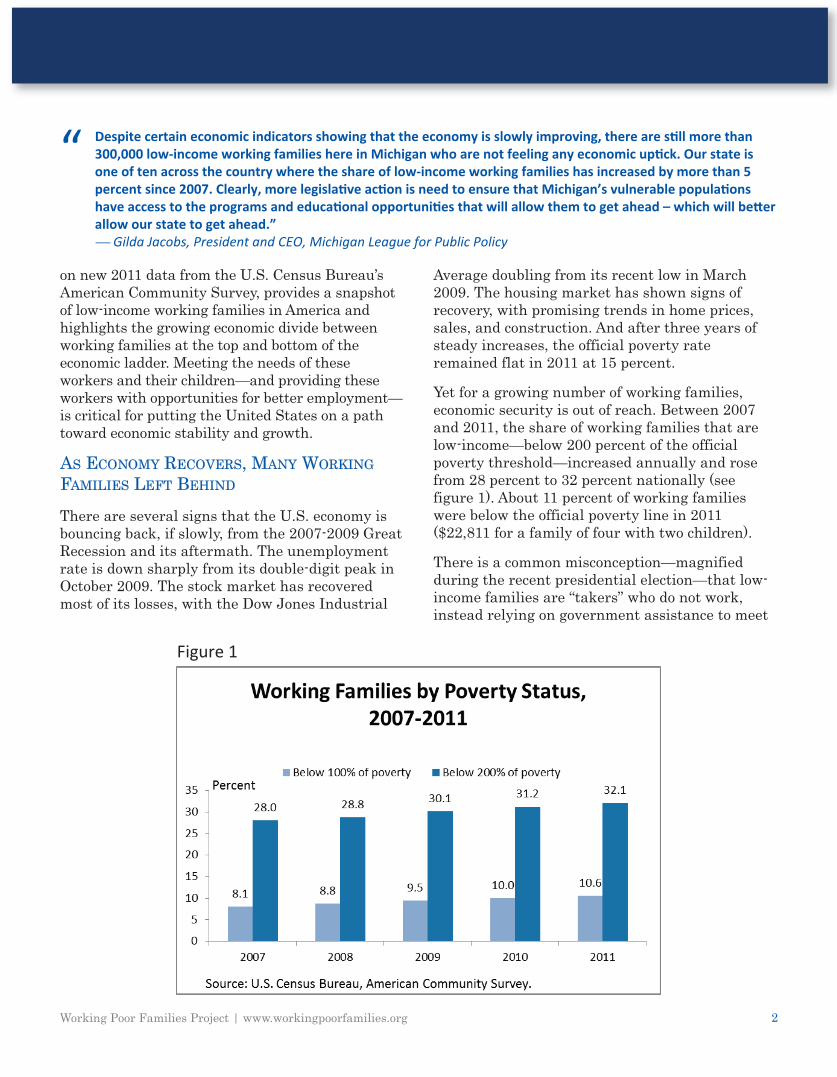
Yet for a growing number of working families,economic security is out of reach. Between 2007and 2011, the share of working families that arelow-income—below 200 percent of the officialpoverty threshold—increased annually and rosefrom 28 percent to 32 percent nationally (seefigure 1). About 11 percent of working familieswere below the official poverty line in 2011($22,811 for a family of four with two children).
There is a common misconception—magnifiedduring the recent presidential election—that low-income families are “takers” who do not work,instead relying on government assistance to meet
Figure 1
“ Despite certain economic indicators showing that the economy is slowly improving, there are still more than300,000 low-income working families here in Michigan who are not feeling any economic uptick. Our state isone of ten across the country where the share of low-income working families has increased by more than 5percent since 2007. Clearly, more legislative action is need to ensure that Michigan’s vulnerable populationshave access to the programs and educational opportunities that will allow them to get ahead – which will betterallow our state to get ahead.”— Gilda Jacobs, President and CEO, Michigan League for Public Policy
3Working Poor Families Project | www.workingpoorfamilies.org
their needs. But in 2011, more than 7 in 10 low-income families and half of all poor families wereworking. They simply didn’t earn enough money topay for basic living expenses. The share of low-income families that are working has droppedslightly in recent years, from 73 percent in 2009 to71 percent in 2011, which may reflect the difficultyin finding work in the current job market. In thisdata brief, families are classified as “working” ifthey are significantly attached to the labor force(in general, working at least 39 weeks during theprevious year). Many low-income families includemultiple adults who are combining their workeffort to meet the household’s financial needs.
In 2011, 61 percent of low-income working familieshad a high housing cost burden—defined asspending more than 33 percent of household incomeon housing costs such as mortgage or rent payments,utilities, and other expenses. For working familiesbelow the official poverty threshold, 81 percent hadhigh housing cost burdens.
Working families have many other daily expenses,including transportation costs to get to and fromwork and payments to child care providers. Familybudgets have also been squeezed by the high costof gasoline. Although low-income families haveshorter commutes, on average, compared with
higher-income families, they spend a higher shareof their income on gasoline (8.6 percent vs. 2.1percent).4 And in rural areas, many low-incomeworkers commute long distances to find jobs withdecent wages.5
Many low-income working families are employedin the service sector, often in jobs that requireworking long hours and on nights or weekends,creating significant challenges for child care. In2011, about one-fourth of adults in low-incomeworking families were employed in just eightoccupations, as cashiers, cooks, health aids,janitors, maids, retail salespersons, waiters andwaitresses, or drivers. Some of these occupations—especially those involving health care—are amongthe fastest-growing occupations in the country.6Cashiers make up the single-largest occupationalgroup, with nearly a million people in low-incomeworking families in 2011.
RISING INEQUALITYIncome inequality has increased steadily in theUnited States, as those at the top have seen incomesrise while those at the bottom have experiencedstagnant or declining income.7 Part of the problemis the low wages paid to those with fewer skills andlower levels of education. But in many cases, low-
Figure 2
4Working Poor Families Project | www.workingpoorfamilies.org
wage workers are involuntarily working part-time—often in multiple, temporary jobs.8
The recession has made it even more difficult forfamilies to find full-time work with decent wages.Although many people are returning to work,employment opportunities have been concentratedin the high-wage and low-wage sectors, withslower growth in jobs paying middle-class wages.9Some of the fastest-growing jobs during therecovery have included those in retail, foodpreparation, food service, health care, clerical jobs,and customer assistance.10 However, medianhourly wages in these occupations are often nothigh enough to cover basic household expenses,even for families working full time. Others haveseen their jobs disappear altogether, includingmany carpenters, real estate brokers, painters,secretaries, and insurance workers11 —leavingthem with skills that are needed less in the neweconomy.
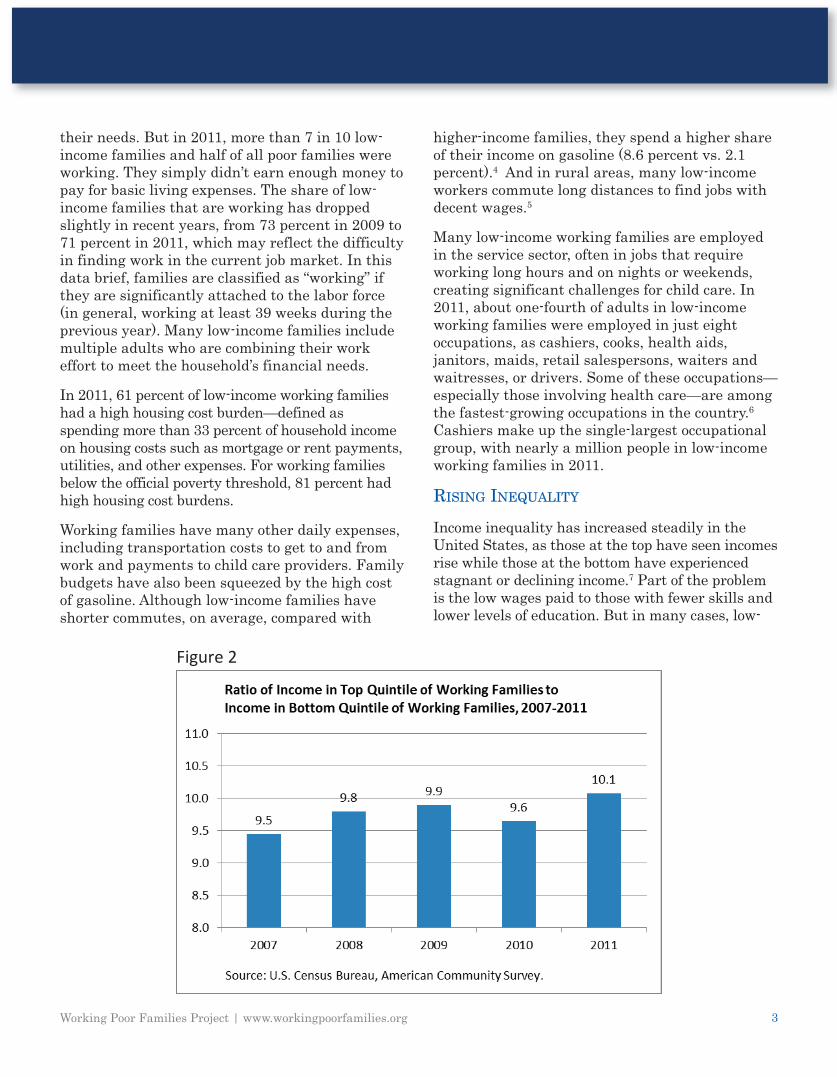
There is a broad economic gap between high- andlow-income working families, and this gap isgrowing. In 2011, the top 20 percent of workingfamilies received 10.1 times the total incomereceived by the bottom 20 percent of workingfamilies, up from 9.5 in 2007 (see figure 2). To putthis another way, the richest 20 percent of workingfamilies took home nearly half (48 percent) of allincome, while those in the bottom 20 percentreceived less than 5 percent of the economic pie.
CHILDRENChildren do not end up in low-income families bychoice or by chance. Their circumstances aredetermined in large part by their parents’ abilityto find good jobs that pay reasonable wages.Children growing up in low-income families haveworse health and educational outcomes, are more
likely to live in single-parent families, and aremore likely to experience violent crime comparedwith children in more affluent families.12 Low-income children have fewer opportunities forupward mobility, and are more likely to have low-quality jobs and lower earnings when they reachadulthood.13 Therefore, in many low-incomefamilies, poverty is transmitted from parents tochildren, from one generation to the next.
Child poverty has increased sharply since theonset of the recession in 2007, and children inworking families have not been immune to effectsof the economic downturn. The proportion ofchildren in working families who are low-incomeincreased from 33 percent in 2007 to 37 percent in2011. In 2011, there were 23.5 million children inlow-income working families. Children in single-parent families are especially vulnerable becausethere are often fewer potential earners in thehousehold.14
EDUCATIONEducation is a key factor affecting the economicsecurity of working families. In today’s economy,workers need to have some postsecondaryeducation or credentials in order to compete formiddle-class jobs.15 In 2011, the mean annualearnings for those with a bachelor’s degree orhigher were $69,387, compared with $20,936among those who dropped out of high school.16This earnings differential translates into vastlydifferent opportunities and resources for childrengrowing up in these families. In 2011, about 29percent of low-income working families included aparent who did not graduate from high school.Increasing the proportion of workers with at leastsome postsecondary education would go a long waytoward narrowing the income gap betweenworking families.
“ Income inequality—or inequality of outcomes—is very much tied to inequality of opportunity. Those who lackedgood educational opportunities as children need additional supports as adults if we are to ensure that everyonehas the same shot at the American dream. Additionally, when we invest in an adult’s education and job training,we are also providing their children with better educational opportunities, because children benefit enormouslywhen their parents are well educated.”— Veronica C. García, Ed.D., executive director, New Mexico Voices for Children
5Working Poor Families Project | www.workingpoorfamilies.org
RACIAL/ETHNIC MINORITIES
Low-income working families aredisproportionately headed by racial/ethnicminorities. In 2011, 42 percent of all workingfamilies had at least one minority parent, but 59percent of low-income working families had one ormore minority parents. More than one-fourth oflow-income working families also had at least oneparent with difficulty speaking English. Foreign-born workers, especially those from Latin America,are among the most vulnerable because they oftenface barriers in accessing public programsdesigned to help low-income families andchildren.17
The high proportion of minorities who are lowincome is significant because of projected changesin the racial/ethnic composition of families.Latinos, including many who are first- or second-
generation immigrants, are disproportionatelyconcentrated in low-wage jobs, and make up arapidly growing share of the U.S. population. Therecent recession has made immigrantsparticularly vulnerable to job loss.
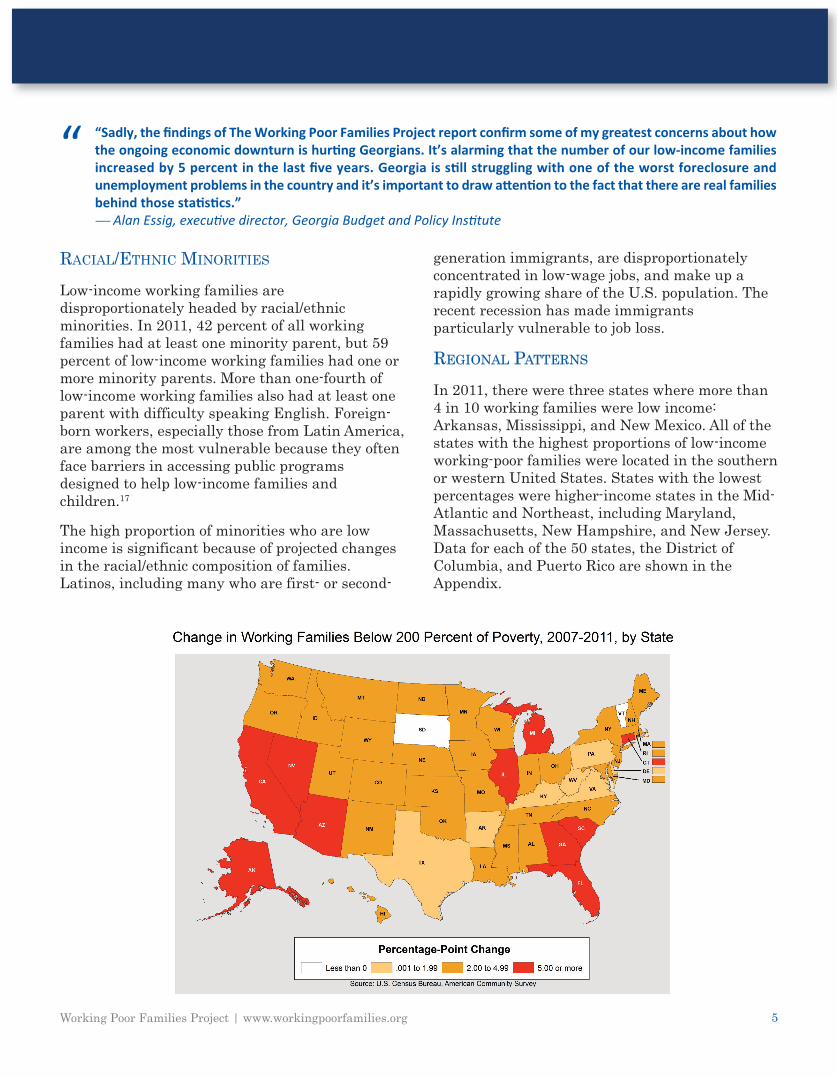
REGIONAL PATTERNSIn 2011, there were three states where more than4 in 10 working families were low income:Arkansas, Mississippi, and New Mexico. All of thestates with the highest proportions of low-incomeworking-poor families were located in the southernor western United States. States with the lowestpercentages were higher-income states in the Mid-Atlantic and Northeast, including Maryland,Massachusetts, New Hampshire, and New Jersey.Data for each of the 50 states, the District ofColumbia, and Puerto Rico are shown in theAppendix.
“ “Sadly, the findings of The Working Poor Families Project report confirm some of my greatest concerns about howthe ongoing economic downturn is hurting Georgians. It’s alarming that the number of our low-income familiesincreased by 5 percent in the last five years. Georgia is still struggling with one of the worst foreclosure andunemployment problems in the country and it’s important to draw attention to the fact that there are real familiesbehind those statistics.”— Alan Essig, executive director, Georgia Budget and Policy Institute
6Working Poor Families Project | www.workingpoorfamilies.org
The increase in low-income working families hasbeen uneven, geographically. There are 10 stateswhere the share of low-income working familiesincreased by 5 percentage points or more between2007 and 2011: Alaska, Arizona, California,Connecticut, Florida, Georgia, Illinois, Michigan,Nevada, and South Carolina (see map). Theincreases in California, Florida, and Illinois—aswell as New York and Texas—are notable becauseof the large populations in those states. Nevadahas seen the biggest increase in working familiesbelow 200 percent of poverty (a 12 percentage-point increase since 2007).
Many states in the South and Southwestexperienced rapid population and housing growthprior to the recession and were hit hard when thehousing market crashed. Parts of the Midwest andNortheast have experienced much slower growthin low-income working families. Since 2007, theshare of low-income working families declined injust two states—South Dakota and Vermont—andin the District of Columbia.
STRENGTHENING WORKING FAMILIES ANDBUILDING A STRONGER ECONOMY FORFUTURE GENERATIONSPoor and low-income working families arecomposed of workers who form the backbone of oureconomy, and of children who will assume that rolein the future. As in the past, a disproportionatenumber of low-income working families are headedby immigrants.18 They have the same aspirationsfor their families and future generations as today’stop earners who come from parents andgrandparents who arrived in this country seekinga better economic future. No less are the hopes ofminorities, who continue to be unduly representedin low-income working families.
The story of the American Dream is premised onthe ability of families—regardless of race, ethnic
background or country of origin—to better theireconomic circumstances through hard work. Yet asthe data in this brief clearly indicate, today’sworking families face a more challenging situationthan those in the past. The current economicconditions continue to adversely impact too manyworking families, and public policies are notsufficiently structured to provide opportunitiesthat support their economic ambitions. As recenteconomic mobility studies suggest, the AmericanDream that hard work leads to economicadvancement and security has become less of areality and more of a myth.19
In the current federal and state budget climate,policymakers need to make difficult choices thatwill have long-term consequences for millions ofworking families and their children. The recentaction on federal fiscal policy—extending theEarned Income Tax Credit, child tax credit, andemergency unemployment benefits—was a step inthe right direction.
However, upcoming decisions on investments infederal programs that help working families meetbasic needs and support their efforts for economicadvancement are at risk of severe cuts. In addition,many of the proposals under consideration wouldsignificantly reduce federal funds available tostates and local areas, which provide an importantsource of funding for children’s education as well asskills training, nutritional assistance, and medicalservices for poor and low-income working families.20
Both federal and state policymakers stress theneed to strengthen the middle class, but cuttingprograms and benefits that serve low-incomeworking parents and their children wouldundermine that goal. Furthermore, reducingpublic investments could worsen incomeinequality, hinder economic mobility, and increasethe prospects of transmitting poverty from onegeneration to the next.
“ Twenty-one percent of Connecticut’s working families are now low-income, increasing from 16 percent in just thepast five years. Connecticut needs to invest in human infrastructure. We need to make sure our citizens can workhard and earn a wage that sustains housing and health care and lets them provide for their children. More actionis needed now to ensure that all families in our state can build a secure future.” — Jim Horan, executive director, Connecticut Association for Human Services
7
One particular area of concern is public supportfor education and skills training. Significantreductions in state investments in two- and four-year colleges have led to increases in studenttuition and fees, making postsecondary educationless affordable. Similarly, potential cuts in federalPell Grants would reduce funds that help low-income students afford college.21 Without thesefunds and other education and skill developmentresources, fewer low-income adults will be able toupgrade their own skills and credentials as well ashelp their children gain the education they need tosecure a strong economic future.
Federal and state policies can play a crucial role inassuring that all jobs offer wages that can sustaina family and contribute to a strong community andeconomy. Policymakers must work to reverserising income inequality and restore the value ofwork by strengthening both job growth and jobquality. For job quality this means takingproactive steps to ensure that work is fair andproperly rewarded. Specific policy actions includeraising and indexing the minimum wage;providing all workers access to paid sick days andfamily leave; enforcing work rules and wagestandards; and ensuring that if public job creationexpenditures persist, they benefit workers andtheir communities.
For the past 10 years, the Working Poor FamiliesProject has generated data on the conditions ofworking families in America and for each of the 50states and the District of Columbia. Over thisperiod, the unfortunate reality is that theeconomic status of working families has declined,with the United States now experiencing thehighest number and percentage of low-incomeworking families over the past decade. For mostworking families, the 21st century has been littlemore than a constant struggle to maintain
employment, earnings, benefits, savings, andhard-earned assets.
The continuing economic bifurcation of Americanworkers and society must end and, in fact, must bereversed, if we expect a stronger economy for thefuture. Federal and state policymakers have clearchoices in addressing current federal and statebudget matters. It is time to give priority to theneeds and aspirations of America’s working families,with the goal of restoring their path to economicsecurity and prosperity as well as ensuringeconomic opportunity for future generations.
For questions about this policy brief or theWorking Poor Families Project contact:
Brandon [email protected], (301) 657-1480
Working Poor Families Project | www.workingpoorfamilies.org
THE WORKING POORFAMILIES PROJECT
Strengthening State Policies for America’s Working Poor
Millions of American breadwinners work hard tosupport their families. But, despite theirdetermination and effort, many are mired in low-wage jobs that provide inadequate benefits and offerfew opportunities for advancement. In fact, nearly 1in 3 American working families now earn wages solow that they have difficulty surviving financially.
Launched in 2002 and currently supported by theAnnie E. Casey, Ford, Joyce and Kresge foundations,The Working Poor Families Project is a nationalinitiative that works to improve these economicconditions. The project partners with state nonprofitorganizations and supports their policy efforts tobetter prepare America’s working families for amore secure economic future.
For more information:www.workingpoorfamilies.org
“ Almost 40 percent of Texas’ working families are low-income, which is well above the national average. Folks inour state are working hard, but for many families, working hard just isn’t enough. Things need to change, includingbetter wages and more affordable options for higher education and post-secondary job training. This WPFP reportshines a spotlight on the continuing economic insecurity over one million Texan working families are facing andcalls for improved state and federal polices to better support Texas families.”— F. Scott McCown, executive director, Center for Public Policy Priorities
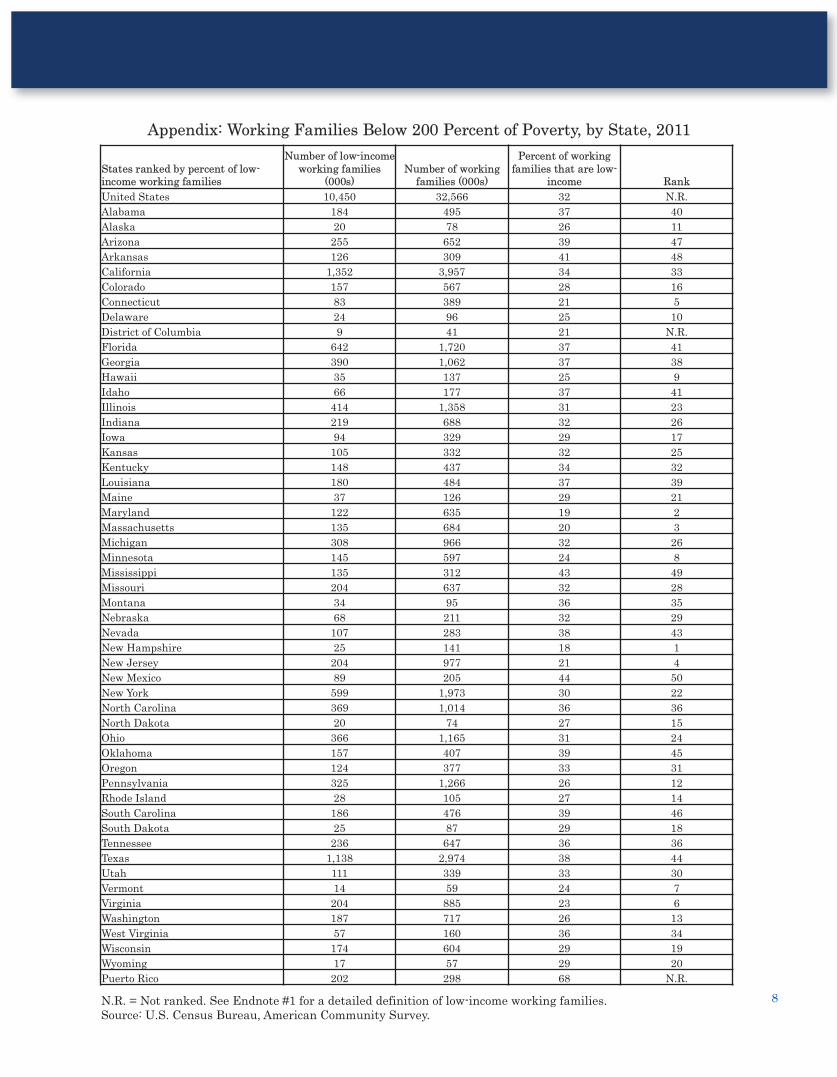
Appendix: Working Families Below 200 Percent of Poverty, by State, 2011
N.R. = Not ranked. See Endnote #1 for a detailed definition of low-income working families.Source: U.S. Census Bureau, American Community Survey.
States ranked by percent of low-income working families
Number of low-incomeworking families
(000s)Number of workingfamilies (000s)
Percent of workingfamilies that are low-
income RankUnited States 10,450 32,566 32 N.R.Alabama 184 495 37 40Alaska 20 78 26 11Arizona 255 652 39 47Arkansas 126 309 41 48California 1,352 3,957 34 33Colorado 157 567 28 16Connecticut 83 389 21 5Delaware 24 96 25 10District of Columbia 9 41 21 N.R.Florida 642 1,720 37 41Georgia 390 1,062 37 38Hawaii 35 137 25 9Idaho 66 177 37 41Illinois 414 1,358 31 23Indiana 219 688 32 26Iowa 94 329 29 17Kansas 105 332 32 25Kentucky 148 437 34 32Louisiana 180 484 37 39Maine 37 126 29 21Maryland 122 635 19 2Massachusetts 135 684 20 3Michigan 308 966 32 26Minnesota 145 597 24 8Mississippi 135 312 43 49Missouri 204 637 32 28Montana 34 95 36 35Nebraska 68 211 32 29Nevada 107 283 38 43New Hampshire 25 141 18 1New Jersey 204 977 21 4New Mexico 89 205 44 50New York 599 1,973 30 22North Carolina 369 1,014 36 36North Dakota 20 74 27 15Ohio 366 1,165 31 24Oklahoma 157 407 39 45Oregon 124 377 33 31Pennsylvania 325 1,266 26 12Rhode Island 28 105 27 14South Carolina 186 476 39 46South Dakota 25 87 29 18Tennessee 236 647 36 36Texas 1,138 2,974 38 44Utah 111 339 33 30Vermont 14 59 24 7Virginia 204 885 23 6Washington 187 717 26 13West Virginia 57 160 36 34Wisconsin 174 604 29 19Wyoming 17 57 29 20Puerto Rico 202 298 68 N.R.
8
ENDNOTES1 Brandon Roberts and Deborah Povich manage The WorkingPoor Families Project. Mark Mather is a demographer at thePopulation Reference Bureau, where he specializes in issuesrelated to U.S. social and demographic trends, child andfamily well-being, and data from the U.S. Census Bureau. 2 In this brief, a family is a primary married couple or single-parent family with at least one co-resident child younger than18 years old. A family is defined as working if all familymembers ages 15 and older either have a combined workeffort of 39 weeks or more in the prior 12 months, or all familymembers ages 15 and older have a combined work effort of 26to 39 weeks in the prior 12 months and one currentlyunemployed parent looked for work in the prior four weeks. In2011, the low-income threshold for a family of four with twochildren was $45,622. Unless otherwise noted, data are fromthe Population Reference Bureau’s analysis of the U.S.Census Bureau’s American Community Survey (ACS).Estimates from the ACS are subject to both sampling andnonsampling error.3 National Employment Law Project. August 2012. “The Low-Wage Recovery and Growing Inequality.”http://www.nelp.org/page/-/Job_Creation/LowWageRecovery2012.pdf?nocdn=1.4 The Urban Institute. September 2008. “Impact of Rising GasPrices on Below-Poverty Commuters.”http://www.urban.org/UploadedPDF/411760_rising_gas_prices.pdf.5 Mather, Mark. June 2004. “Housing and CommutingPatterns in Appalachia.”http://www.arc.gov/research/researchreportdetails.asp?REPORT_ID=38.6 U.S. Department of Labor, Bureau of Labor Statistics.February 1, 2012. “Fastest growing occupations, 2010 andprojected 2020.” http://www.bls.gov/emp/ep_table_103.htm.7 U.S. Census Bureau. August 2012. “Table H-4.Gini Ratiosfor Households, by Race and Hispanic Origin of Householder:1967 to 2011.”http://www.census.gov/hhes/www/income/data/historical/inequality.8 U.S. Department of Health and Human Service, ASPEResearch Brief. February 2009. “Who are Low-WageWorkers?”http://aspe.hhs.gov/hsp/09/lowwageworkers/rb.shtml.
9 National Employment Law Project. August 2012. “The Low-Wage Recovery and Growing Inequality.”http://www.nelp.org/page/-/Job_Creation/LowWageRecovery2012.pdf?nocdn=1.10 Ibid.11 Ibid.
12 Brooks-Gunn, Jeanne, Greg J. Duncan, and NancyMaritato. 1997. “Poor Families, Poor Outcomes: The Well-Being of Children and Youth,” in Consequences of Growing UpPoor, ed. Duncan, G.J., and Brooks-Gunn, J. (New York:Russell Sage Foundation): 1-17; and Lewit, Eugene M., DonnaL. Terman, and Richard E. Behrman. “Children and Poverty:Analysis and Recommendations,” Future of Children, 7 (no.2). Summer/Fall 1997.13 Mayer, Susan E. 1997. “Trends in the Economic Well-Beingand Life Chances of America’s Children,” in Consequences ofGrowing Up Poor, ed. Duncan, Greg J. and Jeanne Brooks-Gunn (New York: Russell Sage Foundation): 46-69.14 Mather, Mark. May 2010. “U.S. Children in Single-ParentFamilies.”http://www.prb.org/Publications/PolicyBriefs/singlemotherfamilies.aspx.15 Carnevale, Anthony P. April 9, 2012. “For a Middle-ClassLife, College Is Crucial.”http://www.nytimes.com/roomfordebate/2012/03/01/should-college-be-for-everyone/for-a-middle-class-life-college-is-crucial.16 U.S. Census Bureau. August 2012. “PINC-04.EducationalAttainment--People 18 Years Old and Over, by Total MoneyEarnings in 2011, Work Experience in 2011, Age, Race,Hispanic Origin, and Sex.”http://www.census.gov/hhes/www/cpstables/032012/perinc/pinc04_000.htm.17 Pereira, Krista M., et al. May 2012. “Barriers toImmigrants’ Access to Health and Human ServicesPrograms.”http://aspe.hhs.gov/hsp/11/ImmigrantAccess/Barriers/rb.shtml.18 One third of low-income working families have a parent whois not American born.19 See: http://www.pewstates.org/projects/economic-mobility-project-328061.20 Center on Budget and Policy Priorities. December 6, 2012.“Reducing Federal Deficits Without a Significant RevenueIncrease Would Shift Substantial Costs to States.”http://www.cbpp.org/cms/?fa=view&id=3870.21 Kogan, Richard and Kelsey Merrick. April 26, 2012.“President's Budget Would Reduce Pell Grant Shortfall; RyanBudget Would Nearly Triple It.”http://www.cbpp.org/cms/index.cfm?fa=view&id=3760.
9Working Poor Families Project | www.workingpoorfamilies.org