Embed Size (px)
Citation preview
Lowering lattice forces in drug substance crystals to improve dissolution and solubility
Dissertation zur Erlangung des naturwissenschaftlichen Doktorgrades der
Julius-Maximilians-Universität Würzburg
vorgelegt von
M.Sc. ETH
Medicinal and Industrial Pharmaceutical Sciences
Toni Widmer
aus
Gränichen CH
Würzburg 2015
Eingereicht bei der Fakultät für
Chemie und Pharmazie am
Gutachter der schriftlichen Arbeit
1. Gutachter: Prof. Dr. Dr. Lorenz Meinel
2. Gutachter: Prof. Dr. Ulrike Holzgrabe
Prüfer des öffentlichen Promotionskolloquiums
1. Prüfer:
2. Prüfer:
3. Prüfer:
Datum des öffentlichen Promotionskolloquiums
Doktorurkunde ausgehändigt am
Die vorliegende Arbeit wurde unter Anregung und Anleitung von
Herr Prof. Dr. Dr. Lorenz Meinel
Lehrstuhl für Pharmazie und Lebensmittelchemie der Julius-Maximilians-Universität Würzburg und
Dr. Bruno Galli
Technical Research and Development Novartis AG, Basel
angefertigt

in the preform – in the beginning – in the first form
lies more power than in anything that follows
Louis I. Kahn – Architec
PUBLICATIONS AND PRESENTATIONS
Solid Dispersion Formulation Patents
PAT056255-US-PSP02 & PAT056255-US-PSP03
Balk A., Widmer T., Wiest J., Bruhn H., Rybak J-C., Matthes P., Müller-Buschbaum K., Sakalis A., Lühmann T., Berghausen J., Holzgrabe U., Galli B., Meinel L. (2015) Ionic liquid versus prodrug strategy to address formulation challenges. Pharmaceutical Research 32(6): 2154-2167
Balk A., Wiest J., Widmer T., Galli B., Holzgrabe U., Meinel L. (2015) Transformation of acidic poorly water soluble drugs into ionic liquids. European journal of pharmaceutics and biopharmaceutics 94: 73–82
Balk A., Wiest J., Widmer T., Bruhn H., Merget B., Sotriffer C., Galli B., Holzgrabe U., Meinel L (2015) Tuning dissolution , supersaturation and hygroscopicity of an API by counterion design. Unpublished manuscript
Balk A., Widmer T., Wiest J., Berghausen J., Holzgrabe U., Galli B, Meinel L. (20th August 2014) Lowering lattice forces in drug substance crystals to improve dissolution and solubility, MiniSymposium at Novartis Pharma AG in Basel
1
CONTENT
CONTENT 1
ABBREVIATIONS 3
INTRODUCTION 4
LATTICE FORCES 4
Lattice forces - solvation and solubility 5
SOLUBILITY AS PREREQUISITE FOR CLINICAL EFFECTS 6
BIOPHARMACEUTICAL CLASSIFICATION SYSTEM 6
BCS of currently developed compounds 8
FACTORS INFLUENCING ORAL EXPOSURE 8
PHYSIOLOGY OF THE GASTRO‐INTESTINAL TRACT OF MICE, RAT, DOG AND HUMAN 13
SALT FORMATION APPROACH 15
Increasing lattice energy and harnessing solvation energy 15 pH dependent solubility of salts of acids 16 Pharmaceutical advantages of salts 18 Pharmaceutical disadvantages of salts 18
SOLID DISPERSIONS APPROACH 20
Create and maintain supersaturation 20 Stabilizing solid dispersions 21 Preparation of solid dispersions 22 Advantages of solid dispersions 23 Disadvantages of solid dispersions 24
INTRODUCTION OF THE ACIDIC NCE: THE AMPA COMPOUNDS AND THEIR LIMITATIONS IN PERFORMACE 25
INTRODUCTION OF THE NEUTRAL NCE AND ITS EXPOSURE LIMITATIONS 26
HYPOTHESIS 27
SCOPE OF THE THESIS 27
BACKGROUND AND MOTIVATION 28
APPROACHES TO LOWER LATTICE FORCES IN ACIDIC AND NEUTRAL COMPOUNDS 29
Limitations of Salt Formation 29 Ionic liquids: When conventional salt forming is not applicable 29 Limitations of the neutral compound 30 Optimizing solid dispersion 31
2
RESULTS 32
ACIDS 33
NEUTRALS 59
DISCUSSION 83
IN VITRO 83
IN VIVO 91
SUMMARY 106
ZUSAMMENFASSUNG 110
CONCLUSIONS AND OUTLOOK 114
CONTRIBUTIONS 117
EXPERIMENTAL 118
MATERIALS 118
Methods Acids 119 Animal testing acids 124 Methods Neutrals 131 Animal Testing neutrals 134
ACKNOWLEDGEMENTS 138
BIBLIOGRAPHY 139
PERMISSIONS 147
3
ABBREVIATIONS
AMPA α-amino-3-hydroxy-5-methyl-4-isoxazolepropionic acid (receptor) API Active pharmaceutical ingredient AUC / AUClast Area under the curve / AUC until last measured data point BAV Bioavailability BCS Biopharmaceutics classification system cm Centimeter Cmax Maximal plasma concentration DAPI 4',6-diamidino-2-phenylindole DL Drug load DSC Differential scanning calorimetry DVS Dynamic vapor sorption FaSSIF / FeSSIF Fasted/Fed simulated intestinal fluid FDA Food and Drug Administration GIT Gastrointestinal tract HTS High throughput screening hERG Ether-à-go-go-related gene, potassium ion channel HPMC / HPMC-AS Hydroxypropyl methylcellulose / HPMC acetate succinate ICH International conference on harmonisation kN Kilo newton IL Ionic liquid logP Distribution-coefficient in water/octanol Mg Magnesium ml Milliliters MTD Maximal tolerated dose NMP N-Methyl-2-Pyrrolidone Papp Apparent permeability coefficient PAMPA Parallel artificial membrane permeation assay PEG Polyethylene glycol pHmax pH where solution is saturated with salt and free forms pKa Logarithmic acid dissociation constant PI3K Phosphatidylinositol-4,5-bisphosphate 3-kinase PK Pharmacokinetic PoC Proof of concept PVP / PVP VA Polyvinylpyrrolidone / Polyvinylpyrrolidone vinyl acetate SEM-EDX Scanning electron microscope energy dispersive X-ray analysis RC Radio controlled SD Solid dispersion TEER Trans-epithelial electrical resistance Tg Glass transition temperature Tmax Time of maximal plasma concentration TBAM / TBPH Tetrabutylammonium / Tetrabutylphosphonium XRPD X-ray powder diffraction μl /μm Micro liter / micro meter
4
INTRODUCTION
Poorly water soluble drugs account for the majority of newly developed small molecule therapeutics today (1). Within this context, the term ‘poorly water soluble drugs’ is quite loosely defined and often refers to challenges regarding solubility (thermodynamic) or the dissolution rate (kinetic). Molecules bearing these intrinsic properties may potentially lead to slow dissolution and low fraction dissolved in the intestines which correlates often with insufficient or inconsistent systemic exposure and leads to sub-optimal efficacy in patients, particularly when delivered orally (2). The poor aqueous solubility provides a number of challenges in pharmaceutical development (3). Advances in the pharmaceutical sciences have led to the establishment of a number of approaches for addressing the issues of low aqueous solubility.
The following introduction is starting off a brief description of the physical prerequisites typically impacting the solubility and dissolution of poorly water soluble drugs followed by sections integrating biopharmaceutical and physiological considerations. Thereafter, pharmaceutical strategies are presented to address these challenges, namely salt formation and solid dispersions, as these are more relevant approaches within the scope of this thesis. Furthermore, the active pharmaceutical ingredients (API) used in this thesis are presented. Lastly, the scope of the thesis is summarized and the motivation for this work is delineated.
LATTICE FORCES
Lattice forces are based on the attraction between the single moieties of molecules. The strength of lattice forces has impact on the solid state and related physical properties such as melting point, boiling point, vapor pressure and solubility. There are four main types of intermolecular forces which can be distinguished (4):
H bonding
A hydrogen bond is defined as attractive interaction between molecules or moieties, in which hydrogen is bound to a highly electronegative atom, such as nitrogen, oxygen or halogens. It is not a true bond but a particularly strong variant of a dipole-dipole attraction.
Ionic interactions
The force of attraction between oppositely charged particles is directly proportional to the product of the charges on the two ions and inversely proportional to the square of the distance between the objects. The lattice energy for ionic crystals is considerably greater in
5
magnitude than for non-ionized solids since the electrostatic attraction of ions is the strongest force among the four lattice forces.
Dipole interactions
Dipole-dipole interactions are electrostatic interactions between permanent dipoles among molecules. The electric dipole is a result of the separation of positive and negative electrical charges based on the different electronegativity of the atoms in the molecule. The partially positively part of a polar molecule will attract the negative part of the neighboring molecule.
Van der Waals interactions
Van der Waals forces are relatively weak electric forces that attract neutral molecules among themselves. The presence of molecules that are permanent dipoles temporarily distorts the electron charge in other neighboring polar or nonpolar molecules, thereby inducing further polarization which results in attractive moments between them. A further force of attraction is based on electron motion within atoms. The center of negative charge of the electrons and the center of positive charge of the atomic nuclei would not be likely to coincide. Thus, the fluctuation of electrons makes molecules time-varying dipoles, although the average of the instantaneous polarization over a brief time interval may be zero. This time varying dipole also induces an attraction between molecules.
LATTICE FORCES - SOLVATION AND SOLUBILITY
Solvation is an interaction of a solute with the solvent, which leads to stabilization of the solute species in the solution. Solubility is the analytical composition of a saturated solution expressed as a proportion of a designated solute in a designated solvent (5). For solvation to occur, energy is required to overcome the lattice forces attracting ions and molecules among themselves in the solid state.
Different thermodynamic factors provide the required energy for breaking up the attraction between the molecules in a solid. These factors include the energy released when ions or molecules of the solid associate with molecules of the solvent (enthalpy) and the increase in disorder in a system (entropy).
Dissolution of a solute in a solvent is energetically favored when interactions with the solvent are formed. This dissolving process depends on the free energy change of the system and is typically divided in the following steps. Firstly, a cavity must be created in the solvent. The creation of the cavity is enthalpically unfavorable as the ordered structure of the solvent decreases resulting in fewer interactions between the molecules of the solvent. Secondarily, the solute must separate out from the solid solute. This is enthalpically unfavorable based on solute interactions which are breaking. The increase in entropy which goes along with it is energetically favorable. Thirdly, the solute occupies the cavity created in the solvent. This results in favorable interactions between solute and solvent. Fourthly, the
6
entropy increase is favorable as the mixture is more disordered than when the solute and solvent are not mixed (4).
Solubility is, therefore, the result of (i) the energy required to overcome the lattice forces of the solid state and (ii) the energy liberated by solvation of the molecules or ions and (iii) the increase in entropy. These events are the fundamental basis for this thesis in which the lattice forces were deliberately lowered by different pharmaceutical approaches with the overall goal to increase the solubility of the API.
SOLUBILITY AS PREREQUISITE FOR CLINICAL EFFECTS
The oral application route is the most frequently used and favored one. At least 50% of all APIs are administered orally (6). Therefore, the drug has to cross the gastro intestinal wall to reach the circulation and show a clinical effect. Since the majority of the compounds cross the biologic membranes only in the molecularly dissolved state, Amidon and Lennernäs investigated the correlation of clinical effects of a drug with their dissolution, solubility and permeation properties. Their model is based on Fick’s First law and modified to equation 1. The flux (J) of a drug through the gastrointestinal wall depends on the permeability coefficient of the drug through the gastrointestinal barrier and the drug concentration in the gastrointestinal lumen (assuming sink conditions) (2).
P C [Eq 1]
P permeabilitycoefficient[m2/s]C drugconcentrationinthegastrointestinallumen[mol/l]
This correlation was the basis for a classification system which is currently used in many companies and the FDA guidelines: the Biopharmaceutical Classification System (BCS) which will be closer described in the following chapter.
BIOPHARMACEUTICAL CLASSIFICATION SYSTEM
Pharmaceutical compounds have reached an immense diversity over the last decades. Conventional development meant screening natural compounds from a library for a potential target and, therefore, the number of chemical entities was limited by the size of this library. With the evolution of modern drug design, the approach changed towards target identification and a high throughput screening for active compounds on the target. These hits are further optimized with all variety of modern chemistry leading to the high diversity of compounds which are observed nowadays. Confronted with the infinite amount of chemical structures, a classification system came up allowing a first categorization of a new compound based on equation 1 where the flux through a membrane is determined by solubility and permeation
7
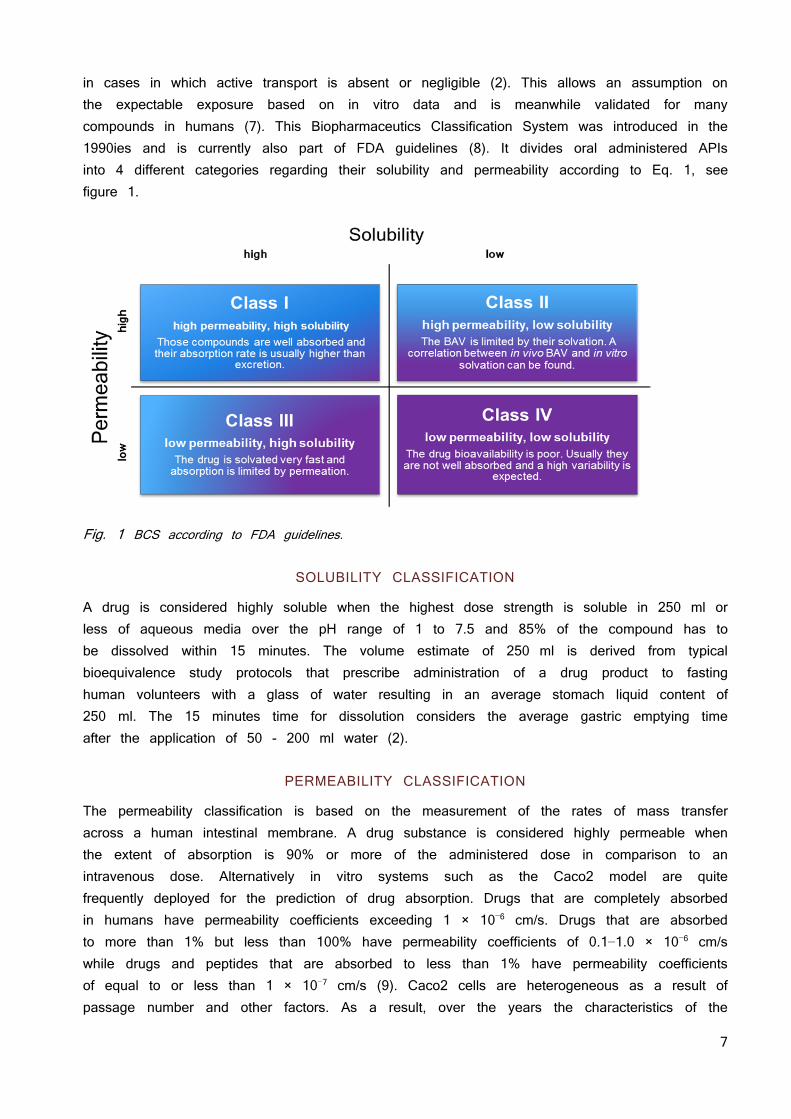
in cases in which active transport is absent or negligible (2). This allows an assumption on the expectable exposure based on in vitro data and is meanwhile validated for many compounds in humans (7). This Biopharmaceutics Classification System was introduced in the 1990ies and is currently also part of FDA guidelines (8). It divides oral administered APIs into 4 different categories regarding their solubility and permeability according to Eq. 1, see figure 1.
Fig. 1 BCS according to FDA guidelines.
SOLUBILITY CLASSIFICATION
A drug is considered highly soluble when the highest dose strength is soluble in 250 ml or less of aqueous media over the pH range of 1 to 7.5 and 85% of the compound has to be dissolved within 15 minutes. The volume estimate of 250 ml is derived from typical bioequivalence study protocols that prescribe administration of a drug product to fasting human volunteers with a glass of water resulting in an average stomach liquid content of 250 ml. The 15 minutes time for dissolution considers the average gastric emptying time after the application of 50 - 200 ml water (2).
PERMEABILITY CLASSIFICATION
The permeability classification is based on the measurement of the rates of mass transfer across a human intestinal membrane. A drug substance is considered highly permeable when the extent of absorption is 90% or more of the administered dose in comparison to an intravenous dose. Alternatively in vitro systems such as the Caco2 model are quite frequently deployed for the prediction of drug absorption. Drugs that are completely absorbed in humans have permeability coefficients exceeding 1 × 10⁻⁶ cm/s. Drugs that are absorbed to more than 1% but less than 100% have permeability coefficients of 0.1−1.0 × 10⁻⁶ cm/s while drugs and peptides that are absorbed to less than 1% have permeability coefficients of equal to or less than 1 × 10⁻⁷ cm/s (9). Caco2 cells are heterogeneous as a result of passage number and other factors. As a result, over the years the characteristics of the
8
cells used in different laboratories around the world have diverged substantially, which makes it difficult to compare results across labs (10). Thus reference substances with known permeability such as atenolol or mannitol can be used as internal standard facilitating the comparison of results among different labs.
BCS OF CURRENTLY DEVELOPED COMPOUNDS
Compounds in drug pipelines tend to have lower solubility than marketed drugs, resulting in an increase of BCS II compounds from approximately 30% to 50 – 60% and the corresponding decrease of BCS I compounds from approximately 40% to 10 – 20% in the last 10 years (1). This is a result of high throughput screening (HTS) based research strategies for lead identification. Screening for structures with high affinities to their targets generally favors high molecular weight and lipophilic molecules. They have good permeation properties but poor water solubility. Therefore, most of the selected compounds are BCS II due to the prioritization of binding to a target over solubility (11). Their oral absorption is most likely limited by in vivo dissolution and solubility. For BCS Class II drugs, excipients and solid state can, in principle, affect both solubility and permeability and, therefore, formulation development and solid state investigations of poorly soluble compounds got more and more into the focus of industry and research.
FACTORS INFLUENCING ORAL EXPOSURE
Exposure after oral administration is the result of solubility, absorption and elimination (12). Elimination is mentioned here for completeness and will not be further discussed. The term solubility is further divided in the following subcategories: dose, dissolution and supersaturation as mandatory components to provide the drug substance in a dissolved state. The dissolved state is a prerequisite for another key parameter for absorption hence oral bioavailability - the permeation through membranes. Permeation depends not only on the dissolved state of a compound but also on other variables which are not parameters in the introduced simplified mathematical models based on Fick’s law. Ignored parameters include the APIs solubility in a membrane through which transport is thought, the need for exclusively passive transport, the requirement for sink conditions, or the impact of the thickness of membranes (9; 13; 14).
DOSE
As for BCS classification, the dose decides whether it can be dissolved in the intestines or not. Fluid volume of the human upper small intestines varies between 50 ml and 1100 ml with an average of 500 ml (15). Equation 2 can be used to calculate the maximal oral dose which can be solubilized (Dmax) and, therefore, is available for absorption under the
9
assumption the compound completely dissolves in the average stomach fluid volume of 250 ml in accordance with the BCS (2).
max S V [Eq 2]
S solubilityofthedrugatpH1‐7.5[mg/ml]V volumeofthestomachorearlyintestines[250ml]
Only solubilized drug can be taken up in the intestines (16). Hence, the dose is a crucial factor regarding absorption. This is often seen in clinics, small doses of a drug are well absorbed, but higher doses do not show a proportional increase in exposure (17). Higher exposure is demanded by regulatory authorities to define the maximal tolerated dose in human but also in toxicology studies during earlier clinical development and thus, plateauing of bioavailability may translate into a development challenge (8).
DISSOLUTION
The rate of dissolution is a key factor for exposure since it decides how fast the maximal solubility of a compound is reached and available for absorption.
It is described by the Noyes–Whitney equation 3.
s [Eq 3]
A surfaceareaofthedrug[m2]C concentrationofthedruginthedissolutionmedia[mol/l]Cs concentrationofthedruginthediffusionlayer[mol/l]D diffusioncoefficient[m2/s]L diffusionlayerthickness [m]
The rate of dissolution can be improved by increasing the surface area of the compound by reducing its particle size. For many drugs, reducing the particle size leads to an increased exposure (18). However, it should be noted that although the reduction of particle size increases the specific surface area and the dissolution rate. It does not affect solubility (which is an intrinsic thermodynamic property) and can only be altered by changing the chemical structure or the solid form of the API (19).
10
SOLUBILITY
The general solubility equation (equation 4) has been used extensively in pharmaceutical sciences. It assesses the solubility of a compound based on the melting point and the logarithm of the octanol - water partition coefficient (20).
0 0.5– 0.01 m 25 – [Eq 4]
S0 intrinsicsolubility[mol/l)Tm meltingpoint[K]logP wateroctanolpartitioncoefficient
It can be concluded that solubility is limited by the melting point and logP. The logP is an intrinsic property and not tunable but the melting point is used as surrogate parameter for the lattice energy which is influenced by the polymorph of the drug. The higher the melting point the lower the solubility of the polymorph. This is based on the lattice forces in the solid state. Higher lattice forces need more energy to overcome the lattice forces and dissolve the molecules. Crystalline APIs have a lower energy level and stronger lattices compared to amorphous forms; therefore, more energy is needed to overcome the crystal forces during dissolution limiting its dissolution and solubility. Amorphous forms have a higher energy level due to reduced lattice forces and thus less energy is needed to dissolve the molecules out of the solid amorphous API resulting in increased solubility and dissolution (21).
SUPERSATURATION
Equilibrium solubility is by definition when a compound in the solid state is in equilibrium with a solution of that compound hence, resulting the free enthalpy to be zero (22). The actual amount of compound dissolved (apparent solubility) may be lower or higher than at equilibrium solubility. From a pharmaceutical point of view, apparent solubility above the equilibration solubility is of interest and is referred to as supersaturation (23; 24). The degree of supersaturation can be expressed by the supersaturation ratio S (Equation 5) (24).
eq
[Eq 5]
C concentration[mol/l]Ceq concentrationatequilibriumsolubility[mol/l]
A prerequisite for the generation of the thermodynamically instable supersaturated state of neutral molecules is that the drug is administered as a high energy form. Less stable polymorphs or amorphous solids require less energy to dissolve, resulting in higher apparent solubilities and increased dissolution rates. Since a supersaturated solution is characterized by a higher chemical potential compared to the equilibrium solubility, the difference in chemical
11
potential (being proportional to the free enthalpy when the molar amount of molecules remains unchanged) is the driving force for drug precipitation.
Precipitation from a supersaturated solution is a thermodynamically favored process based on the decreasing free enthalpy of the system, hence spontaneous (25). Kinetically, drug precipitation from a supersaturated solution is essentially driven by nucleation and crystal growth (26). Dissolved molecules form small aggregates starting from the supersaturated solution. These can then grow to macroscopic crystals. Although precipitation is a thermodynamically favored event, nucleation requires activation energy to form the initial clusters. The increased chemical potential of small clusters of molecules as compared to larger precipitates can be attributed to the pressure difference due to the small radius of the small clusters (LaPlace pressure), thereby leading to supersaturation in the surrounding solution. In case this energy of activation is too high, no new crystals can be formed and a metastable, supersaturated solution arises. Alternatively or in addition, the escape of molecules from the small clusters may be quite rapid, thereby preventing crystal growth and precipitation. The range within which supersaturated concentrations are observed (for a certain time period and without the formation of new crystals) is referred to as the metastable zone. In many cases, stabilizing supersaturation by precipitation inhibition can be considered as increasing the range of the metastable zone (24). Mathematical background can be found elsewhere (27).
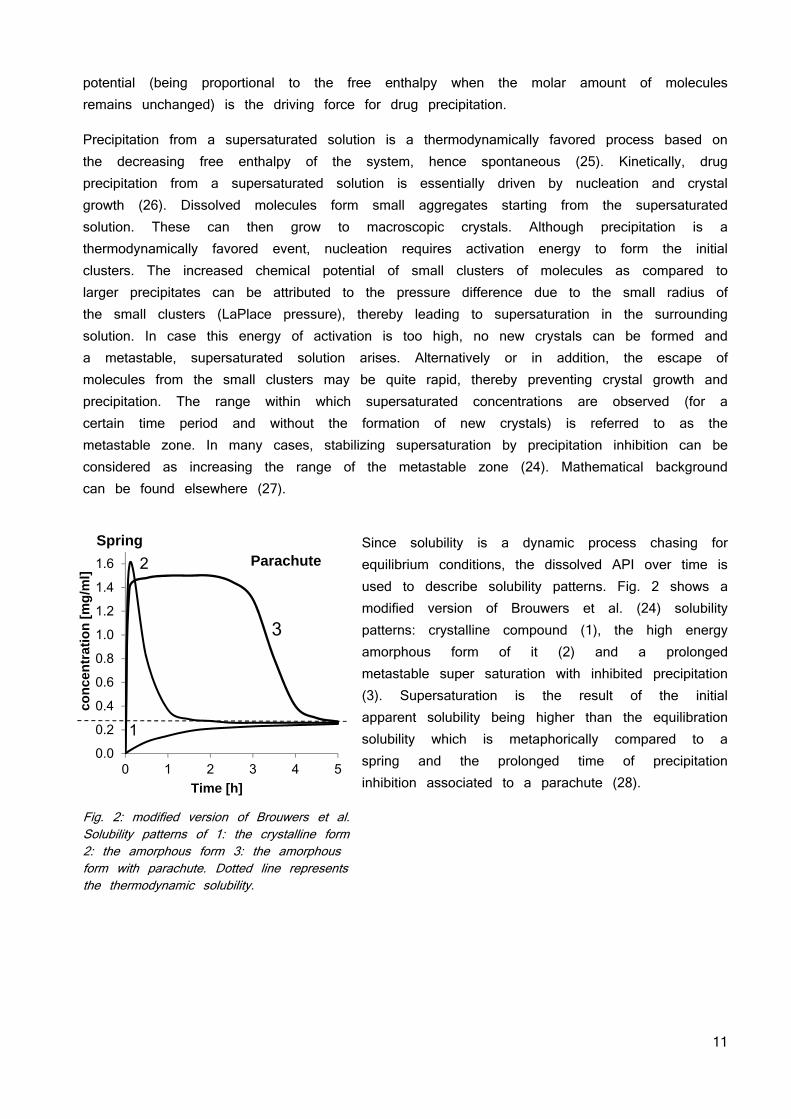
Since solubility is a dynamic process chasing for equilibrium conditions, the dissolved API over time is used to describe solubility patterns. Fig. 2 shows a modified version of Brouwers et al. (24) solubility patterns: crystalline compound (1), the high energy amorphous form of it (2) and a prolonged metastable super saturation with inhibited precipitation (3). Supersaturation is the result of the initial apparent solubility being higher than the equilibration solubility which is metaphorically compared to a spring and the prolonged time of precipitation inhibition associated to a parachute (28).
Fig. 2: modified version of Brouwers et al. Solubility patterns of 1: the crystalline form 2: the amorphous form 3: the amorphous form with parachute. Dotted line represents the thermodynamic solubility.
0.0
0.2
0.4
0.6
0.8
1.0
1.2
1.4
1.6
1.8
0 1 2 3 4 5
con
cen
trat
ion
[m
g/m
l]
Time [h]
SpringParachute
1
2
3
12
The spring itself may not increase absorption of poor soluble drugs; however, if a supersaturated drug solution exists for a time period sufficient for absorption (parachute), the increased intraluminal drug concentration may result in enhanced exposure (23), according to equation 1 which is graphically implemented in fig 3. Higher intraluminal drug concentration results in higher flux through the membrane and thus higher exposure for compounds with passive transport. The spring and parachute performance Sperf can be expressed by comparing the AUC of the non-supersaturating form with the AUC of the supersaturating form, in the respective dissolved compound vs. time profiles; see equation 6.
perf eq
sup [Eq 6]
AUCeq Areaunderthecurveofsolubilityvstimefornon‐supersaturatingformAUCsup Areaunderthecurveofsolubilityvstimeforsupersaturatingform
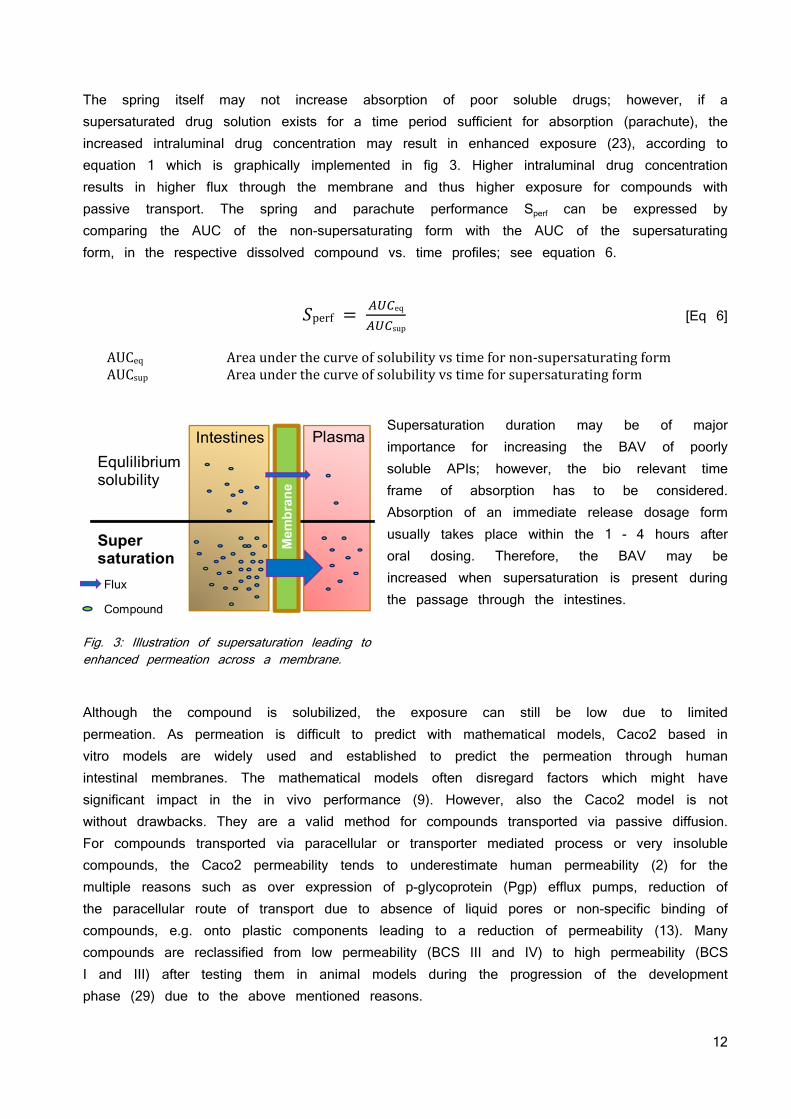
Supersaturation duration may be of major importance for increasing the BAV of poorly soluble APIs; however, the bio relevant time frame of absorption has to be considered. Absorption of an immediate release dosage form usually takes place within the 1 - 4 hours after oral dosing. Therefore, the BAV may be increased when supersaturation is present during the passage through the intestines.
Fig. 3: Illustration of supersaturation leading to enhanced permeation across a membrane.
Although the compound is solubilized, the exposure can still be low due to limited permeation. As permeation is difficult to predict with mathematical models, Caco2 based in vitro models are widely used and established to predict the permeation through human intestinal membranes. The mathematical models often disregard factors which might have significant impact in the in vivo performance (9). However, also the Caco2 model is not without drawbacks. They are a valid method for compounds transported via passive diffusion. For compounds transported via paracellular or transporter mediated process or very insoluble compounds, the Caco2 permeability tends to underestimate human permeability (2) for the multiple reasons such as over expression of p-glycoprotein (Pgp) efflux pumps, reduction of the paracellular route of transport due to absence of liquid pores or non-specific binding of compounds, e.g. onto plastic components leading to a reduction of permeability (13). Many compounds are reclassified from low permeability (BCS III and IV) to high permeability (BCS I and III) after testing them in animal models during the progression of the development phase (29) due to the above mentioned reasons.
13
PHYSIOLOGY OF THE GASTRO-INTESTINAL TRACT OF MICE, RAT, DOG AND HUMAN
Understanding the gastrointestinal tract (GIT) is necessary to model and predict the solubility, permeability and thus absorption of a compound within a given species or to extrapolate between species. However, the physicochemical properties of a compound are the most important factors as discussed before. These include the lipophilicity, ionization state and molecular size of a compound. Furthermore, the absorption can be greatly affected by other components present in the GIT; those other components can origin from the formulation used or the food eaten prior to or parallel to dosing. Perhaps the most crucial properties that affect absorption, and the ones that cause the greatest interspecies differences, are those that are specific to the test organism: the anatomy and physiology of the GIT (30).
As mentioned in the chapter “Dose” the volume of the GIT fluids in the stomach or early intestines are essential factors for absorption since it decides whether a dose can be solubilized. The majority of APIs are weak acids or bases and their solubility is closely related with the pH at the absorption site (31). It is well known that the solubility of an acid or base is dependent on its ionization as the ionized species are more soluble in aqueous surrounding than the neutrals (32).
Essentially, the following equilibrium (equation 7) exists when an acidic drug is dissolved in water:
a
⇔ ‐ [Eq 7]
[AH] protonatedacidconcentration[mol/l]
Ka equilibriumconstant
[A‐] deprotonatedacidconcentration[mol/l]
[H3O+] hydroniumionconcentration[mol/l]
Equation 7 can be solved for Ka which results in equation 8:
a
‐ [Eq 8]
As ionization constants are inconvenient small numbers, they are expressed as their negative logarithm as in equation 9:
a a [Eq 9]
pKa acidicdissociationconstant
Ka equilibriumconstant
14
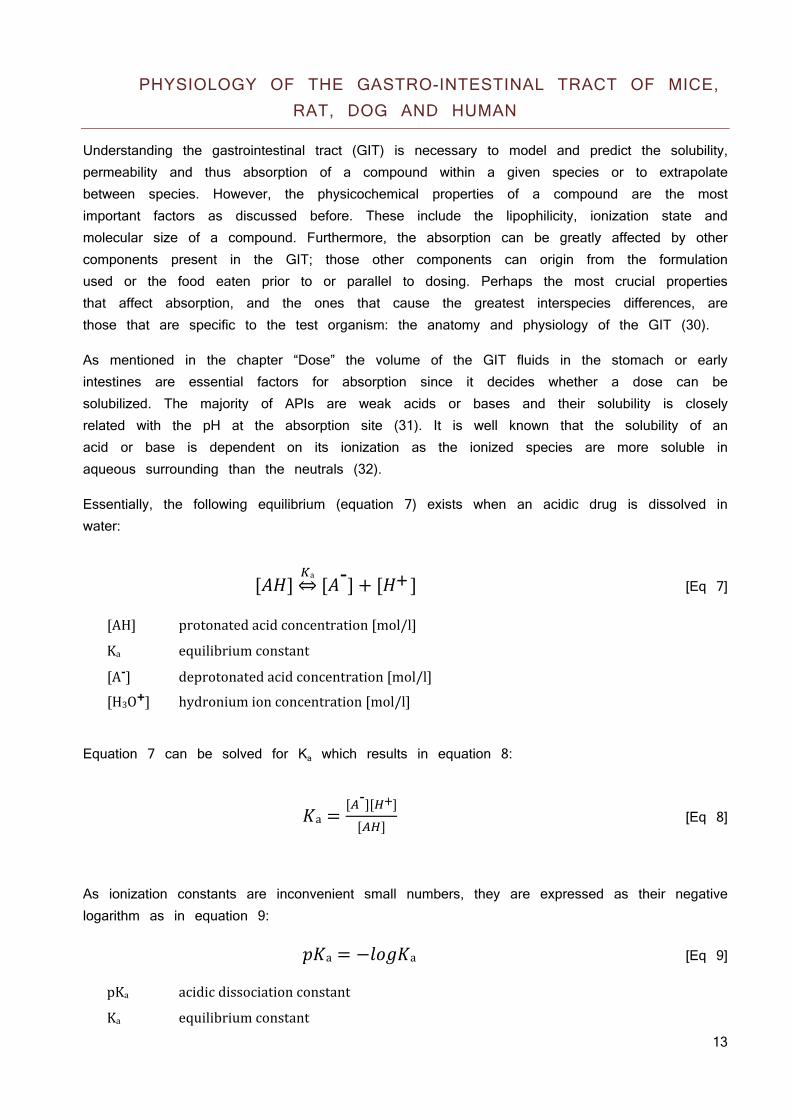
The acid dissociation constant (pKa) of a drug is the pH value where ionized and unionized species are present at a 1:1 ratio. If the pH is altered for 1 unit, the ratio is shifted to 90:10. Acids are ionized at pH above their pKa, bases below. A typical solubility profile of a weak base with a pKa of 5.5 and the relation to its ionized species is shown in fig. 4. As the pH is below the pKa and all species are ionized, the solubility is high. As the pH rises the unionized species increase and the solubility decreases. Therefore, the pH at the absorption site is crucial for solubility and thus, for absorption (32).
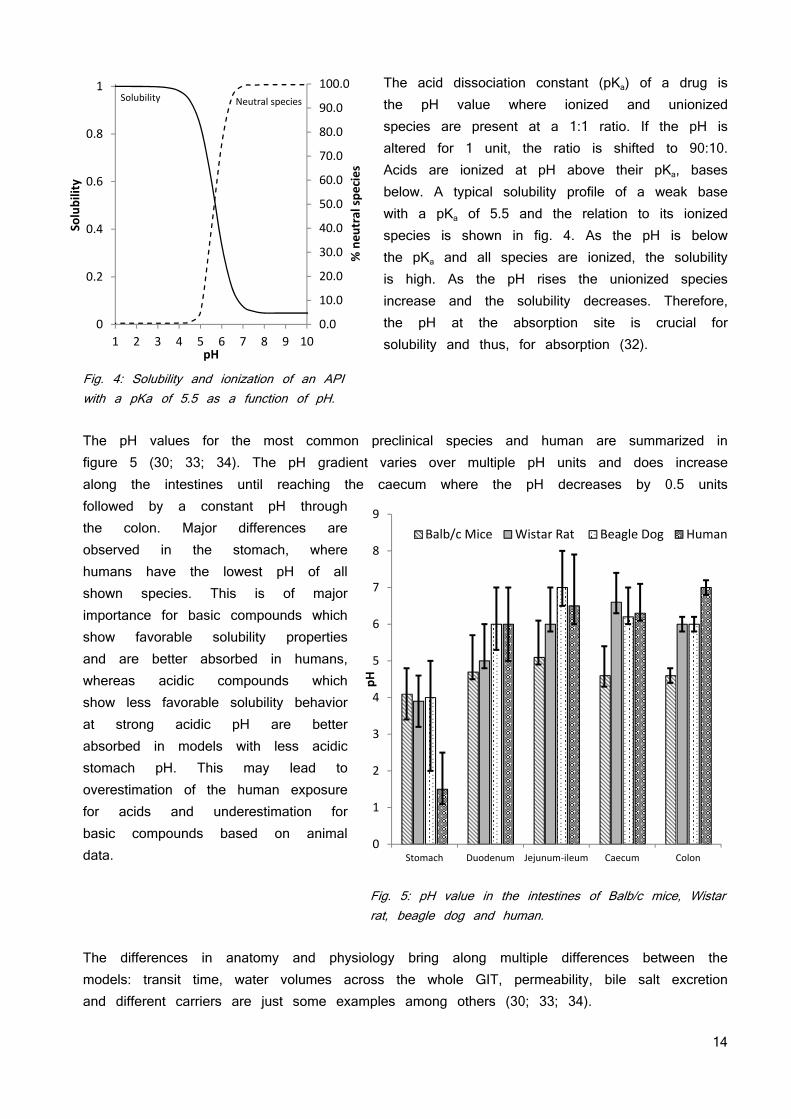
Fig. 4: Solubility and ionization of an API with a pKa of 5.5 as a function of pH. The pH values for the most common preclinical species and human are summarized in figure 5 (30; 33; 34). The pH gradient varies over multiple pH units and does increase along the intestines until reaching the caecum where the pH decreases by 0.5 units followed by a constant pH through the colon. Major differences are observed in the stomach, where humans have the lowest pH of all shown species. This is of major importance for basic compounds which show favorable solubility properties and are better absorbed in humans, whereas acidic compounds which show less favorable solubility behavior at strong acidic pH are better absorbed in models with less acidic stomach pH. This may lead to overestimation of the human exposure for acids and underestimation for basic compounds based on animal data.
Fig. 5: pH value in the intestines of Balb/c mice, Wistar rat, beagle dog and human.
The differences in anatomy and physiology bring along multiple differences between the models: transit time, water volumes across the whole GIT, permeability, bile salt excretion and different carriers are just some examples among others (30; 33; 34).
0.0
10.0
20.0
30.0
40.0
50.0
60.0
70.0
80.0
90.0
100.0
0
0.2
0.4
0.6
0.8
1
1 2 3 4 5 6 7 8 9 10
Solubility
pH
Solubility Neutral species
% neu
tral species
0
1
2
3
4
5
6
7
8
9
Stomach Duodenum Jejunum‐ileum Caecum Colon
pH
Balb/c Mice Wistar Rat Beagle Dog Human
15
SALT FORMATION APPROACH
INCREASING LATTICE ENERGY AND HARNESSING SOLVATION ENERGY
Salts consist of cations and anions and are the result of a proton transfer from an acid donor to a basic acceptor. Since ionic interactions can be the strongest of all lattice forces, one would intuitively expect a decreased solubility after introducing an ionic interaction. The crystal lattice energy is typically increased by salt formation as a result of stronger intramolecular ionic interactions as compared to the free API, typically reflected in a higher melting point. For solvation to occur, work is required to break the lattice forces. The energy for this comes from the energy released when ions or molecules of the lattice associate with molecules of the solvent. The increase in lattice energy within the salt crystal is expected to limit solubility. However, the higher solvation free energies resulting from ionization typically offset the free energy of breaking ionic interactions in the crystal lattice leading to an increased solubility of salts compared with the free acid. This is a result of the fact that the solvation of ions liberates more free energy than the solvation of a neutral molecule. Additionally the entropy of the system rises by dissociation of the ionic pairs. In summary, although the lattice energy is decreased in the salt as compared to the free API, the increased solvation free energy over-compensates this effect thereby driving the increased solubility (14).
A better understanding of the factors affecting salt solubility can be gained by examination of the determinants of the molar free energy of solution ∆Gsoln in equation 10:
∆ soln ∆ solvation ∆ lattice [Eq 10]
∆ solvation ∆ cation ∆ anion [Eq 11]
Solubility is a function of the free energy gain achieved by solvation of the anion and cation as shown in equation 11 and the free energy of the crystal lattice which has to be afforded to get the ions in solution. Salt formation alters both, the solvation energy and the free energy of the crystal lattice (3).
Solvation is typically enhanced by salt formation since dissociation into ions facilities the formation of ion-dipole interactions with water molecules that are more energetically favorable than hydrogen bond interactions between water and un-ionized drug. The importance of solvation of both anion and cation to the overall solvation energy suggest that hydrophilic counter ions form more soluble salts than hydrophobic counter ions and indeed this is often the case (35). However, the choice of counter ion affects both solvation and lattice energy, and as such, definitive structure-solubility relationships for different counter ions do not exist (14).
16
pH DEPENDENT SOLUBILITY OF SALTS OF ACIDS
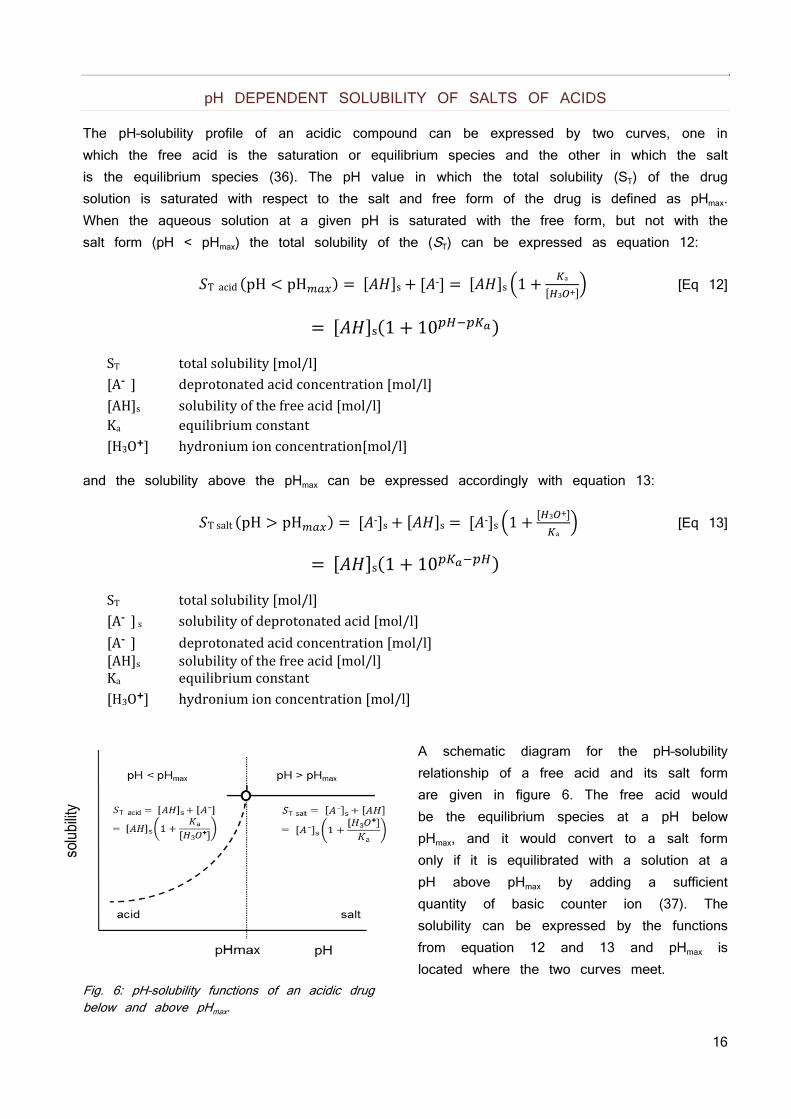
The pH–solubility profile of an acidic compound can be expressed by two curves, one in which the free acid is the saturation or equilibrium species and the other in which the salt is the equilibrium species (36). The pH value in which the total solubility (ST) of the drug solution is saturated with respect to the salt and free form of the drug is defined as pHmax. When the aqueous solution at a given pH is saturated with the free form, but not with the salt form (pH < pHmax) the total solubility of the (ST) can be expressed as equation 12:
Tacid pH pH s ‐ s 1 a
3 [Eq 12]
s 1 10
ST totalsolubility[mol/l][A‐ ] deprotonatedacidconcentration[mol/l][AH]s solubilityofthefreeacid[mol/l]Ka equilibriumconstant [H3O+] hydroniumionconcentration[mol/l]
and the solubility above the pHmax can be expressed accordingly with equation 13:
Tsalt pH pH ‐ s s ‐ s 1 3
a [Eq 13]
s 1 10
ST totalsolubility[mol/l][A‐ ]s solubilityofdeprotonatedacid[mol/l]
[A‐ ] deprotonatedacidconcentration[mol/l][AH]s solubilityofthefreeacid[mol/l]Ka equilibriumconstant [H3O+] hydroniumionconcentration[mol/l]
A schematic diagram for the pH–solubility relationship of a free acid and its salt form are given in figure 6. The free acid would be the equilibrium species at a pH below pHmax, and it would convert to a salt form only if it is equilibrated with a solution at a pH above pHmax by adding a sufficient quantity of basic counter ion (37). The solubility can be expressed by the functions from equation 12 and 13 and pHmax is located where the two curves meet.
Fig. 6: pH–solubility functions of an acidic drug below and above pHmax.
17
This is of major relevance since the salt can only be formed at a pH above pHmax. Salt formation is only applicable if the pHmax is within the physiological pH range of the intestines. Otherwise the poor soluble free acid is the predominant species and hence, the solubility benefit of the salt formation is lost. There are numerous reports in the literature indicating that equations 12 and 13 are in general followed for acidic compounds and their salts. In all cases, salts had higher solubilities than their corresponding free acids (14).
Bogardus and Blackwood proposed that the saturation solubilities of the free form below pHmax and the salt form above pHmax may be set equal at pHmax and solving the relevant equations for pHmax resulted in the following equation 14 (38):
a√ sp
s [Eq 14]
pKa aciddissociationconstant [AH]s solubilityofthefreeacid[mol/l]Ksp solubilityproductofthesalt
According to equation 11, the influence on pHmax is the following:
increase in pKa unit increases pHmax by 1 unit increase in solubility of AH by factor 10 decreases pHmax by 1 unit increase of salt solubility Ksp by factor 10 increases pHmax by 1 unit
The pKa is the main determining factor and pHmax is always above it (for acids). The ratio
of the solubility of the free form [AH]s and the salt form √ sp decide how much above the pKa the pHmax is. The pHmax is the minimal pH of the environment in which the salt form is the major species with the higher solubility. As the surrounding pH drops below pHmax, the salt will turn into the free acid which precipitates due to its lower solubility. Nevertheless, there are multiple cases, where the observed pHmax differ from the calculated values due to the fact that organic compounds often undergo self-association in solution because of their amphiphilic nature. Based on self-aggregation, activities of saturated solutions of many salts and even non-salts are lower than their measured concentrations in solution, resulting in non-ideal pH–solubility behavior (36). The pHmax is of particular interest for salts of acidic compounds since the free form is the dominating species below pHmax as often observed in the gastric environment with low pH. Therefore, the solubility increase due to salt formation is lost when the API precipitates within the low gastric pH environment.
18
PHARMACEUTICAL ADVANTAGES OF SALTS
Approximately 50% of the FDA approved drugs in the past decade are salts (36). This is the result of many advantages of salts over neutral forms such as high crystallinity, good stability, increased solubility, simplified purification and the simple metathesis to form salts from ionizable compounds. Many APIs are weak acids or bases and predestinated for salt formation. Some of the basic compounds are oily or low melting substances which make them liable to oxidation. Appropriate salt formation may result in a defined and rigid orientation which assures crystallinity thus they are more stable and easier to process during manufacture. The permanent ionic state of the API and the counter ion results in increased lattice energy and although the lattice forces are increased, the solvation of ions is energetically favored compared to solvation of neutral forms. Therefore, the stability of a salt is enhanced due to the increased lattice energy and the solubility improved due to the solvation of ions. A quality critical variable is the purity of a compound after synthesis. Crystallization and recrystallization is one of the most important techniques for purification of organic molecules since it is simple with a low investment of resources. Salts are better crystallizable than neutral forms due to the strong lattice forces from the ionic attraction facilitating the orientation in the crystal and thus, the process of crystallization (36). The formation of salts is a well-known process and relatively simple regarding up scaling, for increasing stability, solubility, or purity as compared to other approaches in pharmaceutics (14).
PHARMACEUTICAL DISADVANTAGES OF SALTS
Salt forming has the major disadvantage that only weak acids or bases can be modified to salts. Besides the molecular requirements, salt formation brings along an intrinsic limitation referred to as the common ion effect. Following equation 15 showing the equilibrium between the solid salt of an acid and the solvated ions:
solida
⇔ s s [Eq 15]
[A‐X+]solid undissolvedsolidsaltconcentration[mol/l]
Ka equilibriumconstant
[A‐] deprotonatedacidconcentration[mol/l]
[X+] counterionconcentration[mol/l]
It can be concluded, that adding auxiliary counter ions will shift the equilibrium towards the undissolved solid salt resulting in less solvated acid. Many counter ions are present in the GIT fluids. However, the common ion effect is primarily seen for hydrochloride salts of bases due to the high chloride concentration in the stomach (14) as well as in the early intestines. Acidic compounds suffer more from their pHmax which is often above pH 5 and
19
the normal human gastric pH is below the pHmax. The free acid is in these environments the favored equilibrium species. The result is often precipitation of the free acid form of the compound and decreased solubility in a low pH environment. Although the pH environment rises in the intestines and the solubility of the acidic compounds starts to increase, supersaturation is not achievable and the dissolution rate of the free acid form is rate limiting for the exposure for classical BCS II compounds. However, there are approaches to protect the salt form from the low gastric pH by delivering the acid-salts in enterically coated dosage forms (39).
Introducing a constant ionic interaction with a counter ion in a lattice makes it stronger and usually more stable. Nevertheless some counter ions can trigger chemical degradation of the compound. Additionally, some counter ions such as maleates and fumarates are known to form degradation products by chemical reaction with nitrogen containing compounds thereby imposing potential safety risks (14).
20
SOLID DISPERSIONS APPROACH
CREATE AND MAINTAIN SUPERSATURATION
Solid dispersions usually contain amorphous drug particles dispersed in a hydrophilic carrier matrix polymer or polymer mixtures. For clarification, ‘‘solid dispersion’’ refers to the most widely investigated amorphous solid dispersion, wherein a crystallizable, small molecule drug is dispersed in an amorphous polymer matrix. Systems containing semi crystalline polymers like polyethylene glycols (PEG) or Pluronic involve other scientific considerations and will not be included in this discussion. The same applies for solid dispersion where a crystalline drug is incorporated into a polymer.
Poor water soluble crystalline drugs tend to have higher solubility and dissolution when in the amorphous state. The enhancement is achieved since no energy is required to break up a crystal lattice during the dissolution process (40).
Solid dispersions aim at generating high and possibly supersaturated intraluminal concentrations of poorly water-soluble drugs or compounds with a slow dissolution by increasing their apparent solubility and/or dissolution rate (see chapter “supersaturation”). In case of an amorphous molecular dispersion, the release of API molecules is critically impacted by the dissolution of the hydrophilic carrier. In other cases, co-dissolution of the drug with the hydrophilic polymer can result in higher apparent solubility, carrier-induced increase in wettability or increased surface area available for dissolution. The most important factor is the higher apparent solubility as a result of the higher free energy in the system as compared to the crystalline state. The spring effect follows from the sum of these effects, thus drug loading, matrix composition and preparation technique will impact the initial degree of supersaturation. However, the increased free enthalpy or chemical potential, respectively, in the system makes it thermodynamically instable, hence prone to precipitation from the supersaturated solution. The parachute effect or duration of supersaturation will depend on the presence of co-dissolving matrix components delaying precipitation by different mechanisms such as reducing the degree of supersaturation by increasing the solubility, increasing the viscosity (resulting in a reduced molecular mobility) increasing the cluster–liquid interfacial energy or a combination of these mechanisms (40; 24; 41; 42).
Due to the complex composition of solid dispersions, it is often difficult to distinguish precisely between molecularly dispersed and not molecularly dispersed systems. It is usually assumed that dispersions in which no crystallinity can be detected are molecularly dispersed and the absence of crystallinity is used as a criterion to differentiate between amorphous solid solutions and crystalline solid dispersions. The methods to characterize solid dispersions are differential scanning calorimetry (DSC), X-ray powder diffraction (XRPD), infrared (IR) spectroscopy, polarized light microscopy and measurement of the release rate of the drug.
21
DSC enables the quantitative detection of all processes in which energy is required or produced such as endothermic and exothermic phase transformations. Exothermic transitions such as conversion of one polymorph to a more stable polymorph or melting of crystalline material can also be detected. Lack of a melting peak in the DSC of a solid dispersion indicates that the drug is present in an amorphous rather than a crystalline form. This might not be true for compounds which degrade prior to melting. Since the method is quantitative in nature, the degree of crystallinity can also be calculated for systems in which the drug is partly amorphous and partly crystalline. However, crystallinities of fewer than 2% cannot generally be detected with DSC (43).
XRPD enables to differentiate between solid solutions, in which the drug is amorphous, and solid dispersions, in which it is at least partly present in the crystalline form, regardless of
whether the carrier is amorphous or crystalline. However, crystallinities of under 5 – 10% cannot generally be detected with XRPD (43).
Polarized light microscopy is a strong asset complementing the classical thermo-analytical techniques and XRPD. Small crystalline spots can easily be detected by the birefringence properties of crystalline material (44).
Release rate experiments cannot be used on a stand-alone basis to determine whether a solid solution has been formed or not. However, in conjunction with other physicochemical data, they provide strong evidence for the formation of a molecularly dispersed or nearly molecularly dispersed system. A well-designed release experiment will show whether the solubility of the drug and its dissolution rate has been improved and also if the resulting supersaturated solution is stable or precipitates quickly. Comparison of results with those for pure drug powder and physical mixtures of the drug and carrier can help to indicate the mechanism by which the carrier improves dissolution: via solubilization and wetting effects which could be affected by a simple mixture of the components, or by formation of a solid dispersion/solution.
STABILIZING SOLID DISPERSIONS
The dispersed and/or amorphous state of a drug results in a higher energy level and chemical potential compared to a crystalline form implying that they are thermodynamically instable and sensitive to recrystallization. Specific drug-excipient interactions and reduced mobility in the polymer matrix stabilize the dispersed drug particles or domains to a certain extent (24; 45). The polymer has to be molecularly miscible with the drug to be effective in preventing crystallization. The majority of drugs contain hydrogen-bonding sites and several studies have shown the formation of ion-dipole interactions and intermolecular hydrogen bonding between drugs and polymers and the disruption of the hydrogen bonding pattern characteristic to the drugs crystalline structure. This leads to a better miscibility and physical stability of the solid dispersions (46).
22
It was speculated that polymers affect nucleation kinetics by increasing their kinetic barrier (activation energy) for nucleation (42). Polymers improve the physical stability of amorphous drugs in solid dispersions reducing the molecular mobility at regular storage temperatures, or by interacting specifically with functional groups of the drugs.
Molecular mobility is a key factor governing the stability of the amorphous phases, since even at very high viscosity below the glass transition temperature (Tg) of the system, there is enough mobility for an amorphous system to crystallize in pharmaceutically relevant time scales. Measuring the molecular mobility of amorphous indomethacin and polyvinylpyrrolidone (PVP), it was found to be necessary to cool to at least 50 K below the experimental Tg before the molecular motions could be considered to be negligible over the lifetime of a typical pharmaceutical product (47). Therefore the Tg of a solid dispersion is ideally at least 50°C higher than the ICH accelerated stress test conditions of 40 °C (48) translating to a minimal Tg of 90 °C or above.
The Tg of a mixture can be calculated using either the Fox or Tylor-Gordon equation (49). It is generally accepted that each component of the solid dispersion influences the Tg of the solid dispersion based on its own Tg and its fraction of the solid dispersion (50). This correlation illustrates the effect of moisture on the stability of amorphous pharmaceuticals. Water has a Tg of -134 °C (51), thus only minor amounts of water reduce the Tg of a solid dispersion significantly. This is of major concern, since increased drug mobility by decreasing the Tg may promote drug crystallization. Most of the polymers used in solid dispersions can absorb moisture; additionally amorphous forms tend to have higher specific surfaces adsorbing more water (40). This may result in phase separation, crystal growth, and conversion from the amorphous to the crystalline state or from a metastable crystalline form to a more stable structure upon storage. Thus, moisture uptake may promote decreased solubility and dissolution rate upon storage. Therefore, harnessing of the full potential of amorphous solids requires the stabilization of their solid state.
PREPARATION OF SOLID DISPERSIONS
Solid dispersions can be produced by multiple techniques. They are all based on fixing the higher energy state by rapid immobilization of the single molecules or clusters. This can be achieved by a melting method consisting of melting the drug within the carrier followed by cooling and pulverization of the obtained product. In the melting process, the molecular mobility of carrier is high enough to change the drug's incorporation. A common adaptation to the melting phase consists of suspending the active drug in a previously melted carrier, instead of using both drug and carrier in the melted state, reducing the process temperature (24; 46). The fact that several drugs can be degraded by the temperatures required for the melting of the carrier, the applicability of this method can be limited. The incomplete miscibility between drug and carrier that may occur, because of the high viscosity of a polymeric carrier in the molten state, is another limitation of the melting process. Meltextrusion enables to bring energy in the system not only by increasing the temperature
23
but also by applying shear forces. The combination lowers the process temperature and facilitates homogenous mixing (52).
The quenching of an amorphous state can alternatively be achieved by solvent evaporation methods such as simple evaporation, spray drying or lyophilization. They require solubilization of the drug and carrier in a volatile solvent that is later evaporated. Thermal decomposition of drugs or carriers can be minimized, since organic solvent evaporation occurs at low temperature. Differences in solvent evaporation processes are related to the solvent evaporation method, which can include vacuum drying, heating of the mixture, slow evaporation of the solvent at low temperature, the use of a rotary evaporator, a stream of nitrogen, spray drying or freeze-drying. Spray drying is one of the most commonly used solvent evaporation procedures in the production of solid dispersions. It consists of dissolving the drug and dissolving or suspending the carrier, then spraying it into a stream of heated air flow to remove the solvent. The basic freeze-drying process consists of dissolving the drug and carrier in a common solvent, which is immersed in liquid nitrogen until it is fully frozen. Then, the frozen solution is further lyophilized (24).
Another common process is the co-precipitation method, in which a non-solvent is added to the drug and carrier solution, under constant stirring. In the course of the non-solvent addition, the drug and carrier are co-precipitated to form micro particles. At the end, the resulted micro particle suspension is filtered and dried (41; 42; 53).
ADVANTAGES OF SOLID DISPERSIONS
Solid dispersions appear to be a better approach to improve drug solubility than other techniques. For instance, salt formation can only be used for weakly acidic or basic drugs and not for neutral compounds. Furthermore, it is common that salt formation does not achieve better bioavailability because of its in vivo conversion into free acid or base (36).
Poor water soluble crystalline drugs tend to have higher solubility and dissolution when in the amorphous state (40). Therefore, the stabilized amorphous solid form can provide a benefit in dissolution, solubility and supersaturation which often results in improved exposure and is less sensitive to recrystallization as the pure amorphous compound (45; 41).
Milling or micronization for particle size reduction is alternatively performed to improve dissolution and solubility on the basis of the increase in surface area (18). Solid dispersions are more efficient than these particle size reduction techniques, since milling technology has its limit around a particle size of 2 – 5 μm. This may not be enough to improve the drug solubility or drug release to an extent such that relevant increases in bioavailability occur (18). Additionally solid powders with particle sizes in this range have poor handling properties such as low flowability or high adhesion which makes them difficult to handle. Solid dispersions represent the last state of particle size reduction since they are molecularly dispersed in the best case or dispersed as small clusters. The compound is dispersed in the dissolution medium after carrier dissolution which results in a high surface area leading
24
to an increased dissolution and/or solubility and as consequence in improved bioavailability, particularly for passively transported API (53; 54). Further contribution to the enhancement of drug dissolution is related to the wettability improvement in solid dispersions by incorporating them in a hydrophilic matrix (24; 42).
DISADVANTAGES OF SOLID DISPERSIONS
Limitations of commercial application of solid dispersion include its method of preparation, the scale up of the manufacturing processes, reproducibility of its physicochemical properties, and its formulation into dosage forms as well as the physical and chemical stability (55).
The use of organic solvents, the high preparation cost and the difficulties in completely removing the solvent are some of the disadvantages associated with solvent evaporation methods. It is further also possible that slight alterations in the conditions used for solvent evaporation may lead to large changes in product performance. Melting approaches face the risk of degradation during processing and need further downstream activities such as milling and sieving (53; 55).
The dose is critically impacting the required concentration of the API in the matrix and may drive the required volume of the entire dosage form to an extent, such that convenient application is impacted. High doses in combination with low density or drug load can easily reach formulation volumes which are not dosable in a few dose units, especially when not further compacted.
The effect of moisture on the storage stability of amorphous pharmaceuticals is also a significant concern. Most of the polymers used in solid dispersions absorb moisture which decreases Tg of the solid dispersion and thus, increases drug mobility promoting recrystallization. This may result in phase separation, crystal growth or conversion from the amorphous to the crystalline state or from a metastable crystalline form to a more stable structure during storage. This may result in a decreased solubility and slower dissolution rate. In conclusion, harnessing of the full potential of amorphous solids requires their stabilization in solid state and in dissolved state (40). The additional energy in the system may also implicate degradation of the drug substance (55).
25
INTRODUCTION OF THE ACIDIC NCE: THE AMPA COMPOUNDS AND THEIR LIMITATIONS IN PERFORMACE
AMPA receptors (α-amino-3-hydroxy-5-methyl-4-isoxazolepropionic acid) are a subfamily of the glutamate receptors and are associated to multiple neurodegenerative and psychiatric diseases such as ischemic brain damage, amyotrophic lateral sclerosis, schizophrenia and epilepsy, but also migraine (56). Considering the observed effects of AMPA antagonists in preclinical and clinical trials it is likely to be of therapeutic utility in epilepsy and migraine and several AMPA receptor antagonists are currently in clinical development (57).
BGG492 is an orally active, competitive antagonist of the AMPA receptor and belongs to the quinazolinedione-sulfonamide class. The first proof-of-concept (PoC) Phase II study of BGG492 in subjects with acute migraine showed comparable results to sumatriptan in terms of pain-free response (58). A second PoC study was done for tinnitus as an additional indication (59).
CER225, an acetylated pro-drug of BGG492 was used as second compound. Pro-drugs are a common approach to mask unfavorable functional moieties which limit permeation, solubility or which are sensitive to degradation (60).
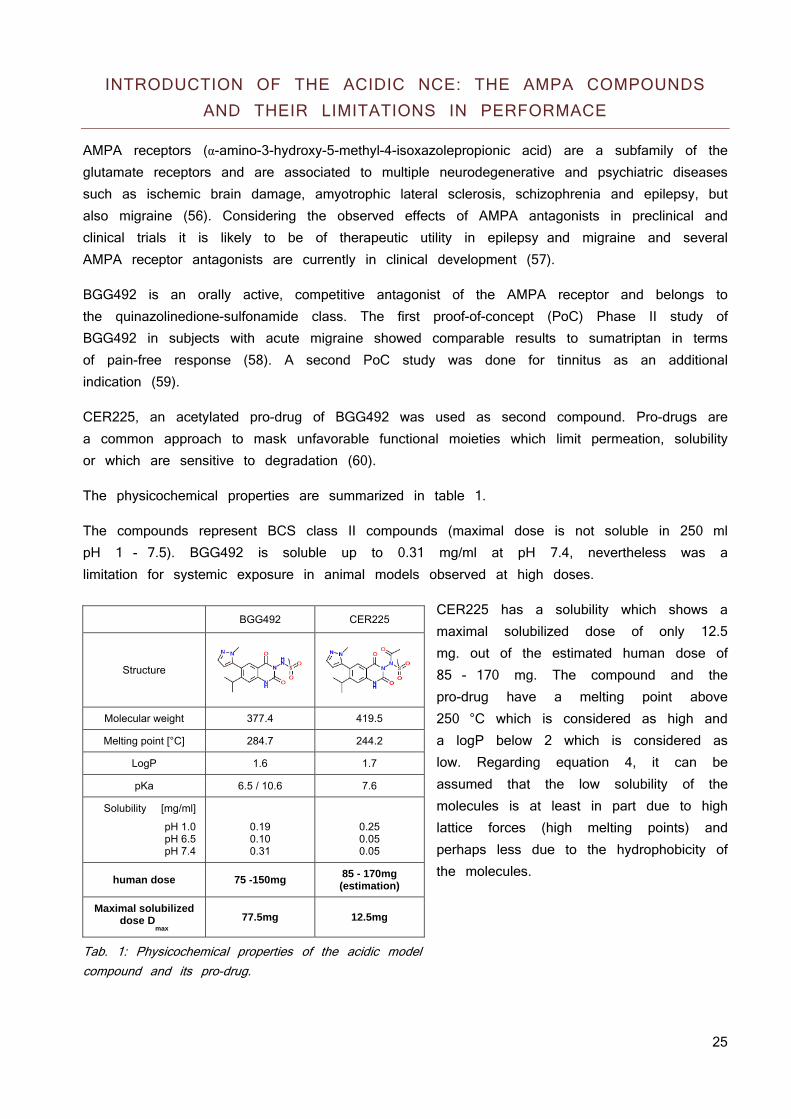
The physicochemical properties are summarized in table 1.
The compounds represent BCS class II compounds (maximal dose is not soluble in 250 ml pH 1 - 7.5). BGG492 is soluble up to 0.31 mg/ml at pH 7.4, nevertheless was a limitation for systemic exposure in animal models observed at high doses.
CER225 has a solubility which shows a maximal solubilized dose of only 12.5 mg. out of the estimated human dose of 85 - 170 mg. The compound and the pro-drug have a melting point above 250 °C which is considered as high and a logP below 2 which is considered as low. Regarding equation 4, it can be assumed that the low solubility of the molecules is at least in part due to high lattice forces (high melting points) and perhaps less due to the hydrophobicity of the molecules.
Tab. 1: Physicochemical properties of the acidic model compound and its pro-drug.
BGG492 CER225
Structure
Molecular weight 377.4 419.5
Melting point [°C] 284.7 244.2
LogP 1.6 1.7
pKa 6.5 / 10.6 7.6
Solubility [mg/ml]
pH 1.0 pH 6.5 pH 7.4
0.19 0.10 0.31
0.25 0.05 0.05
human dose 75 -150mg 85 - 170mg (estimation)
Maximal solubilized dose D
max 77.5mg 12.5mg
26
INTRODUCTION OF THE NEUTRAL NCE AND ITS EXPOSURE LIMITATIONS
The neutral compound is a potent and highly specific oral pan-class I phosphatidylinositol-3-kinase (PI3K) inhibitor. Phosphoinositide 3-kinases (PI3Ks) are essential to cell growth, proliferation, survival and drive the progression of tumors. Other downstream effectors link PI3K to cell motility and the control of cardiovascular parameters. Current knowledge indicates that PI3K inhibitors might qualify as drug targets for the treatment of cancer, chronic inflammation, allergy and cardiovascular failure. Abnormal activation of the PI3K-AKT-mTOR pathway has been validated as an important step towards the initiation and maintenance of human tumors by epidemiological and preclinical studies. This signaling cascade is also a key regulator of angiogenesis and up regulated metabolic activities in tumor cells (61).
The compound has shown significant cell growth inhibition and induction of apoptosis in a variety of tumor cell lines as well as in animal models (62).
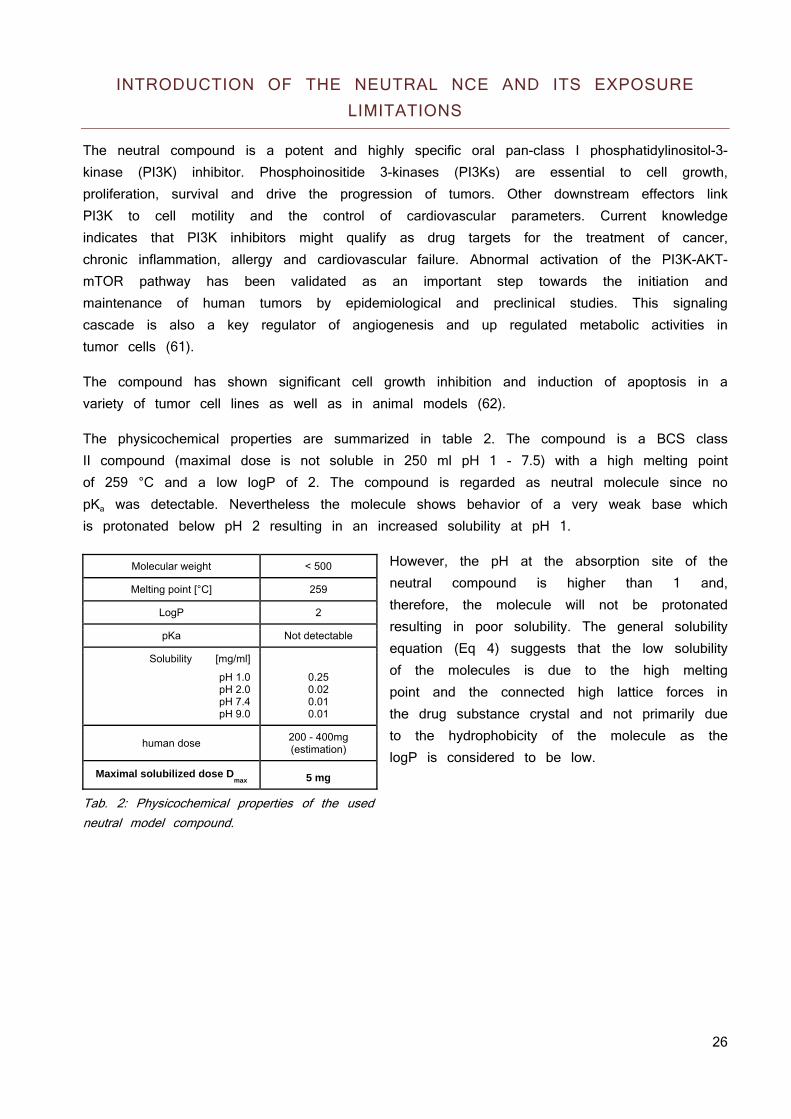
The physicochemical properties are summarized in table 2. The compound is a BCS class II compound (maximal dose is not soluble in 250 ml pH 1 - 7.5) with a high melting point of 259 °C and a low logP of 2. The compound is regarded as neutral molecule since no pKa was detectable. Nevertheless the molecule shows behavior of a very weak base which is protonated below pH 2 resulting in an increased solubility at pH 1.
However, the pH at the absorption site of the neutral compound is higher than 1 and, therefore, the molecule will not be protonated resulting in poor solubility. The general solubility equation (Eq 4) suggests that the low solubility of the molecules is due to the high melting point and the connected high lattice forces in the drug substance crystal and not primarily due to the hydrophobicity of the molecule as the logP is considered to be low.
Tab. 2: Physicochemical properties of the used neutral model compound.
Molecular weight < 500
Melting point [°C] 259
LogP 2
pKa Not detectable
Solubility [mg/ml]
pH 1.0 pH 2.0 pH 7.4 pH 9.0
0.25 0.02 0.01 0.01
human dose 200 - 400mg (estimation)
Maximal solubilized dose Dmax
5 mg
27
HYPOTHESIS
Based on the solubility equation (Eq. 4; deploying compound lipophilicity and melting point as surrogate for the lattice forces) high lattice forces are the limiting factors regarding solubility. Therefore, the following hypothesis is proposed:
Based on the BCS of the model compounds, an increased solubility may increase the exposure after oral application. This statement will be studied to decide over acceptance or rejection of the hypothesis.
SCOPE OF THE THESIS
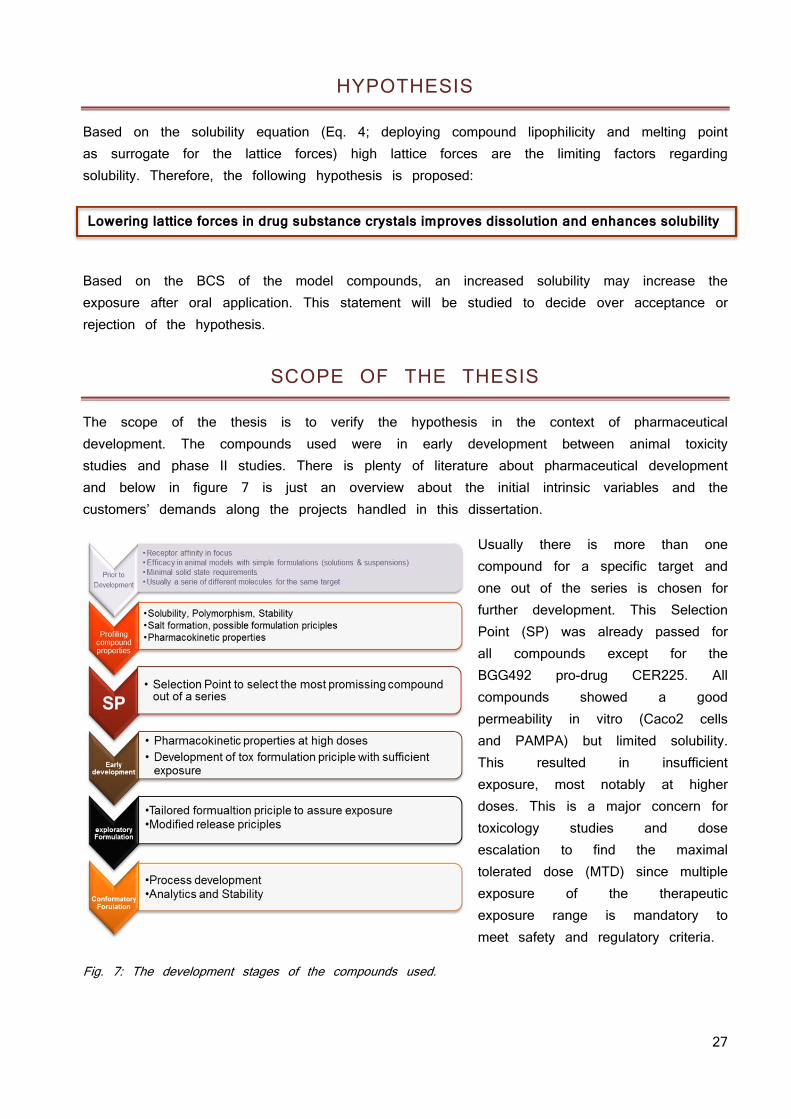
The scope of the thesis is to verify the hypothesis in the context of pharmaceutical development. The compounds used were in early development between animal toxicity studies and phase II studies. There is plenty of literature about pharmaceutical development and below in figure 7 is just an overview about the initial intrinsic variables and the customers’ demands along the projects handled in this dissertation.
Usually there is more than one compound for a specific target and one out of the series is chosen for further development. This Selection Point (SP) was already passed for all compounds except for the BGG492 pro-drug CER225. All compounds showed a good permeability in vitro (Caco2 cells and PAMPA) but limited solubility. This resulted in insufficient exposure, most notably at higher doses. This is a major concern for toxicology studies and dose escalation to find the maximal tolerated dose (MTD) since multiple exposure of the therapeutic exposure range is mandatory to meet safety and regulatory criteria.
Fig. 7: The development stages of the compounds used.
Lowering lattice forces in drug substance crystals improves dissolution and enhances solubility
28
BACKGROUND AND MOTIVATION
Compounds in drug pipelines tend to have a lower solubility as a result of high throughput screening (HTS) based research strategies for lead identification. This generally favors high molecular weight molecules with high affinities to their targets and good permeation through membranes; but with poor water solubility (1). The context of a compound and its development decides over the future path of development. For BCS II or IV compounds, the use of ionization with salt formation to increase solubility and bioavailability should be considered early on. The present investigations showed that not only typical salt formation resulting in crystalline and stable salts but also low melting or amorphous salts such as ionic liquids can be an option, especially when the conventional salts show precipitation at biorelevant pH conditions. In contrast to weakly basic or acidic drugs, neutrals cannot be transformed into salts and demand other approaches (63). For neutral BCS II compounds, a wide range of formulation choices exist such as adding surfactants or solubilizers to improve wetting and dissolution or modify the compound to high energy solids which can be manufactured via dispersion in a polymer matrix as amorphous solid dispersion or by processing to nanosized particles. The focus was on BCS II compounds characterized by poor solubility and dissolution rate as of high crystalline lattice forces typically correlating to melting points exceeding 240 °C and logP values smaller than 3.5.
The AMPA compound lacks exposure based on a rapid elimination. As the therapeutic effects were related to plasma exposure, immediate release formulations had to be dosed three times a day to maintain the critical plasma concentration. Comparable treatments in the indications of BGG492 are dosed two times a day. BGG492 needs to provide a patient benefit, thus the dose regimen has to be twice a day or fewer. The modified release formulations which were developed to meet the “less than three times daily dosing” requirement showed significantly decreased BAV in human. The findings were reproducible in dogs leading to the hypothesis of a restricted absorption window. Therefore, the focus for the AMPA compounds was not only to develop a formulation principle with higher exposure, but also to find a particular formulation to overcome the challenge of the narrow absorption window of BGG492 and more important, to find an appropriate animal model. Since the first attempts did not overcome the absorption window, the pro-drug CER225 was taken into considerations to fulfill the new clinical demands.
The neutral compound showed limited exposure even when attempted to reach therapeutic doses in animal models. Thus, the development of a formulation principle was essential for elaborating basic PK properties. This principle was used to conduct toxicology studies, further refined and combined with technology suitable for future industrialization of the drug product. The hypothesis about lowering the lattice forces was verified by confirmatory experiments (in vitro and in vivo) which resulted in a prototype formulation.
29
APPROACHES TO LOWER LATTICE FORCES IN ACIDIC AND NEUTRAL COMPOUNDS
LIMITATIONS OF SALT FORMATION
BGG492 has 2 pKas of 6.5 and 10.6. The N-methyl-D-glucamine and potassium salt found showed solubilities of approximately 10 - 20 mg/ml at a pH above 10, the di sodium salt a solubility exceeding 50 mg/ml. Based on equation 11, the pHmax for BGG492 is 9.5. This calculation is confirmed by the solubility profiles of the compound. They are uncharged and poorly soluble below their pKa. Above their pKa, the acidic group is deprotonated and negatively charged. The negative charge increases the solubility which reaches its maximum at pHmax. No salt forms were found for CER225 and due to its pKa of 7.6, the pHmax is even higher as for the parent compound. Thus the classical salt formation would not benefit the solubility at biorelevant pH. The pH of 10 mg/ml solutions of the BGG492 salts were between pH 10 - 11. As soon as the pH was titrated below pH 8.5, the salt form precipitated immediately as free acid (XRPD). Therefore, conventional salt formation did not show any benefits regarding solubility at physiological pH ranges and the paradigm was shifted from classical salt formation towards lowering the lattice forces through the formation of ionic liquids (64).
IONIC LIQUIDS: WHEN CONVENTIONAL SALT FORMING IS NOT APPLICABLE
An ionic liquid (IL) is an organic salt where delocalization of the electric charge and steric hindering inhibit the formation of a stable crystal lattice. The weak crystal lattice results in a relatively low melting point of the salt. The term IL is often arbitrarily restricted to salts whose melting point is below 100 °C. While ordinary liquids are predominantly made of uncharged molecules, ionic liquids are largely made of ions and short-lived ion pairs (65). Lowering the lattice forces described in the introduction is achieved by multiple factors:
Bulky delocalized electric charges Limited hydrogen bonding Steric inhibition due to voluminous side chains Flexibility by introducing freely rotating alkyl chains Asymmetry of the ions
Ionic liquids are of particular interests in different industries as green solvents (66), catalysts and for electrochemical applications. Their tunable properties attract also pharmaceutical applications such as using them as solvents and catalysts for synthesis (67), but more and more also as new salt forms of APIs (68). ILs provide new functionalities which can solve some of the major problems in development namely (69):
30
Polymorphism: Since there is no or only weak lattice forces, the IL is liquid or amorphous and no polymorphs exist.
Solubility and dissolution: The low lattice forces in combination with ionization of the compound results in improved dissolution and solubility.
Tunability: Solubility and dissolution can not only be improved but even tailored to the application. Introducing a lipophilic counter ion can alter permeation and dissolution; introducing precipitation inhibitors can promote supersaturation. Further tunable aspects can be stability, toxicology or taste.
Combination of two active compounds: The counter-ion can be chosen to synergistically enhance the desired effects, to neutralize unwanted side effects of the compound or to act pharmacologically independently, but therapeutically in a synergistic manner.
They also have a few draw backs. Most counter ions used to form IL were never tested in humans. Some were assessed in marine organisms and toxicity was reported. Measured EC50 values were in the μM range (70). Thus, a full toxicology assessment would be mandatory to bring a product to clinical investigations in human and finally on the market (71).
LIMITATIONS OF THE NEUTRAL COMPOUND
The neutral compound is classified as low solubility molecule according to the Biopharmaceutical Classification System (BCS) for doses exceeding 10 mg. Despite a low solubility, the compound has shown high bioavailability in rats (3 mg/kg) and dogs (0.3 mg/kg) from crystalline suspensions. Under proportional increase in AUC and Cmax has been observed with increased dose in rats and dogs thus limitations in absorption are expected at higher doses.
As a neutral molecule with a low lipophilicity (logP 2) and a high melting point of 260 °C, formulation with micellar systems is not suited based on the low lipophilicity (72). Microemulsions will face technical limitations due to limited solubility of the hydrophilic compound in relevant excipients such as PEG400. In consequence, developability of microemulsions will have a low likeliness of success due to limitations in drug loading and are not further considered. Additionally, the estimated human dose ranges from 200 - 400 mg which will be challenging regarding the drug load of the formulation. However, a lyophilized amorphous solid dispersion with hydroxypropyl methylcellulose (HPMC) and a drug load of 50 % showed a 5 fold increase in AUC after oral application in rats. Although the exposure was increased, the principle was not viable since recrystallization occurred during storage of this solid dispersion within a few days at room temperature.
31
OPTIMIZING SOLID DISPERSION
Starting point for the development of the formulation principles was the solid dispersion with a 50% drug load made from HPMC. It showed good in vivo performance but lacked the required physicochemical stability due to recrystallization within a few days. Investigation of the miscibility of the compound with HPMC showed a maximal miscibility of 20% with the polymer. Therefore, better miscible polymers were crucial for the development of future formulation principles based on the estimated human dose of 200 - 400 mg which would result in 1000 - 2000 mg final formulation when a 20% drug load HPMC solid dispersion is used. Gelation when HPMC is used as carrier in these amounts can delay the absorption and jeopardize the biopharmaceutical performance (73). Different polymers and mixtures from pharmaceutically relevant polymer classes were evaluated regarding their miscibility with the compound and the supersaturation behavior of the resulting solid dispersions were studied in simulated intestinal fluids. The most promising polymers and mixtures were assessed in pharmacokinetic studies in rats and then translated into melt extrusion technology by systematically reducing the melting point of the compound polymer mixture with different molecules interacting with the lattice of the compound. The performance was assessed based on their supersaturation behavior. The best performing systems were chosen for a dog study which showed clear limitations of the administered melt extrusion process and the resulting solid state of the formulation. The melt extrusion process was further refined which resulted in a formulation principle with good exposure, acceptable stability and a drug load which supports the dosing of up to 400 mg in an acceptable volume of formulation.
32
RESULTS
The results are reported separately for the acid and the neutral compound, respectively. A detailed overview of the data produced at external departments and in collaborations can be found at the experimental part.
For the acid compound, appropriate counterions were screened and promising candidates were optimized. As an alternative approach to salt formation, spray dried formulations were developed. Both, the salt and the spray dried solid dispersion were characterized with respect to stability and pharmacokinetic properties in rats and selected formulations in dogs. Furthermore, the oral availability was assessed in an in vitro Caco2 monolayer model in cooperation with the University of Würzburg.
The neutral compounds were formulated as solid dispersions produced by lyophilization. A suite of polymers was used in an excipient screen and optimal compositions were selected based on kinetic solubility improvements. The selected formulations were profiled in pharmacokinetic studies in rats. The formulation was further optimized by changing the production process from lyophilization to hot melt extrusion and using nicotinamide as softener. The formulation was pharmacokinetically characterized in dogs. One of the major challenges of amorphous drug delivery system is a quite regularly observed hygroscopicity, associated with a potential recrystallization hence potential change in biopharmaceutical properties (see above). Therefore, the hygroscopicity of the extruded formulations was assessed. In a subsequent set of experiments, the amount of nicotinamide was optimized to obtain fully amorphous states of the API in the extruded formulation from hot melt. Lastly, the formulation was up-scaled, characterized with respect to stability under stressed condition and subject to another pharmacokinetic study in dogs.
33
ACIDS
SEARCHING FOR COUNTER IONS
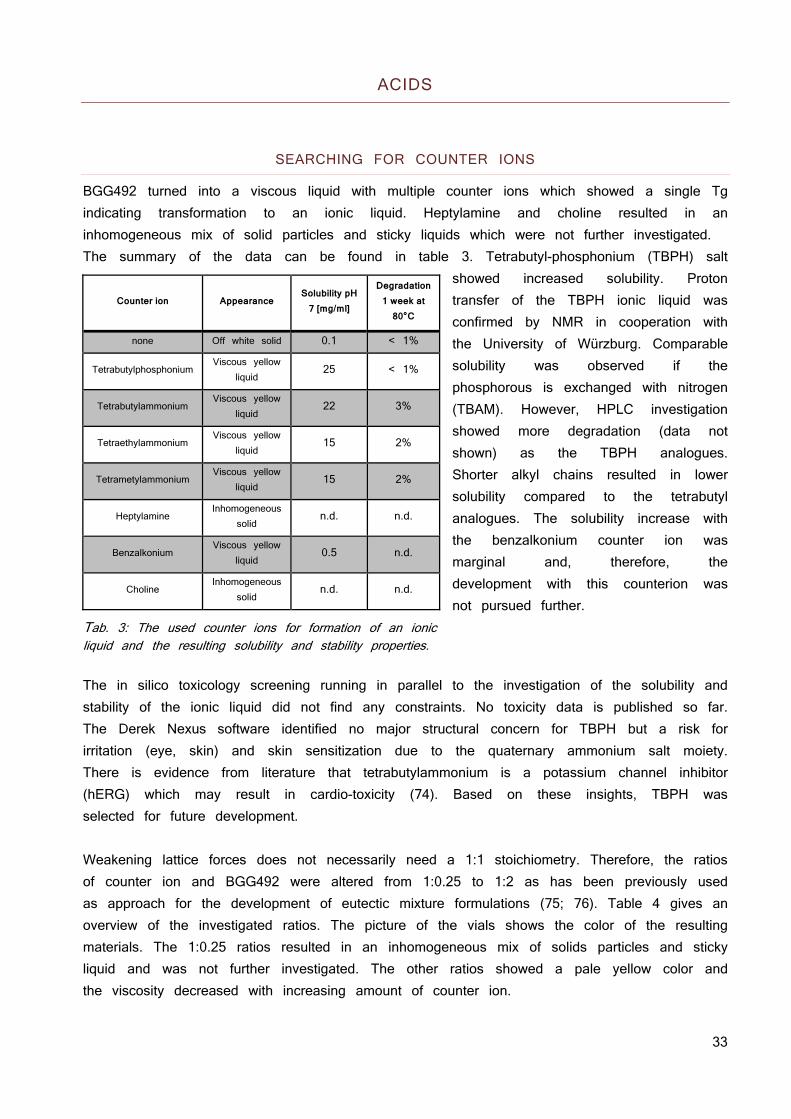
BGG492 turned into a viscous liquid with multiple counter ions which showed a single Tg indicating transformation to an ionic liquid. Heptylamine and choline resulted in an inhomogeneous mix of solid particles and sticky liquids which were not further investigated. The summary of the data can be found in table 3. Tetrabutyl-phosphonium (TBPH) salt
showed increased solubility. Proton transfer of the TBPH ionic liquid was confirmed by NMR in cooperation with the University of Würzburg. Comparable solubility was observed if the phosphorous is exchanged with nitrogen (TBAM). However, HPLC investigation showed more degradation (data not shown) as the TBPH analogues. Shorter alkyl chains resulted in lower solubility compared to the tetrabutyl analogues. The solubility increase with the benzalkonium counter ion was marginal and, therefore, the development with this counterion was not pursued further.
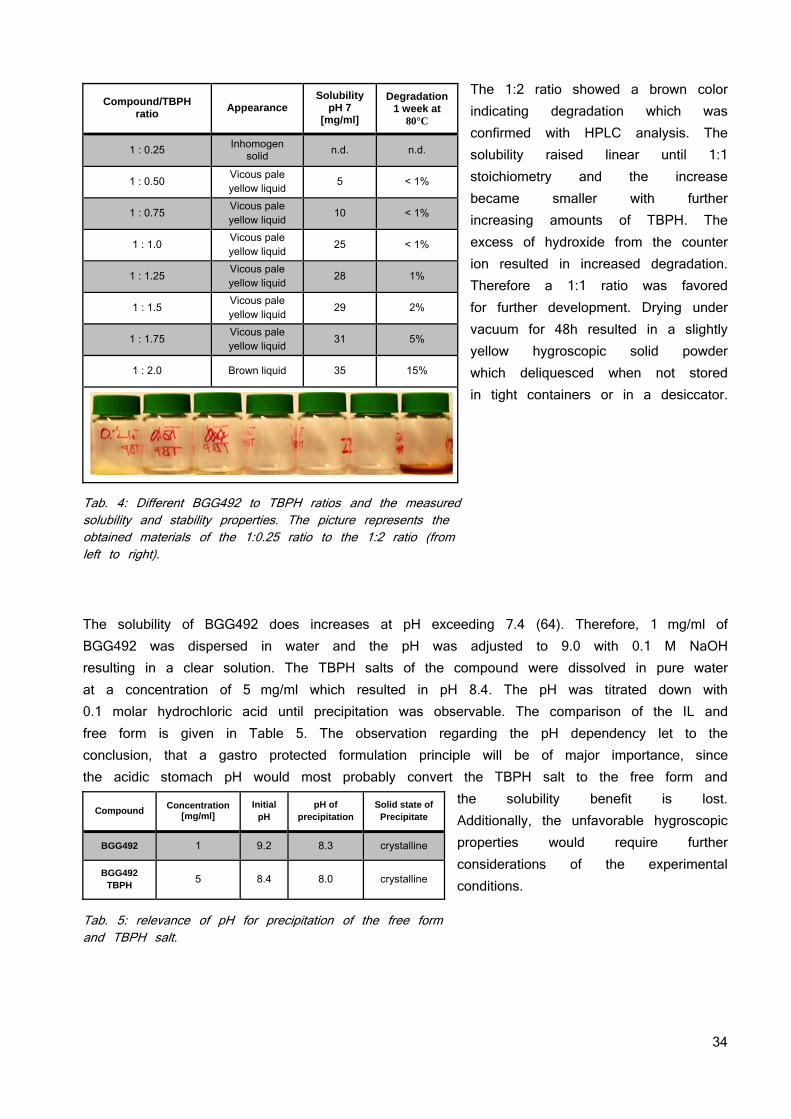
Tab. 3: The used counter ions for formation of an ionic liquid and the resulting solubility and stability properties. The in silico toxicology screening running in parallel to the investigation of the solubility and stability of the ionic liquid did not find any constraints. No toxicity data is published so far. The Derek Nexus software identified no major structural concern for TBPH but a risk for irritation (eye, skin) and skin sensitization due to the quaternary ammonium salt moiety. There is evidence from literature that tetrabutylammonium is a potassium channel inhibitor (hERG) which may result in cardio-toxicity (74). Based on these insights, TBPH was selected for future development. Weakening lattice forces does not necessarily need a 1:1 stoichiometry. Therefore, the ratios of counter ion and BGG492 were altered from 1:0.25 to 1:2 as has been previously used as approach for the development of eutectic mixture formulations (75; 76). Table 4 gives an overview of the investigated ratios. The picture of the vials shows the color of the resulting materials. The 1:0.25 ratios resulted in an inhomogeneous mix of solids particles and sticky liquid and was not further investigated. The other ratios showed a pale yellow color and the viscosity decreased with increasing amount of counter ion.
Counter ion Appearance Solubility pH
7 [mg/ml]
Degradation 1 week at
80°C
none Off white solid 0.1 < 1%
Tetrabutylphosphonium Viscous yellow
liquid 25 < 1%
Tetrabutylammonium Viscous yellow
liquid 22 3%
Tetraethylammonium Viscous yellow
liquid 15 2%
Tetrametylammonium Viscous yellow
liquid 15 2%
Heptylamine Inhomogeneous
solid n.d. n.d.
Benzalkonium Viscous yellow
liquid 0.5 n.d.
Choline Inhomogeneous
solid n.d. n.d.
34
The 1:2 ratio showed a brown color indicating degradation which was confirmed with HPLC analysis. The solubility raised linear until 1:1 stoichiometry and the increase became smaller with further increasing amounts of TBPH. The excess of hydroxide from the counter ion resulted in increased degradation. Therefore a 1:1 ratio was favored for further development. Drying under vacuum for 48h resulted in a slightly yellow hygroscopic solid powder which deliquesced when not stored in tight containers or in a desiccator.
Tab. 4: Different BGG492 to TBPH ratios and the measured solubility and stability properties. The picture represents the obtained materials of the 1:0.25 ratio to the 1:2 ratio (from left to right).
The solubility of BGG492 does increases at pH exceeding 7.4 (64). Therefore, 1 mg/ml of BGG492 was dispersed in water and the pH was adjusted to 9.0 with 0.1 M NaOH resulting in a clear solution. The TBPH salts of the compound were dissolved in pure water at a concentration of 5 mg/ml which resulted in pH 8.4. The pH was titrated down with 0.1 molar hydrochloric acid until precipitation was observable. The comparison of the IL and free form is given in Table 5. The observation regarding the pH dependency let to the conclusion, that a gastro protected formulation principle will be of major importance, since the acidic stomach pH would most probably convert the TBPH salt to the free form and
the solubility benefit is lost. Additionally, the unfavorable hygroscopic properties would require further considerations of the experimental conditions.
Tab. 5: relevance of pH for precipitation of the free form and TBPH salt.
Compound/TBPH ratio Appearance
Solubility pH 7
[mg/ml]
Degradation 1 week at
80°C
1 : 0.25 Inhomogen solid n.d. n.d.
1 : 0.50 Vicous pale yellow liquid 5 < 1%
1 : 0.75 Vicous pale yellow liquid 10 < 1%
1 : 1.0 Vicous pale yellow liquid 25 < 1%
1 : 1.25 Vicous pale yellow liquid 28 1%
1 : 1.5 Vicous pale yellow liquid 29 2%
1 : 1.75 Vicous pale yellow liquid 31 5%
1 : 2.0 Brown liquid 35 15%
Compound Concentration [mg/ml]
Initial pH
pH of precipitation
Solid state of Precipitate
BGG492 1 9.2 8.3 crystalline
BGG492 TBPH 5 8.4 8.0 crystalline
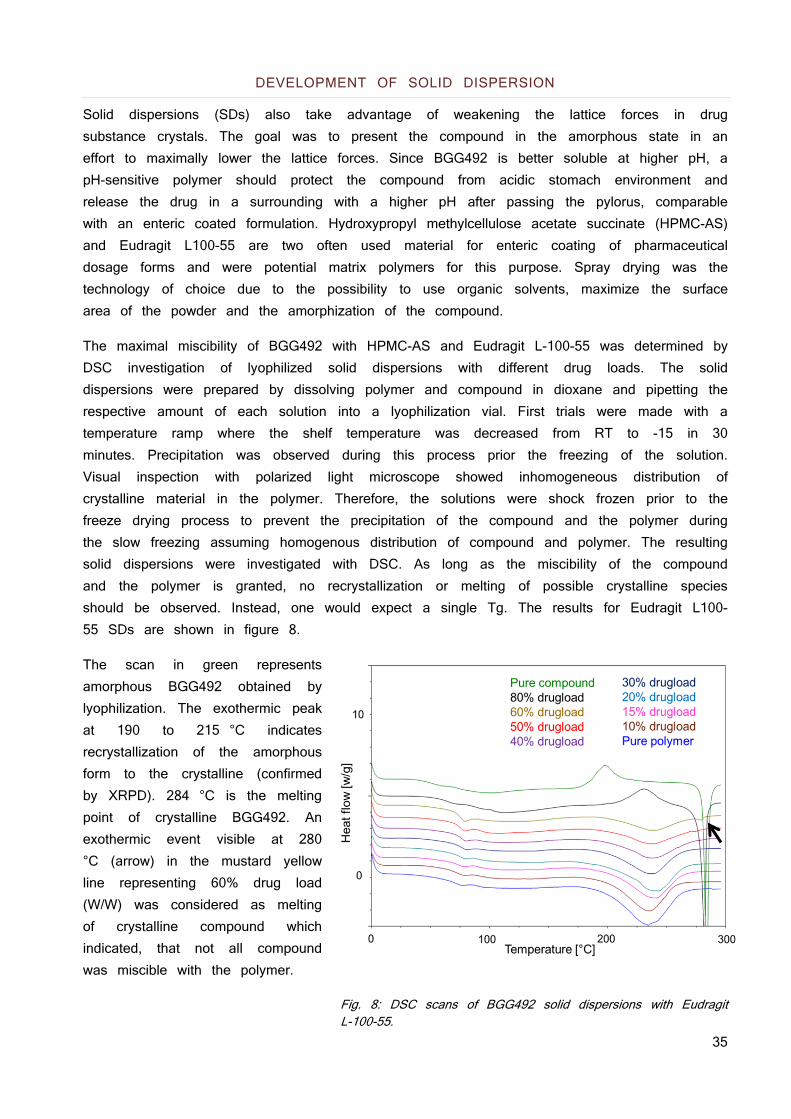
35
DEVELOPMENT OF SOLID DISPERSION
Solid dispersions (SDs) also take advantage of weakening the lattice forces in drug substance crystals. The goal was to present the compound in the amorphous state in an effort to maximally lower the lattice forces. Since BGG492 is better soluble at higher pH, a pH-sensitive polymer should protect the compound from acidic stomach environment and release the drug in a surrounding with a higher pH after passing the pylorus, comparable with an enteric coated formulation. Hydroxypropyl methylcellulose acetate succinate (HPMC-AS) and Eudragit L100-55 are two often used material for enteric coating of pharmaceutical dosage forms and were potential matrix polymers for this purpose. Spray drying was the technology of choice due to the possibility to use organic solvents, maximize the surface area of the powder and the amorphization of the compound.
The maximal miscibility of BGG492 with HPMC-AS and Eudragit L-100-55 was determined by DSC investigation of lyophilized solid dispersions with different drug loads. The solid dispersions were prepared by dissolving polymer and compound in dioxane and pipetting the respective amount of each solution into a lyophilization vial. First trials were made with a temperature ramp where the shelf temperature was decreased from RT to -15 in 30 minutes. Precipitation was observed during this process prior the freezing of the solution. Visual inspection with polarized light microscope showed inhomogeneous distribution of crystalline material in the polymer. Therefore, the solutions were shock frozen prior to the freeze drying process to prevent the precipitation of the compound and the polymer during the slow freezing assuming homogenous distribution of compound and polymer. The resulting solid dispersions were investigated with DSC. As long as the miscibility of the compound and the polymer is granted, no recrystallization or melting of possible crystalline species should be observed. Instead, one would expect a single Tg. The results for Eudragit L100-55 SDs are shown in figure 8.
The scan in green represents amorphous BGG492 obtained by lyophilization. The exothermic peak at 190 to 215 °C indicates recrystallization of the amorphous form to the crystalline (confirmed by XRPD). 284 °C is the melting point of crystalline BGG492. An exothermic event visible at 280 °C (arrow) in the mustard yellow line representing 60% drug load (W/W) was considered as melting of crystalline compound which indicated, that not all compound was miscible with the polymer.
Fig. 8: DSC scans of BGG492 solid dispersions with Eudragit L-100-55.
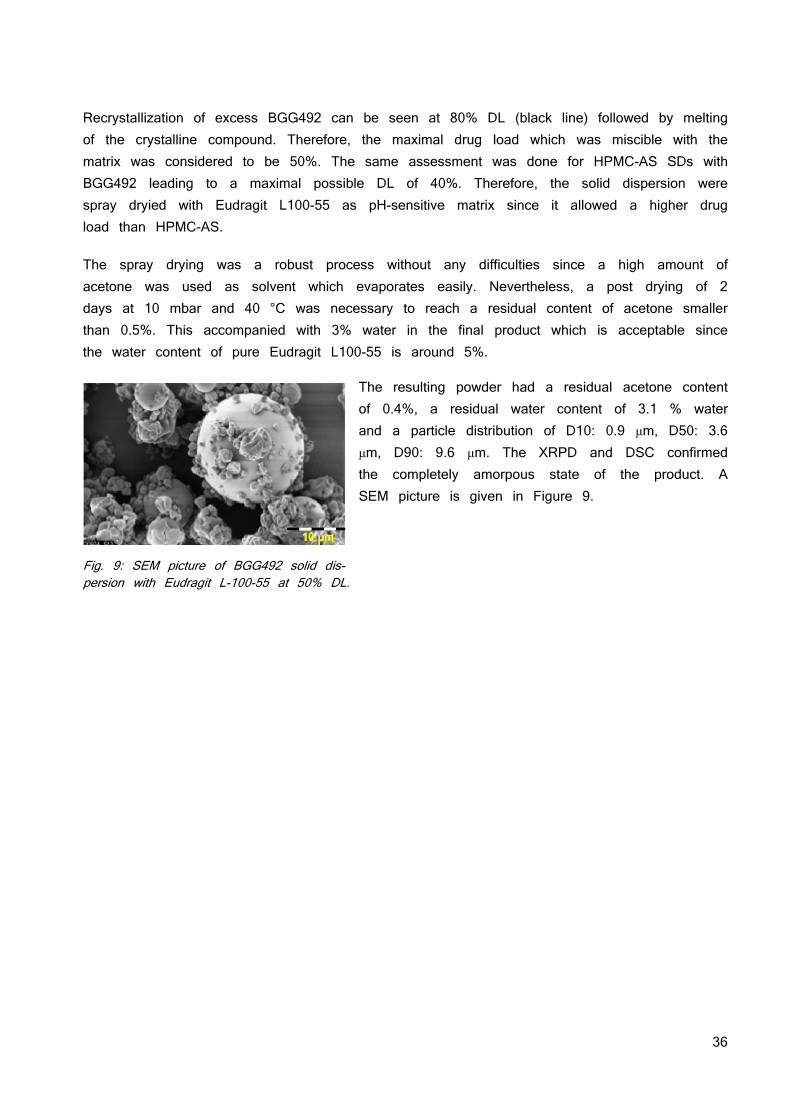
36
Recrystallization of excess BGG492 can be seen at 80% DL (black line) followed by melting of the crystalline compound. Therefore, the maximal drug load which was miscible with the matrix was considered to be 50%. The same assessment was done for HPMC-AS SDs with BGG492 leading to a maximal possible DL of 40%. Therefore, the solid dispersion were spray dryied with Eudragit L100-55 as pH-sensitive matrix since it allowed a higher drug load than HPMC-AS.
The spray drying was a robust process without any difficulties since a high amount of acetone was used as solvent which evaporates easily. Nevertheless, a post drying of 2 days at 10 mbar and 40 °C was necessary to reach a residual content of acetone smaller than 0.5%. This accompanied with 3% water in the final product which is acceptable since the water content of pure Eudragit L100-55 is around 5%.
The resulting powder had a residual acetone content of 0.4%, a residual water content of 3.1 % water and a particle distribution of D10: 0.9 μm, D50: 3.6 μm, D90: 9.6 μm. The XRPD and DSC confirmed the completely amorpous state of the product. A SEM picture is given in Figure 9.
Fig. 9: SEM picture of BGG492 solid dis- persion with Eudragit L-100-55 at 50% DL.
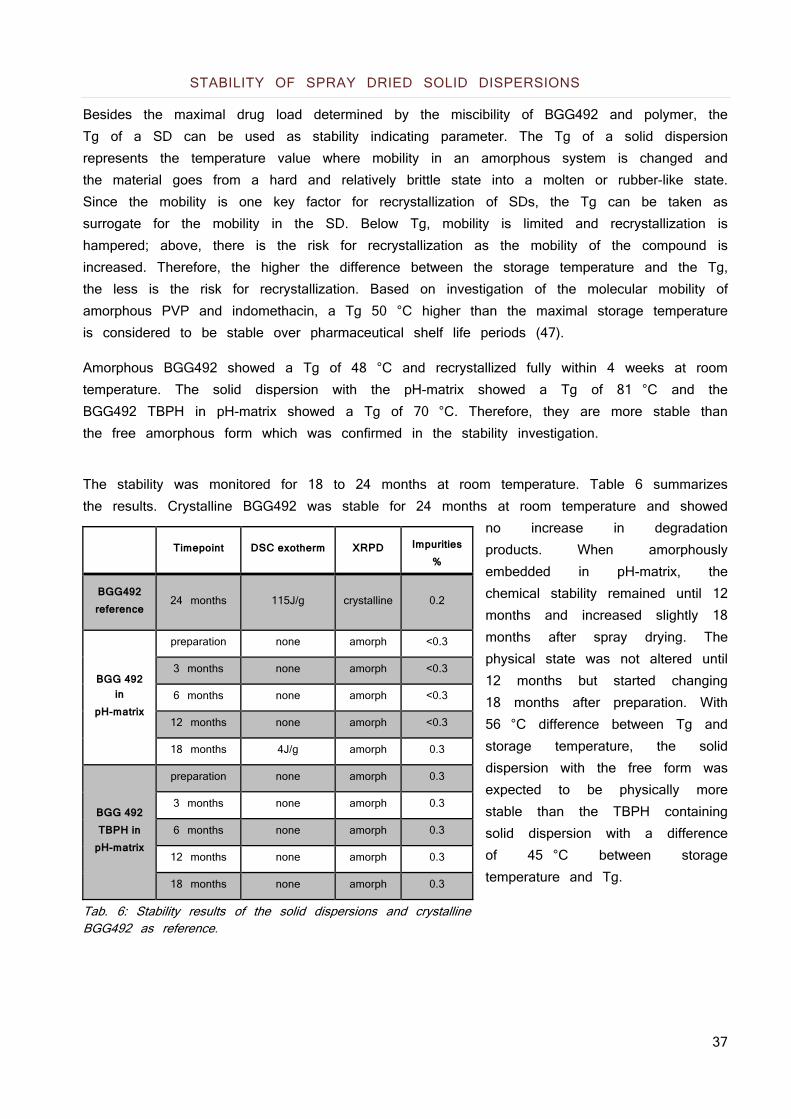
37
STABILITY OF SPRAY DRIED SOLID DISPERSIONS
Besides the maximal drug load determined by the miscibility of BGG492 and polymer, the Tg of a SD can be used as stability indicating parameter. The Tg of a solid dispersion represents the temperature value where mobility in an amorphous system is changed and the material goes from a hard and relatively brittle state into a molten or rubber-like state. Since the mobility is one key factor for recrystallization of SDs, the Tg can be taken as surrogate for the mobility in the SD. Below Tg, mobility is limited and recrystallization is hampered; above, there is the risk for recrystallization as the mobility of the compound is increased. Therefore, the higher the difference between the storage temperature and the Tg, the less is the risk for recrystallization. Based on investigation of the molecular mobility of amorphous PVP and indomethacin, a Tg 50 °C higher than the maximal storage temperature is considered to be stable over pharmaceutical shelf life periods (47).
Amorphous BGG492 showed a Tg of 48 °C and recrystallized fully within 4 weeks at room temperature. The solid dispersion with the pH-matrix showed a Tg of 81 °C and the BGG492 TBPH in pH-matrix showed a Tg of 70 °C. Therefore, they are more stable than the free amorphous form which was confirmed in the stability investigation.
The stability was monitored for 18 to 24 months at room temperature. Table 6 summarizes the results. Crystalline BGG492 was stable for 24 months at room temperature and showed
no increase in degradation products. When amorphously embedded in pH-matrix, the chemical stability remained until 12 months and increased slightly 18 months after spray drying. The physical state was not altered until 12 months but started changing 18 months after preparation. With 56 °C difference between Tg and storage temperature, the solid dispersion with the free form was expected to be physically more stable than the TBPH containing solid dispersion with a difference of 45 °C between storage temperature and Tg.
Tab. 6: Stability results of the solid dispersions and crystalline BGG492 as reference.
Timepoint DSC exotherm XRPD Impurities %
BGG492 reference
24 months 115J/g crystalline 0.2
BGG 492
in pH-matrix
preparation none amorph <0.3
3 months none amorph <0.3
6 months none amorph <0.3
12 months none amorph <0.3
18 months 4J/g amorph 0.3
BGG 492 TBPH in
pH-matrix
preparation none amorph 0.3
3 months none amorph 0.3
6 months none amorph 0.3
12 months none amorph 0.3
18 months none amorph 0.3
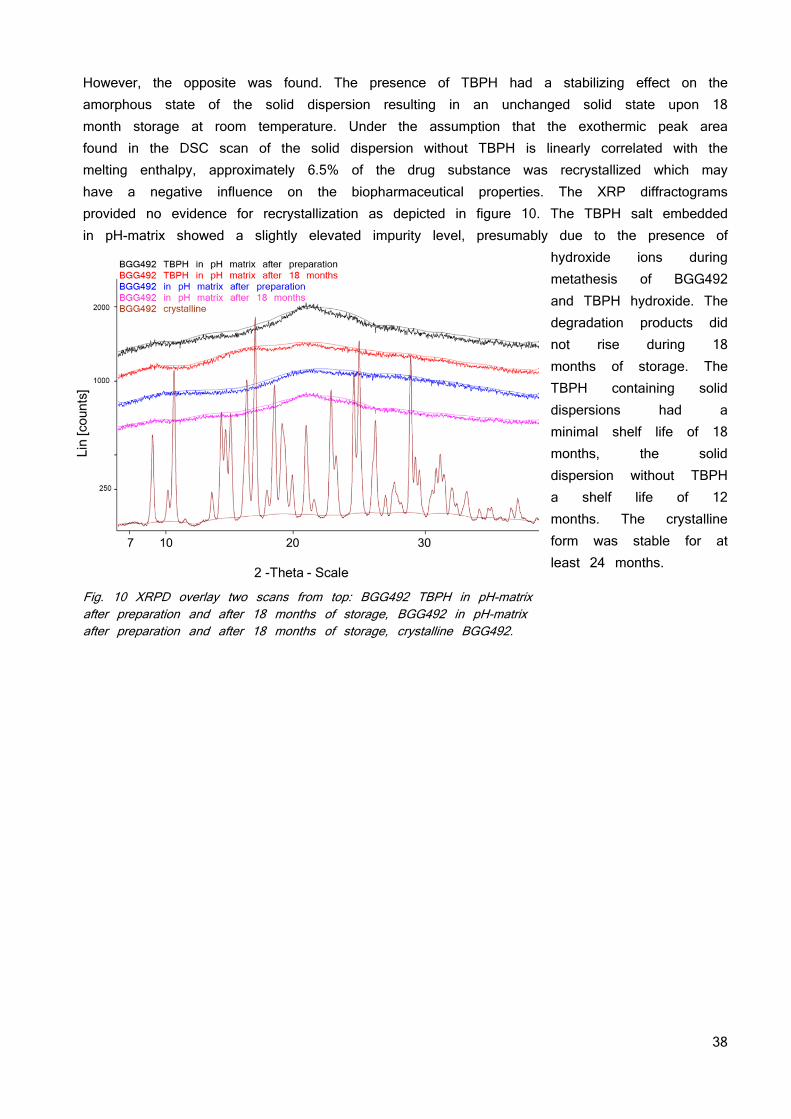
38
However, the opposite was found. The presence of TBPH had a stabilizing effect on the amorphous state of the solid dispersion resulting in an unchanged solid state upon 18 month storage at room temperature. Under the assumption that the exothermic peak area found in the DSC scan of the solid dispersion without TBPH is linearly correlated with the melting enthalpy, approximately 6.5% of the drug substance was recrystallized which may have a negative influence on the biopharmaceutical properties. The XRP diffractograms provided no evidence for recrystallization as depicted in figure 10. The TBPH salt embedded in pH-matrix showed a slightly elevated impurity level, presumably due to the presence of
hydroxide ions during metathesis of BGG492 and TBPH hydroxide. The degradation products did not rise during 18 months of storage. The TBPH containing solid dispersions had a minimal shelf life of 18 months, the solid dispersion without TBPH a shelf life of 12 months. The crystalline form was stable for at least 24 months.
Fig. 10 XRPD overlay two scans from top: BGG492 TBPH in pH-matrix after preparation and after 18 months of storage, BGG492 in pH-matrix after preparation and after 18 months of storage, crystalline BGG492.
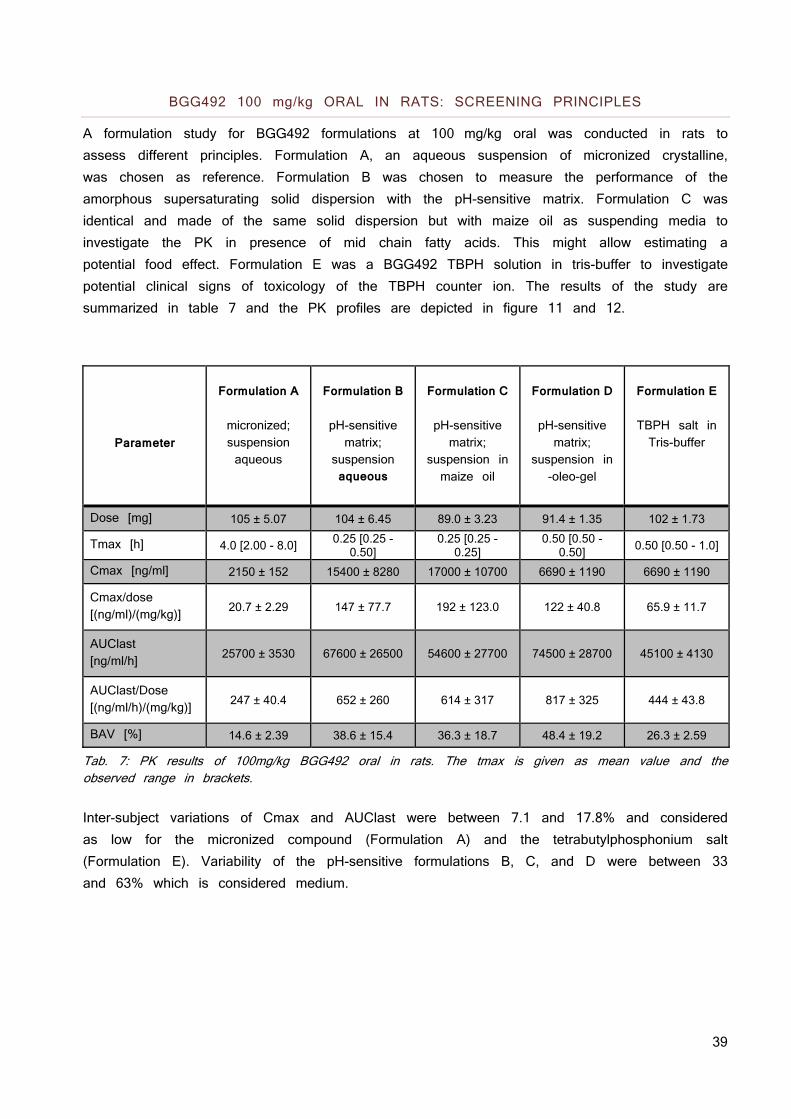
39
BGG492 100 mg/kg ORAL IN RATS: SCREENING PRINCIPLES
A formulation study for BGG492 formulations at 100 mg/kg oral was conducted in rats to assess different principles. Formulation A, an aqueous suspension of micronized crystalline, was chosen as reference. Formulation B was chosen to measure the performance of the amorphous supersaturating solid dispersion with the pH-sensitive matrix. Formulation C was identical and made of the same solid dispersion but with maize oil as suspending media to investigate the PK in presence of mid chain fatty acids. This might allow estimating a potential food effect. Formulation E was a BGG492 TBPH solution in tris-buffer to investigate potential clinical signs of toxicology of the TBPH counter ion. The results of the study are summarized in table 7 and the PK profiles are depicted in figure 11 and 12.
Parameter
Formulation A
micronized; suspension aqueous
Formulation B
pH-sensitive matrix;
suspension aqueous
Formulation C
pH-sensitive matrix;
suspension in maize oil
Formulation D
pH-sensitive matrix;
suspension in -oleo-gel
Formulation E
TBPH salt in Tris-buffer
Dose [mg] 105 ± 5.07 104 ± 6.45 89.0 ± 3.23 91.4 ± 1.35 102 ± 1.73
Tmax [h] 4.0 [2.00 - 8.0] 0.25 [0.25 - 0.50]
0.25 [0.25 - 0.25]
0.50 [0.50 - 0.50]
0.50 [0.50 - 1.0]
Cmax [ng/ml] 2150 ± 152 15400 ± 8280 17000 ± 10700 6690 ± 1190 6690 ± 1190
Cmax/dose [(ng/ml)/(mg/kg)] 20.7 ± 2.29 147 ± 77.7 192 ± 123.0 122 ± 40.8 65.9 ± 11.7
AUClast [ng/ml/h] 25700 ± 3530 67600 ± 26500 54600 ± 27700 74500 ± 28700 45100 ± 4130
AUClast/Dose [(ng/ml/h)/(mg/kg)] 247 ± 40.4 652 ± 260 614 ± 317 817 ± 325 444 ± 43.8
BAV [%] 14.6 ± 2.39 38.6 ± 15.4 36.3 ± 18.7 48.4 ± 19.2 26.3 ± 2.59
Tab. 7: PK results of 100mg/kg BGG492 oral in rats. The tmax is given as mean value and the observed range in brackets. Inter-subject variations of Cmax and AUClast were between 7.1 and 17.8% and considered as low for the micronized compound (Formulation A) and the tetrabutylphosphonium salt (Formulation E). Variability of the pH-sensitive formulations B, C, and D were between 33 and 63% which is considered medium.
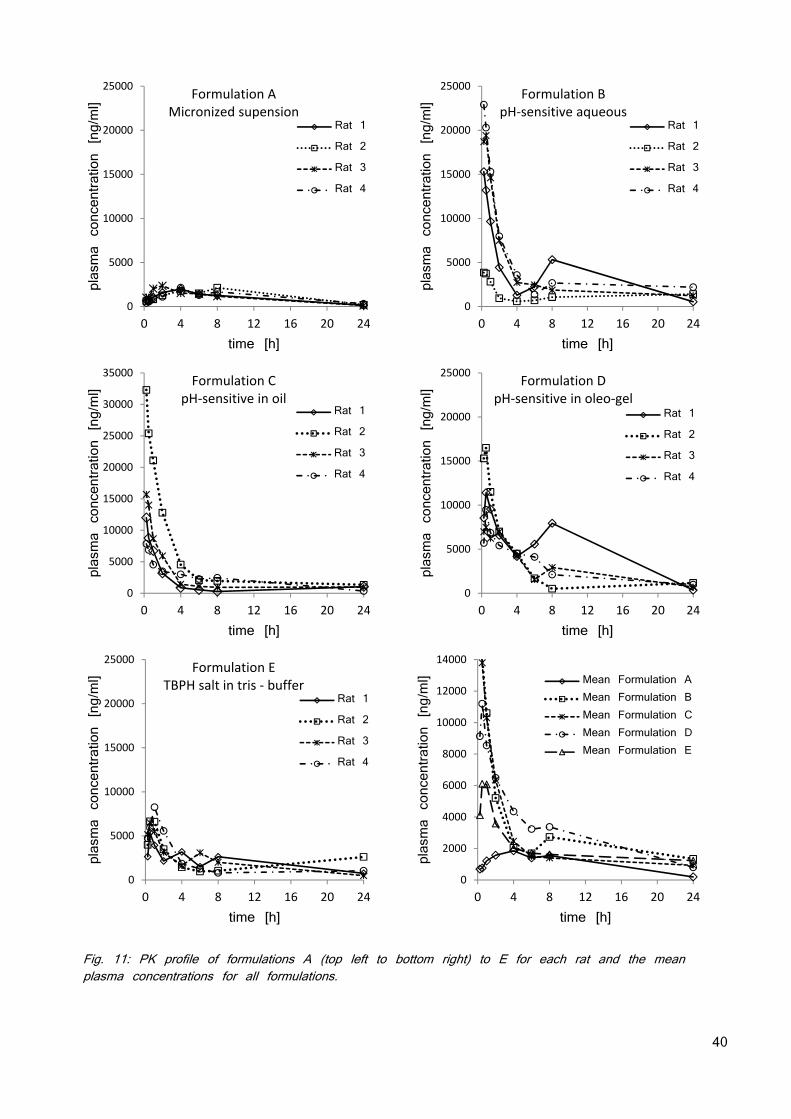
40
Fig. 11: PK profile of formulations A (top left to bottom right) to E for each rat and the mean plasma concentrations for all formulations.
0
5000
10000
15000
20000
25000
0 4 8 12 16 20 24
plasma concentration [ng/ml]
time [h]
Formulation AMicronized supension
Rat 1
Rat 2
Rat 3
Rat 4
0
5000
10000
15000
20000
25000
0 4 8 12 16 20 24
plasma concentration [ng/ml]
time [h]
Formulation BpH‐sensitive aqueous
Rat 1
Rat 2
Rat 3
Rat 4
0
5000
10000
15000
20000
25000
30000
35000
0 4 8 12 16 20 24
plasma concentration [ng/ml]
time [h]
Formulation CpH‐sensitive in oil
Rat 1
Rat 2
Rat 3
Rat 4
0
5000
10000
15000
20000
25000
0 4 8 12 16 20 24
plasma concentration [ng/ml]
time [h]
Formulation DpH‐sensitive in oleo‐gel
Rat 1
Rat 2
Rat 3
Rat 4
0
5000
10000
15000
20000
25000
0 4 8 12 16 20 24
plasma concentration [ng/ml]
time [h]
Formulation ETBPH salt in tris ‐ buffer
Rat 1
Rat 2
Rat 3
Rat 4
0
2000
4000
6000
8000
10000
12000
14000
0 4 8 12 16 20 24
plasma concentration [ng/ml]
time [h]
Mean Formulation AMean Formulation BMean Formulation CMean Formulation DMean Formulation E
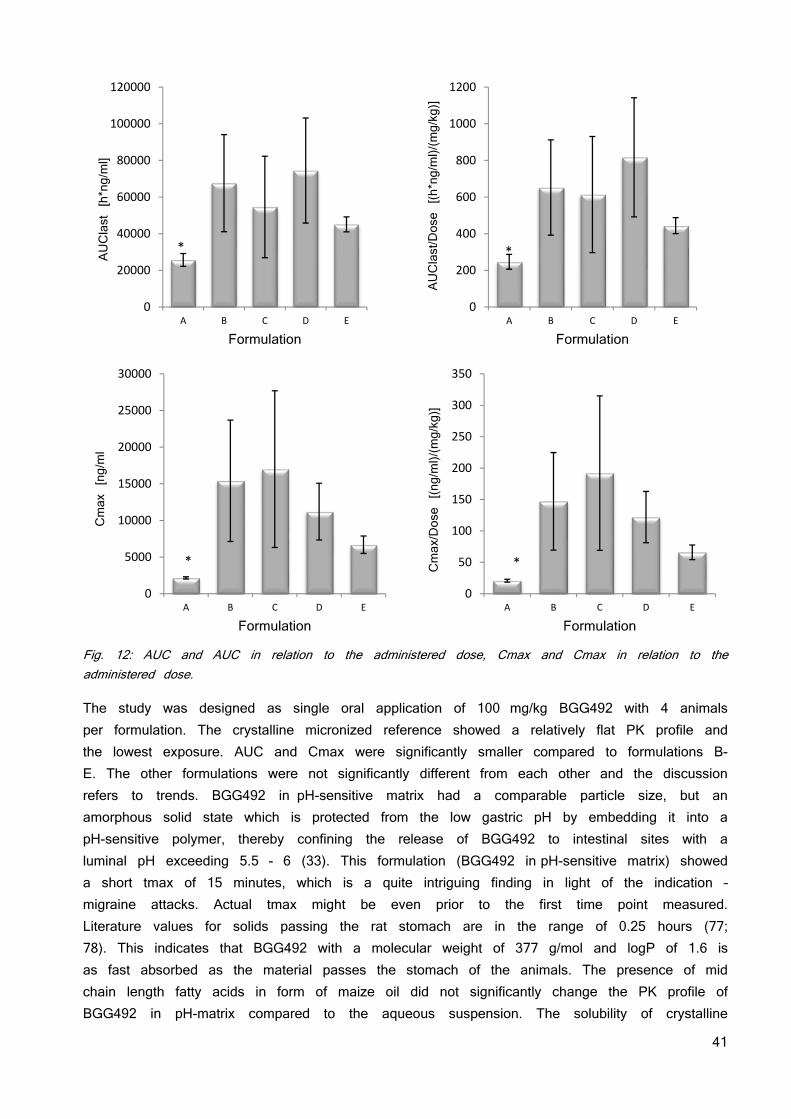
41
Fig. 12: AUC and AUC in relation to the administered dose, Cmax and Cmax in relation to the administered dose.
The study was designed as single oral application of 100 mg/kg BGG492 with 4 animals per formulation. The crystalline micronized reference showed a relatively flat PK profile and the lowest exposure. AUC and Cmax were significantly smaller compared to formulations B-E. The other formulations were not significantly different from each other and the discussion refers to trends. BGG492 in pH-sensitive matrix had a comparable particle size, but an amorphous solid state which is protected from the low gastric pH by embedding it into a pH-sensitive polymer, thereby confining the release of BGG492 to intestinal sites with a luminal pH exceeding 5.5 - 6 (33). This formulation (BGG492 in pH-sensitive matrix) showed a short tmax of 15 minutes, which is a quite intriguing finding in light of the indication – migraine attacks. Actual tmax might be even prior to the first time point measured. Literature values for solids passing the rat stomach are in the range of 0.25 hours (77; 78). This indicates that BGG492 with a molecular weight of 377 g/mol and logP of 1.6 is as fast absorbed as the material passes the stomach of the animals. The presence of mid chain length fatty acids in form of maize oil did not significantly change the PK profile of BGG492 in pH-matrix compared to the aqueous suspension. The solubility of crystalline
0
20000
40000
60000
80000
100000
120000
A B C D E
AUClast [h*ng/ml]
Formulation
*
0
200
400
600
800
1000
1200
A B C D E
AUClast/Dose [(h*ng/ml)/(mg/kg)]
Formulation
*
0
5000
10000
15000
20000
25000
30000
A B C D E
Cmax [ng/ml
Formulation
*
0
50
100
150
200
250
300
350
A B C D E
Cmax/Dose [(ng/ml)/(mg/kg)]
Formulation
*
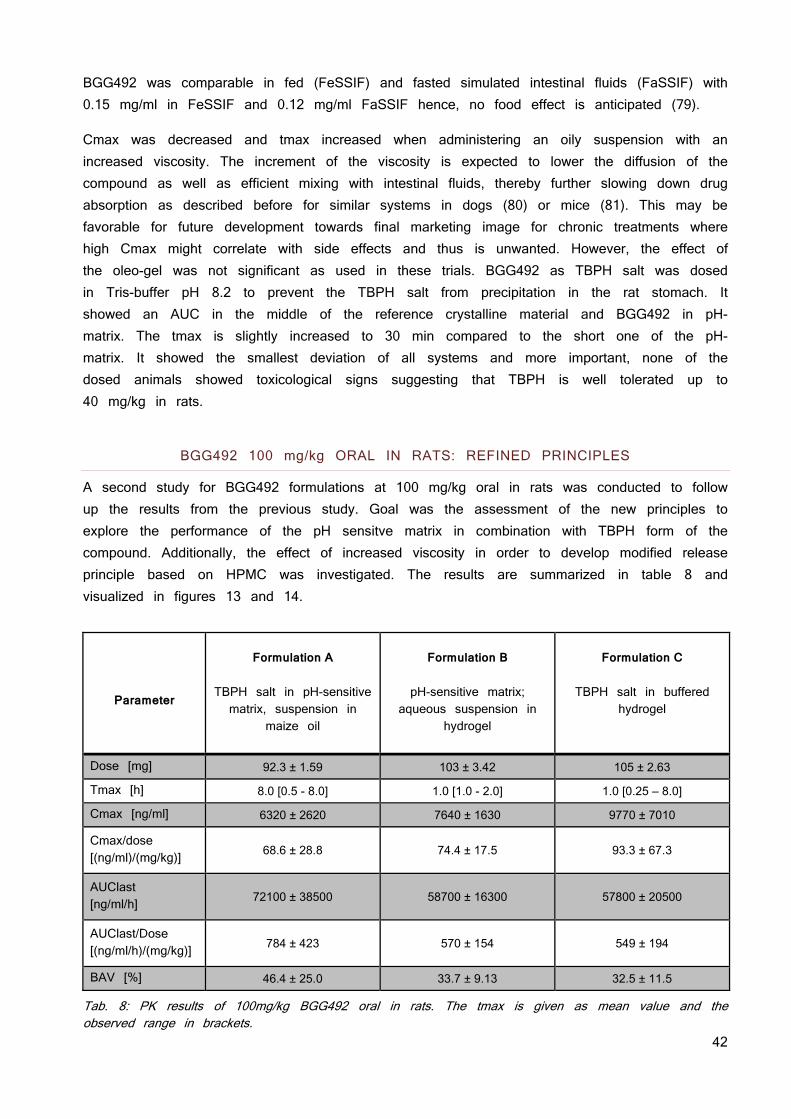
42
BGG492 was comparable in fed (FeSSIF) and fasted simulated intestinal fluids (FaSSIF) with 0.15 mg/ml in FeSSIF and 0.12 mg/ml FaSSIF hence, no food effect is anticipated (79).
Cmax was decreased and tmax increased when administering an oily suspension with an increased viscosity. The increment of the viscosity is expected to lower the diffusion of the compound as well as efficient mixing with intestinal fluids, thereby further slowing down drug absorption as described before for similar systems in dogs (80) or mice (81). This may be favorable for future development towards final marketing image for chronic treatments where high Cmax might correlate with side effects and thus is unwanted. However, the effect of the oleo-gel was not significant as used in these trials. BGG492 as TBPH salt was dosed in Tris-buffer pH 8.2 to prevent the TBPH salt from precipitation in the rat stomach. It showed an AUC in the middle of the reference crystalline material and BGG492 in pH-matrix. The tmax is slightly increased to 30 min compared to the short one of the pH-matrix. It showed the smallest deviation of all systems and more important, none of the dosed animals showed toxicological signs suggesting that TBPH is well tolerated up to 40 mg/kg in rats.
BGG492 100 mg/kg ORAL IN RATS: REFINED PRINCIPLES
A second study for BGG492 formulations at 100 mg/kg oral in rats was conducted to follow up the results from the previous study. Goal was the assessment of the new principles to explore the performance of the pH sensitve matrix in combination with TBPH form of the compound. Additionally, the effect of increased viscosity in order to develop modified release principle based on HPMC was investigated. The results are summarized in table 8 and visualized in figures 13 and 14.
Parameter
Formulation A
TBPH salt in pH-sensitive matrix, suspension in
maize oil
Formulation B
pH-sensitive matrix;
aqueous suspension in hydrogel
Formulation C
TBPH salt in buffered
hydrogel
Dose [mg] 92.3 ± 1.59 103 ± 3.42 105 ± 2.63
Tmax [h] 8.0 [0.5 - 8.0] 1.0 [1.0 - 2.0] 1.0 [0.25 – 8.0]
Cmax [ng/ml] 6320 ± 2620 7640 ± 1630 9770 ± 7010
Cmax/dose [(ng/ml)/(mg/kg)] 68.6 ± 28.8 74.4 ± 17.5 93.3 ± 67.3
AUClast [ng/ml/h] 72100 ± 38500 58700 ± 16300 57800 ± 20500
AUClast/Dose [(ng/ml/h)/(mg/kg)] 784 ± 423 570 ± 154 549 ± 194
BAV [%] 46.4 ± 25.0 33.7 ± 9.13 32.5 ± 11.5
Tab. 8: PK results of 100mg/kg BGG492 oral in rats. The tmax is given as mean value and the observed range in brackets.
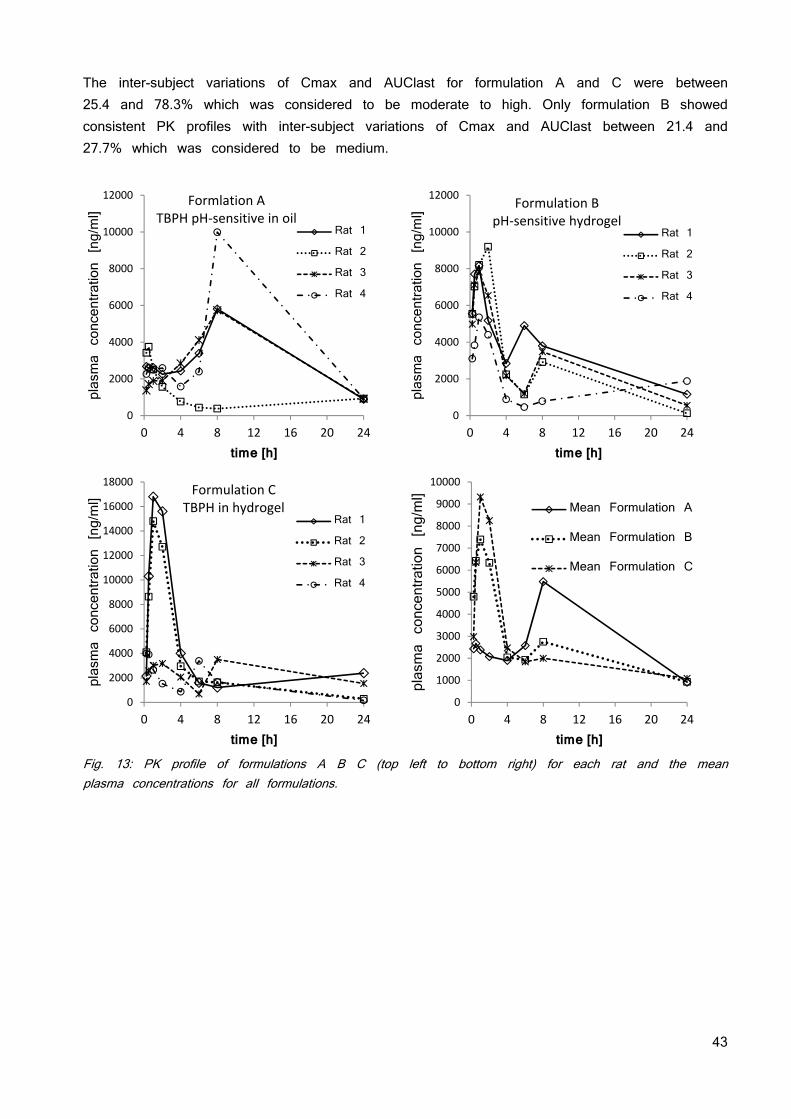
43
The inter-subject variations of Cmax and AUClast for formulation A and C were between 25.4 and 78.3% which was considered to be moderate to high. Only formulation B showed consistent PK profiles with inter-subject variations of Cmax and AUClast between 21.4 and 27.7% which was considered to be medium.
Fig. 13: PK profile of formulations A B C (top left to bottom right) for each rat and the mean plasma concentrations for all formulations.
0
2000
4000
6000
8000
10000
12000
0 4 8 12 16 20 24
plasma concentration [ng/ml]
time [h]
Formlation ATBPH pH‐sensitive in oil
Rat 1
Rat 2
Rat 3
Rat 4
0
2000
4000
6000
8000
10000
12000
0 4 8 12 16 20 24plasma concentration [ng/ml]
time [h]
Formulation BpH‐sensitive hydrogel
Rat 1
Rat 2
Rat 3
Rat 4
0
2000
4000
6000
8000
10000
12000
14000
16000
18000
0 4 8 12 16 20 24
plasma concentration [ng/ml]
time [h]
Formulation CTBPH in hydrogel
Rat 1
Rat 2
Rat 3
Rat 4
0
1000
2000
3000
4000
5000
6000
7000
8000
9000
10000
0 4 8 12 16 20 24
plasma concentration [ng/ml]
time [h]
Mean Formulation A
Mean Formulation B
Mean Formulation C
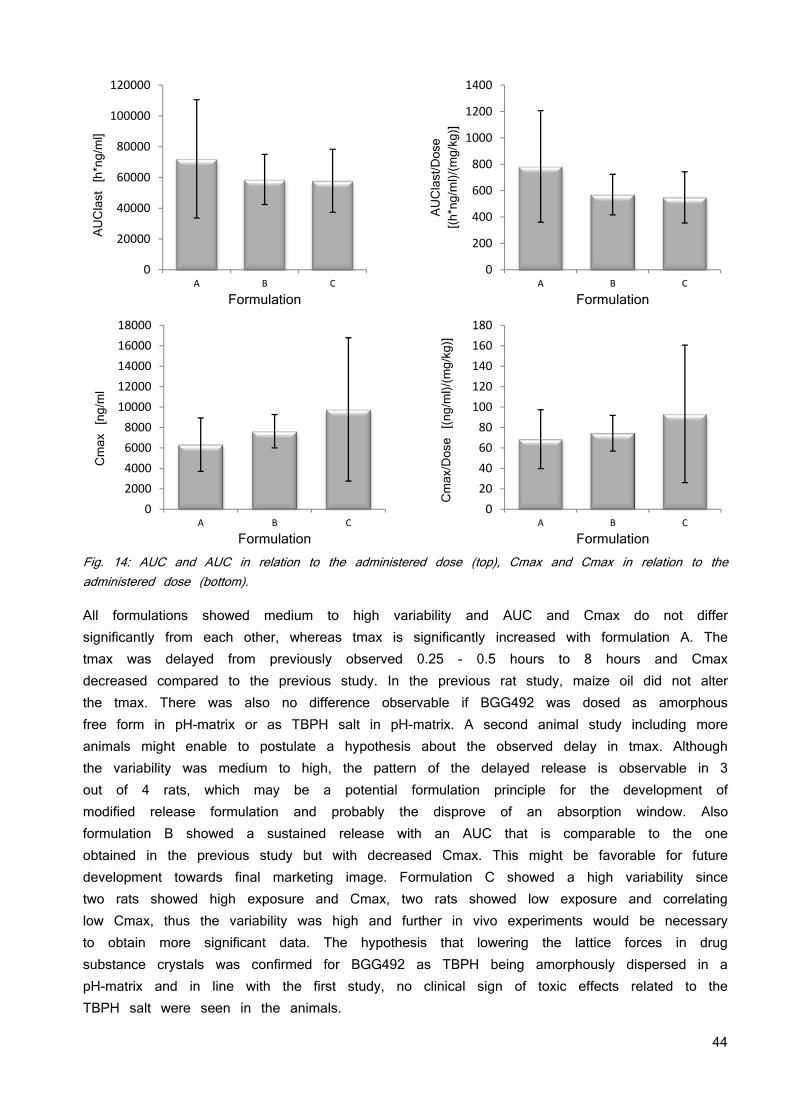
44
Fig. 14: AUC and AUC in relation to the administered dose (top), Cmax and Cmax in relation to the administered dose (bottom).
All formulations showed medium to high variability and AUC and Cmax do not differ significantly from each other, whereas tmax is significantly increased with formulation A. The tmax was delayed from previously observed 0.25 - 0.5 hours to 8 hours and Cmax decreased compared to the previous study. In the previous rat study, maize oil did not alter the tmax. There was also no difference observable if BGG492 was dosed as amorphous free form in pH-matrix or as TBPH salt in pH-matrix. A second animal study including more animals might enable to postulate a hypothesis about the observed delay in tmax. Although the variability was medium to high, the pattern of the delayed release is observable in 3 out of 4 rats, which may be a potential formulation principle for the development of modified release formulation and probably the disprove of an absorption window. Also formulation B showed a sustained release with an AUC that is comparable to the one obtained in the previous study but with decreased Cmax. This might be favorable for future development towards final marketing image. Formulation C showed a high variability since two rats showed high exposure and Cmax, two rats showed low exposure and correlating low Cmax, thus the variability was high and further in vivo experiments would be necessary to obtain more significant data. The hypothesis that lowering the lattice forces in drug substance crystals was confirmed for BGG492 as TBPH being amorphously dispersed in a pH-matrix and in line with the first study, no clinical sign of toxic effects related to the TBPH salt were seen in the animals.
0
20000
40000
60000
80000
100000
120000
A B C
AUClast [h*ng/ml]
Formulation
0
200
400
600
800
1000
1200
1400
A B C
AUClast/Dose
[(h*ng/ml)/(mg/kg)]
Formulation
0
2000
4000
6000
8000
10000
12000
14000
16000
18000
A B C
Cmax [ng/ml
Formulation
0
20
40
60
80
100
120
140
160
180
A B C
Cmax/Dose [(ng/ml)/(mg/kg)]
Formulation
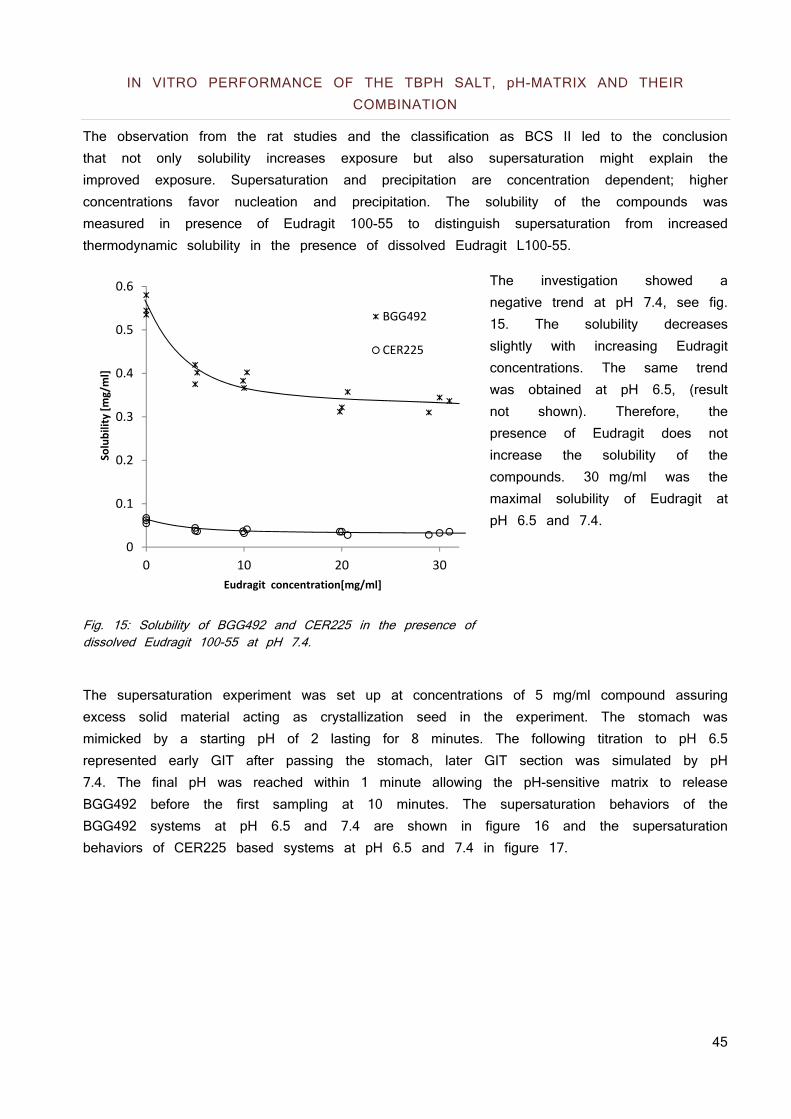
45
IN VITRO PERFORMANCE OF THE TBPH SALT, pH-MATRIX AND THEIR COMBINATION
The observation from the rat studies and the classification as BCS II led to the conclusion that not only solubility increases exposure but also supersaturation might explain the improved exposure. Supersaturation and precipitation are concentration dependent; higher concentrations favor nucleation and precipitation. The solubility of the compounds was measured in presence of Eudragit 100-55 to distinguish supersaturation from increased thermodynamic solubility in the presence of dissolved Eudragit L100-55.
The investigation showed a negative trend at pH 7.4, see fig. 15. The solubility decreases slightly with increasing Eudragit concentrations. The same trend was obtained at pH 6.5, (result not shown). Therefore, the presence of Eudragit does not increase the solubility of the compounds. 30 mg/ml was the maximal solubility of Eudragit at pH 6.5 and 7.4.
Fig. 15: Solubility of BGG492 and CER225 in the presence of dissolved Eudragit 100-55 at pH 7.4.
The supersaturation experiment was set up at concentrations of 5 mg/ml compound assuring excess solid material acting as crystallization seed in the experiment. The stomach was mimicked by a starting pH of 2 lasting for 8 minutes. The following titration to pH 6.5 represented early GIT after passing the stomach, later GIT section was simulated by pH 7.4. The final pH was reached within 1 minute allowing the pH-sensitive matrix to release BGG492 before the first sampling at 10 minutes. The supersaturation behaviors of the BGG492 systems at pH 6.5 and 7.4 are shown in figure 16 and the supersaturation behaviors of CER225 based systems at pH 6.5 and 7.4 in figure 17.
0
0.1
0.2
0.3
0.4
0.5
0.6
0 10 20 30
Solubility [mg/ml]
Eudragit concentration[mg/ml]
BGG492
CER225
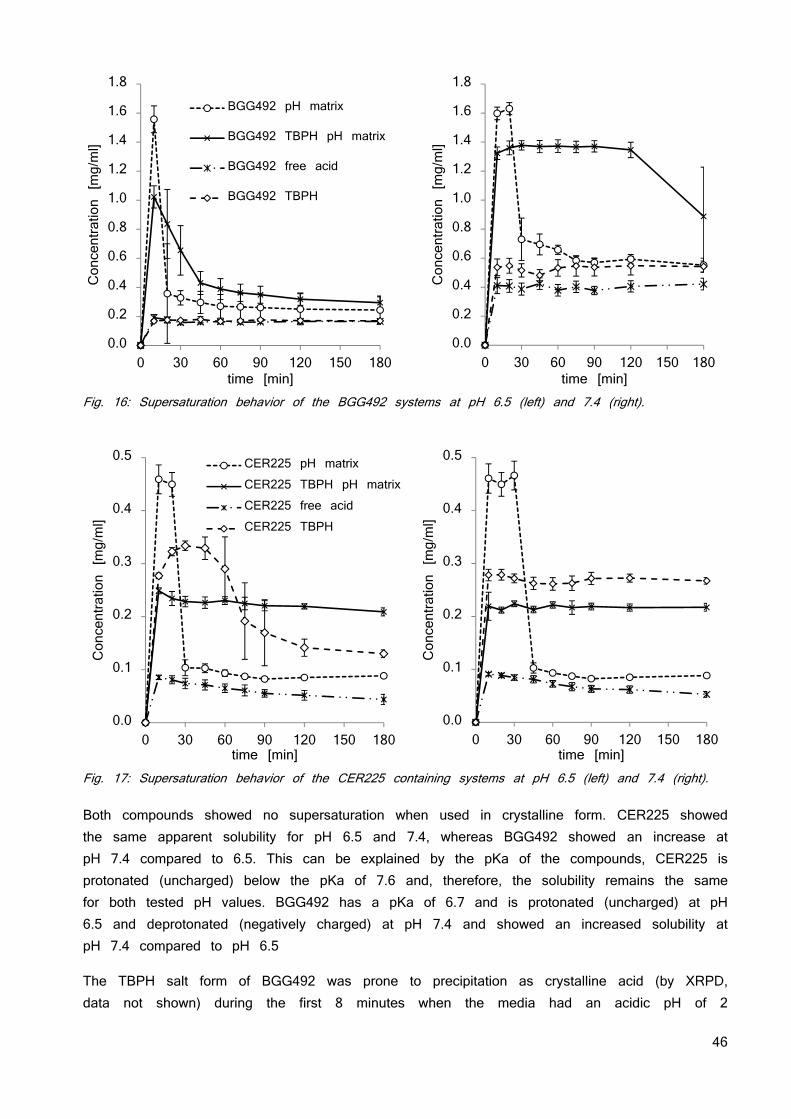
46
Fig. 16: Supersaturation behavior of the BGG492 systems at pH 6.5 (left) and 7.4 (right).
Fig. 17: Supersaturation behavior of the CER225 containing systems at pH 6.5 (left) and 7.4 (right). Both compounds showed no supersaturation when used in crystalline form. CER225 showed the same apparent solubility for pH 6.5 and 7.4, whereas BGG492 showed an increase at pH 7.4 compared to 6.5. This can be explained by the pKa of the compounds, CER225 is protonated (uncharged) below the pKa of 7.6 and, therefore, the solubility remains the same for both tested pH values. BGG492 has a pKa of 6.7 and is protonated (uncharged) at pH 6.5 and deprotonated (negatively charged) at pH 7.4 and showed an increased solubility at pH 7.4 compared to pH 6.5
The TBPH salt form of BGG492 was prone to precipitation as crystalline acid (by XRPD, data not shown) during the first 8 minutes when the media had an acidic pH of 2
0.0
0.2
0.4
0.6
0.8
1.0
1.2
1.4
1.6
1.8
0 30 60 90 120 150 180
Concentration [mg/ml]
time [min]
BGG492 pH matrix
BGG492 TBPH pH matrix
BGG492 free acid
BGG492 TBPH
0.0
0.2
0.4
0.6
0.8
1.0
1.2
1.4
1.6
1.8
0 30 60 90 120 150 180
Concentration [mg/ml]
time [min]
0.0
0.1
0.2
0.3
0.4
0.5
0 30 60 90 120 150 180
Concentration [mg/ml]
time [min]
CER225 pH matrixCER225 TBPH pH matrixCER225 free acidCER225 TBPH
0.0
0.1
0.2
0.3
0.4
0.5
0 30 60 90 120 150 180
Concentration [mg/ml]
time [min]
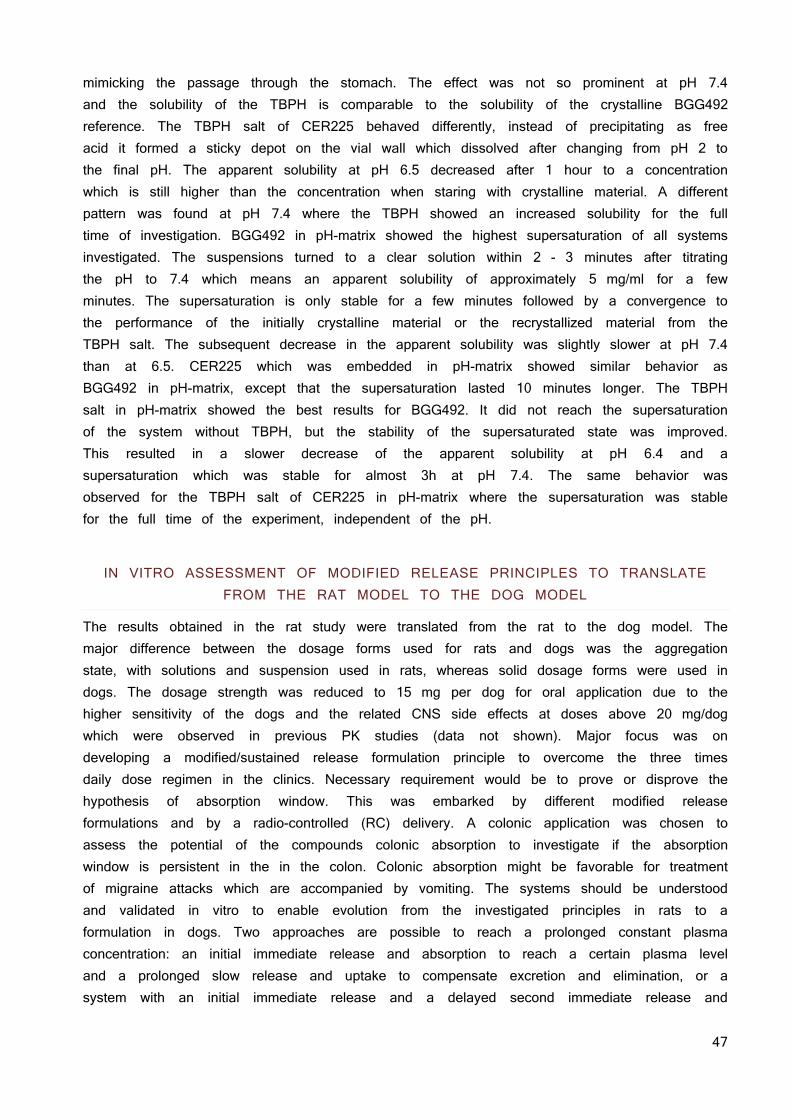
47
mimicking the passage through the stomach. The effect was not so prominent at pH 7.4 and the solubility of the TBPH is comparable to the solubility of the crystalline BGG492 reference. The TBPH salt of CER225 behaved differently, instead of precipitating as free acid it formed a sticky depot on the vial wall which dissolved after changing from pH 2 to the final pH. The apparent solubility at pH 6.5 decreased after 1 hour to a concentration which is still higher than the concentration when staring with crystalline material. A different pattern was found at pH 7.4 where the TBPH showed an increased solubility for the full time of investigation. BGG492 in pH-matrix showed the highest supersaturation of all systems investigated. The suspensions turned to a clear solution within 2 - 3 minutes after titrating the pH to 7.4 which means an apparent solubility of approximately 5 mg/ml for a few minutes. The supersaturation is only stable for a few minutes followed by a convergence to the performance of the initially crystalline material or the recrystallized material from the TBPH salt. The subsequent decrease in the apparent solubility was slightly slower at pH 7.4 than at 6.5. CER225 which was embedded in pH-matrix showed similar behavior as BGG492 in pH-matrix, except that the supersaturation lasted 10 minutes longer. The TBPH salt in pH-matrix showed the best results for BGG492. It did not reach the supersaturation of the system without TBPH, but the stability of the supersaturated state was improved. This resulted in a slower decrease of the apparent solubility at pH 6.4 and a supersaturation which was stable for almost 3h at pH 7.4. The same behavior was observed for the TBPH salt of CER225 in pH-matrix where the supersaturation was stable for the full time of the experiment, independent of the pH.
IN VITRO ASSESSMENT OF MODIFIED RELEASE PRINCIPLES TO TRANSLATE
FROM THE RAT MODEL TO THE DOG MODEL
The results obtained in the rat study were translated from the rat to the dog model. The major difference between the dosage forms used for rats and dogs was the aggregation state, with solutions and suspension used in rats, whereas solid dosage forms were used in dogs. The dosage strength was reduced to 15 mg per dog for oral application due to the higher sensitivity of the dogs and the related CNS side effects at doses above 20 mg/dog which were observed in previous PK studies (data not shown). Major focus was on developing a modified/sustained release formulation principle to overcome the three times daily dose regimen in the clinics. Necessary requirement would be to prove or disprove the hypothesis of absorption window. This was embarked by different modified release formulations and by a radio-controlled (RC) delivery. A colonic application was chosen to assess the potential of the compounds colonic absorption to investigate if the absorption window is persistent in the in the colon. Colonic absorption might be favorable for treatment of migraine attacks which are accompanied by vomiting. The systems should be understood and validated in vitro to enable evolution from the investigated principles in rats to a formulation in dogs. Two approaches are possible to reach a prolonged constant plasma concentration: an initial immediate release and absorption to reach a certain plasma level and a prolonged slow release and uptake to compensate excretion and elimination, or a system with an initial immediate release and a delayed second immediate release and
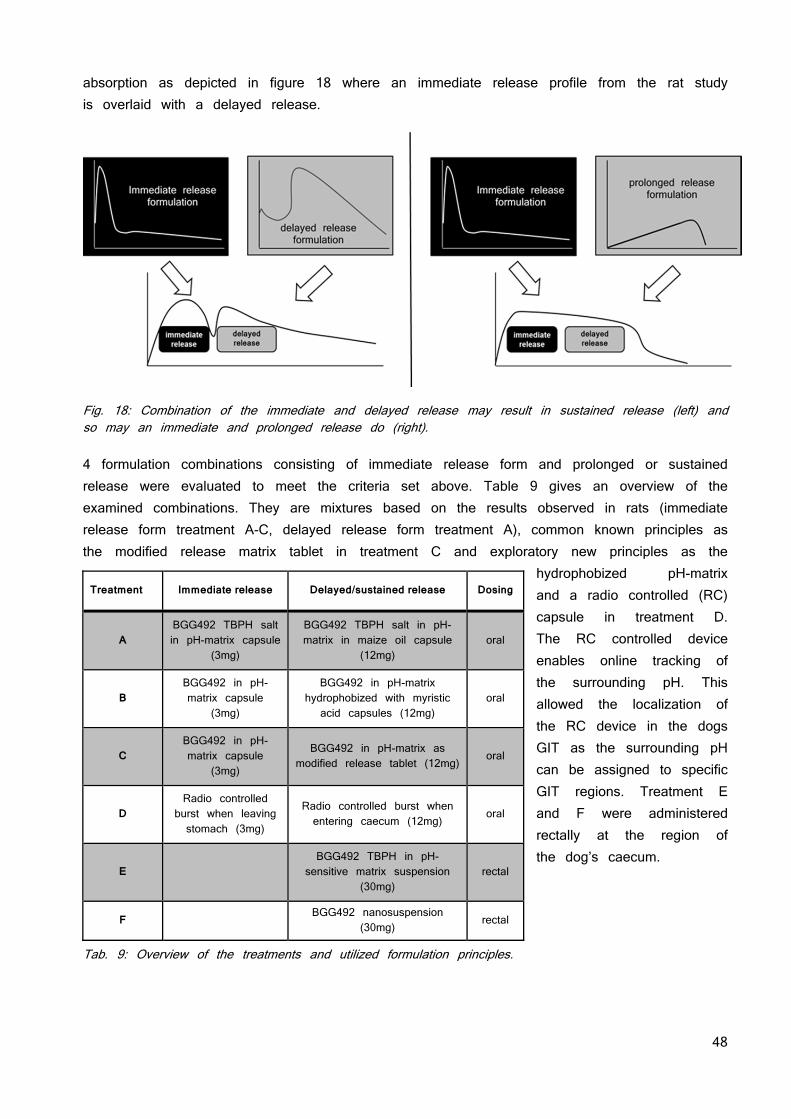
48
absorption as depicted in figure 18 where an immediate release profile from the rat study is overlaid with a delayed release.
Fig. 18: Combination of the immediate and delayed release may result in sustained release (left) and so may an immediate and prolonged release do (right). 4 formulation combinations consisting of immediate release form and prolonged or sustained release were evaluated to meet the criteria set above. Table 9 gives an overview of the examined combinations. They are mixtures based on the results observed in rats (immediate release form treatment A-C, delayed release form treatment A), common known principles as the modified release matrix tablet in treatment C and exploratory new principles as the
hydrophobized pH-matrix and a radio controlled (RC) capsule in treatment D. The RC controlled device enables online tracking of the surrounding pH. This allowed the localization of the RC device in the dogs GIT as the surrounding pH can be assigned to specific GIT regions. Treatment E and F were administered rectally at the region of the dog’s caecum.
Tab. 9: Overview of the treatments and utilized formulation principles.
Treatment Immediate release Delayed/sustained release Dosing
A BGG492 TBPH salt in pH-matrix capsule
(3mg)
BGG492 TBPH salt in pH-matrix in maize oil capsule
(12mg) oral
B BGG492 in pH-matrix capsule
(3mg)
BGG492 in pH-matrix hydrophobized with myristic acid capsules (12mg)
oral
C BGG492 in pH-matrix capsule
(3mg)
BGG492 in pH-matrix as modified release tablet (12mg)
oral
D Radio controlled
burst when leaving stomach (3mg)
Radio controlled burst when entering caecum (12mg)
oral
E
BGG492 TBPH in pH-sensitive matrix suspension
(30mg) rectal
F BGG492 nanosuspension
(30mg) rectal
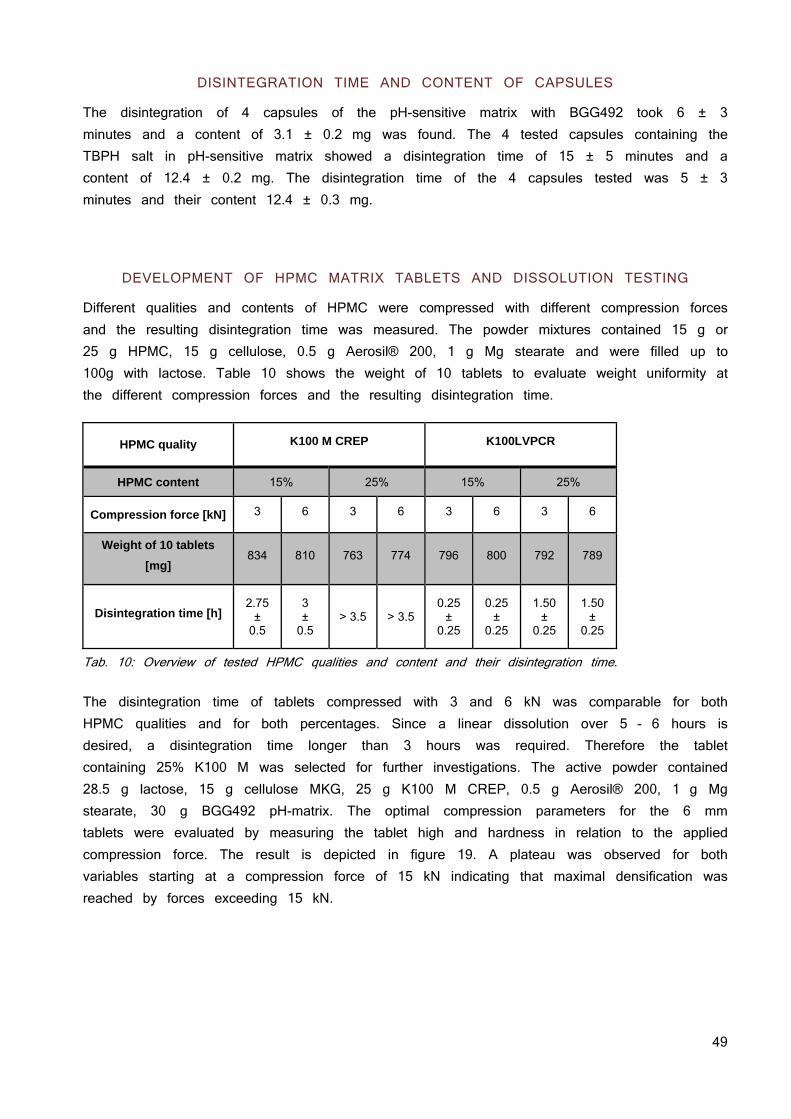
49
DISINTEGRATION TIME AND CONTENT OF CAPSULES
The disintegration of 4 capsules of the pH-sensitive matrix with BGG492 took 6 ± 3 minutes and a content of 3.1 ± 0.2 mg was found. The 4 tested capsules containing the TBPH salt in pH-sensitive matrix showed a disintegration time of 15 ± 5 minutes and a content of 12.4 ± 0.2 mg. The disintegration time of the 4 capsules tested was 5 ± 3 minutes and their content 12.4 ± 0.3 mg.
DEVELOPMENT OF HPMC MATRIX TABLETS AND DISSOLUTION TESTING
Different qualities and contents of HPMC were compressed with different compression forces and the resulting disintegration time was measured. The powder mixtures contained 15 g or 25 g HPMC, 15 g cellulose, 0.5 g Aerosil® 200, 1 g Mg stearate and were filled up to 100g with lactose. Table 10 shows the weight of 10 tablets to evaluate weight uniformity at the different compression forces and the resulting disintegration time.
HPMC quality K100 M CREP K100LVPCR
HPMC content 15% 25% 15% 25%
Compression force [kN] 3 6 3 6 3 6 3 6
Weight of 10 tablets
[mg] 834 810 763 774 796 800 792 789
Disintegration time [h] 2.75
± 0.5
3 ±
0.5 > 3.5 > 3.5
0.25 ±
0.25
0.25 ±
0.25
1.50 ±
0.25
1.50 ±
0.25
Tab. 10: Overview of tested HPMC qualities and content and their disintegration time. The disintegration time of tablets compressed with 3 and 6 kN was comparable for both HPMC qualities and for both percentages. Since a linear dissolution over 5 - 6 hours is desired, a disintegration time longer than 3 hours was required. Therefore the tablet containing 25% K100 M was selected for further investigations. The active powder contained 28.5 g lactose, 15 g cellulose MKG, 25 g K100 M CREP, 0.5 g Aerosil® 200, 1 g Mg stearate, 30 g BGG492 pH-matrix. The optimal compression parameters for the 6 mm tablets were evaluated by measuring the tablet high and hardness in relation to the applied compression force. The result is depicted in figure 19. A plateau was observed for both variables starting at a compression force of 15 kN indicating that maximal densification was reached by forces exceeding 15 kN.
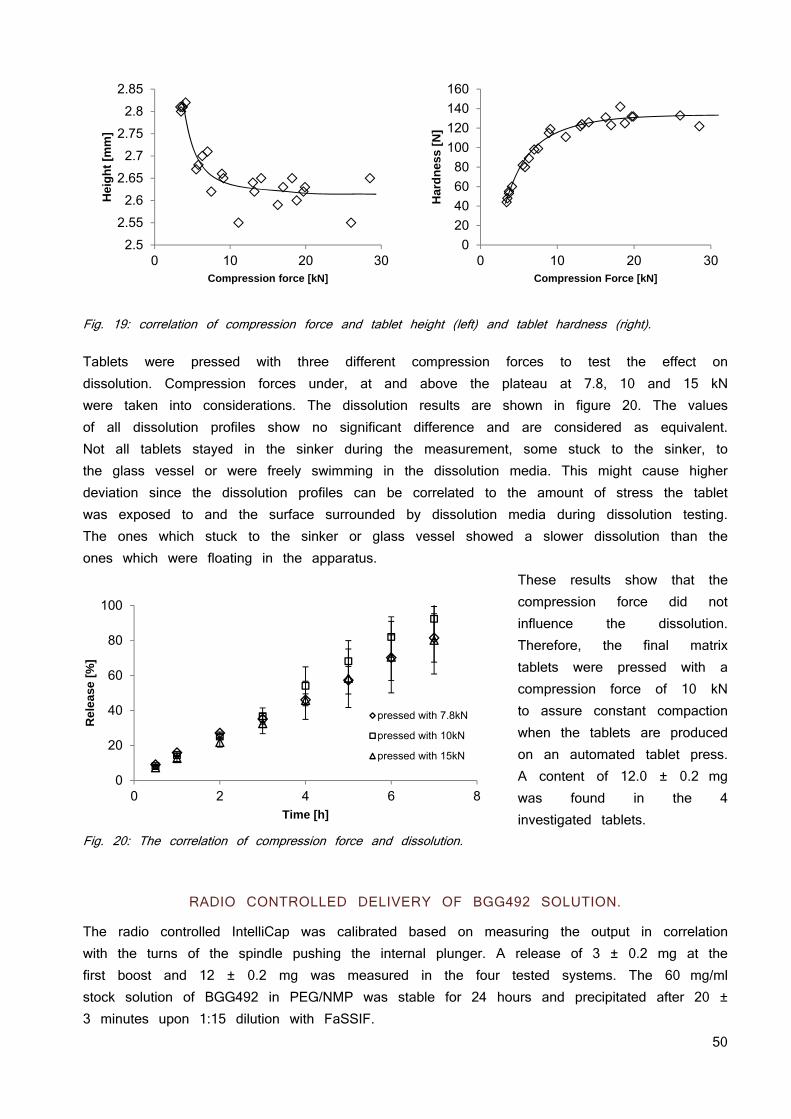
50
Fig. 19: correlation of compression force and tablet height (left) and tablet hardness (right). Tablets were pressed with three different compression forces to test the effect on dissolution. Compression forces under, at and above the plateau at 7.8, 10 and 15 kN were taken into considerations. The dissolution results are shown in figure 20. The values of all dissolution profiles show no significant difference and are considered as equivalent. Not all tablets stayed in the sinker during the measurement, some stuck to the sinker, to the glass vessel or were freely swimming in the dissolution media. This might cause higher deviation since the dissolution profiles can be correlated to the amount of stress the tablet was exposed to and the surface surrounded by dissolution media during dissolution testing. The ones which stuck to the sinker or glass vessel showed a slower dissolution than the ones which were floating in the apparatus.
These results show that the compression force did not influence the dissolution. Therefore, the final matrix tablets were pressed with a compression force of 10 kN to assure constant compaction when the tablets are produced on an automated tablet press. A content of 12.0 ± 0.2 mg was found in the 4 investigated tablets.
Fig. 20: The correlation of compression force and dissolution.
RADIO CONTROLLED DELIVERY OF BGG492 SOLUTION.
The radio controlled IntelliCap was calibrated based on measuring the output in correlation with the turns of the spindle pushing the internal plunger. A release of 3 ± 0.2 mg at the first boost and 12 ± 0.2 mg was measured in the four tested systems. The 60 mg/ml stock solution of BGG492 in PEG/NMP was stable for 24 hours and precipitated after 20 ± 3 minutes upon 1:15 dilution with FaSSIF.
2.5
2.55
2.6
2.65
2.7
2.75
2.8
2.85
0 10 20 30
Hei
gh
t [m
m]
Compression force [kN]
0
20
40
60
80
100
120
140
160
0 10 20 30
Har
dn
ess
[N]
Compression Force [kN]
0
20
40
60
80
100
0 2 4 6 8
Rel
ease
[%
]
Time [h]
pressed with 7.8kN
pressed with 10kN
pressed with 15kN
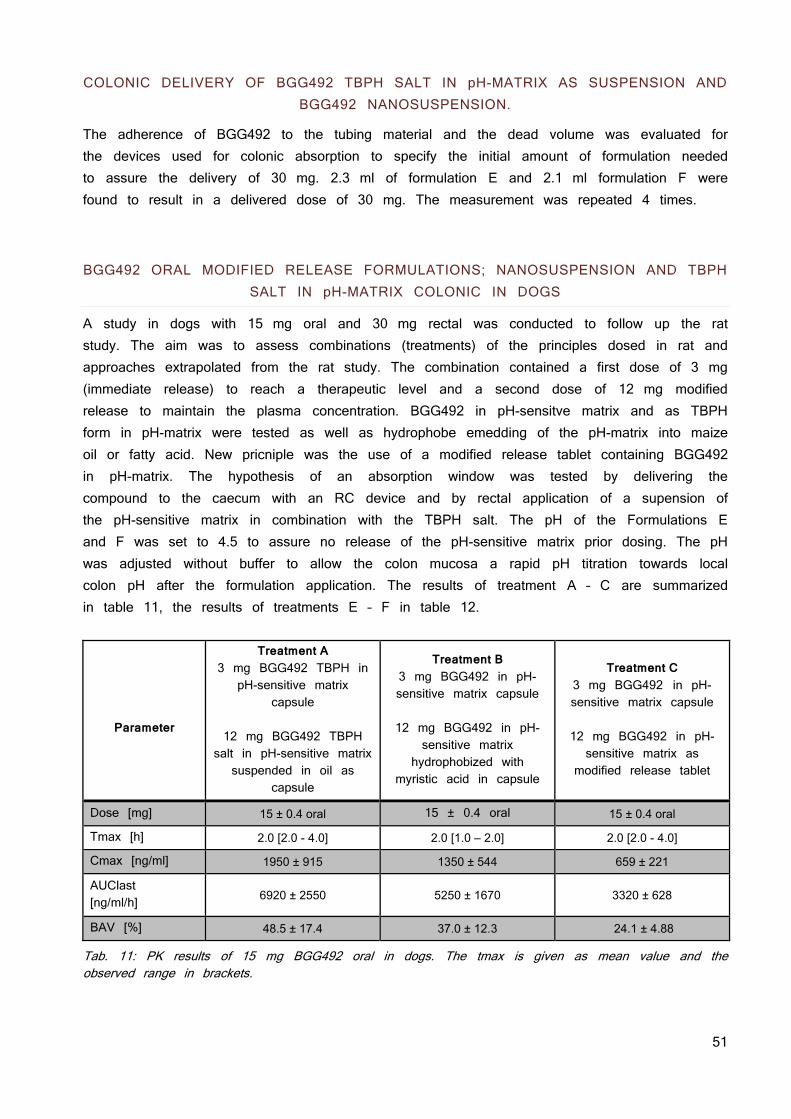
51
COLONIC DELIVERY OF BGG492 TBPH SALT IN pH-MATRIX AS SUSPENSION AND BGG492 NANOSUSPENSION.
The adherence of BGG492 to the tubing material and the dead volume was evaluated for the devices used for colonic absorption to specify the initial amount of formulation needed to assure the delivery of 30 mg. 2.3 ml of formulation E and 2.1 ml formulation F were found to result in a delivered dose of 30 mg. The measurement was repeated 4 times.
BGG492 ORAL MODIFIED RELEASE FORMULATIONS; NANOSUSPENSION AND TBPH SALT IN pH-MATRIX COLONIC IN DOGS
A study in dogs with 15 mg oral and 30 mg rectal was conducted to follow up the rat study. The aim was to assess combinations (treatments) of the principles dosed in rat and approaches extrapolated from the rat study. The combination contained a first dose of 3 mg (immediate release) to reach a therapeutic level and a second dose of 12 mg modified release to maintain the plasma concentration. BGG492 in pH-sensitve matrix and as TBPH form in pH-matrix were tested as well as hydrophobe emedding of the pH-matrix into maize oil or fatty acid. New pricniple was the use of a modified release tablet containing BGG492 in pH-matrix. The hypothesis of an absorption window was tested by delivering the compound to the caecum with an RC device and by rectal application of a supension of the pH-sensitive matrix in combination with the TBPH salt. The pH of the Formulations E and F was set to 4.5 to assure no release of the pH-sensitive matrix prior dosing. The pH was adjusted without buffer to allow the colon mucosa a rapid pH titration towards local colon pH after the formulation application. The results of treatment A – C are summarized in table 11, the results of treatments E – F in table 12.
Parameter
Treatment A 3 mg BGG492 TBPH in
pH-sensitive matrix capsule
12 mg BGG492 TBPH
salt in pH-sensitive matrix suspended in oil as
capsule
Treatment B 3 mg BGG492 in pH-sensitive matrix capsule
12 mg BGG492 in pH-
sensitive matrix hydrophobized with
myristic acid in capsule
Treatment C 3 mg BGG492 in pH-sensitive matrix capsule
12 mg BGG492 in pH-sensitive matrix as
modified release tablet
Dose [mg] 15 ± 0.4 oral 15 ± 0.4 oral 15 ± 0.4 oral
Tmax [h] 2.0 [2.0 - 4.0] 2.0 [1.0 – 2.0] 2.0 [2.0 - 4.0]
Cmax [ng/ml] 1950 ± 915 1350 ± 544 659 ± 221
AUClast [ng/ml/h] 6920 ± 2550 5250 ± 1670 3320 ± 628
BAV [%] 48.5 ± 17.4 37.0 ± 12.3 24.1 ± 4.88
Tab. 11: PK results of 15 mg BGG492 oral in dogs. The tmax is given as mean value and the observed range in brackets.
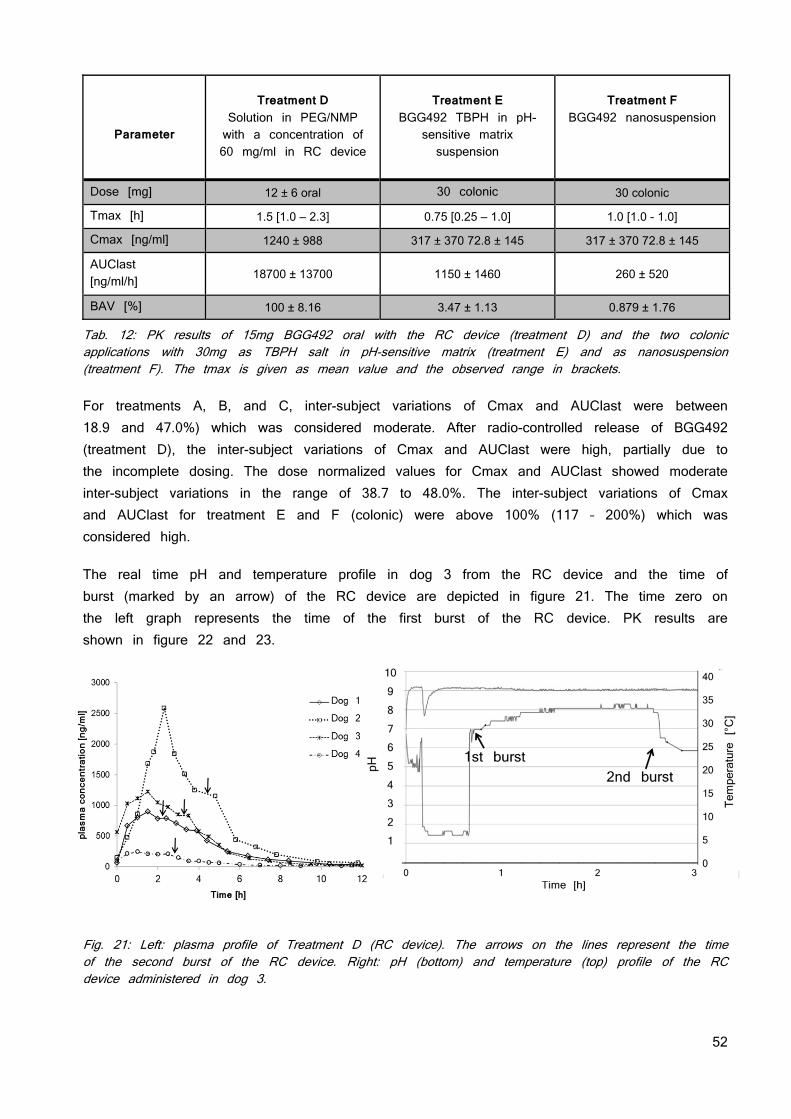
52
Parameter
Treatment D
Solution in PEG/NMP with a concentration of 60 mg/ml in RC device
Treatment E
BGG492 TBPH in pH-sensitive matrix suspension
Treatment F
BGG492 nanosuspension
Dose [mg] 12 ± 6 oral 30 colonic 30 colonic
Tmax [h] 1.5 [1.0 – 2.3] 0.75 [0.25 – 1.0] 1.0 [1.0 - 1.0]
Cmax [ng/ml] 1240 ± 988 317 ± 370 72.8 ± 145 317 ± 370 72.8 ± 145
AUClast [ng/ml/h] 18700 ± 13700 1150 ± 1460 260 ± 520
BAV [%] 100 ± 8.16 3.47 ± 1.13 0.879 ± 1.76
Tab. 12: PK results of 15mg BGG492 oral with the RC device (treatment D) and the two colonic applications with 30mg as TBPH salt in pH-sensitive matrix (treatment E) and as nanosuspension (treatment F). The tmax is given as mean value and the observed range in brackets. For treatments A, B, and C, inter-subject variations of Cmax and AUClast were between 18.9 and 47.0%) which was considered moderate. After radio-controlled release of BGG492 (treatment D), the inter-subject variations of Cmax and AUClast were high, partially due to the incomplete dosing. The dose normalized values for Cmax and AUClast showed moderate inter-subject variations in the range of 38.7 to 48.0%. The inter-subject variations of Cmax and AUClast for treatment E and F (colonic) were above 100% (117 – 200%) which was considered high.
The real time pH and temperature profile in dog 3 from the RC device and the time of burst (marked by an arrow) of the RC device are depicted in figure 21. The time zero on the left graph represents the time of the first burst of the RC device. PK results are shown in figure 22 and 23.
Fig. 21: Left: plasma profile of Treatment D (RC device). The arrows on the lines represent the time of the second burst of the RC device. Right: pH (bottom) and temperature (top) profile of the RC device administered in dog 3.
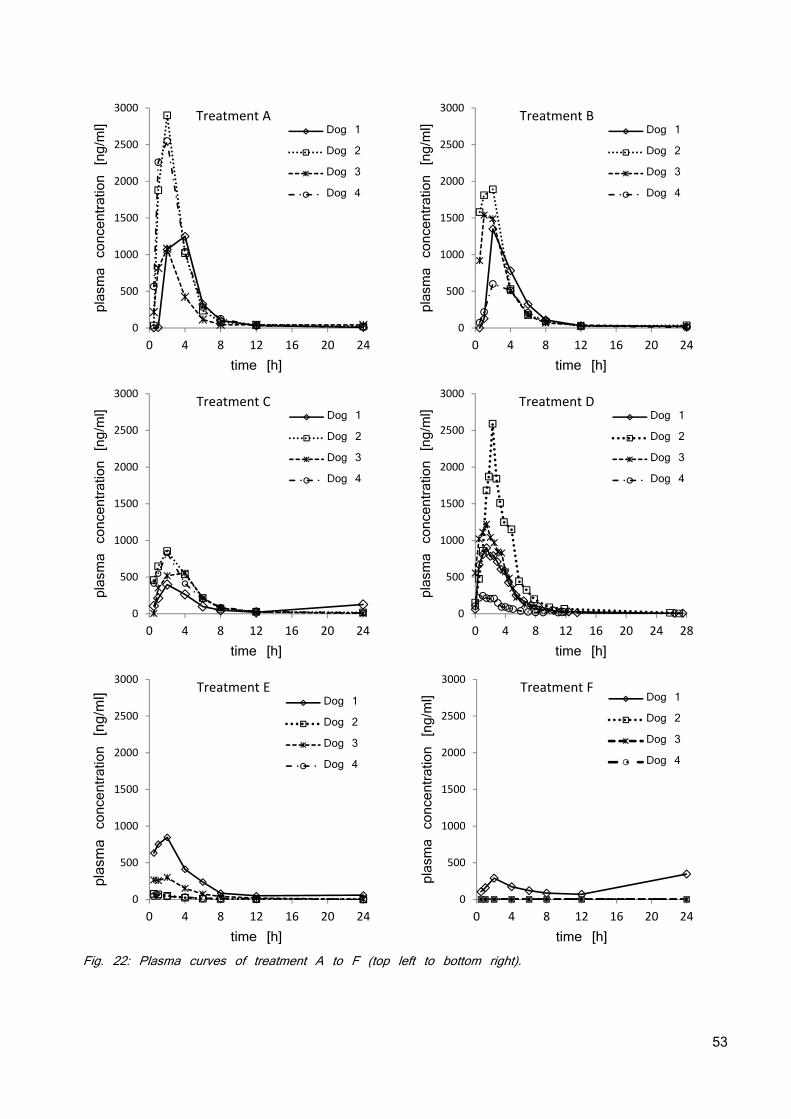
53
Fig. 22: Plasma curves of treatment A to F (top left to bottom right).
0
500
1000
1500
2000
2500
3000
0 4 8 12 16 20 24
plasma concentration [ng/ml]
time [h]
Treatment ADog 1
Dog 2
Dog 3
Dog 4
0
500
1000
1500
2000
2500
3000
0 4 8 12 16 20 24
plasma concentration [ng/ml]
time [h]
Treatment BDog 1
Dog 2
Dog 3
Dog 4
0
500
1000
1500
2000
2500
3000
0 4 8 12 16 20 24
plasma concentration [ng/ml]
time [h]
Treatment CDog 1
Dog 2
Dog 3
Dog 4
0
500
1000
1500
2000
2500
3000
0 4 8 12 16 20 24 28
plasma concentration [ng/ml]
time [h]
Treatment DDog 1
Dog 2
Dog 3
Dog 4
0
500
1000
1500
2000
2500
3000
0 4 8 12 16 20 24
plasma concentration[ng/ml]
time [h]
Treatment EDog 1
Dog 2
Dog 3
Dog 4
0
500
1000
1500
2000
2500
3000
0 4 8 12 16 20 24
plasma concentration [ng/ml]
time [h]
Treatment FDog 1
Dog 2
Dog 3
Dog 4
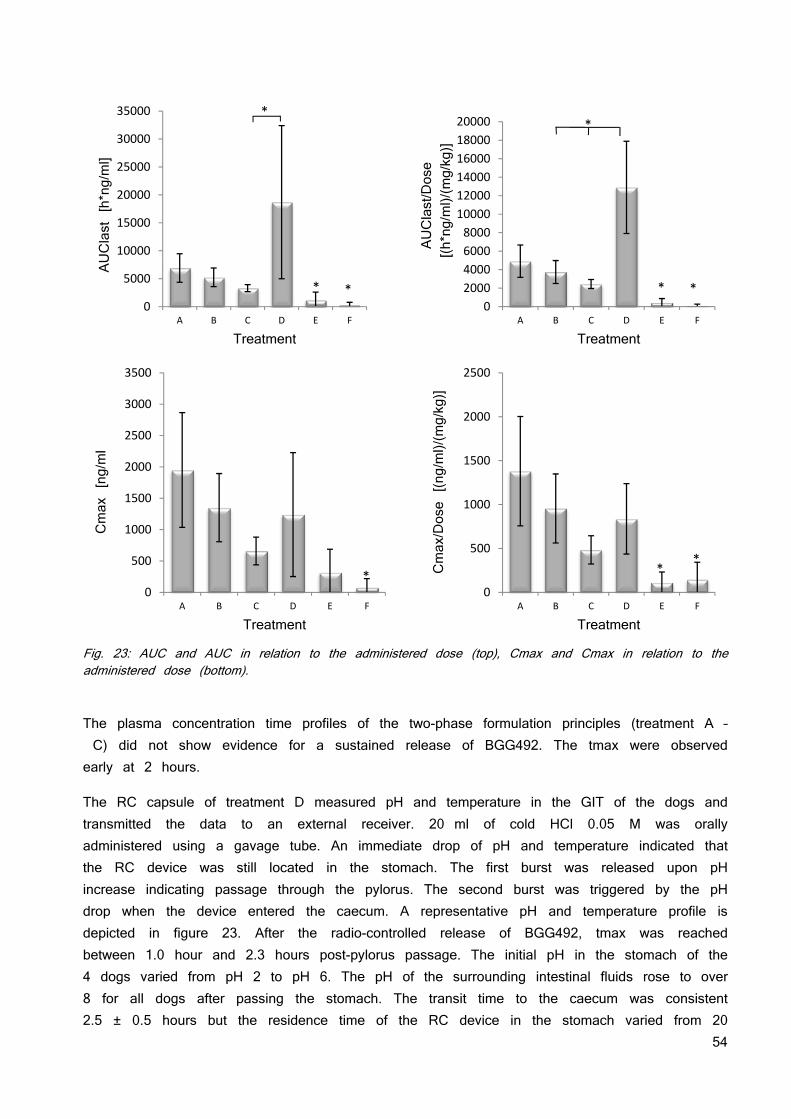
54
Fig. 23: AUC and AUC in relation to the administered dose (top), Cmax and Cmax in relation to the administered dose (bottom).
The plasma concentration time profiles of the two-phase formulation principles (treatment A – C) did not show evidence for a sustained release of BGG492. The tmax were observed early at 2 hours.
The RC capsule of treatment D measured pH and temperature in the GIT of the dogs and transmitted the data to an external receiver. 20 ml of cold HCl 0.05 M was orally administered using a gavage tube. An immediate drop of pH and temperature indicated that the RC device was still located in the stomach. The first burst was released upon pH increase indicating passage through the pylorus. The second burst was triggered by the pH drop when the device entered the caecum. A representative pH and temperature profile is depicted in figure 23. After the radio-controlled release of BGG492, tmax was reached between 1.0 hour and 2.3 hours post-pylorus passage. The initial pH in the stomach of the 4 dogs varied from pH 2 to pH 6. The pH of the surrounding intestinal fluids rose to over 8 for all dogs after passing the stomach. The transit time to the caecum was consistent 2.5 ± 0.5 hours but the residence time of the RC device in the stomach varied from 20
0
5000
10000
15000
20000
25000
30000
35000
A B C D E F
AUClast [h*ng/ml]
Treatment
**
*
0
2000
4000
6000
8000
10000
12000
14000
16000
18000
20000
A B C D E F
AUClast/Dose
[(h*ng/ml)/(mg/kg)]
Treatment
* *
*
0
500
1000
1500
2000
2500
3000
3500
A B C D E F
Cmax [ng/ml
Treatment
*
0
500
1000
1500
2000
2500
A B C D E F
Cmax/Dose [(ng/ml)/(mg/kg)]
Treatment
**
55
minutes to 3 hours although all dogs were fasted overnight. Cmax was 1240 ± 988 ng/ml and the AUClast 18700 ± 13700 h·ng/ml and a bioavailability of 100% was determined. The fact that BGG492 was detected in plasma before the start of the release from the RC device may be explained by premature release of BGG492 by compression of the device reservoir during the pylorus passage. No second maximum was observed after starting the release of the 12 mg. Visual examination of the recovered device showed precipitation of white substance in the outlet channel and brownish liquid entered into the capsules. HPLC analysis of the recovered device reservoir showed that the intended dose was not completely delivered in dog 1 (12 mg were delivered of 15 mg) and dog 4 (7 mg were delivered instead of 15 mg). Following colonic administration of treatment F to dog 2 and Dog 4, part of the formulation was observed in the gavage tube, indicating incomplete dosing. Cmax in plasma was 72.8 ± 145 ng/ml and tmax for the two measurable concentration-time profiles was observed at 1.0 hour post-dose. The AUClast was 90.0 ± 180 h·ng/ml and the average bioavailability was 0.9% It cannot be excluded that part of the dose may have been excreted before absorption. The low systemic exposure observed after colonic administration of 30 mg BGG492 as TBPH salt in pH-matrix (treatment E) and after administration of the nanosuspension (treatment F) suggested a low potential for the absorption of BGG492 from the colon, however; the embedding in a pH-matrix showed better bioavailability. All formulations showed medium to high variability and AUC and Cmax of oral and colonic application differed significantly from each other. This was expected as colonic absorption of this compound was considered to be low based on the decreased bioavailability of all modified release principles in dog but also in human (data not shown) and the general hampered adsorption from the colon due to very limited water presence (82). Treatment A with 48.5% oral BAV indicates that at least part of the delayed release capsule containing 12 mg compound (in oil) out of the complete dose of 15mg was absorbed. As the tmax was not significantly delayed, there might have been no delayed release of the capsule. Treatment B with 37% BAV showed no delayed tmax and lower BAV than treatment A. this might be due to an absorption window (83) or incomplete degradation of the myristic acid which was used as hydrophobizing agent. The high variability of treatment D is presumably due to precipitation of the solution in the RC device reservoir. However, the oral bioavailability was 100% when the recovered compound from the reservoir is considered. As it was unknown when the solution precipitated, it was not possible to relate the PK profile with the absorption region.
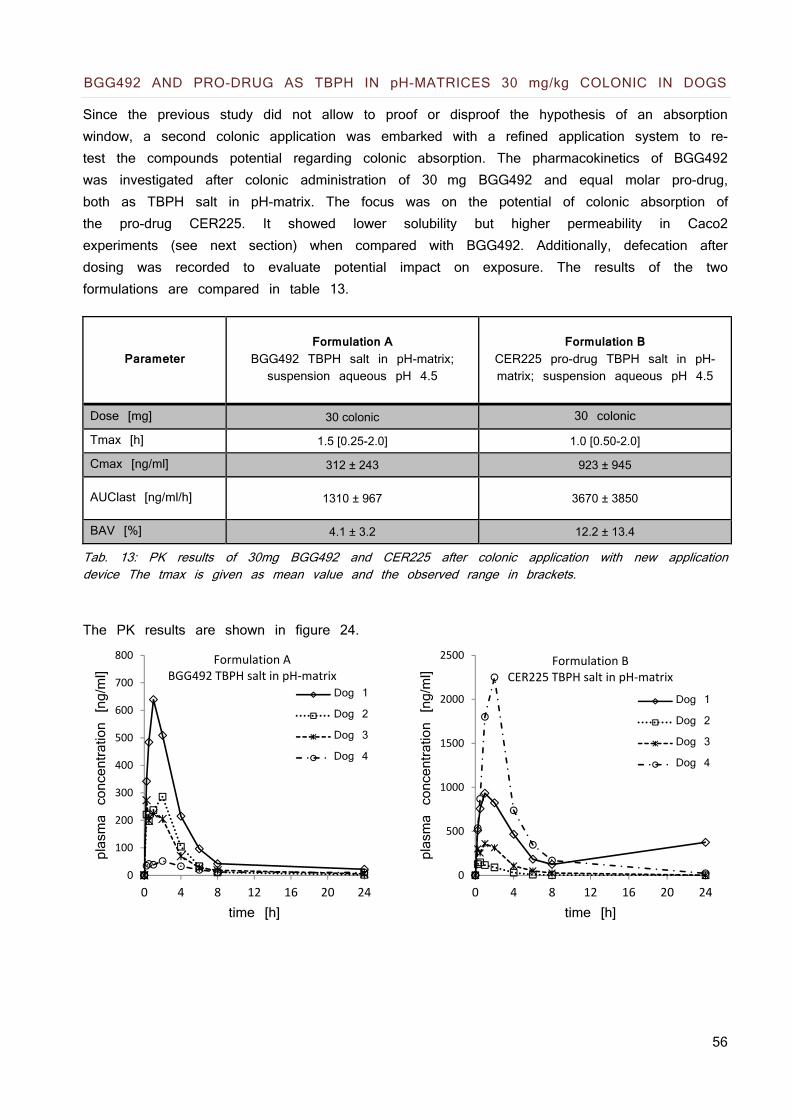
56
BGG492 AND PRO-DRUG AS TBPH IN pH-MATRICES 30 mg/kg COLONIC IN DOGS
Since the previous study did not allow to proof or disproof the hypothesis of an absorption window, a second colonic application was embarked with a refined application system to re-test the compounds potential regarding colonic absorption. The pharmacokinetics of BGG492 was investigated after colonic administration of 30 mg BGG492 and equal molar pro-drug, both as TBPH salt in pH-matrix. The focus was on the potential of colonic absorption of the pro-drug CER225. It showed lower solubility but higher permeability in Caco2 experiments (see next section) when compared with BGG492. Additionally, defecation after dosing was recorded to evaluate potential impact on exposure. The results of the two formulations are compared in table 13.
Parameter
Formulation A
BGG492 TBPH salt in pH-matrix; suspension aqueous pH 4.5
Formulation B
CER225 pro-drug TBPH salt in pH-matrix; suspension aqueous pH 4.5
Dose [mg] 30 colonic 30 colonic
Tmax [h] 1.5 [0.25-2.0] 1.0 [0.50-2.0]
Cmax [ng/ml] 312 ± 243 923 ± 945
AUClast [ng/ml/h] 1310 ± 967 3670 ± 3850
BAV [%] 4.1 ± 3.2 12.2 ± 13.4
Tab. 13: PK results of 30mg BGG492 and CER225 after colonic application with new application device The tmax is given as mean value and the observed range in brackets.
The PK results are shown in figure 24.
0
100
200
300
400
500
600
700
800
0 4 8 12 16 20 24
plasma concentration [ng/ml]
time [h]
Formulation ABGG492 TBPH salt in pH‐matrix
Dog 1
Dog 2
Dog 3
Dog 4
0
500
1000
1500
2000
2500
0 4 8 12 16 20 24
plasma concentration [ng/ml]
time [h]
Formulation BCER225 TBPH salt in pH‐matrix
Dog 1
Dog 2
Dog 3
Dog 4
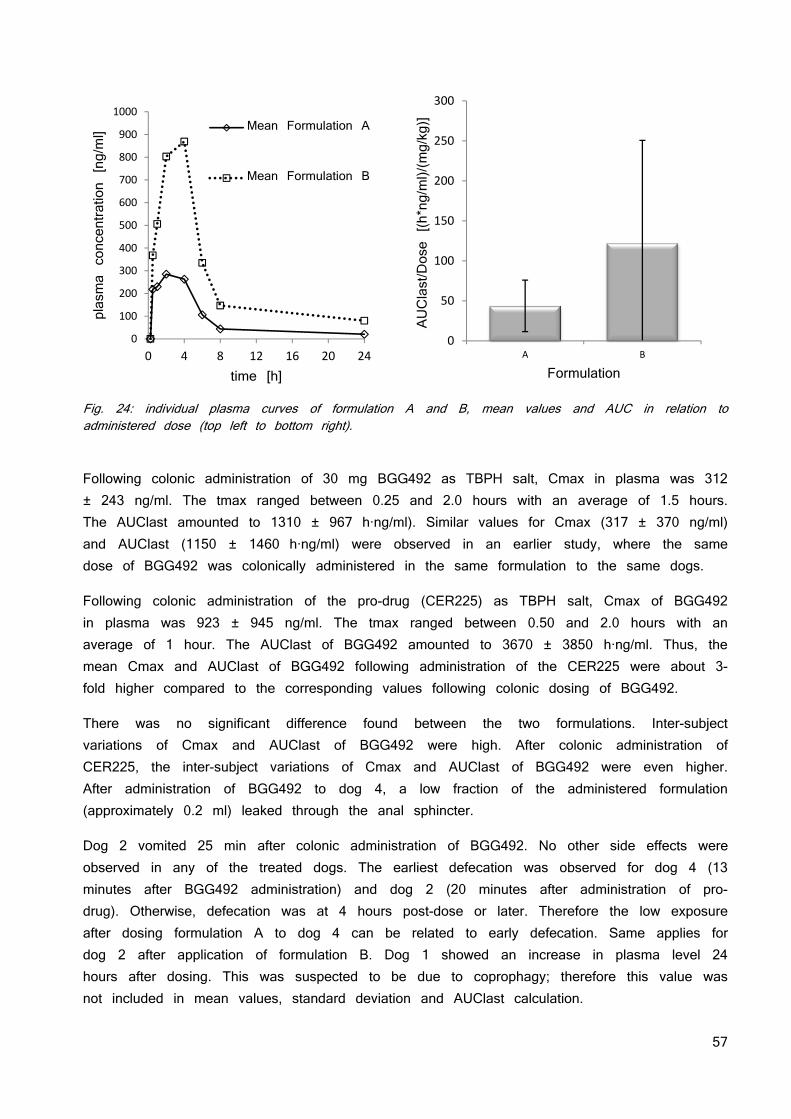
57
Fig. 24: individual plasma curves of formulation A and B, mean values and AUC in relation to administered dose (top left to bottom right).
Following colonic administration of 30 mg BGG492 as TBPH salt, Cmax in plasma was 312 ± 243 ng/ml. The tmax ranged between 0.25 and 2.0 hours with an average of 1.5 hours. The AUClast amounted to 1310 ± 967 h·ng/ml). Similar values for Cmax (317 ± 370 ng/ml) and AUClast (1150 ± 1460 h·ng/ml) were observed in an earlier study, where the same dose of BGG492 was colonically administered in the same formulation to the same dogs.
Following colonic administration of the pro-drug (CER225) as TBPH salt, Cmax of BGG492 in plasma was 923 ± 945 ng/ml. The tmax ranged between 0.50 and 2.0 hours with an average of 1 hour. The AUClast of BGG492 amounted to 3670 ± 3850 h·ng/ml. Thus, the mean Cmax and AUClast of BGG492 following administration of the CER225 were about 3-fold higher compared to the corresponding values following colonic dosing of BGG492.
There was no significant difference found between the two formulations. Inter-subject variations of Cmax and AUClast of BGG492 were high. After colonic administration of CER225, the inter-subject variations of Cmax and AUClast of BGG492 were even higher. After administration of BGG492 to dog 4, a low fraction of the administered formulation (approximately 0.2 ml) leaked through the anal sphincter.
Dog 2 vomited 25 min after colonic administration of BGG492. No other side effects were observed in any of the treated dogs. The earliest defecation was observed for dog 4 (13 minutes after BGG492 administration) and dog 2 (20 minutes after administration of pro-drug). Otherwise, defecation was at 4 hours post-dose or later. Therefore the low exposure after dosing formulation A to dog 4 can be related to early defecation. Same applies for dog 2 after application of formulation B. Dog 1 showed an increase in plasma level 24 hours after dosing. This was suspected to be due to coprophagy; therefore this value was not included in mean values, standard deviation and AUClast calculation.
0
100
200
300
400
500
600
700
800
900
1000
0 4 8 12 16 20 24
plasma concentration [ng/ml]
time [h]
Mean Formulation A
Mean Formulation B
0
50
100
150
200
250
300
A B
AUClast/Dose [(h*ng/ml)/(mg/kg)]
Formulation
58
BGG492 and CER225 permeation in Caco2 model (84)
The Caco2 cell monolayers were characterized before use. All monolayers fulfilled the criteria regarding trans junctional ion flux as demonstrated by TEER values of at least 600 Ω*cm2, paracellular permeability and monolayer tightness as demonstrated by sodium fluorescein transport with mean Papp values lower than 10-7 cm/s (apical to basolateral). Furthermore, the monolayers were morphologically characterized for the location and distribution of cell nuclei through DAPI stain (blue) and tight junctions were labeled by e-cadherin staining. In a first experiment, compound solutions were applied to the apical compartment and resulted in comparable molar amounts found basolaterally over time for the TBPH salt and BGG492 free acid. CER225 transport was significantly higher.
In the second experiment, a suspension of the drug was used in the apical compartment instead of the drug solution applied in the previous set-up. The concentration in the apical chamber of the free acid was approximately three times higher than the concentration observed for CER225 and four times lower than the concentration of the TBPH salt. The molar drug amounts as analyzed within the basolateral compartment over time were significantly and typically 5 times higher for the TBPH as compared to BGG492 free acid or the pro-drug. Detailed discussion of the data can be found in the original literature (84).
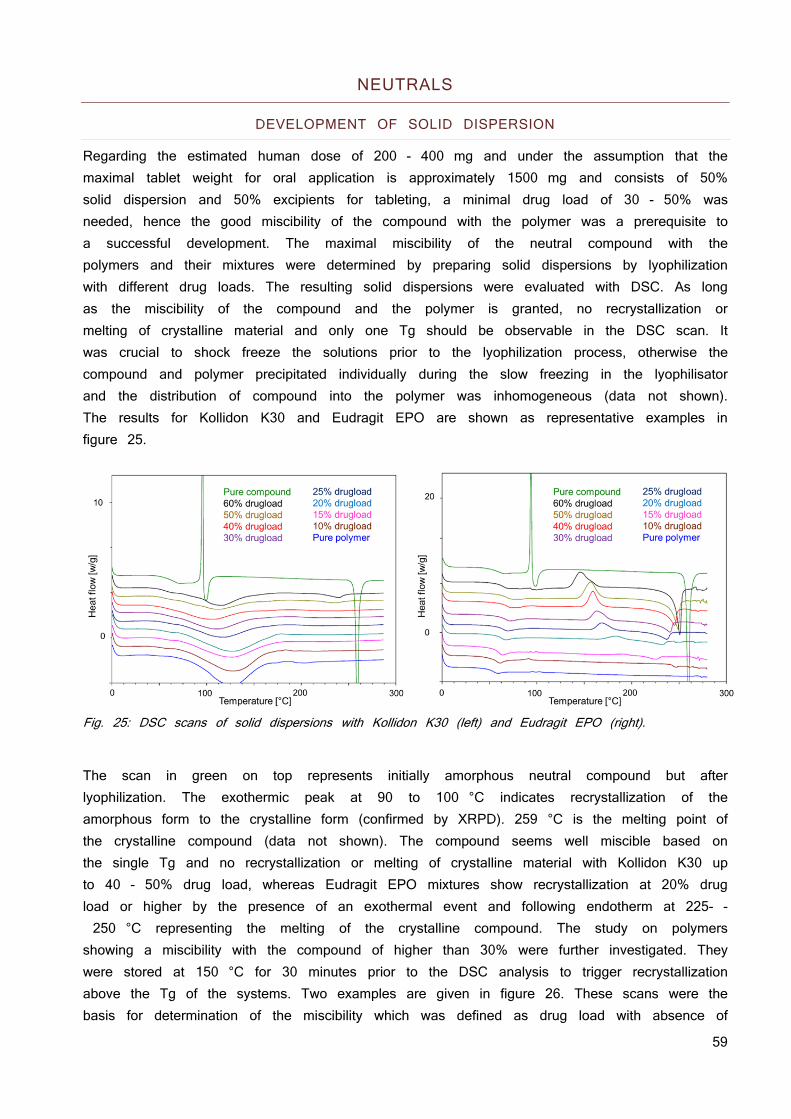
59
NEUTRALS
DEVELOPMENT OF SOLID DISPERSION
Regarding the estimated human dose of 200 - 400 mg and under the assumption that the maximal tablet weight for oral application is approximately 1500 mg and consists of 50% solid dispersion and 50% excipients for tableting, a minimal drug load of 30 - 50% was needed, hence the good miscibility of the compound with the polymer was a prerequisite to a successful development. The maximal miscibility of the neutral compound with the polymers and their mixtures were determined by preparing solid dispersions by lyophilization with different drug loads. The resulting solid dispersions were evaluated with DSC. As long as the miscibility of the compound and the polymer is granted, no recrystallization or melting of crystalline material and only one Tg should be observable in the DSC scan. It was crucial to shock freeze the solutions prior to the lyophilization process, otherwise the compound and polymer precipitated individually during the slow freezing in the lyophilisator and the distribution of compound into the polymer was inhomogeneous (data not shown). The results for Kollidon K30 and Eudragit EPO are shown as representative examples in figure 25.
Fig. 25: DSC scans of solid dispersions with Kollidon K30 (left) and Eudragit EPO (right).
The scan in green on top represents initially amorphous neutral compound but after lyophilization. The exothermic peak at 90 to 100 °C indicates recrystallization of the amorphous form to the crystalline form (confirmed by XRPD). 259 °C is the melting point of the crystalline compound (data not shown). The compound seems well miscible based on the single Tg and no recrystallization or melting of crystalline material with Kollidon K30 up to 40 - 50% drug load, whereas Eudragit EPO mixtures show recrystallization at 20% drug load or higher by the presence of an exothermal event and following endotherm at 225- - 250 °C representing the melting of the crystalline compound. The study on polymers showing a miscibility with the compound of higher than 30% were further investigated. They were stored at 150 °C for 30 minutes prior to the DSC analysis to trigger recrystallization above the Tg of the systems. Two examples are given in figure 26. These scans were the basis for determination of the miscibility which was defined as drug load with absence of
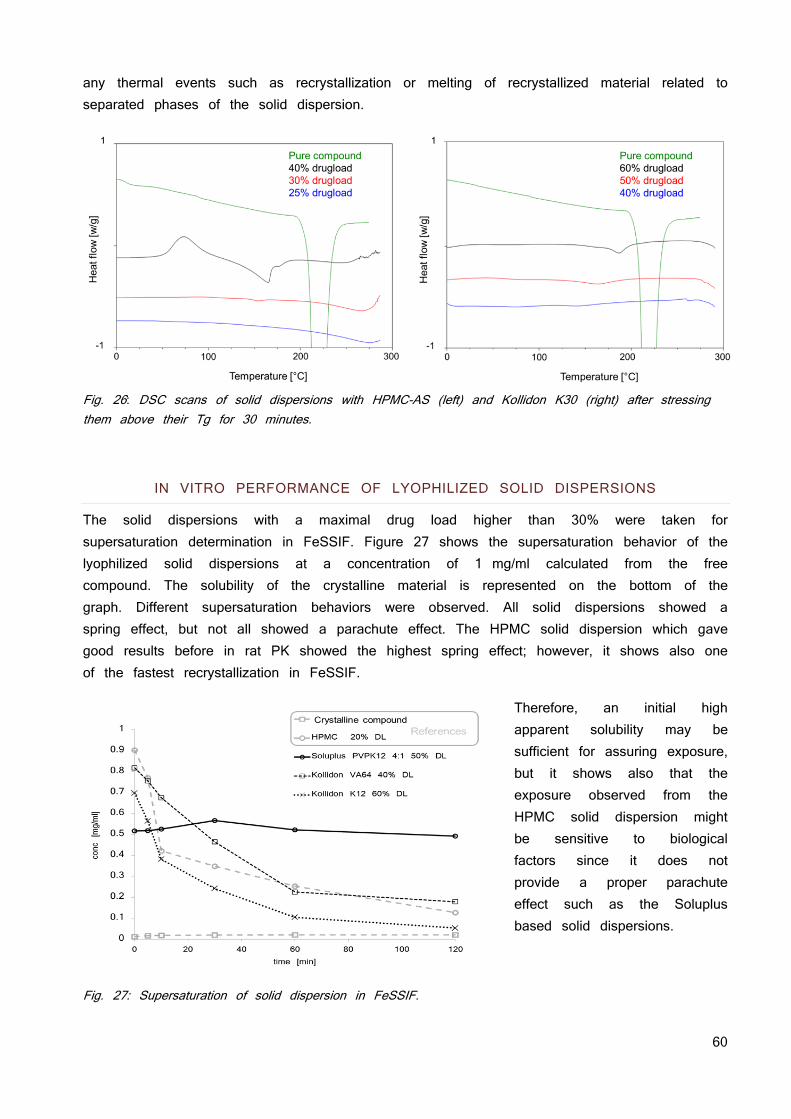
60
any thermal events such as recrystallization or melting of recrystallized material related to separated phases of the solid dispersion.
Fig. 26: DSC scans of solid dispersions with HPMC-AS (left) and Kollidon K30 (right) after stressing them above their Tg for 30 minutes.
IN VITRO PERFORMANCE OF LYOPHILIZED SOLID DISPERSIONS
The solid dispersions with a maximal drug load higher than 30% were taken for supersaturation determination in FeSSIF. Figure 27 shows the supersaturation behavior of the lyophilized solid dispersions at a concentration of 1 mg/ml calculated from the free compound. The solubility of the crystalline material is represented on the bottom of the graph. Different supersaturation behaviors were observed. All solid dispersions showed a spring effect, but not all showed a parachute effect. The HPMC solid dispersion which gave good results before in rat PK showed the highest spring effect; however, it shows also one of the fastest recrystallization in FeSSIF.
Therefore, an initial high apparent solubility may be sufficient for assuring exposure, but it shows also that the exposure observed from the HPMC solid dispersion might be sensitive to biological factors since it does not provide a proper parachute effect such as the Soluplus based solid dispersions.
Fig. 27: Supersaturation of solid dispersion in FeSSIF.
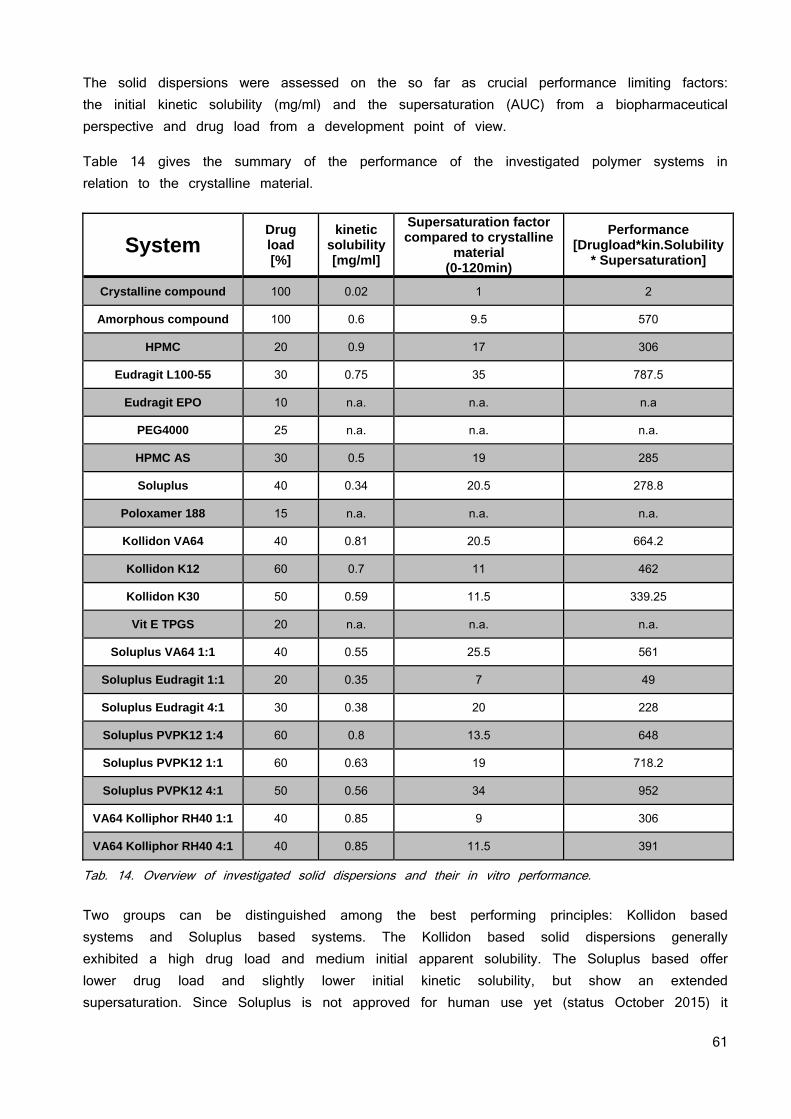
61
The solid dispersions were assessed on the so far as crucial performance limiting factors: the initial kinetic solubility (mg/ml) and the supersaturation (AUC) from a biopharmaceutical perspective and drug load from a development point of view.
Table 14 gives the summary of the performance of the investigated polymer systems in relation to the crystalline material.
Tab. 14. Overview of investigated solid dispersions and their in vitro performance. Two groups can be distinguished among the best performing principles: Kollidon based systems and Soluplus based systems. The Kollidon based solid dispersions generally exhibited a high drug load and medium initial apparent solubility. The Soluplus based offer lower drug load and slightly lower initial kinetic solubility, but show an extended supersaturation. Since Soluplus is not approved for human use yet (status October 2015) it
System Drug load [%]
kinetic solubility [mg/ml]
Supersaturation factor compared to crystalline
material (0-120min)
Performance [Drugload*kin.Solubility
* Supersaturation]
Crystalline compound 100 0.02 1 2
Amorphous compound 100 0.6 9.5 570
HPMC 20 0.9 17 306
Eudragit L100-55 30 0.75 35 787.5
Eudragit EPO 10 n.a. n.a. n.a
PEG4000 25 n.a. n.a. n.a.
HPMC AS 30 0.5 19 285
Soluplus 40 0.34 20.5 278.8
Poloxamer 188 15 n.a. n.a. n.a.
Kollidon VA64 40 0.81 20.5 664.2
Kollidon K12 60 0.7 11 462
Kollidon K30 50 0.59 11.5 339.25
Vit E TPGS 20 n.a. n.a. n.a.
Soluplus VA64 1:1 40 0.55 25.5 561
Soluplus Eudragit 1:1 20 0.35 7 49
Soluplus Eudragit 4:1 30 0.38 20 228
Soluplus PVPK12 1:4 60 0.8 13.5 648
Soluplus PVPK12 1:1 60 0.63 19 718.2
Soluplus PVPK12 4:1 50 0.56 34 952
VA64 Kolliphor RH40 1:1 40 0.85 9 306
VA64 Kolliphor RH40 4:1 40 0.85 11.5 391
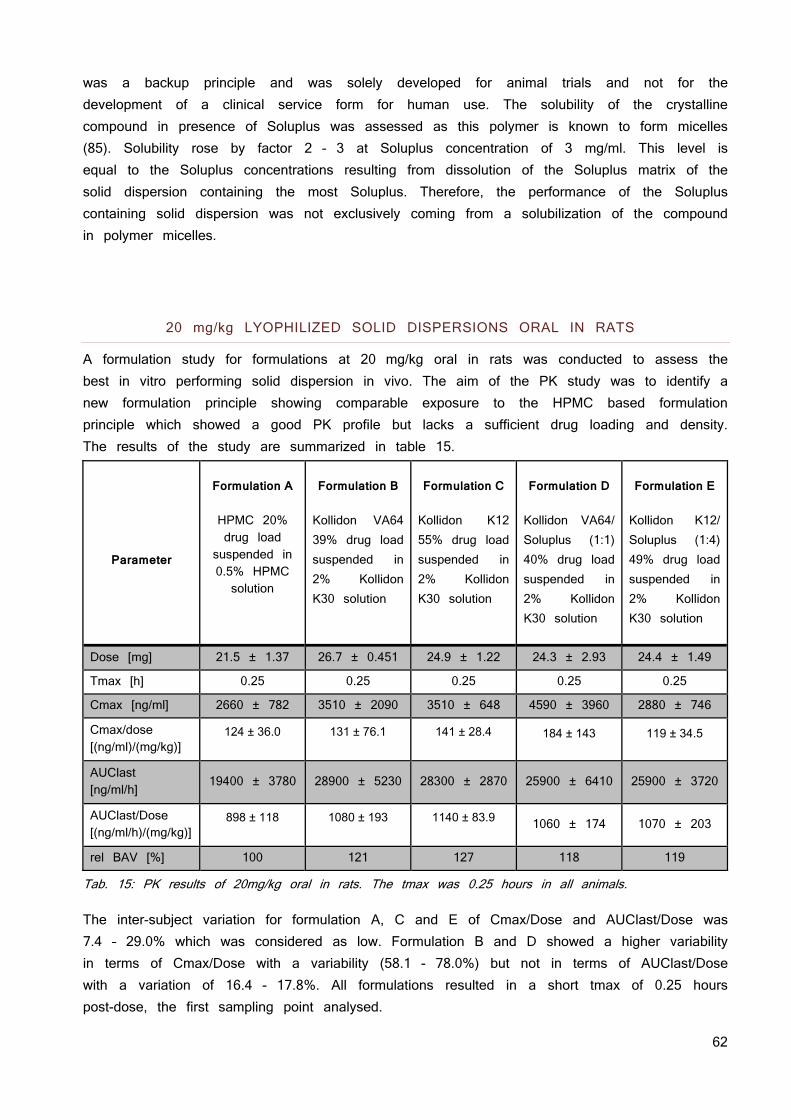
62
was a backup principle and was solely developed for animal trials and not for the development of a clinical service form for human use. The solubility of the crystalline compound in presence of Soluplus was assessed as this polymer is known to form micelles (85). Solubility rose by factor 2 - 3 at Soluplus concentration of 3 mg/ml. This level is equal to the Soluplus concentrations resulting from dissolution of the Soluplus matrix of the solid dispersion containing the most Soluplus. Therefore, the performance of the Soluplus containing solid dispersion was not exclusively coming from a solubilization of the compound in polymer micelles.
20 mg/kg LYOPHILIZED SOLID DISPERSIONS ORAL IN RATS
A formulation study for formulations at 20 mg/kg oral in rats was conducted to assess the best in vitro performing solid dispersion in vivo. The aim of the PK study was to identify a new formulation principle showing comparable exposure to the HPMC based formulation principle which showed a good PK profile but lacks a sufficient drug loading and density. The results of the study are summarized in table 15.
Parameter
Formulation A
HPMC 20% drug load
suspended in 0.5% HPMC solution
Formulation B
Kollidon VA64 39% drug load suspended in 2% Kollidon K30 solution
Formulation C
Kollidon K12 55% drug load suspended in 2% Kollidon K30 solution
Formulation D
Kollidon VA64/ Soluplus (1:1) 40% drug load suspended in 2% Kollidon K30 solution
Formulation E
Kollidon K12/ Soluplus (1:4) 49% drug load suspended in 2% Kollidon K30 solution
Dose [mg] 21.5 ± 1.37 26.7 ± 0.451 24.9 ± 1.22 24.3 ± 2.93 24.4 ± 1.49
Tmax [h] 0.25 0.25 0.25 0.25 0.25
Cmax [ng/ml] 2660 ± 782 3510 ± 2090 3510 ± 648 4590 ± 3960 2880 ± 746
Cmax/dose [(ng/ml)/(mg/kg)]
124 ± 36.0
131 ± 76.1
141 ± 28.4
184 ± 143
119 ± 34.5
AUClast [ng/ml/h]
19400 ± 3780 28900 ± 5230 28300 ± 2870 25900 ± 6410 25900 ± 3720
AUClast/Dose [(ng/ml/h)/(mg/kg)]
898 ± 118
1080 ± 193
1140 ± 83.9
1060 ± 174 1070 ± 203
rel BAV [%] 100 121 127 118 119
Tab. 15: PK results of 20mg/kg oral in rats. The tmax was 0.25 hours in all animals.
The inter-subject variation for formulation A, C and E of Cmax/Dose and AUClast/Dose was 7.4 – 29.0% which was considered as low. Formulation B and D showed a higher variability in terms of Cmax/Dose with a variability (58.1 - 78.0%) but not in terms of AUClast/Dose with a variation of 16.4 - 17.8%. All formulations resulted in a short tmax of 0.25 hours post-dose, the first sampling point analysed.
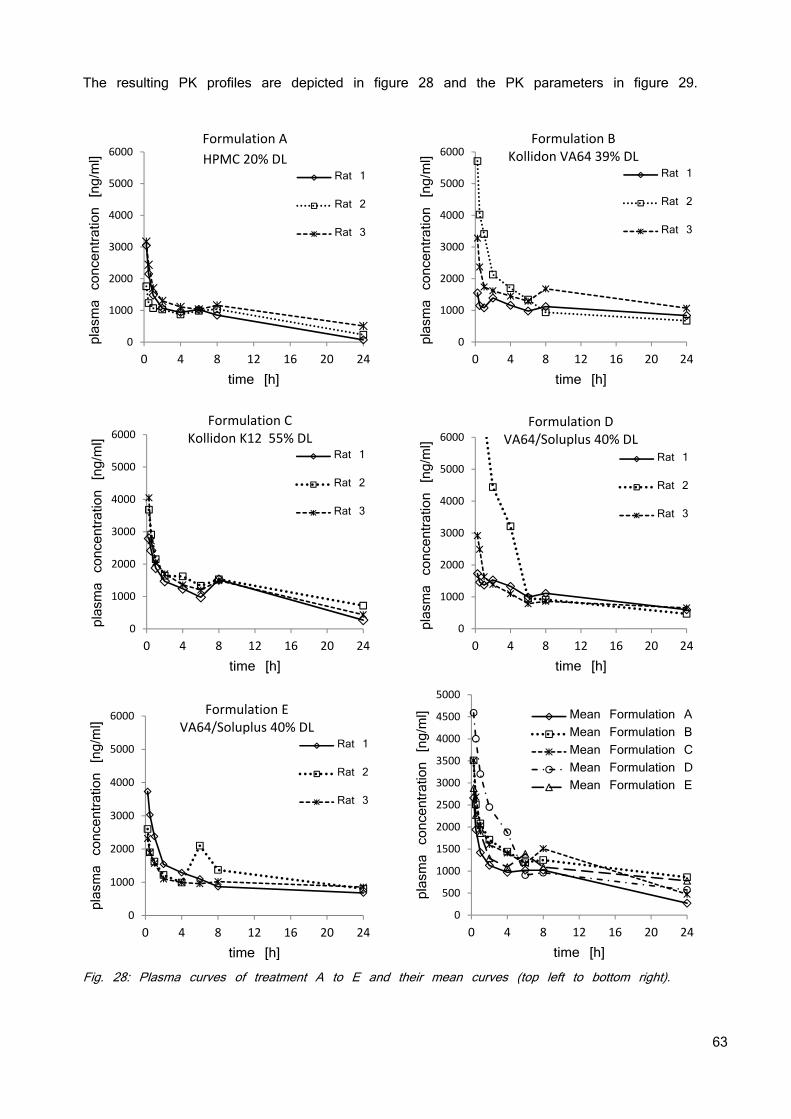
63
The resulting PK profiles are depicted in figure 28 and the PK parameters in figure 29.
Fig. 28: Plasma curves of treatment A to E and their mean curves (top left to bottom right).
0
1000
2000
3000
4000
5000
6000
0 4 8 12 16 20 24
plasma concentration [ng/ml]
time [h]
Rat 1
Rat 2
Rat 3
0
1000
2000
3000
4000
5000
6000
0 4 8 12 16 20 24
plasma concentration [ng/ml]
time [h]
Rat 1
Rat 2
Rat 3
Formulation B Kollidon VA64 39% DL
0
1000
2000
3000
4000
5000
6000
0 4 8 12 16 20 24
plasma concentration [ng/ml]
time [h]
Rat 1
Rat 2
Rat 3
Formulation C Kollidon K12 55% DL
0
1000
2000
3000
4000
5000
6000
0 4 8 12 16 20 24
plasma concentration [ng/ml]
time [h]
Rat 1
Rat 2
Rat 3
Formulation D VA64/Soluplus 40% DL
0
1000
2000
3000
4000
5000
6000
0 4 8 12 16 20 24
plasma concentration [ng/ml]
time [h]
Rat 1
Rat 2
Rat 3
Formulation E VA64/Soluplus 40% DL
0
500
1000
1500
2000
2500
3000
3500
4000
4500
5000
0 4 8 12 16 20 24
plasma concentration [ng/ml]
time [h]
Mean Formulation AMean Formulation BMean Formulation CMean Formulation DMean Formulation E
Formulation A HPMC 20% DL
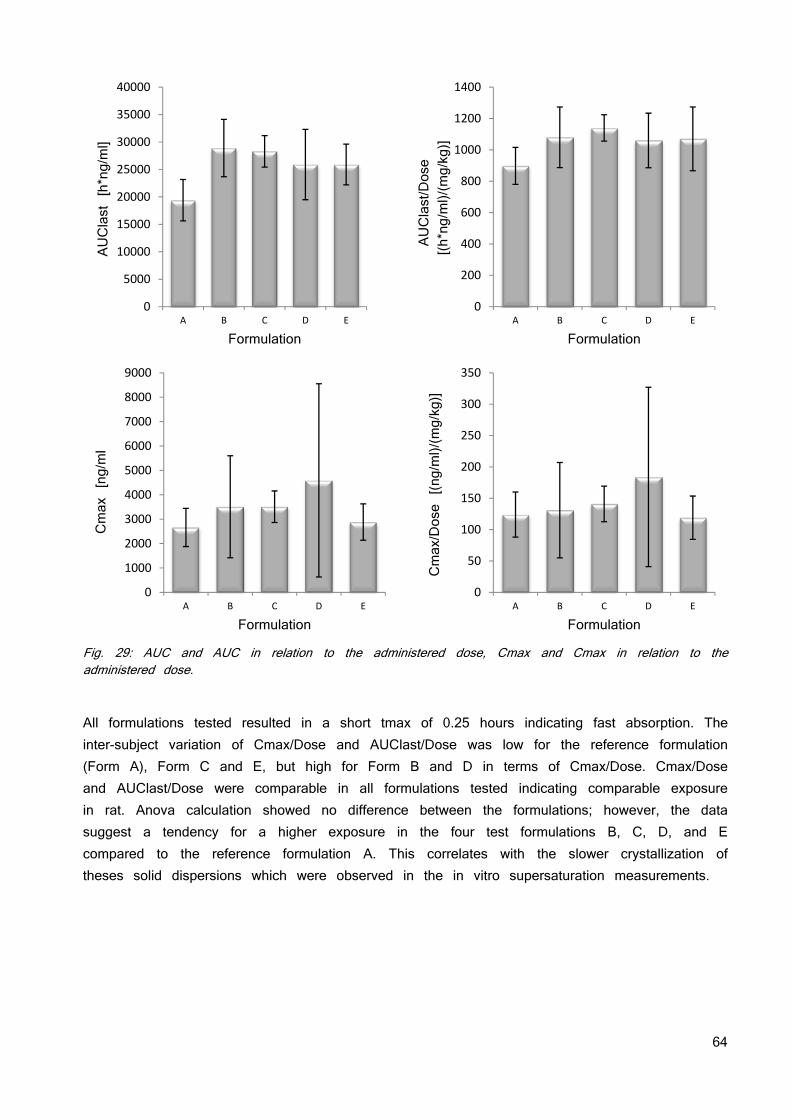
64
Fig. 29: AUC and AUC in relation to the administered dose, Cmax and Cmax in relation to the administered dose.
All formulations tested resulted in a short tmax of 0.25 hours indicating fast absorption. The inter-subject variation of Cmax/Dose and AUClast/Dose was low for the reference formulation (Form A), Form C and E, but high for Form B and D in terms of Cmax/Dose. Cmax/Dose and AUClast/Dose were comparable in all formulations tested indicating comparable exposure in rat. Anova calculation showed no difference between the formulations; however, the data suggest a tendency for a higher exposure in the four test formulations B, C, D, and E compared to the reference formulation A. This correlates with the slower crystallization of theses solid dispersions which were observed in the in vitro supersaturation measurements.
0
5000
10000
15000
20000
25000
30000
35000
40000
A B C D E
AUClast [h*ng/ml]
Formulation
0
200
400
600
800
1000
1200
1400
A B C D E
AUClast/Dose
[(h*ng/ml)/(mg/kg)]
Formulation
0
1000
2000
3000
4000
5000
6000
7000
8000
9000
A B C D E
Cmax [ng/ml
Formulation
0
50
100
150
200
250
300
350
A B C D E
Cmax/Dose [(ng/ml)/(mg/kg)]
Formulation
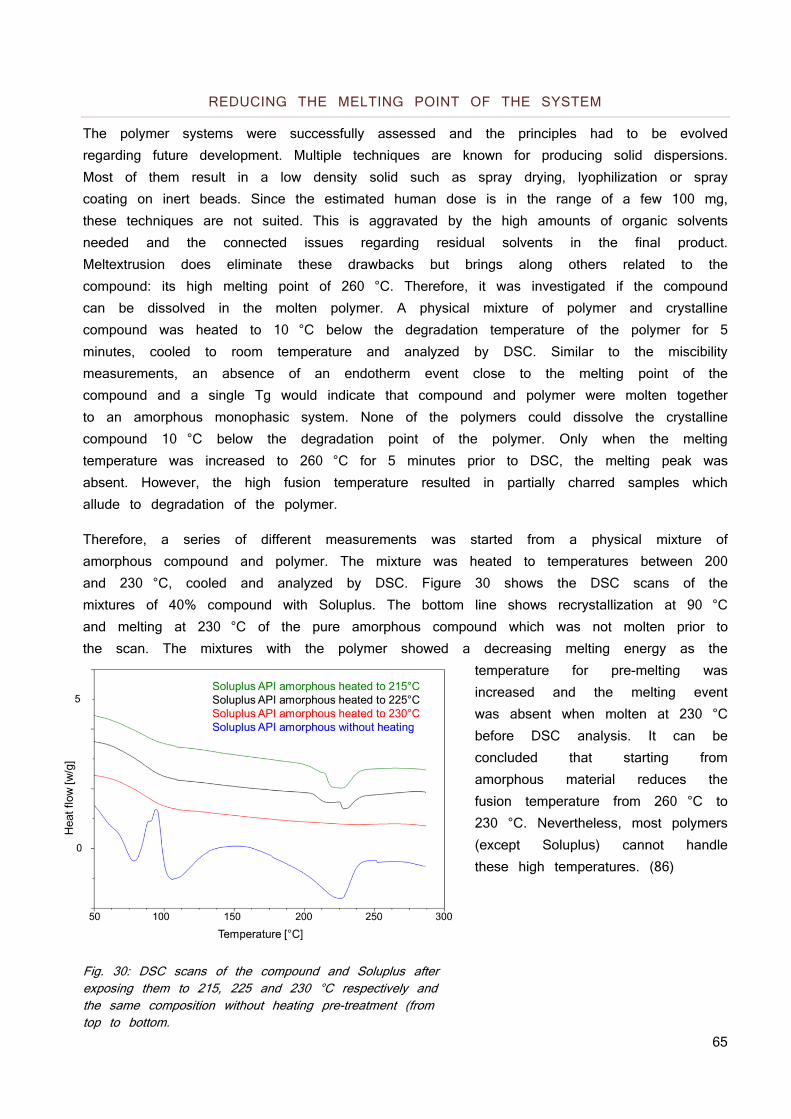
65
REDUCING THE MELTING POINT OF THE SYSTEM
The polymer systems were successfully assessed and the principles had to be evolved regarding future development. Multiple techniques are known for producing solid dispersions. Most of them result in a low density solid such as spray drying, lyophilization or spray coating on inert beads. Since the estimated human dose is in the range of a few 100 mg, these techniques are not suited. This is aggravated by the high amounts of organic solvents needed and the connected issues regarding residual solvents in the final product. Meltextrusion does eliminate these drawbacks but brings along others related to the compound: its high melting point of 260 °C. Therefore, it was investigated if the compound can be dissolved in the molten polymer. A physical mixture of polymer and crystalline compound was heated to 10 °C below the degradation temperature of the polymer for 5 minutes, cooled to room temperature and analyzed by DSC. Similar to the miscibility measurements, an absence of an endotherm event close to the melting point of the compound and a single Tg would indicate that compound and polymer were molten together to an amorphous monophasic system. None of the polymers could dissolve the crystalline compound 10 °C below the degradation point of the polymer. Only when the melting temperature was increased to 260 °C for 5 minutes prior to DSC, the melting peak was absent. However, the high fusion temperature resulted in partially charred samples which allude to degradation of the polymer.
Therefore, a series of different measurements was started from a physical mixture of amorphous compound and polymer. The mixture was heated to temperatures between 200 and 230 °C, cooled and analyzed by DSC. Figure 30 shows the DSC scans of the mixtures of 40% compound with Soluplus. The bottom line shows recrystallization at 90 °C and melting at 230 °C of the pure amorphous compound which was not molten prior to the scan. The mixtures with the polymer showed a decreasing melting energy as the
temperature for pre-melting was increased and the melting event was absent when molten at 230 °C before DSC analysis. It can be concluded that starting from amorphous material reduces the fusion temperature from 260 °C to 230 °C. Nevertheless, most polymers (except Soluplus) cannot handle these high temperatures. (86)
Fig. 30: DSC scans of the compound and Soluplus after exposing them to 215, 225 and 230 °C respectively and the same composition without heating pre-treatment (from top to bottom.
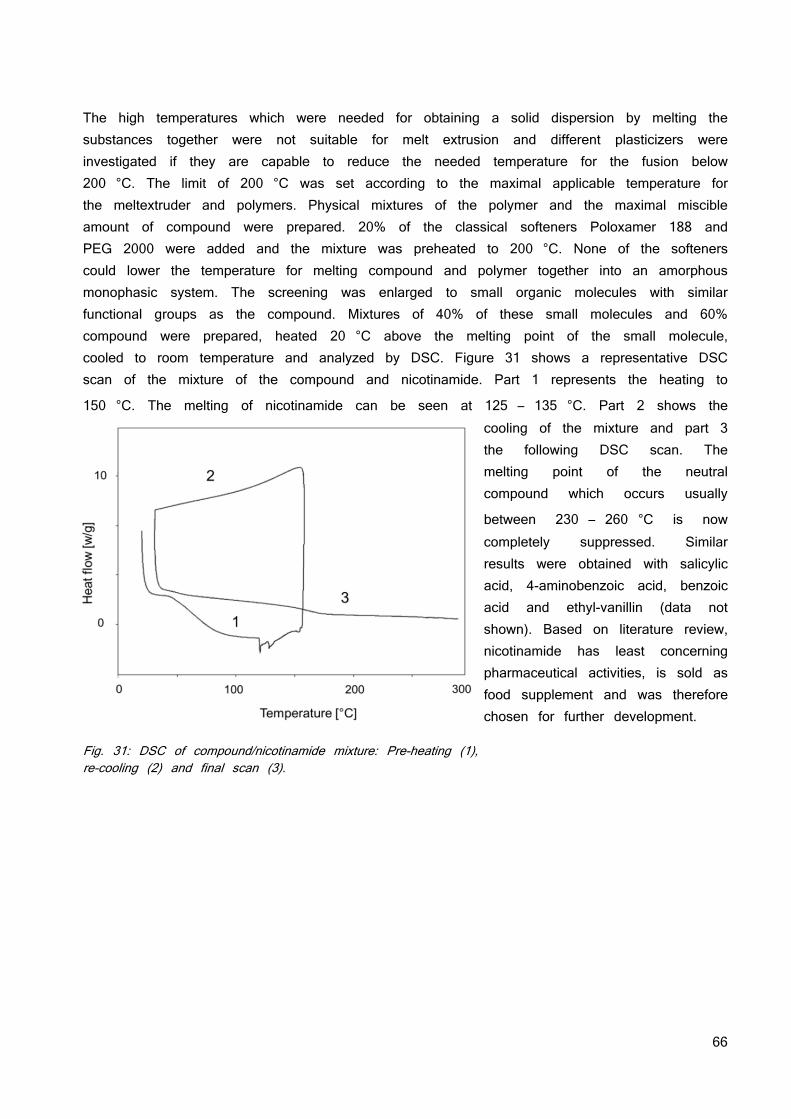
66
The high temperatures which were needed for obtaining a solid dispersion by melting the substances together were not suitable for melt extrusion and different plasticizers were investigated if they are capable to reduce the needed temperature for the fusion below 200 °C. The limit of 200 °C was set according to the maximal applicable temperature for the meltextruder and polymers. Physical mixtures of the polymer and the maximal miscible amount of compound were prepared. 20% of the classical softeners Poloxamer 188 and PEG 2000 were added and the mixture was preheated to 200 °C. None of the softeners could lower the temperature for melting compound and polymer together into an amorphous monophasic system. The screening was enlarged to small organic molecules with similar functional groups as the compound. Mixtures of 40% of these small molecules and 60% compound were prepared, heated 20 °C above the melting point of the small molecule, cooled to room temperature and analyzed by DSC. Figure 31 shows a representative DSC scan of the mixture of the compound and nicotinamide. Part 1 represents the heating to
150 °C. The melting of nicotinamide can be seen at 125 – 135 °C. Part 2 shows the cooling of the mixture and part 3 the following DSC scan. The melting point of the neutral compound which occurs usually
between 230 – 260 °C is now completely suppressed. Similar results were obtained with salicylic acid, 4-aminobenzoic acid, benzoic acid and ethyl-vanillin (data not shown). Based on literature review, nicotinamide has least concerning pharmaceutical activities, is sold as food supplement and was therefore chosen for further development.
Fig. 31: DSC of compound/nicotinamide mixture: Pre-heating (1), re-cooling (2) and final scan (3).
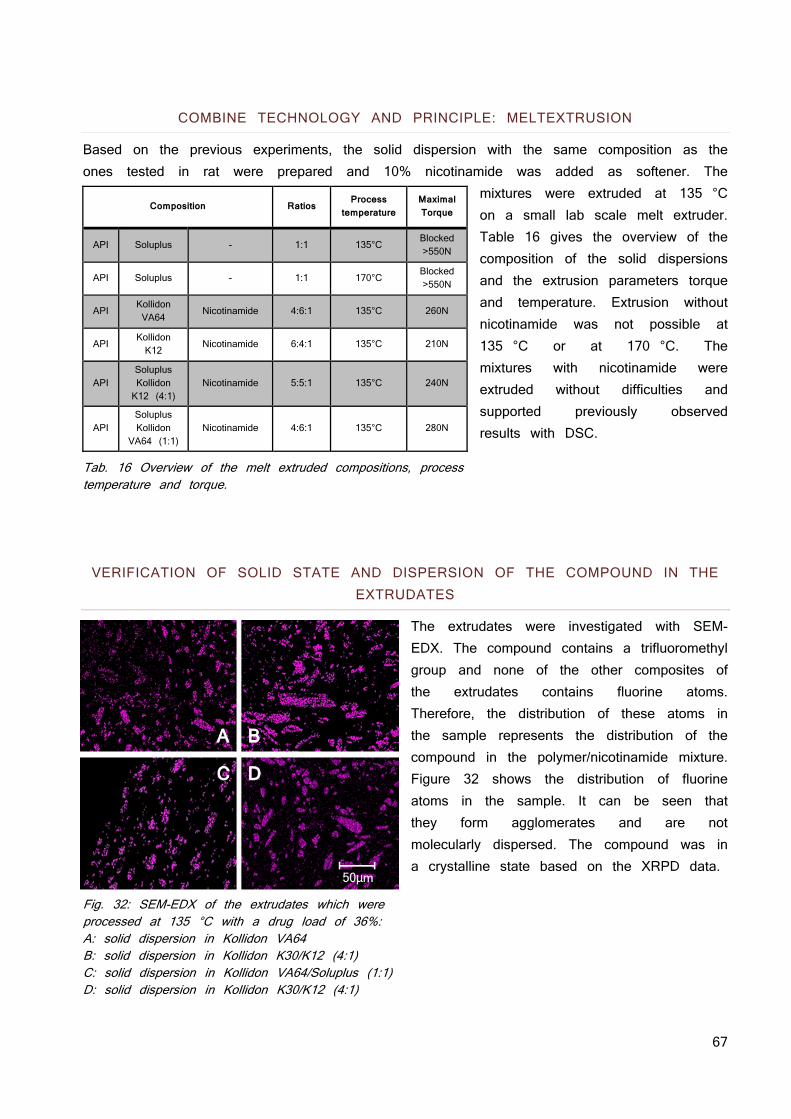
67
COMBINE TECHNOLOGY AND PRINCIPLE: MELTEXTRUSION
Based on the previous experiments, the solid dispersion with the same composition as the ones tested in rat were prepared and 10% nicotinamide was added as softener. The
mixtures were extruded at 135 °C on a small lab scale melt extruder. Table 16 gives the overview of the composition of the solid dispersions and the extrusion parameters torque and temperature. Extrusion without nicotinamide was not possible at 135 °C or at 170 °C. The mixtures with nicotinamide were extruded without difficulties and supported previously observed results with DSC.
Tab. 16 Overview of the melt extruded compositions, process temperature and torque.
VERIFICATION OF SOLID STATE AND DISPERSION OF THE COMPOUND IN THE EXTRUDATES
The extrudates were investigated with SEM-EDX. The compound contains a trifluoromethyl group and none of the other composites of the extrudates contains fluorine atoms. Therefore, the distribution of these atoms in the sample represents the distribution of the compound in the polymer/nicotinamide mixture. Figure 32 shows the distribution of fluorine atoms in the sample. It can be seen that they form agglomerates and are not molecularly dispersed. The compound was in a crystalline state based on the XRPD data.
Fig. 32: SEM-EDX of the extrudates which were processed at 135 °C with a drug load of 36%: A: solid dispersion in Kollidon VA64 B: solid dispersion in Kollidon K30/K12 (4:1) C: solid dispersion in Kollidon VA64/Soluplus (1:1) D: solid dispersion in Kollidon K30/K12 (4:1)
Composition Ratios Process
temperature
Maximal Torque
API Soluplus - 1:1 135°C Blocked
>550N
API Soluplus - 1:1 170°C Blocked
>550N
API Kollidon VA64
Nicotinamide 4:6:1 135°C 260N
API Kollidon K12
Nicotinamide 6:4:1 135°C 210N
API Soluplus Kollidon K12 (4:1)
Nicotinamide 5:5:1 135°C 240N
API Soluplus Kollidon
VA64 (1:1) Nicotinamide 4:6:1 135°C 280N
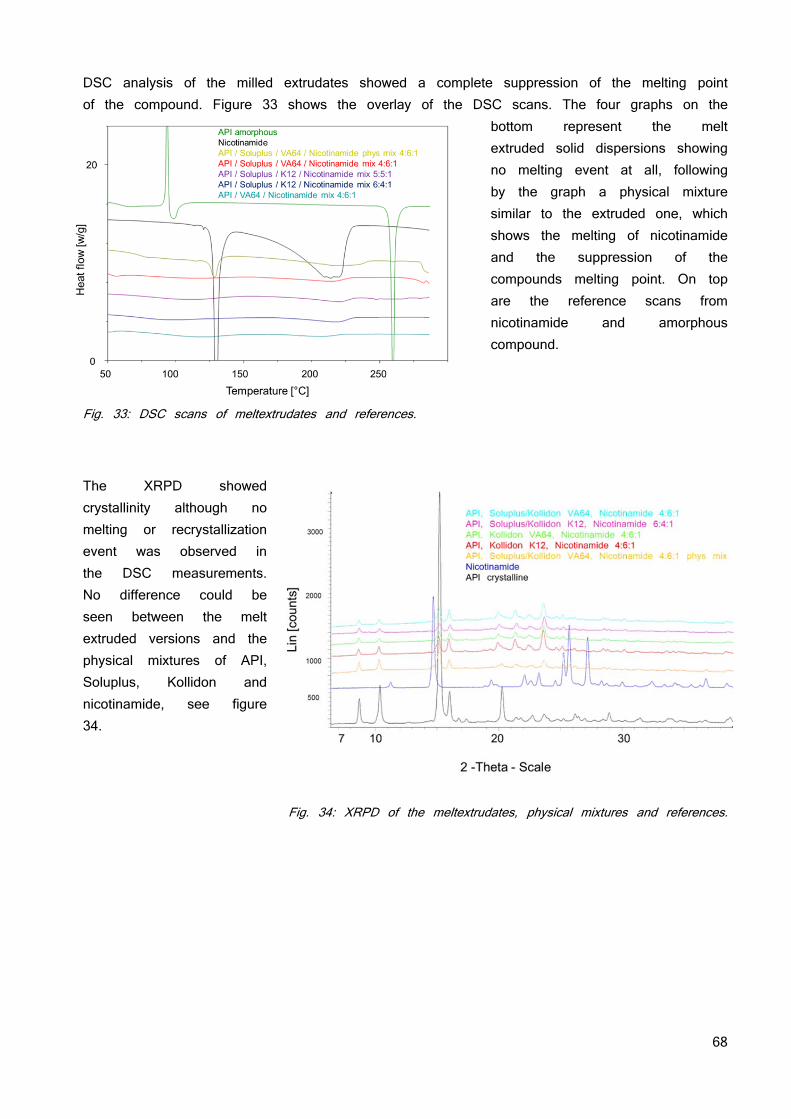
68
DSC analysis of the milled extrudates showed a complete suppression of the melting point of the compound. Figure 33 shows the overlay of the DSC scans. The four graphs on the
bottom represent the melt extruded solid dispersions showing no melting event at all, following by the graph a physical mixture similar to the extruded one, which shows the melting of nicotinamide and the suppression of the compounds melting point. On top are the reference scans from nicotinamide and amorphous compound.
Fig. 33: DSC scans of meltextrudates and references.
The XRPD showed crystallinity although no melting or recrystallization event was observed in the DSC measurements. No difference could be seen between the melt extruded versions and the physical mixtures of API, Soluplus, Kollidon and nicotinamide, see figure 34.
Fig. 34: XRPD of the meltextrudates, physical mixtures and references.
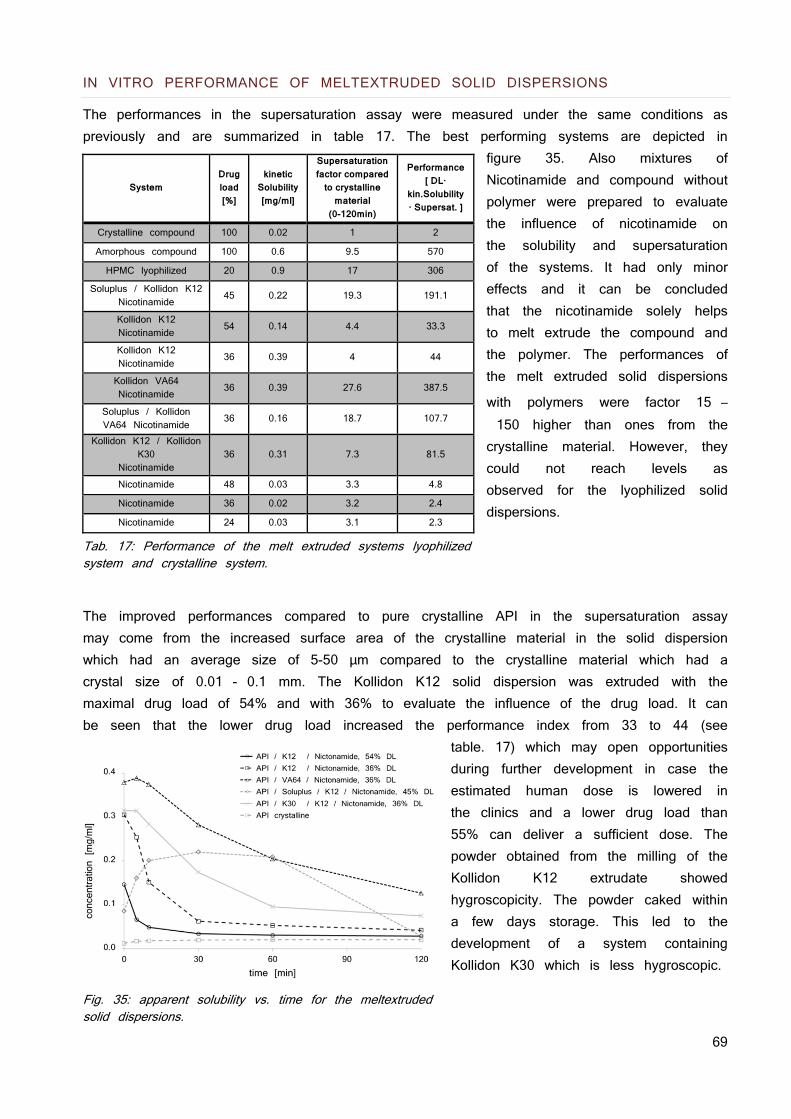
69
IN VITRO PERFORMANCE OF MELTEXTRUDED SOLID DISPERSIONS
The performances in the supersaturation assay were measured under the same conditions as previously and are summarized in table 17. The best performing systems are depicted in
figure 35. Also mixtures of Nicotinamide and compound without polymer were prepared to evaluate the influence of nicotinamide on the solubility and supersaturation of the systems. It had only minor effects and it can be concluded that the nicotinamide solely helps to melt extrude the compound and the polymer. The performances of the melt extruded solid dispersions
with polymers were factor 15 – 150 higher than ones from the crystalline material. However, they could not reach levels as observed for the lyophilized solid dispersions.
Tab. 17: Performance of the melt extruded systems lyophilized system and crystalline system.
The improved performances compared to pure crystalline API in the supersaturation assay may come from the increased surface area of the crystalline material in the solid dispersion which had an average size of 5-50 μm compared to the crystalline material which had a crystal size of 0.01 - 0.1 mm. The Kollidon K12 solid dispersion was extruded with the maximal drug load of 54% and with 36% to evaluate the influence of the drug load. It can be seen that the lower drug load increased the performance index from 33 to 44 (see
table. 17) which may open opportunities during further development in case the estimated human dose is lowered in the clinics and a lower drug load than 55% can deliver a sufficient dose. The powder obtained from the milling of the Kollidon K12 extrudate showed hygroscopicity. The powder caked within a few days storage. This led to the development of a system containing Kollidon K30 which is less hygroscopic.
Fig. 35: apparent solubility vs. time for the meltextruded solid dispersions.
System Drug load [%]
kinetic Solubility [mg/ml]
Supersaturation factor compared
to crystalline material
(0-120min)
Performance [ DL·
kin.Solubility · Supersat. ]
Crystalline compound 100 0.02 1 2
Amorphous compound 100 0.6 9.5 570
HPMC lyophilized 20 0.9 17 306
Soluplus / Kollidon K12 Nicotinamide 45 0.22 19.3 191.1
Kollidon K12 Nicotinamide 54 0.14 4.4 33.3
Kollidon K12 Nicotinamide 36 0.39 4 44
Kollidon VA64 Nicotinamide 36 0.39 27.6 387.5
Soluplus / Kollidon VA64 Nicotinamide 36 0.16 18.7 107.7
Kollidon K12 / Kollidon K30
Nicotinamide 36 0.31 7.3 81.5
Nicotinamide 48 0.03 3.3 4.8
Nicotinamide 36 0.02 3.2 2.4
Nicotinamide 24 0.03 3.1 2.3
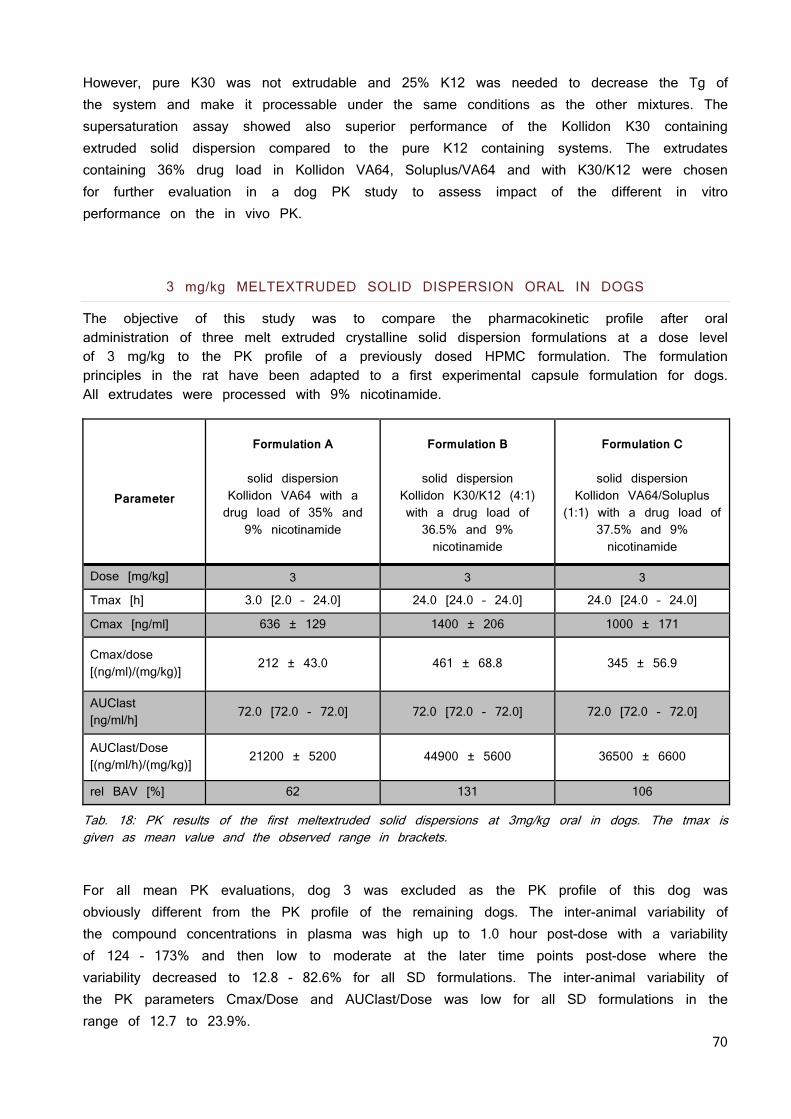
70
However, pure K30 was not extrudable and 25% K12 was needed to decrease the Tg of the system and make it processable under the same conditions as the other mixtures. The supersaturation assay showed also superior performance of the Kollidon K30 containing extruded solid dispersion compared to the pure K12 containing systems. The extrudates containing 36% drug load in Kollidon VA64, Soluplus/VA64 and with K30/K12 were chosen for further evaluation in a dog PK study to assess impact of the different in vitro performance on the in vivo PK.
3 mg/kg MELTEXTRUDED SOLID DISPERSION ORAL IN DOGS
The objective of this study was to compare the pharmacokinetic profile after oral administration of three melt extruded crystalline solid dispersion formulations at a dose level of 3 mg/kg to the PK profile of a previously dosed HPMC formulation. The formulation principles in the rat have been adapted to a first experimental capsule formulation for dogs. All extrudates were processed with 9% nicotinamide.
Parameter
Formulation A
solid dispersion
Kollidon VA64 with a drug load of 35% and
9% nicotinamide
Formulation B
solid dispersion
Kollidon K30/K12 (4:1) with a drug load of 36.5% and 9% nicotinamide
Formulation C
solid dispersion
Kollidon VA64/Soluplus (1:1) with a drug load of
37.5% and 9% nicotinamide
Dose [mg/kg] 3 3 3
Tmax [h] 3.0 [2.0 – 24.0] 24.0 [24.0 – 24.0] 24.0 [24.0 – 24.0]
Cmax [ng/ml] 636 ± 129 1400 ± 206 1000 ± 171
Cmax/dose [(ng/ml)/(mg/kg)]
212 ± 43.0 461 ± 68.8 345 ± 56.9
AUClast [ng/ml/h] 72.0 [72.0 - 72.0] 72.0 [72.0 - 72.0] 72.0 [72.0 - 72.0]
AUClast/Dose [(ng/ml/h)/(mg/kg)] 21200 ± 5200 44900 ± 5600 36500 ± 6600
rel BAV [%] 62 131 106
Tab. 18: PK results of the first meltextruded solid dispersions at 3mg/kg oral in dogs. The tmax is given as mean value and the observed range in brackets.
For all mean PK evaluations, dog 3 was excluded as the PK profile of this dog was obviously different from the PK profile of the remaining dogs. The inter-animal variability of the compound concentrations in plasma was high up to 1.0 hour post-dose with a variability of 124 - 173% and then low to moderate at the later time points post-dose where the variability decreased to 12.8 - 82.6% for all SD formulations. The inter-animal variability of the PK parameters Cmax/Dose and AUClast/Dose was low for all SD formulations in the range of 12.7 to 23.9%.
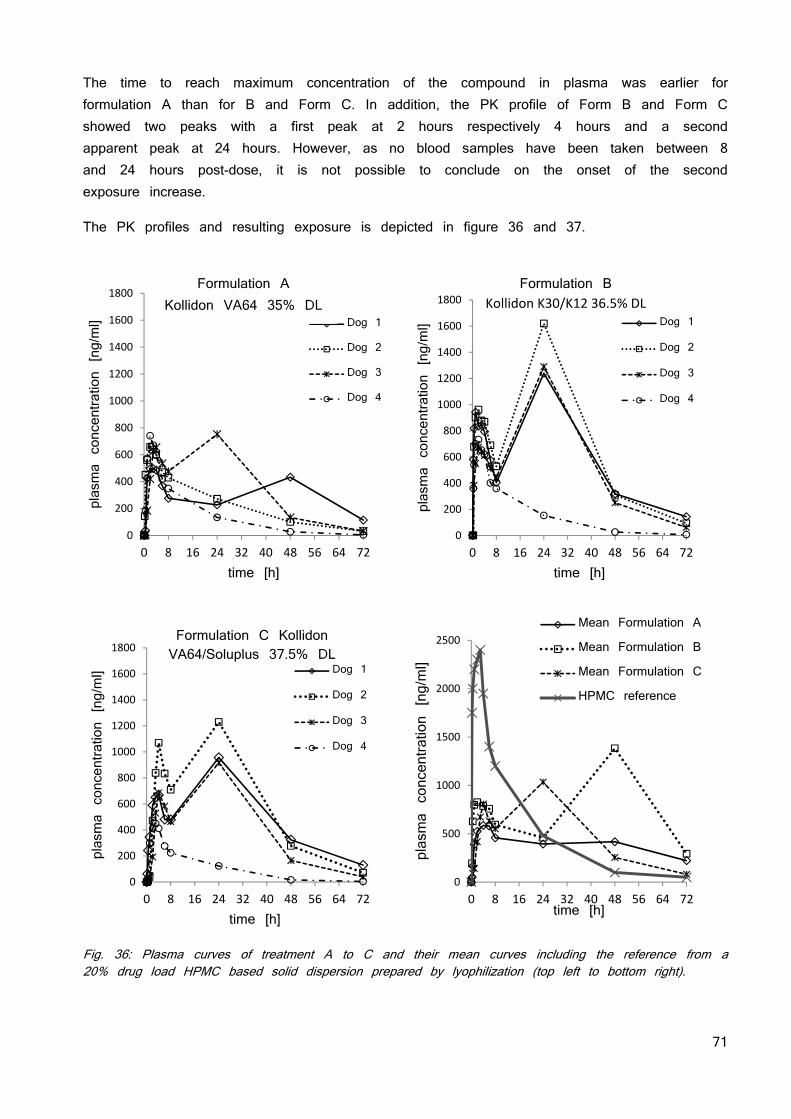
71
The time to reach maximum concentration of the compound in plasma was earlier for formulation A than for B and Form C. In addition, the PK profile of Form B and Form C showed two peaks with a first peak at 2 hours respectively 4 hours and a second apparent peak at 24 hours. However, as no blood samples have been taken between 8 and 24 hours post-dose, it is not possible to conclude on the onset of the second exposure increase.
The PK profiles and resulting exposure is depicted in figure 36 and 37.
Fig. 36: Plasma curves of treatment A to C and their mean curves including the reference from a 20% drug load HPMC based solid dispersion prepared by lyophilization (top left to bottom right).
0
200
400
600
800
1000
1200
1400
1600
1800
0 8 16 24 32 40 48 56 64 72
plasma concentration [ng/ml]
time [h]
Dog 1
Dog 2
Dog 3
Dog 4
0
200
400
600
800
1000
1200
1400
1600
1800
0 8 16 24 32 40 48 56 64 72
plasma concentration [ng/ml]
time [h]
Dog 1
Dog 2
Dog 3
Dog 4
Formulation BKollidon K30/K12 36.5% DL
0
200
400
600
800
1000
1200
1400
1600
1800
0 8 16 24 32 40 48 56 64 72
plasma concentration [ng/ml]
time [h]
Dog 1
Dog 2
Dog 3
Dog 4
Formulation C Kollidon VA64/Soluplus 37.5% DL
0
500
1000
1500
2000
2500
0 8 16 24 32 40 48 56 64 72
plasma concentration [ng/ml]
time [h]
Mean Formulation A
Mean Formulation B
Mean Formulation C
HPMC reference
Formulation A Kollidon VA64 35% DL
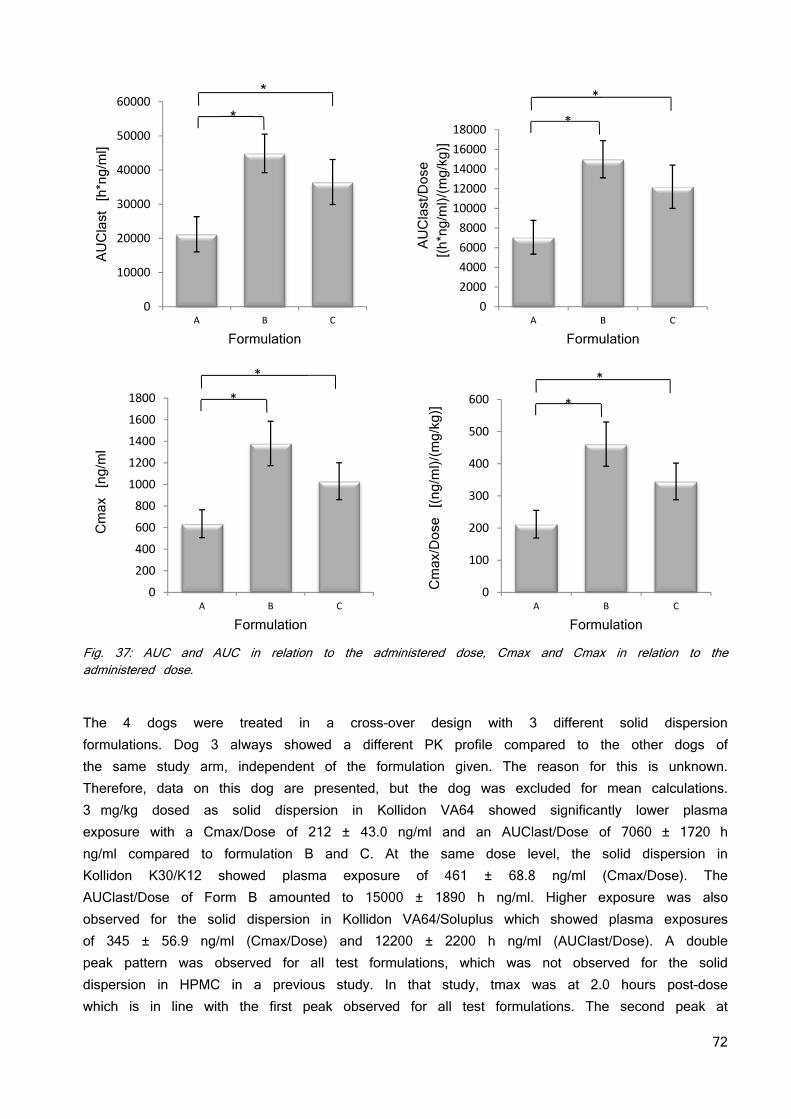
72
Fig. 37: AUC and AUC in relation to the administered dose, Cmax and Cmax in relation to the administered dose.
The 4 dogs were treated in a cross-over design with 3 different solid dispersion formulations. Dog 3 always showed a different PK profile compared to the other dogs of the same study arm, independent of the formulation given. The reason for this is unknown. Therefore, data on this dog are presented, but the dog was excluded for mean calculations. 3 mg/kg dosed as solid dispersion in Kollidon VA64 showed significantly lower plasma exposure with a Cmax/Dose of 212 ± 43.0 ng/ml and an AUClast/Dose of 7060 ± 1720 h ng/ml compared to formulation B and C. At the same dose level, the solid dispersion in Kollidon K30/K12 showed plasma exposure of 461 ± 68.8 ng/ml (Cmax/Dose). The AUClast/Dose of Form B amounted to 15000 ± 1890 h ng/ml. Higher exposure was also observed for the solid dispersion in Kollidon VA64/Soluplus which showed plasma exposures of 345 ± 56.9 ng/ml (Cmax/Dose) and 12200 ± 2200 h ng/ml (AUClast/Dose). A double peak pattern was observed for all test formulations, which was not observed for the solid dispersion in HPMC in a previous study. In that study, tmax was at 2.0 hours post-dose which is in line with the first peak observed for all test formulations. The second peak at
0
10000
20000
30000
40000
50000
60000
A B C
AUClast [h*ng/ml]
Formulation
0
2000
4000
6000
8000
10000
12000
14000
16000
18000
A B C
AUClast/Dose
[(h*ng/ml)/(mg/kg)]
Formulation
*
*
0
200
400
600
800
1000
1200
1400
1600
1800
A B C
Cmax [ng/ml
Formulation
*
*
0
100
200
300
400
500
600
A B C
Cmax/Dose [(ng/ml)/(mg/kg)]
Formulation
*
*
* *
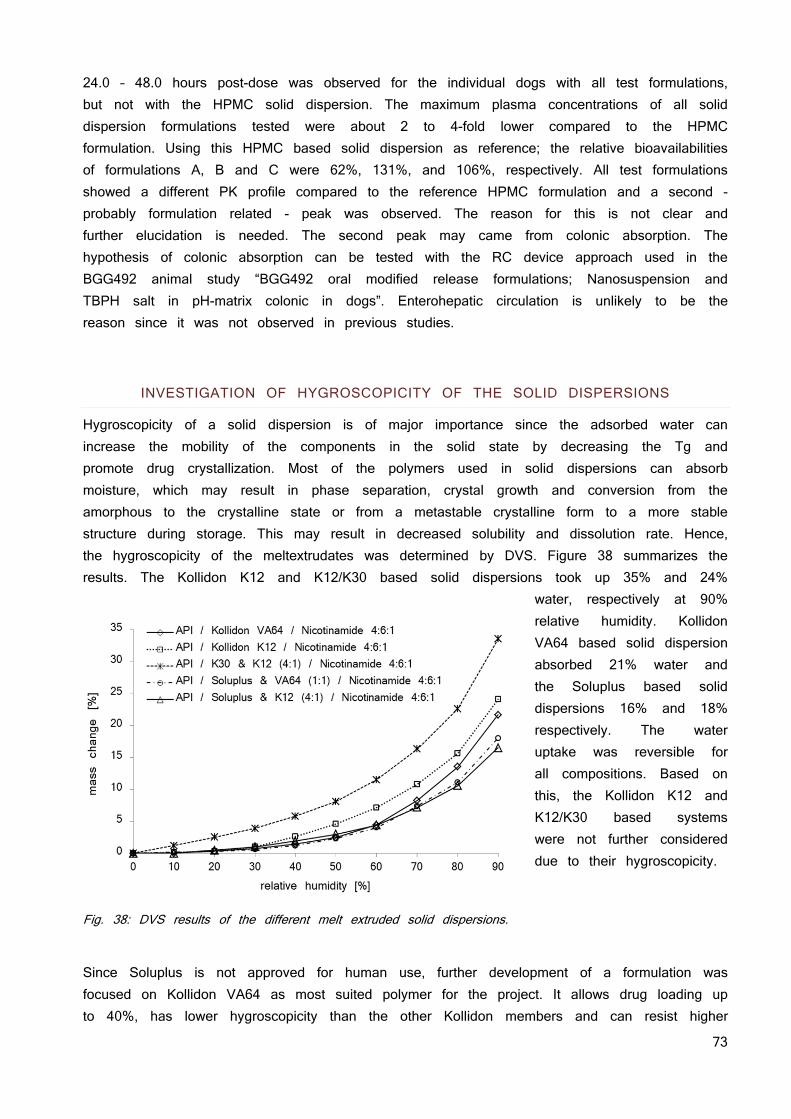
73
24.0 – 48.0 hours post-dose was observed for the individual dogs with all test formulations, but not with the HPMC solid dispersion. The maximum plasma concentrations of all solid dispersion formulations tested were about 2 to 4-fold lower compared to the HPMC formulation. Using this HPMC based solid dispersion as reference; the relative bioavailabilities of formulations A, B and C were 62%, 131%, and 106%, respectively. All test formulations showed a different PK profile compared to the reference HPMC formulation and a second - probably formulation related - peak was observed. The reason for this is not clear and further elucidation is needed. The second peak may came from colonic absorption. The hypothesis of colonic absorption can be tested with the RC device approach used in the BGG492 animal study “BGG492 oral modified release formulations; Nanosuspension and TBPH salt in pH-matrix colonic in dogs”. Enterohepatic circulation is unlikely to be the reason since it was not observed in previous studies.
INVESTIGATION OF HYGROSCOPICITY OF THE SOLID DISPERSIONS
Hygroscopicity of a solid dispersion is of major importance since the adsorbed water can increase the mobility of the components in the solid state by decreasing the Tg and promote drug crystallization. Most of the polymers used in solid dispersions can absorb moisture, which may result in phase separation, crystal growth and conversion from the amorphous to the crystalline state or from a metastable crystalline form to a more stable structure during storage. This may result in decreased solubility and dissolution rate. Hence, the hygroscopicity of the meltextrudates was determined by DVS. Figure 38 summarizes the results. The Kollidon K12 and K12/K30 based solid dispersions took up 35% and 24%
water, respectively at 90% relative humidity. Kollidon VA64 based solid dispersion absorbed 21% water and the Soluplus based solid dispersions 16% and 18% respectively. The water uptake was reversible for all compositions. Based on this, the Kollidon K12 and K12/K30 based systems were not further considered due to their hygroscopicity.
Fig. 38: DVS results of the different melt extruded solid dispersions.
Since Soluplus is not approved for human use, further development of a formulation was focused on Kollidon VA64 as most suited polymer for the project. It allows drug loading up to 40%, has lower hygroscopicity than the other Kollidon members and can resist higher
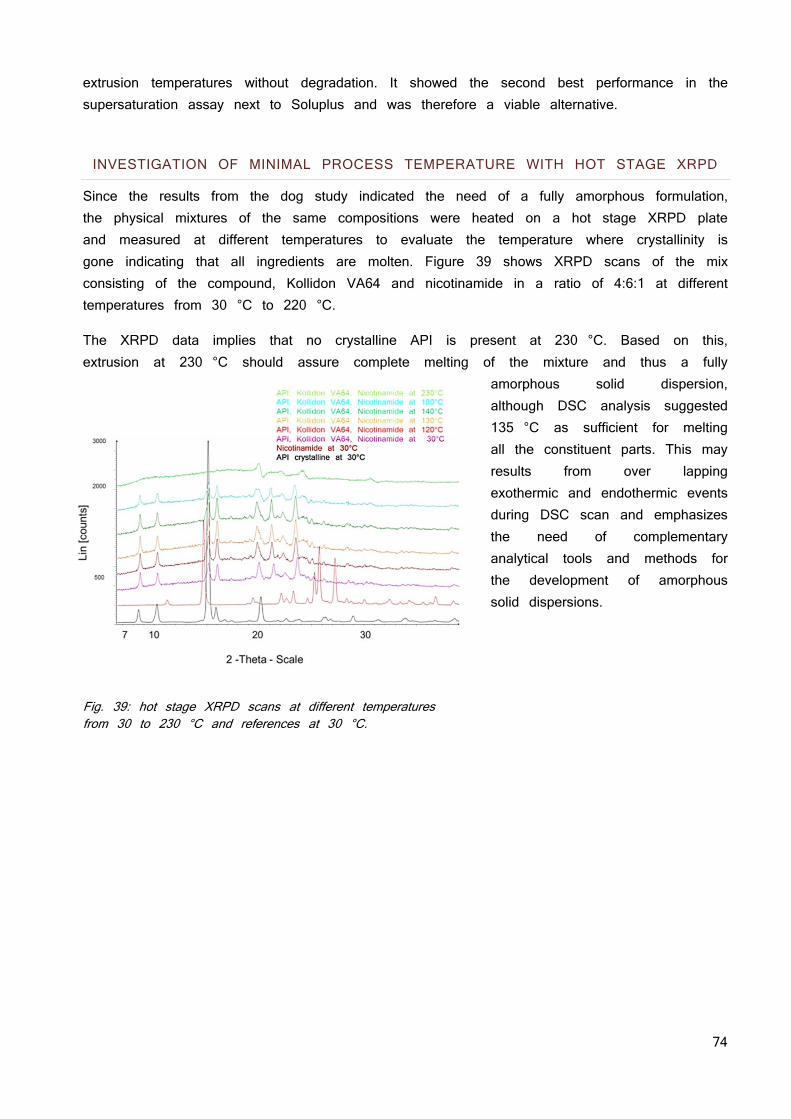
74
extrusion temperatures without degradation. It showed the second best performance in the supersaturation assay next to Soluplus and was therefore a viable alternative. INVESTIGATION OF MINIMAL PROCESS TEMPERATURE WITH HOT STAGE XRPD
Since the results from the dog study indicated the need of a fully amorphous formulation, the physical mixtures of the same compositions were heated on a hot stage XRPD plate and measured at different temperatures to evaluate the temperature where crystallinity is gone indicating that all ingredients are molten. Figure 39 shows XRPD scans of the mix consisting of the compound, Kollidon VA64 and nicotinamide in a ratio of 4:6:1 at different temperatures from 30 °C to 220 °C.
The XRPD data implies that no crystalline API is present at 230 °C. Based on this, extrusion at 230 °C should assure complete melting of the mixture and thus a fully
amorphous solid dispersion, although DSC analysis suggested 135 °C as sufficient for melting all the constituent parts. This may results from over lapping exothermic and endothermic events during DSC scan and emphasizes the need of complementary analytical tools and methods for the development of amorphous solid dispersions.
Fig. 39: hot stage XRPD scans at different temperatures from 30 to 230 °C and references at 30 °C.
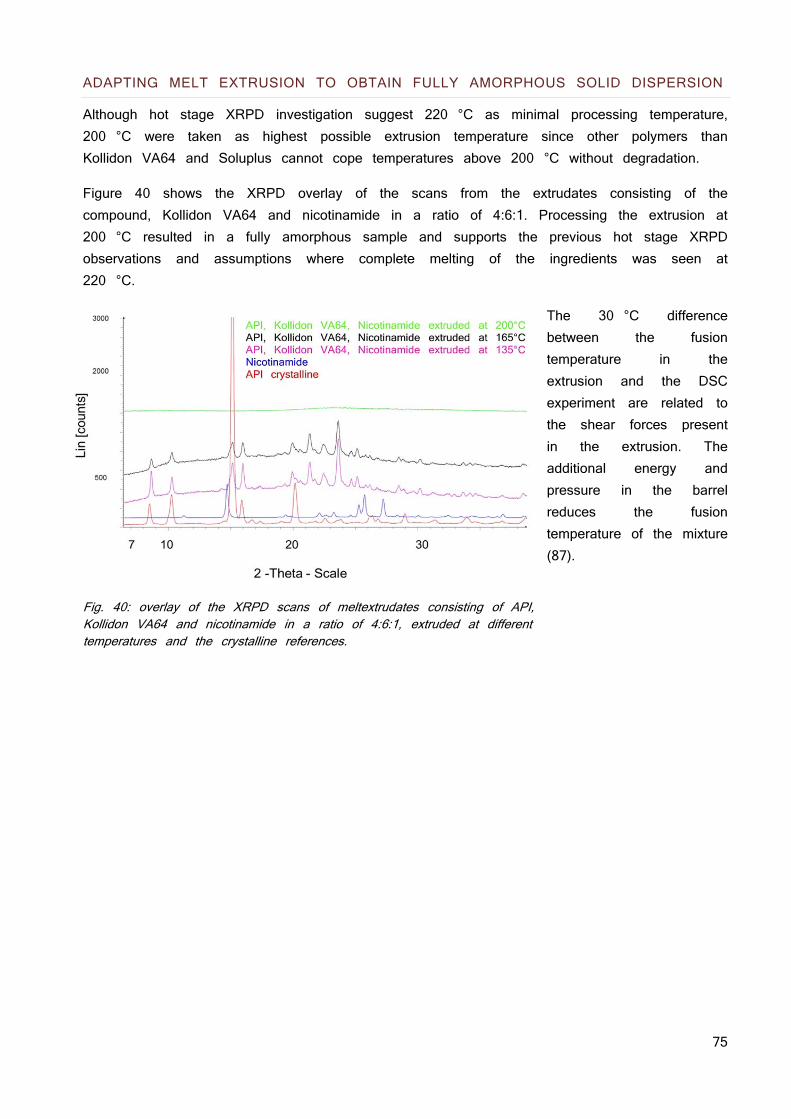
75
ADAPTING MELT EXTRUSION TO OBTAIN FULLY AMORPHOUS SOLID DISPERSION
Although hot stage XRPD investigation suggest 220 °C as minimal processing temperature, 200 °C were taken as highest possible extrusion temperature since other polymers than Kollidon VA64 and Soluplus cannot cope temperatures above 200 °C without degradation.
Figure 40 shows the XRPD overlay of the scans from the extrudates consisting of the compound, Kollidon VA64 and nicotinamide in a ratio of 4:6:1. Processing the extrusion at 200 °C resulted in a fully amorphous sample and supports the previous hot stage XRPD observations and assumptions where complete melting of the ingredients was seen at 220 °C.
The 30 °C difference between the fusion temperature in the extrusion and the DSC experiment are related to the shear forces present in the extrusion. The additional energy and pressure in the barrel reduces the fusion temperature of the mixture (87).
Fig. 40: overlay of the XRPD scans of meltextrudates consisting of API, Kollidon VA64 and nicotinamide in a ratio of 4:6:1, extruded at different temperatures and the crystalline references.
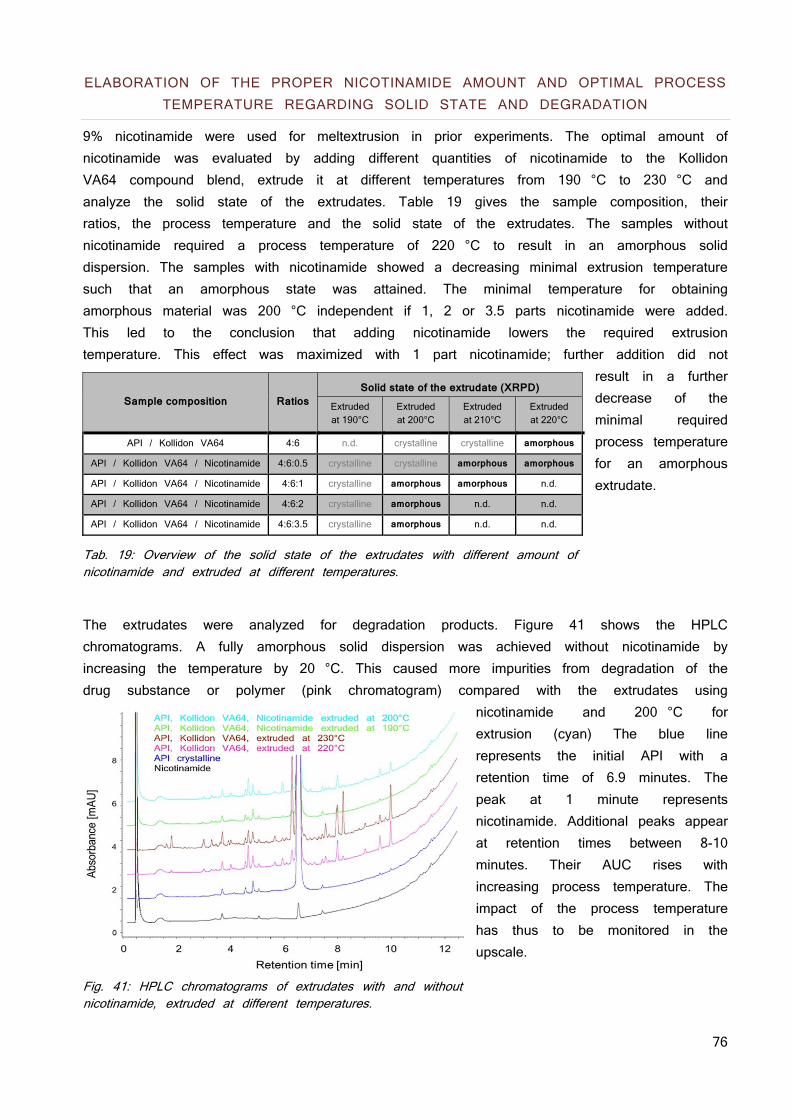
76
ELABORATION OF THE PROPER NICOTINAMIDE AMOUNT AND OPTIMAL PROCESS TEMPERATURE REGARDING SOLID STATE AND DEGRADATION
9% nicotinamide were used for meltextrusion in prior experiments. The optimal amount of nicotinamide was evaluated by adding different quantities of nicotinamide to the Kollidon VA64 compound blend, extrude it at different temperatures from 190 °C to 230 °C and analyze the solid state of the extrudates. Table 19 gives the sample composition, their ratios, the process temperature and the solid state of the extrudates. The samples without nicotinamide required a process temperature of 220 °C to result in an amorphous solid dispersion. The samples with nicotinamide showed a decreasing minimal extrusion temperature such that an amorphous state was attained. The minimal temperature for obtaining amorphous material was 200 °C independent if 1, 2 or 3.5 parts nicotinamide were added. This led to the conclusion that adding nicotinamide lowers the required extrusion temperature. This effect was maximized with 1 part nicotinamide; further addition did not
result in a further decrease of the minimal required process temperature for an amorphous extrudate.
Tab. 19: Overview of the solid state of the extrudates with different amount of nicotinamide and extruded at different temperatures.
The extrudates were analyzed for degradation products. Figure 41 shows the HPLC chromatograms. A fully amorphous solid dispersion was achieved without nicotinamide by increasing the temperature by 20 °C. This caused more impurities from degradation of the drug substance or polymer (pink chromatogram) compared with the extrudates using
nicotinamide and 200 °C for extrusion (cyan) The blue line represents the initial API with a retention time of 6.9 minutes. The peak at 1 minute represents nicotinamide. Additional peaks appear at retention times between 8-10 minutes. Their AUC rises with increasing process temperature. The impact of the process temperature has thus to be monitored in the upscale.
Fig. 41: HPLC chromatograms of extrudates with and without nicotinamide, extruded at different temperatures.
Sample composition Ratios Solid state of the extrudate (XRPD)
Extruded at 190°C
Extruded at 200°C
Extruded at 210°C
Extruded at 220°C
API / Kollidon VA64 4:6 n.d. crystalline crystalline amorphous
API / Kollidon VA64 / Nicotinamide 4:6:0.5 crystalline crystalline amorphous amorphous
API / Kollidon VA64 / Nicotinamide 4:6:1 crystalline amorphous amorphous n.d.
API / Kollidon VA64 / Nicotinamide 4:6:2 crystalline amorphous n.d. n.d.
API / Kollidon VA64 / Nicotinamide 4:6:3.5 crystalline amorphous n.d. n.d.
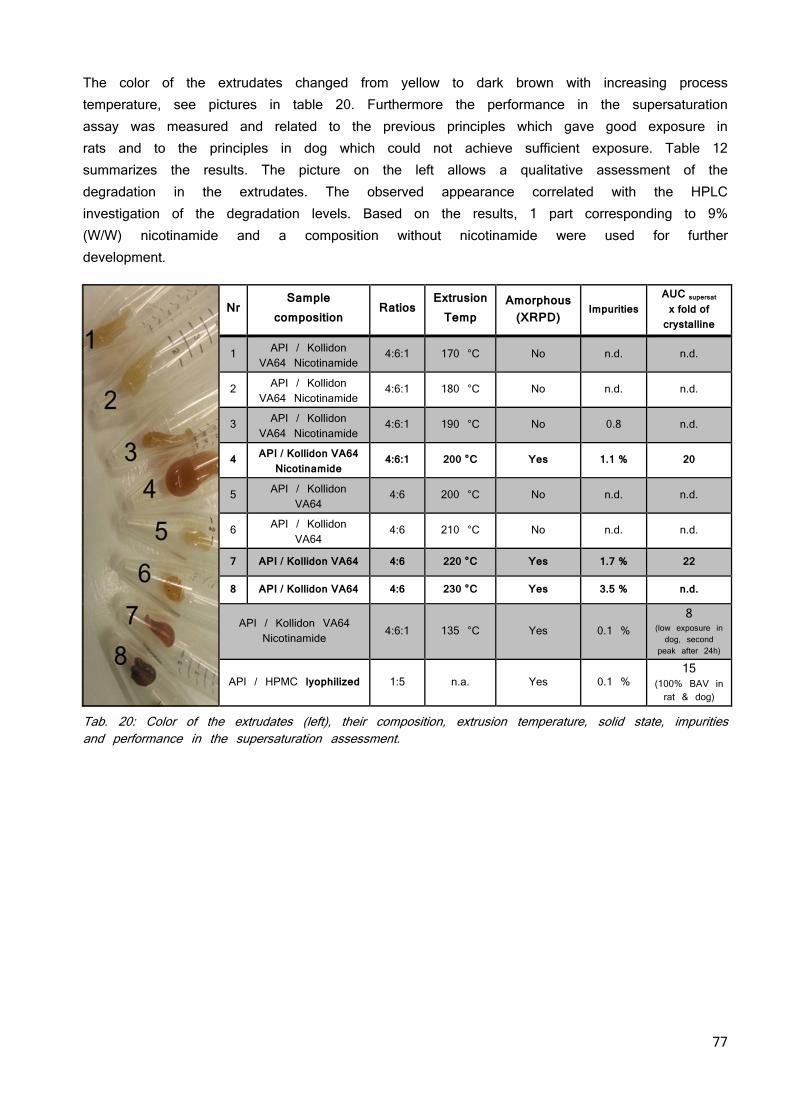
77
The color of the extrudates changed from yellow to dark brown with increasing process temperature, see pictures in table 20. Furthermore the performance in the supersaturation assay was measured and related to the previous principles which gave good exposure in rats and to the principles in dog which could not achieve sufficient exposure. Table 12 summarizes the results. The picture on the left allows a qualitative assessment of the degradation in the extrudates. The observed appearance correlated with the HPLC investigation of the degradation levels. Based on the results, 1 part corresponding to 9% (W/W) nicotinamide and a composition without nicotinamide were used for further development.
Nr
Sample composition
Ratios Extrusion
Temp Amorphous
(XRPD) Impurities
AUC supersat x fold of
crystalline
1 API / Kollidon VA64 Nicotinamide
4:6:1 170 °C No n.d. n.d.
2 API / Kollidon VA64 Nicotinamide
4:6:1 180 °C No n.d. n.d.
3 API / Kollidon VA64 Nicotinamide
4:6:1 190 °C No 0.8 n.d.
4 API / Kollidon VA64 Nicotinamide
4:6:1 200 °C Yes 1.1 % 20
5 API / Kollidon VA64
4:6 200 °C No n.d. n.d.
6 API / Kollidon VA64
4:6 210 °C No n.d. n.d.
7 API / Kollidon VA64 4:6 220 °C Yes 1.7 % 22
8 API / Kollidon VA64 4:6 230 °C Yes 3.5 % n.d.
API / Kollidon VA64 Nicotinamide
4:6:1 135 °C Yes 0.1 % 8
(low exposure in dog, second
peak after 24h)
API / HPMC lyophilized 1:5 n.a. Yes 0.1 % 15
(100% BAV in rat & dog)
Tab. 20: Color of the extrudates (left), their composition, extrusion temperature, solid state, impurities and performance in the supersaturation assessment.
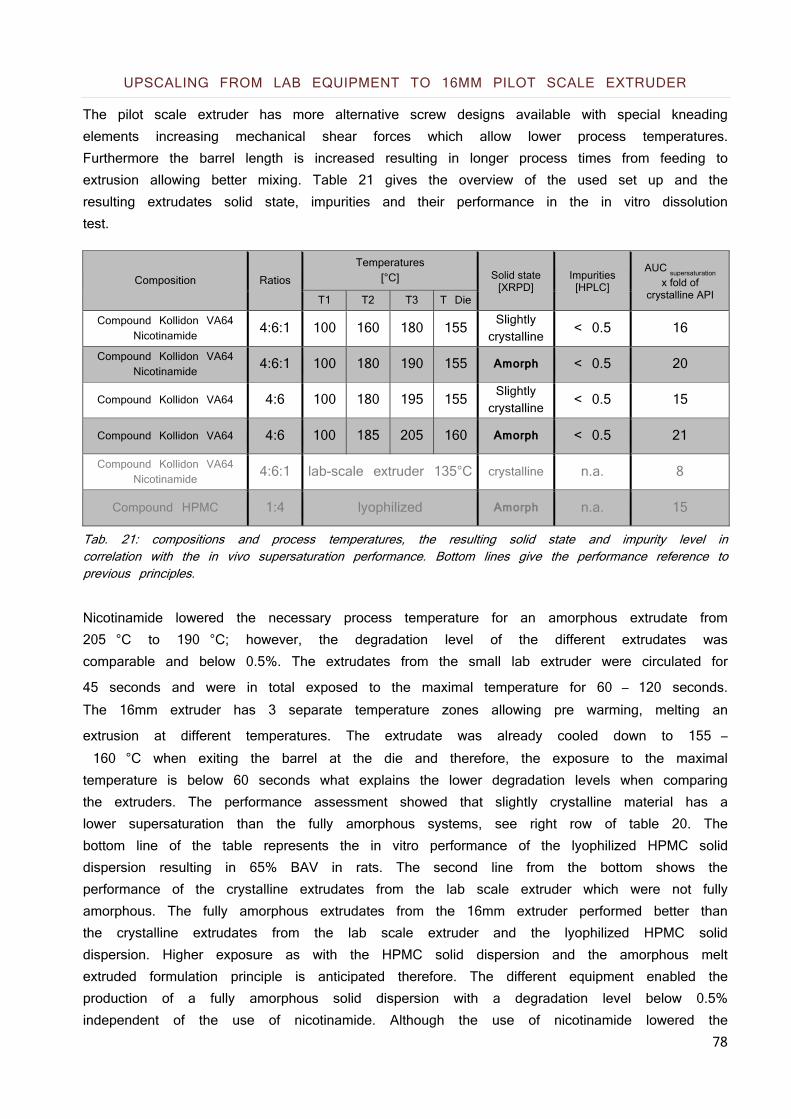
78
UPSCALING FROM LAB EQUIPMENT TO 16MM PILOT SCALE EXTRUDER
The pilot scale extruder has more alternative screw designs available with special kneading elements increasing mechanical shear forces which allow lower process temperatures. Furthermore the barrel length is increased resulting in longer process times from feeding to extrusion allowing better mixing. Table 21 gives the overview of the used set up and the resulting extrudates solid state, impurities and their performance in the in vitro dissolution test.
Composition Ratios Temperatures
[°C] Solid state [XRPD]
Impurities [HPLC]
AUC supersaturation
x fold of crystalline API T1 T2 T3 T Die
Compound Kollidon VA64 Nicotinamide
4:6:1 100 160 180 155 Slightly crystalline
< 0.5 16
Compound Kollidon VA64 Nicotinamide
4:6:1 100 180 190 155 Amorph < 0.5 20
Compound Kollidon VA64 4:6 100 180 195 155 Slightly crystalline
< 0.5 15
Compound Kollidon VA64 4:6 100 185 205 160 Amorph < 0.5 21
Compound Kollidon VA64 Nicotinamide
4:6:1 lab-scale extruder 135°C crystalline n.a. 8
Compound HPMC 1:4 lyophilized Amorph n.a. 15
Tab. 21: compositions and process temperatures, the resulting solid state and impurity level in correlation with the in vivo supersaturation performance. Bottom lines give the performance reference to previous principles.
Nicotinamide lowered the necessary process temperature for an amorphous extrudate from 205 °C to 190 °C; however, the degradation level of the different extrudates was comparable and below 0.5%. The extrudates from the small lab extruder were circulated for
45 seconds and were in total exposed to the maximal temperature for 60 – 120 seconds. The 16mm extruder has 3 separate temperature zones allowing pre warming, melting an
extrusion at different temperatures. The extrudate was already cooled down to 155 – 160 °C when exiting the barrel at the die and therefore, the exposure to the maximal temperature is below 60 seconds what explains the lower degradation levels when comparing the extruders. The performance assessment showed that slightly crystalline material has a lower supersaturation than the fully amorphous systems, see right row of table 20. The bottom line of the table represents the in vitro performance of the lyophilized HPMC solid dispersion resulting in 65% BAV in rats. The second line from the bottom shows the performance of the crystalline extrudates from the lab scale extruder which were not fully amorphous. The fully amorphous extrudates from the 16mm extruder performed better than the crystalline extrudates from the lab scale extruder and the lyophilized HPMC solid dispersion. Higher exposure as with the HPMC solid dispersion and the amorphous melt extruded formulation principle is anticipated therefore. The different equipment enabled the production of a fully amorphous solid dispersion with a degradation level below 0.5% independent of the use of nicotinamide. Although the use of nicotinamide lowered the
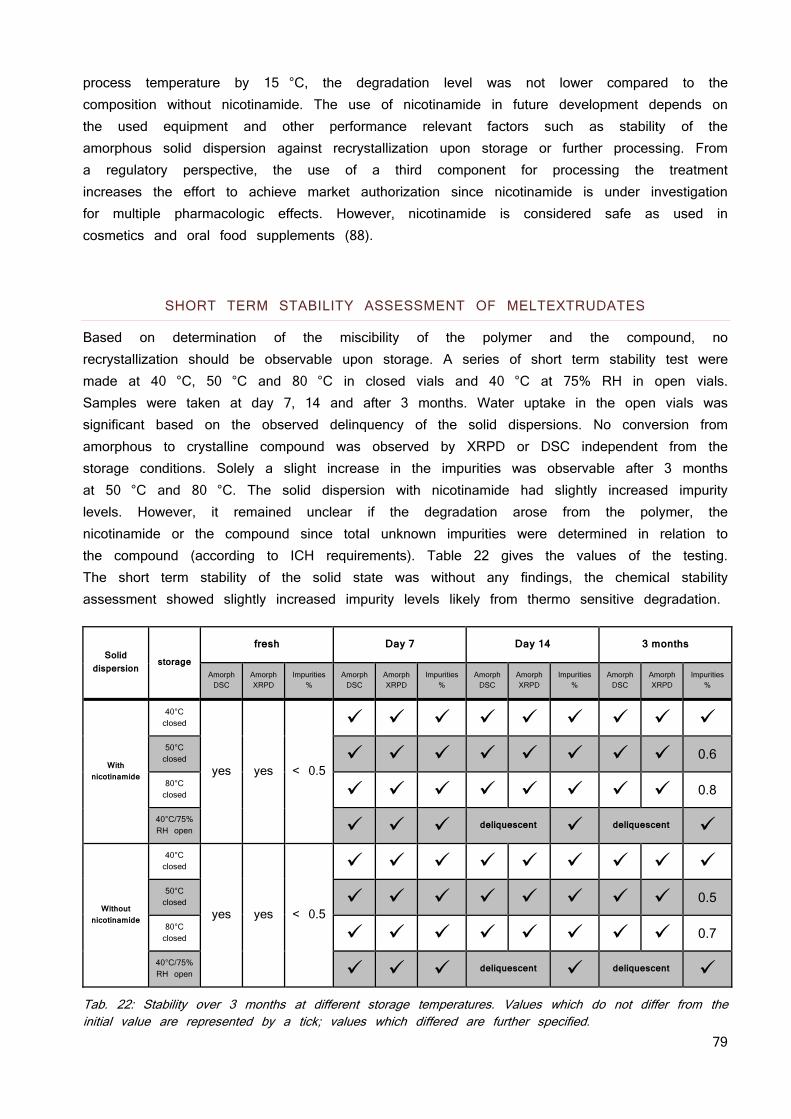
79
process temperature by 15 °C, the degradation level was not lower compared to the composition without nicotinamide. The use of nicotinamide in future development depends on the used equipment and other performance relevant factors such as stability of the amorphous solid dispersion against recrystallization upon storage or further processing. From a regulatory perspective, the use of a third component for processing the treatment increases the effort to achieve market authorization since nicotinamide is under investigation for multiple pharmacologic effects. However, nicotinamide is considered safe as used in cosmetics and oral food supplements (88).
SHORT TERM STABILITY ASSESSMENT OF MELTEXTRUDATES
Based on determination of the miscibility of the polymer and the compound, no recrystallization should be observable upon storage. A series of short term stability test were made at 40 °C, 50 °C and 80 °C in closed vials and 40 °C at 75% RH in open vials. Samples were taken at day 7, 14 and after 3 months. Water uptake in the open vials was significant based on the observed delinquency of the solid dispersions. No conversion from amorphous to crystalline compound was observed by XRPD or DSC independent from the storage conditions. Solely a slight increase in the impurities was observable after 3 months at 50 °C and 80 °C. The solid dispersion with nicotinamide had slightly increased impurity levels. However, it remained unclear if the degradation arose from the polymer, the nicotinamide or the compound since total unknown impurities were determined in relation to the compound (according to ICH requirements). Table 22 gives the values of the testing. The short term stability of the solid state was without any findings, the chemical stability assessment showed slightly increased impurity levels likely from thermo sensitive degradation.
Solid
dispersion storage
fresh Day 7 Day 14 3 months
Amorph
DSC
Amorph
XRPD
Impurities %
Amorph
DSC
Amorph
XRPD
Impurities %
Amorph
DSC
Amorph
XRPD
Impurities %
Amorph
DSC
Amorph
XRPD
Impurities %
With nicotinamide
40°C
closed
yes yes < 0.5
50°C
closed 0.6
80°C
closed 0.8
40°C/75%
RH open deliquescent deliquescent
Without nicotinamide
40°C
closed
yes yes < 0.5
50°C
closed 0.5
80°C
closed 0.7
40°C/75%
RH open deliquescent deliquescent
Tab. 22: Stability over 3 months at different storage temperatures. Values which do not differ from the initial value are represented by a tick; values which differed are further specified.
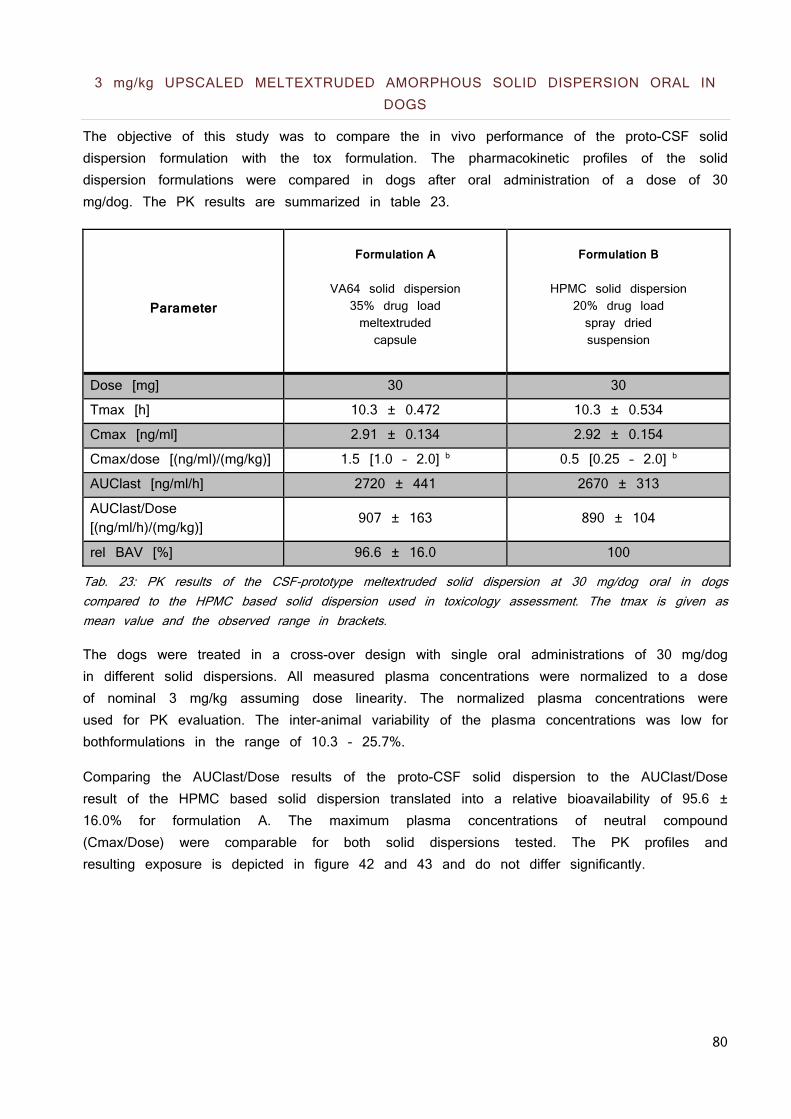
80
3 mg/kg UPSCALED MELTEXTRUDED AMORPHOUS SOLID DISPERSION ORAL IN DOGS
The objective of this study was to compare the in vivo performance of the proto-CSF solid dispersion formulation with the tox formulation. The pharmacokinetic profiles of the solid dispersion formulations were compared in dogs after oral administration of a dose of 30 mg/dog. The PK results are summarized in table 23.
Parameter
Formulation A
VA64 solid dispersion
35% drug load meltextruded capsule
Formulation B
HPMC solid dispersion
20% drug load spray dried suspension
Dose [mg] 30 30
Tmax [h] 10.3 ± 0.472 10.3 ± 0.534
Cmax [ng/ml] 2.91 ± 0.134 2.92 ± 0.154
Cmax/dose [(ng/ml)/(mg/kg)] 1.5 [1.0 – 2.0] b 0.5 [0.25 – 2.0] b
AUClast [ng/ml/h] 2720 ± 441 2670 ± 313
AUClast/Dose [(ng/ml/h)/(mg/kg)]
907 ± 163 890 ± 104
rel BAV [%] 96.6 ± 16.0 100
Tab. 23: PK results of the CSF-prototype meltextruded solid dispersion at 30 mg/dog oral in dogs compared to the HPMC based solid dispersion used in toxicology assessment. The tmax is given as mean value and the observed range in brackets.
The dogs were treated in a cross-over design with single oral administrations of 30 mg/dog in different solid dispersions. All measured plasma concentrations were normalized to a dose of nominal 3 mg/kg assuming dose linearity. The normalized plasma concentrations were used for PK evaluation. The inter-animal variability of the plasma concentrations was low for bothformulations in the range of 10.3 - 25.7%.
Comparing the AUClast/Dose results of the proto-CSF solid dispersion to the AUClast/Dose result of the HPMC based solid dispersion translated into a relative bioavailability of 95.6 ± 16.0% for formulation A. The maximum plasma concentrations of neutral compound (Cmax/Dose) were comparable for both solid dispersions tested. The PK profiles and resulting exposure is depicted in figure 42 and 43 and do not differ significantly.
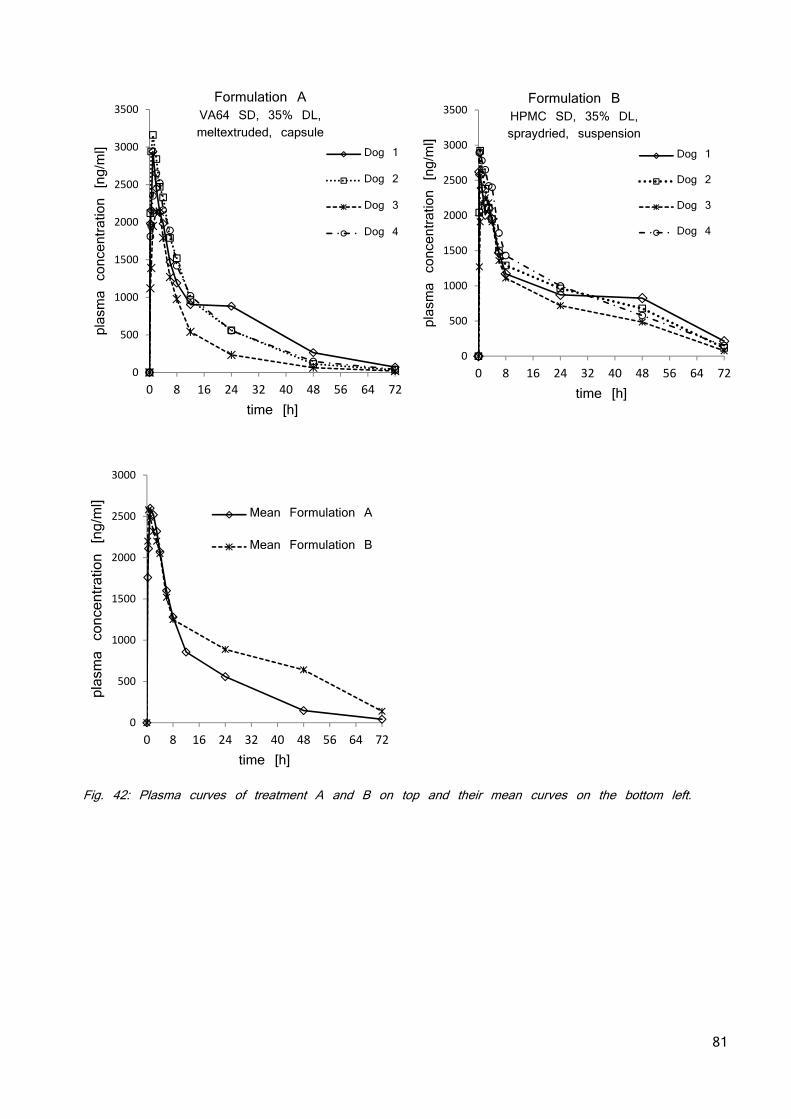
81
Fig. 42: Plasma curves of treatment A and B on top and their mean curves on the bottom left.
0
500
1000
1500
2000
2500
3000
3500
0 8 16 24 32 40 48 56 64 72
plasma concentration [ng/ml]
time [h]
Dog 1
Dog 2
Dog 3
Dog 4
0
500
1000
1500
2000
2500
3000
3500
0 8 16 24 32 40 48 56 64 72
plasma concentration [ng/ml]
time [h]
Dog 1
Dog 2
Dog 3
Dog 4
Formulation B HPMC SD, 35% DL, spraydried, suspension
0
500
1000
1500
2000
2500
3000
0 8 16 24 32 40 48 56 64 72
plasma concentration [ng/ml]
time [h]
Mean Formulation A
Mean Formulation B
Formulation A VA64 SD, 35% DL, meltextruded, capsule
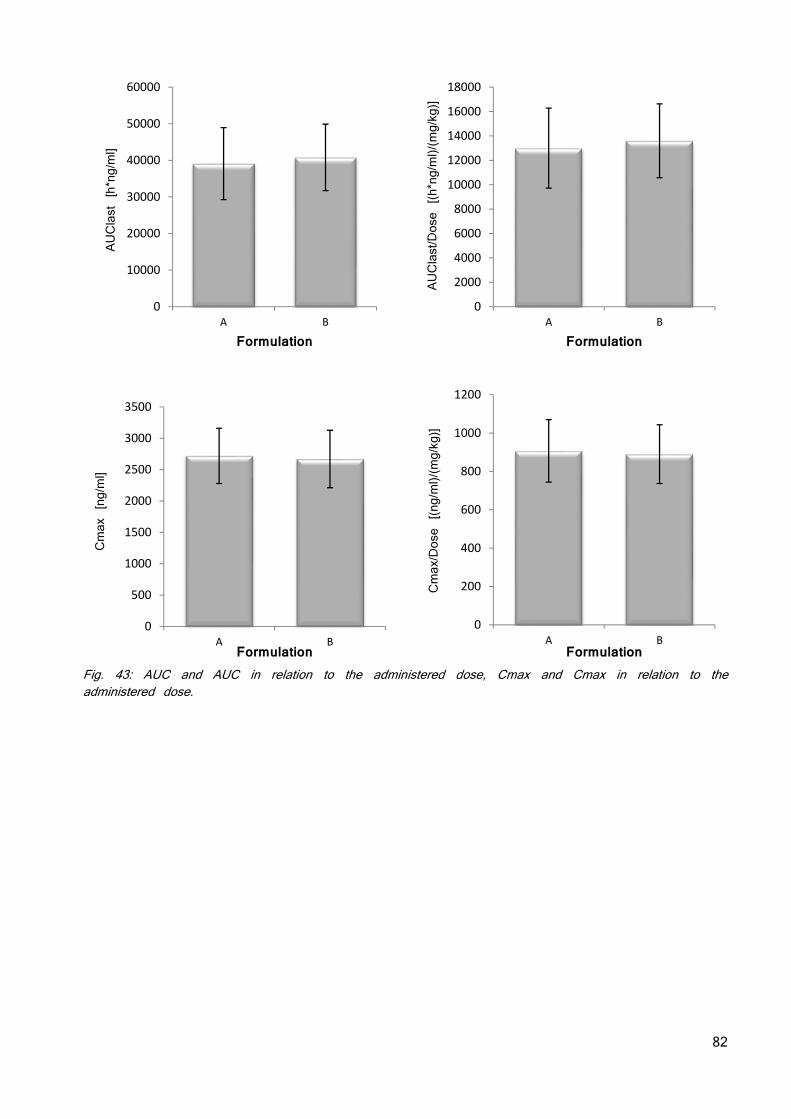
82
Fig. 43: AUC and AUC in relation to the administered dose, Cmax and Cmax in relation to the administered dose.
0
10000
20000
30000
40000
50000
60000
A B
AUClast [h*ng/ml]
Formulation
0
2000
4000
6000
8000
10000
12000
14000
16000
18000
A B
AUClast/Dose [(h*ng/ml)/(mg/kg)]
Formulation
0
500
1000
1500
2000
2500
3000
3500
A B
Cmax [ng/ml]
Formulation
0
200
400
600
800
1000
1200
A B
Cmax/Dose [(ng/ml)/(mg/kg)]
Formulation
83
DISCUSSION
The discussion is separated in two parts, addressing the in vitro results in a first and the in vivo results in a second section, respectively.
IN VITRO
SCREENING FOR COUNTER IONS
The lattice forces of the acidic compound and its pro-drug were subsequently reduced by using counter ions with a monovalent charge and a soft bulky electron density. Orientation in a crystal was prevented by 4 alkyl chains introducing flexibility and steric hindrance. Phosphonium based cations with alkyl chains had superior stability characteristics as compared to their ammonia based analogues and as published before (89). They also have a smaller potential risk for biological activity since alkyl ammonia salts have many roles in biological systems. Multiple ratios of compound and counter ion were studied and the solubility increased with increasing amounts of counter ion, an effect which was less pronounced at ratios exceeding 1:1. Additionally, the chemical stability of the ionic liquids decreased above equimolar ratio, therefore TBPH in a 1:1 ratio was chosen for further development. The solubility increase as a result of using TBPH as counterion was parallel to a different precipitation behavior in solution. Solutions of TBPH salt and the native compound were prepared at pH 9 where the free form is highly soluble followed by titrating the pH down until precipitation was observed. The TBPH salts precipitated 0.3 pH units later than the free forms which precipitated at pH 8.0. This may provide a benefit regarding exposure at higher doses. With the knowledge that solutions of the TBPH salts of the compounds precipitate below pH 8.0 it was considered that a pH-sensitive polymer must be used to protect the amorphous state of the solid dispersion in a low pH environment as the stomach (39). HPMC-AS and Eudragit L100-55, two well-known gastro protective polymers which can be spray dried (90; 91) were evaluated regarding the miscibility with BGG492.
SCREENING POLYMERS FOR MISCIBILITY/DRUG LOAD AND SUPERSATURATION
The term of solid solution is often used in context with solid dispersions. Solubility can be defined as a thermodynamic parameter at which the chemical potential of the solute in the solid phase is the same as that in the liquid phase. This definition is generally valid, hence can be applied for polymers as well and assuming that the equilibrium can always be reached when the temperature of measurement is above Tg of the system (kinetic hindrance is not preventing the equilibrium) (40). When the temperature is close to or below Tg, the system becomes too viscous to reach the equilibrium and the solubility determined experimentally can only be defined as apparent solubility and has to be distinguished from the equilibrium solubility (92). Similar miscibility at temperatures close to and below Tg is only apparent and highly dependent on kinetic parameters such as phase separation.
84
Therefore, the stability of the solid dispersions below Tg relies on kinetic parameters, including mobility as basic requirement for phase separation and/or crystallization. Above miscibility, there is no thermodynamic barrier to prevent the system from destabilization and a solid dispersion can only be stabilized kinetically by storage at temperatures sufficiently below Tg (47). A solid dispersion below miscibility might be able to maintain its thermodynamically metastable status both below and above Tg depending on the crystallization behavior of the drug (42). Therefore, the drug–polymer miscibility is an important consideration for the physical stability of a solid dispersion, especially when a homogeneous amorphous mixture can be obtained during processing (93). This was evaluated by preparing solid dispersions with different drug loads as lyophilisates which were evaluated by differential scanning calorimetry (DSC) (47). DSC analysis of solid dispersions is commonly used for assessing the solid state of a solid dispersion (94; 46). Since an amorphous drug has higher chemical potential than its crystalline counterpart, the amorphous drug–polymer miscibility is always higher than the crystalline drug–polymer miscibility (94). Thermodynamically the amorphous drug has a lower chemical potential when mixed with a polymer, due to reduced molecular mobility based on the increased viscosity or of the binary system. This can be due to dilution effects of the amorphous drug with polymers and/or based on solid state interactions such as ionic interactions or H bonding (41; 24). These drug–polymer intermolecular interactions are important for the stabilization of the solid dispersion and may change the crystallization driving force (21; 42; 43).
Drug–polymer miscibility is an important parameter for the development of solid dispersions and requires quite tedious experimental investigation. The difficulty is the high viscosity of the polymer that prevents the system to reach equilibrium (95). On the other hand, at temperatures near and below Tg, the system goes on continuously slow relaxation to reach equilibrium. Spray drying and hot-melt extrusion are capable of producing well mixed systems which remain as homogeneous dispersions (e.g., single Tg from DSC) kinetically stable at temperature below its Tg. These systems, although being thermodynamically unstable, may still prove kinetically stable enough as long as the mixing status between drug and polymer can be confirmed and maintained after manufacturing (47). One has to keep in mind that moisture is ubiquitous and water is always the third component in any solid dispersion. It is well known that water can bring profound impact on Tg, solubility, and miscibility. Each component of the solid dispersion influences the Tg of the solid dispersion based on its proportion and Tg of the pure component (50). Water has a Tg of -134 °C, (51) thus only minor mounts of water reduce the Tg of a solid dispersion substantially. Depending on the hygroscopicity of a drug–polymer system, the moisture content may be critical for the drug loading limit and stability of the formulation (94).
Maximal drug load of BGG492 was found to be 40% in HPMC-AS and 50% in Eudragit L100-55 which was chosen for further development. These high miscibilities were reported also for other compounds with these polymers (39; 91; 96; 97).
For the neutral compound, 2 polymer families were found to be well miscible: Kollidon based systems and Soluplus based systems. These polymers are well established as matrix polymers for solid dispersions not only based on miscibility with numerous APIs, (98; 99)
85
but as well processable with many different technologies (87). The conclusions drawn from the thermal investigation seem to be justified for the BGG492 containing solid dispersions which achieved a shelf life of more than 12 months without major efforts regarding the prevention of recrystallization such as tight packaging or cooled storing conditions. The results from the thermal investigation from the acids were the basis to anticipate the same behavior of the neutral compound regarding the stability of the solid dispersions. However, the anticipated stability upon long term storage needs to be confirmed.
ASSESSMENT OF SUPERSATURATION
It was observed that highly concentrated BGG492 TBPH solutions (25 mg/ml) were precipitating as free acid after a few days. This led to the hypothesis that TBPH has two functions; (i) keeping the BGG492 in an amorphous state which shows higher solubility and (ii) kinetically prevents precipitation of the thermodynamically instable supersaturation. Therefore, the supersaturation behavior of the different systems was investigated in an in vitro system mimicking biological GIT conditions. The supersaturation pattern of 5 mg/ml compound was measured during 8 minutes of gastric pH 2 and 3 hours at pH 6.5 representing early intestines or at 7.4 representing deeper intestinal regions pH values. It can be concluded that the TBPH salt has a risk for recrystallization when exposed to low pH as in the stomach; however, recrystallization was compound dependent. The TBPH salt of CER225 did not recrystallize but formed an oily layer on the vial wall. Once the pH was increased, the oily skin disappeared and the TBPH salt of the pro-drug showed the best performance among the CER225 containing systems at pH 7.4. This might come from the hydrophobic substitution of the phosphonium ion in the TPBH making the TBPH salt hydrophobic at low pH due to high proton concentration and more soluble at higher pH where TBPH can pair also with hydroxide ions forming a less hydrophobic ion pair (100). Measurement of the distribution between water and octanol at different pH might help to verify the hypothesis (101). The embedding of the compound in pH-matrix resulted in the highest supersaturation (spring) independent of pH and compound, but could not be stabilized (no parachute) for a longer time frame. The combination of the TBPH salt within the pH-matrix showed the best results for BGG492 with the supersaturation being stabilized for almost 3 hours at pH 7.4. The TBPH salt form of CER225 in matrix showed a good degree of supersaturation and was also stable for 3 hours independent of the pH. The pure TBPH salt of CER225 without pH-matrix performed best solely at pH 7.4. Therefore, the combination of both approaches, TBPH salt and incorporation into pH-sensitive matrix, is the most promising route regarding future development of a delayed or sustained release overcoming the absorption window. The embedding of the free form in the pH-matrix offers an alternative in case of toxicology findings for TBPH prevents the human use or for potential immediate release forms used in indications such as migraine, one of the investigated indications of AMPA compounds like BGG492. As in the supersaturation chapter of the introduction, the precipitation from a supersaturated solution is a thermodynamically favored process based on decreasing the free enthalpy of the system. Mechanistically, drug precipitation from a supersaturated solution essentially consists of nucleation and crystal
86
growth. Starting from the supersaturated solution, dissolved molecules have to form small aggregates which can then grow to macroscopic crystals. Although precipitation is a thermodynamically favored event, nucleation requires activation energy. The height of the activation energy decides whether supersaturation can be stabilized or not. Once the energy barrier for nucleation has been overcome, critical clusters can grow to macroscopic crystals. Crystal growth is usually described as two step model: diffusion of molecules from the supersaturated solution to the crystal interface and integration of the molecule into the crystal lattice (21). The potency of polymers to stabilize supersaturation has been reported quite often in literature (43; 46). Polymers can increase the solubility of drugs, nevertheless this effect was could not be confirmed for our polymer drug system. The solid dispersion provides only a spring effect but no supersaturation. Hence, the TBPH must be the decisive factor assuring the supersaturation when embedded in the pH-matrix although the pH environment was below the pH max of the pure TBPH salts and precipitation of the free forms was anticipated. This leads to the hypothesis that TBPH not only bring in the concept of salt formation by introducing a constant ionic state of compound and counter ion increasing the solubility, but also prevents the formation of protonated neutral compound which would precipitate. This is in line with other investigations published in which prolonged supersaturation was observed for the TBPH salts (84). Their data provided evidence, that the ratio of the attachment and detachment kinetics was significantly higher for the TBPH salt as compared to the free forms. This suggested that the extended duration of supersaturation is at least in part driven by the counter ion’s impact on nucleus formation and the counter ion prolonged supersaturation by stabilizing the deprotonated state of the compound (65). Further experiments are needed to elaborate the interaction of the compounds and TBPH for understanding the effect of this counter ion on the supersaturation behavior of the two compounds.
All amorphous solid dispersions of the neutral compound showed a spring effect in the dissolution test, but not all showed a parachute effect. The HPMC solid dispersion which gave good results in rat PK showed the highest spring effect; however, its recrystallization was among the fastest. Therefore, the initial high apparent solubility is considered to be sufficient for assuring exposure, but it shows also that the exposure observed from the HPMC solid dispersion might be more sensitive to biological factors since it does not provide a proper parachute effect. The solid dispersions were ranked based on performance limiting factors such as the initial kinetic solubility (mg/ml) and the supersaturation (AUC) from a biopharmaceutical perspective and drug load from a development point of view. The Kollidon based solid dispersions of the neutral compound enabled high drug load and medium initial apparent solubility. The Soluplus based formulations offered lower drug load and slightly lower initial kinetic solubility, but showed an extended supersaturation. Soluplus is known to form micelles (85) and the solubility of the crystalline compound in presence of Soluplus rose by factor 2-3. Therefore, the performance of the Soluplus containing solid dispersion was not coming solely from a solubilization of the compound in polymer micelles. Since Soluplus is not approved for human use yet (status October 2015) it was a backup principle and only developed for animal trials and not for developing a clinical service form
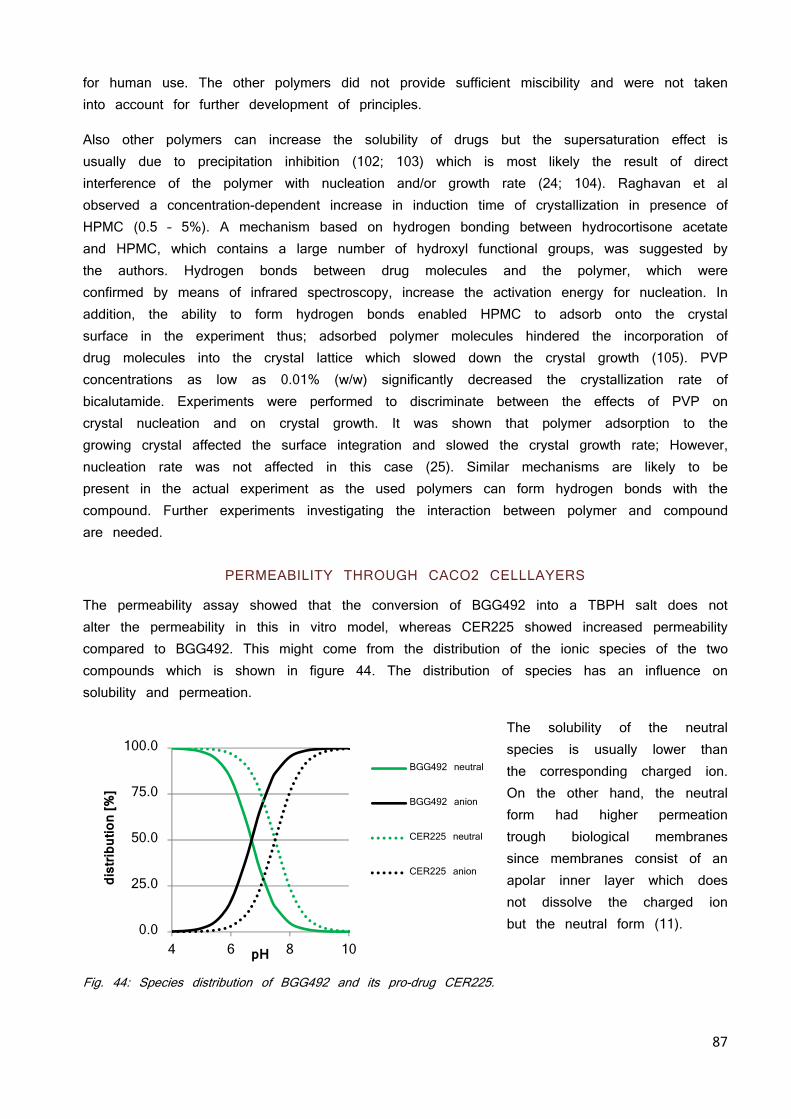
87
for human use. The other polymers did not provide sufficient miscibility and were not taken into account for further development of principles.
Also other polymers can increase the solubility of drugs but the supersaturation effect is usually due to precipitation inhibition (102; 103) which is most likely the result of direct interference of the polymer with nucleation and/or growth rate (24; 104). Raghavan et al observed a concentration-dependent increase in induction time of crystallization in presence of HPMC (0.5 – 5%). A mechanism based on hydrogen bonding between hydrocortisone acetate and HPMC, which contains a large number of hydroxyl functional groups, was suggested by the authors. Hydrogen bonds between drug molecules and the polymer, which were confirmed by means of infrared spectroscopy, increase the activation energy for nucleation. In addition, the ability to form hydrogen bonds enabled HPMC to adsorb onto the crystal surface in the experiment thus; adsorbed polymer molecules hindered the incorporation of drug molecules into the crystal lattice which slowed down the crystal growth (105). PVP concentrations as low as 0.01% (w/w) significantly decreased the crystallization rate of bicalutamide. Experiments were performed to discriminate between the effects of PVP on crystal nucleation and on crystal growth. It was shown that polymer adsorption to the growing crystal affected the surface integration and slowed the crystal growth rate; However, nucleation rate was not affected in this case (25). Similar mechanisms are likely to be present in the actual experiment as the used polymers can form hydrogen bonds with the compound. Further experiments investigating the interaction between polymer and compound are needed.
PERMEABILITY THROUGH CACO2 CELLLAYERS
The permeability assay showed that the conversion of BGG492 into a TBPH salt does not alter the permeability in this in vitro model, whereas CER225 showed increased permeability compared to BGG492. This might come from the distribution of the ionic species of the two compounds which is shown in figure 44. The distribution of species has an influence on solubility and permeation.
The solubility of the neutral species is usually lower than the corresponding charged ion. On the other hand, the neutral form had higher permeation trough biological membranes since membranes consist of an apolar inner layer which does not dissolve the charged ion but the neutral form (11).
Fig. 44: Species distribution of BGG492 and its pro-drug CER225.
0.0
25.0
50.0
75.0
100.0
4 6 8 10
dist
ribut
ion
[%]
pH
BGG492 neutral
BGG492 anion
CER225 neutral
CER225 anion
88
Therefore, the pKa increase is responsible that pro-drug is largely un-protonated until pH 7.6 thus decreased the solubility at 7.4 but increased the permeability over a wider range of the physiological relevant pH compared to BGG492, which is uncharged merely up to pH 6.7. This resulted in a higher permeation of the pro-drug compared to BGG492 and the TBPH when applied in the same concentration below the saturation solubility of the pro-drug. The second experiment with suspensions indicates a concentration dependent permeability of BGG492. In presence of TBPH, the dissolved concentration of BGG492 is increased which resulted in the highest permeability and validates the assumption that the flux through a membrane correlates whit the dissolved amount of compound. Further details are available in “Ionic liquid versus Pro-drug Strategy to Address Formulation” (84). The findings correlate with the BCS classification (2) as well with other literature (9; 15; 106).
MERGE PHYSICOCHEMISTRY AND TECHNOLOGY: MELTEXTRUSION
The polymer systems were successfully assessed and the principles had to be evolved regarding future industrialization. Since the estimated human dose is in the range of a few 100 mg, meltextrusion is a suitable process but brings along drawbacks related to the compound: its high melting point of 260 °C. Therefore, it was investigated with DSC if the compound and polymer can be molten together to a single phasic amorphous solid dispersion (52; 86; 87). The results suggested that starting from crystalline material needs a fusion temperature of 260 °C, whereas starting from amorphous material reduces the temperature to obtain an amorphous solid dispersion from 260 °C to 230 °C. Most melt extrusion polymers cannot handle these high temperatures except Soluplus (86). The high temperatures which were needed for obtaining a solid dispersion by melting the substances together were not suitable for melt extrusion. Thus, different plasticizers were investigated on the capability of reducing the needed temperature for the melting below 200 °C. The limit of 200 °C was set according to the maximal applicable temperature for the melt extruder and polymers. None of the classical softeners (86) used for meltextrusion could lower the temperature for melting the neutral compound into the polymer. The screening was enlarged to small organic molecules with similar functional groups as the compound. Nicotinamide salicylic acid, 4-aminobenzoic acid, benzoic acid and ethyl-vanillin suppressed the melting point completely. Based on literature review, nicotinamide has least concerning pharmaceutical activities, and was therefore chosen for further development (107). Based on the previous experiments, the solid dispersion with the same composition as the ones tested in rats were prepared and 10% nicotinamide was added as softener. The mixtures were extruded at 135 °C on a small lab scale melt extruder. It was observed that extrusion without nicotinamide was not possible at 135 °C or at 170 °C. The others mixtures with nicotinamide were extruded without difficulties and supported the previously observed results in the DSC experiments. The solid state and dispersion of the compound in the extrudate was investigated with SEM-EDX, XRPD and DSC. It was observed that the compound formed agglomerates and is not molecularly dispersed. Based on the XRPD the solid state of the agglomerates was crystalline. This led to the conclusion that the API formed a crystalline solid dispersion although no melting of crystalline material was observable in DSC
89
analysis. This discrepancy was observed before for solid dispersions (108). Possible reasons are reported limitation of resolution using DSC, (94) or overlapping thermal events (109). The performances in the supersaturation assay were measured with the in vitro dissolution test in fed state simulated fluid (FeSSIF). Also mixtures of nicotinamide and compound without polymer were prepared to evaluate the influence of nicotinamide on the solubility and supersaturation of the systems. It had only minor effects and it can be concluded that the nicotinamide solely helps to process the compound and the polymer. The performances of the melt extruded solid dispersions with polymers were factor 15 - 150 higher than the crystalline material. However, they could not reach levels as observed for the lyophilized solid dispersions. The extrudates containing 36% drug load in Kollidon VA64, Soluplus/VA64 and K30/K12 with were chosen for further evaluation in a dog PK study to assess their PK performance.
OPTIMIZATION OF MELTEXTRUSION AND UPSCALING
Since the results from the dog study indicated the need of a fully amorphous formulation, the physical mixtures of the same compositions (with nicotinamide) were measured on a hot stage XRPD plate at different temperatures to evaluate the minimal temperature to melt all components. Although hot stage XRPD investigation suggest 220 °C as the required temperature to melt all components together without shear forces, 200 °C were taken as highest possible extrusion temperature since other polymers than Kollidon VA64 and Soluplus cannot cope temperatures above 200 °C without degradation. Extrusion at 200 °C resulted in a fully amorphous solid dispersion on the small lab extruder. Samples without nicotinamide needed 220 °C processing temperature to result in an amorphous solid dispersion. The minimal temperature for obtaining non crystalline material was 200 °C independent if 9, 18 or 30% nicotinamide were added. A fully amorphous solid dispersion was achieved without nicotinamide by increasing the temperature to 220 °C. This caused more impurities from degradation of the drug substance or polymer compared with the extrudates using nicotinamide and 200 °C for extrusion. The impurities were not identified; however, the supplier investigated the stability of the used polymers at extrusion temperatures of 230°C and reported no significant degradation (86). Therefore, the likelihood that the degradation products are related to the used polymer is considered as small and the degradation products were considered to originate from the compound. The pilot scale extruder has more alternative screw designs available with special kneading elements increasing mechanical shear forces which allow lower process temperatures (52; 86). Furthermore, the barrel length is increased resulting in longer process times from feeding to extrusion allowing better mixing (87). Nicotinamide lowered the necessary process temperature for an amorphous extrudate from 205 °C to 190 °C; however, the degradation level of the different extrudates was comparable and below the maximal tolerable 0.5%. Therefore, the use of nicotinamide was not necessary anymore. The performance assessment in vitro showed that the fully amorphous systems had higher supersaturation than the crystalline solid dispersions from the small scale extruder. A comparison of the PK profiles the amorphous melt extruded formulation principle and the spray dried amorphous HPMC solid dispersion resulted in almost 100% BAV validating the in vitro assessment with in vivo data.
90
SHORT TERM STABILITY TESTING OF FINAL EXTRUDATES
The dispersed and/or amorphous state of a drug results in a higher energy level and chemical potential compared to the crystalline form which favors a state of thermodynamic instability and renders these formulations prone to recrystallization (97; 110). Molecular mobility is a key factor governing the stability of the amorphous phases, since even at very high viscosity below the glass transition temperature of the system, there is enough mobility for an amorphous system to crystallize over pharmaceutically relevant time scales (47; 94; 99). The effect of moisture on the storage stability of amorphous pharmaceuticals is also a significant concern, because it may increase drug mobility by decreasing the Tg and promote drug crystallization (43; 47; 54). Therefore, the stability of the final solid dispersion was tested under different conditions: 40 °C, 50 °C, and 80 °C in closed vials and 40 °C at 75% RH in open vials. Samples were taken at day 7, 14 and after 3 months. Water uptake in the open vials was significant based on the observed delinquency of the solid dispersions. No conversion from amorphous to crystalline compound was observed by XRPD or DSC independent from the storage conditions. Solely a slight increase in the impurities was observable after 3 months at 50 °C and 80 °C. The solid dispersion with nicotinamide had slightly increased impurity levels. However, it remained unclear if the thermal degradation arose from the nicotinamide or the compound since total unknown impurities were determined in relation to the compound. The short term stability looked promising albeit real time stability data will be necessary to confirm stability upon storage and define the shelf life of the extrudates. A tight water vapor impermeable packaging of the extrudates is recommended based on the observed deliquescence of the open stored samples.
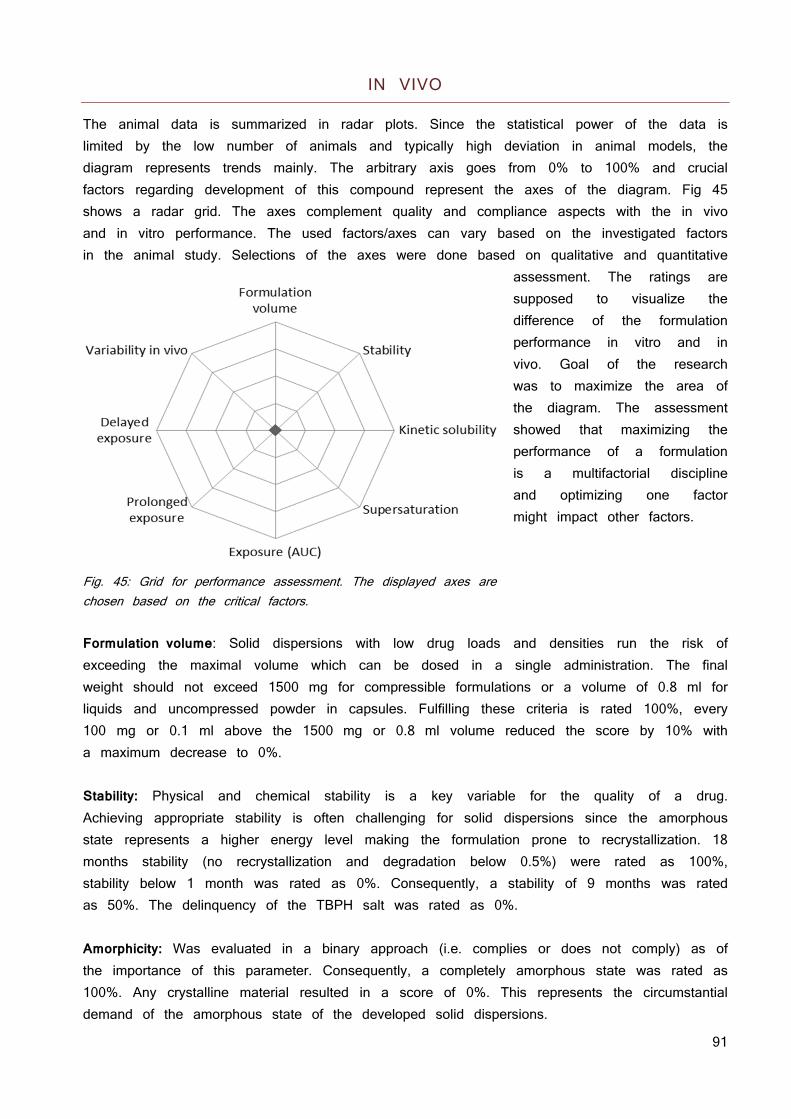
91
IN VIVO
The animal data is summarized in radar plots. Since the statistical power of the data is limited by the low number of animals and typically high deviation in animal models, the diagram represents trends mainly. The arbitrary axis goes from 0% to 100% and crucial factors regarding development of this compound represent the axes of the diagram. Fig 45 shows a radar grid. The axes complement quality and compliance aspects with the in vivo and in vitro performance. The used factors/axes can vary based on the investigated factors in the animal study. Selections of the axes were done based on qualitative and quantitative
assessment. The ratings are supposed to visualize the difference of the formulation performance in vitro and in vivo. Goal of the research was to maximize the area of the diagram. The assessment showed that maximizing the performance of a formulation is a multifactorial discipline and optimizing one factor might impact other factors.
Fig. 45: Grid for performance assessment. The displayed axes are chosen based on the critical factors. Formulation volume: Solid dispersions with low drug loads and densities run the risk of exceeding the maximal volume which can be dosed in a single administration. The final weight should not exceed 1500 mg for compressible formulations or a volume of 0.8 ml for liquids and uncompressed powder in capsules. Fulfilling these criteria is rated 100%, every 100 mg or 0.1 ml above the 1500 mg or 0.8 ml volume reduced the score by 10% with a maximum decrease to 0%. Stability: Physical and chemical stability is a key variable for the quality of a drug. Achieving appropriate stability is often challenging for solid dispersions since the amorphous state represents a higher energy level making the formulation prone to recrystallization. 18 months stability (no recrystallization and degradation below 0.5%) were rated as 100%, stability below 1 month was rated as 0%. Consequently, a stability of 9 months was rated as 50%. The delinquency of the TBPH salt was rated as 0%. Amorphicity: Was evaluated in a binary approach (i.e. complies or does not comply) as of the importance of this parameter. Consequently, a completely amorphous state was rated as 100%. Any crystalline material resulted in a score of 0%. This represents the circumstantial demand of the amorphous state of the developed solid dispersions.
92
Kinetic solubility: Represents the highest apparent solubility during solubility or supersaturation experiments. Solubility higher than 1 mg/ml was rated as 100%, 0.5 mg/ml as 50%. Values equal to or less than those observed for the thermodynamic solubility were rated as 0% Supersaturation for the acids chapter: The ability of maintaining the kinetic solubility (parachute) for a prolonged time (see chapter “Supersaturation”). Supersaturation longer than 2 hour is rated as 100%, 1 hour as 50%. Supersaturation for the neutrals chapter: The assessment of supersaturation was changed to a system where the AUC of the amount dissolved versus time was measured for the solid dispersions as well as for the crystalline material. The AUC of the solid dispersion was divided by the AUC of the crystalline reference. A resulting factor of 30 or higher was rated as 100% success, a factor of 15 as 50%. Exposure for the acids chapter:
Rats: 50% BAV is rated as 100% on the scale, no BAV as 0%. (50% BAV was the highest observed, a prominent first pass effect might be responsible) Dogs: 100% BAV is rated as 100% on the scale, no BAV as 0%.
Exposure for the neutrals chapter:
In this chapter, relative BAV (compared to HPMC SD) was used to assess the different formulations. 100% rel BAV resulted in 100% score, 0% rel BAV in 0%.
Prolonged exposure: Clinical application required a formulation allowing fewer dosing for a consistent therapeutic effect, than the initially three times per day. The rating is done based on the plasma concentration at 6 hours. When the plasma level at 6 hours exceeds 60% of Cmax, the score is rated as 100%; plasma concentration of 35% of Cmax at 6h is rated as 50% in the axis. Plasma levels below 10% of Cmax are rated as 0%. Delayed exposure: Approach to reduce dosing frequency, tmax of later than at 4 hours represents 100%, a tmax of 2 hours 50%, tmax below 1 hour is rated as 0% success. Standard deviation: High standard deviations are common in animal studies; however, less variability in animals indicates more consistent formulation performance. Variability less than 25% considered as low variability and therefore, rated as 100% score on the axis, 25 - 75% variability is considered as medium and rated as 50% on the axis. Variability higher than 75% is considered as high variability and resulted in 0% score on the axis.
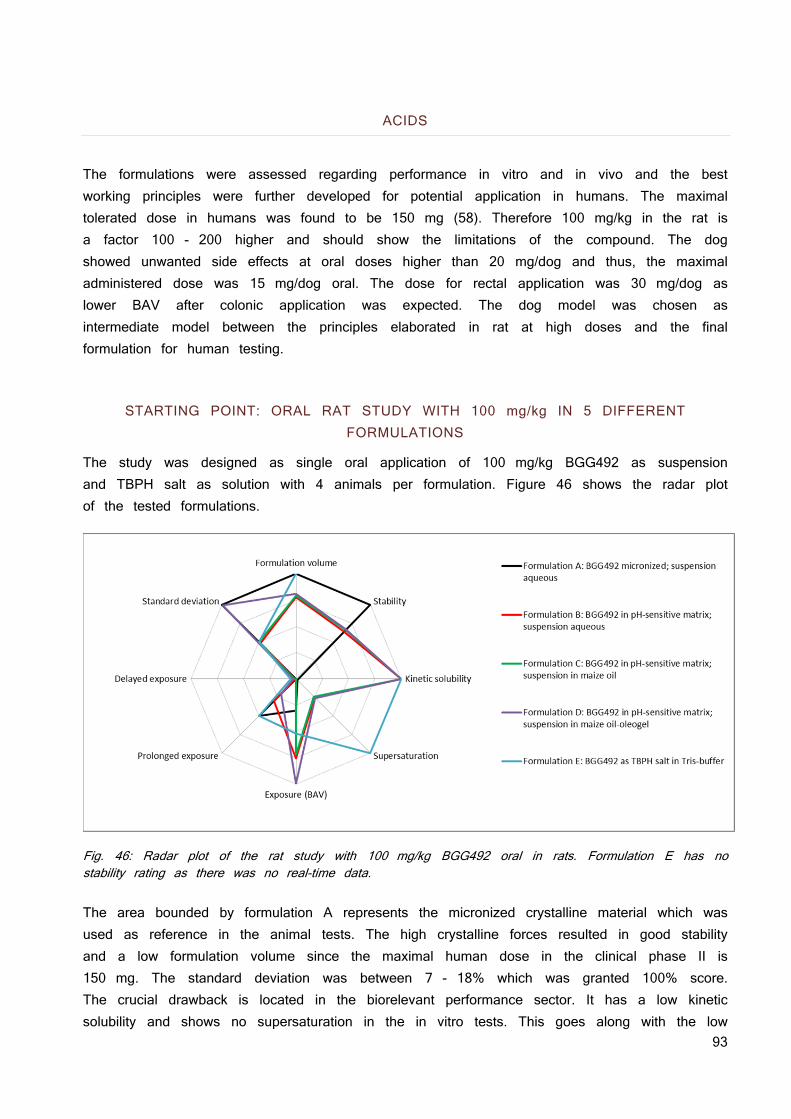
93
ACIDS
The formulations were assessed regarding performance in vitro and in vivo and the best working principles were further developed for potential application in humans. The maximal tolerated dose in humans was found to be 150 mg (58). Therefore 100 mg/kg in the rat is a factor 100 - 200 higher and should show the limitations of the compound. The dog showed unwanted side effects at oral doses higher than 20 mg/dog and thus, the maximal administered dose was 15 mg/dog oral. The dose for rectal application was 30 mg/dog as lower BAV after colonic application was expected. The dog model was chosen as intermediate model between the principles elaborated in rat at high doses and the final formulation for human testing.
STARTING POINT: ORAL RAT STUDY WITH 100 mg/kg IN 5 DIFFERENT FORMULATIONS
The study was designed as single oral application of 100 mg/kg BGG492 as suspension and TBPH salt as solution with 4 animals per formulation. Figure 46 shows the radar plot of the tested formulations.
Fig. 46: Radar plot of the rat study with 100 mg/kg BGG492 oral in rats. Formulation E has no stability rating as there was no real-time data. The area bounded by formulation A represents the micronized crystalline material which was used as reference in the animal tests. The high crystalline forces resulted in good stability and a low formulation volume since the maximal human dose in the clinical phase II is 150 mg. The standard deviation was between 7 - 18% which was granted 100% score. The crucial drawback is located in the biorelevant performance sector. It has a low kinetic solubility and shows no supersaturation in the in vitro tests. This goes along with the low
94
exposure observed at the 100 mg/kg dosing level. Formulation B had an estimated formulation volume of 1 ml. The real time stability data at RT showed no recrystallization or degradation at 12 months but weak signals of crystallized compound after 18 months. It has a high kinetic solubility but the high kinetic solubility is not stabilized and just a short time of supersaturation was observed. Nevertheless the high kinetic solubility resulted in a significant 2 fold increase in exposure compared to formulation A. Plasma concentration after 6 hours was still 20% of the Cmax which was rated as 30% success regarding prolonged exposure of formulation B. The tmax was 15 minutes and, therefore, no delayed exposure was achieved. The standard deviation was between 33 and 63% and, therefore, not as good as the one observed for formulation A. Formulation C and D are almost congruent to B. Formulation D shows a short delay of tmax and a reduced Cmax which were positively rated for prolonged and delayed exposure. Formulation E was rated 100% in formulation volume since the density of the TBPH was higher than the density of water and the volume of the human dose would not exceed 0.8 ml. There was no long term stability data available, therefore, there is no rating for the stability; however, short term stability at elevated conditions were promising (data not shown). The kinetic solubility of the TBPH salt was observed to be around 25 mg/ml which was the highest observed solubility overall and rated with 100%. Unfortunately the high solubility is lost when the TBPH salt is exposed to low pH environment such as the stomach, therefore the TBPH was administered in a buffer assuming the high solubility is persistent which was rated as 100% regarding the supersaturation. The exposure was lower compared to the other formulations, which was surprising since solutions tend to have the highest BAV in principle as they provide the compound already dissolved. The rating for prolonged and delayed exposure is equivalent with the one from formulation A. The deviation was low which was granted with a high score. No clinical sings of toxicity were observed for the TBPH salt; therefore it can be safely used in rats at doses of 40 mg/kg.
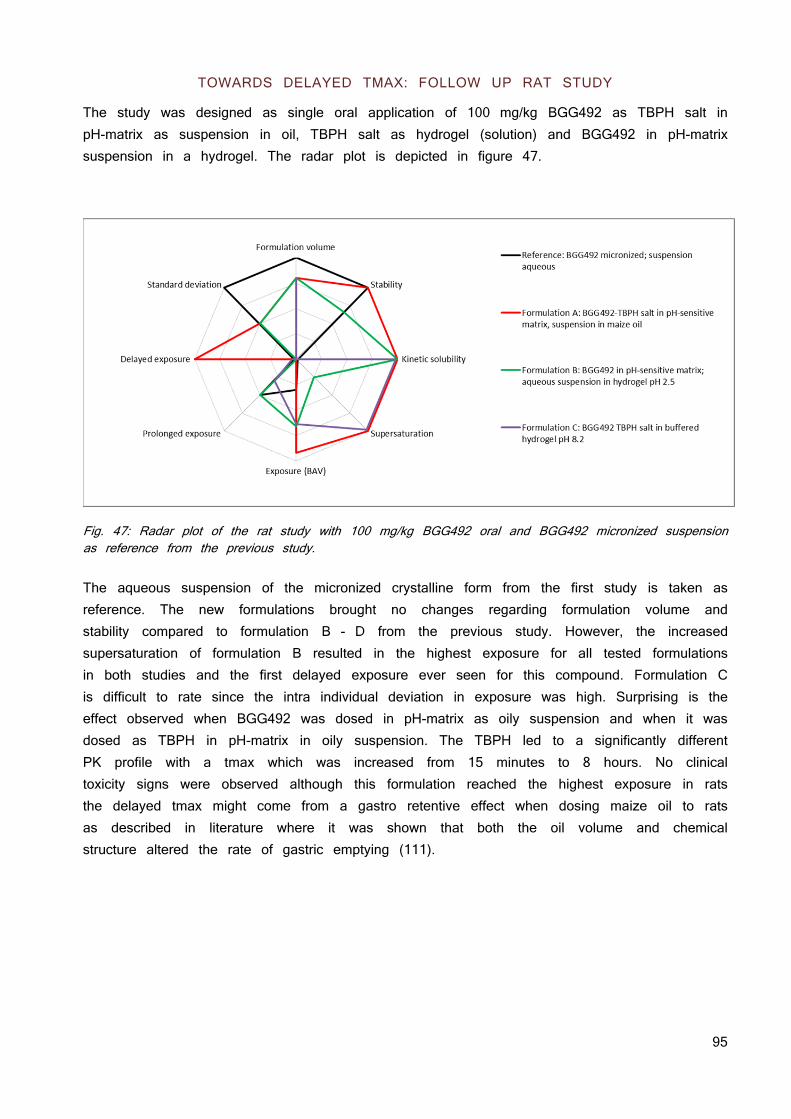
95
TOWARDS DELAYED TMAX: FOLLOW UP RAT STUDY
The study was designed as single oral application of 100 mg/kg BGG492 as TBPH salt in pH-matrix as suspension in oil, TBPH salt as hydrogel (solution) and BGG492 in pH-matrix suspension in a hydrogel. The radar plot is depicted in figure 47.
Fig. 47: Radar plot of the rat study with 100 mg/kg BGG492 oral and BGG492 micronized suspension as reference from the previous study. The aqueous suspension of the micronized crystalline form from the first study is taken as reference. The new formulations brought no changes regarding formulation volume and stability compared to formulation B - D from the previous study. However, the increased supersaturation of formulation B resulted in the highest exposure for all tested formulations in both studies and the first delayed exposure ever seen for this compound. Formulation C is difficult to rate since the intra individual deviation in exposure was high. Surprising is the effect observed when BGG492 was dosed in pH-matrix as oily suspension and when it was dosed as TBPH in pH-matrix in oily suspension. The TBPH led to a significantly different PK profile with a tmax which was increased from 15 minutes to 8 hours. No clinical toxicity signs were observed although this formulation reached the highest exposure in rats the delayed tmax might come from a gastro retentive effect when dosing maize oil to rats as described in literature where it was shown that both the oil volume and chemical structure altered the rate of gastric emptying (111).
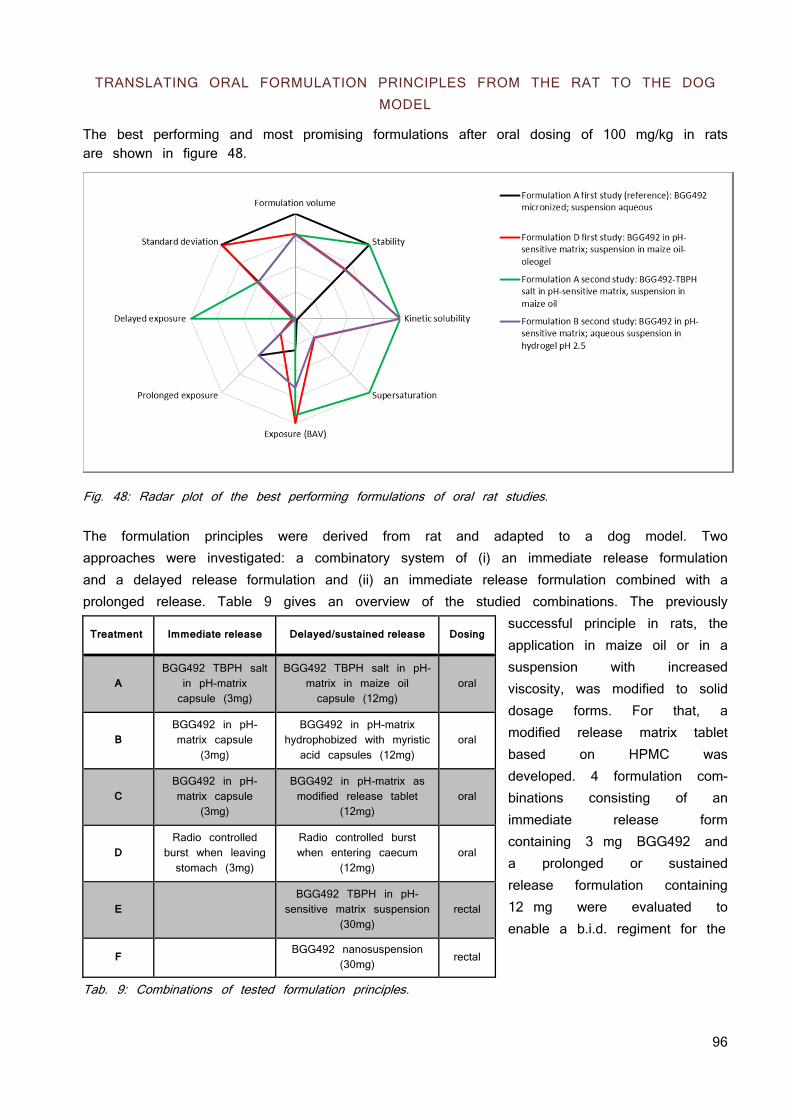
96
TRANSLATING ORAL FORMULATION PRINCIPLES FROM THE RAT TO THE DOG MODEL
The best performing and most promising formulations after oral dosing of 100 mg/kg in rats are shown in figure 48.
Fig. 48: Radar plot of the best performing formulations of oral rat studies. The formulation principles were derived from rat and adapted to a dog model. Two approaches were investigated: a combinatory system of (i) an immediate release formulation and a delayed release formulation and (ii) an immediate release formulation combined with a prolonged release. Table 9 gives an overview of the studied combinations. The previously
successful principle in rats, the application in maize oil or in a suspension with increased viscosity, was modified to solid dosage forms. For that, a modified release matrix tablet based on HPMC was developed. 4 formulation com-binations consisting of an immediate release form containing 3 mg BGG492 and a prolonged or sustained release formulation containing 12 mg were evaluated to enable a b.i.d. regiment for the
Tab. 9: Combinations of tested formulation principles.
Treatment Immediate release Delayed/sustained release Dosing
A BGG492 TBPH salt
in pH-matrix capsule (3mg)
BGG492 TBPH salt in pH-matrix in maize oil capsule (12mg)
oral
B BGG492 in pH-matrix capsule
(3mg)
BGG492 in pH-matrix hydrophobized with myristic acid capsules (12mg)
oral
C BGG492 in pH-matrix capsule
(3mg)
BGG492 in pH-matrix as modified release tablet
(12mg) oral
D Radio controlled
burst when leaving stomach (3mg)
Radio controlled burst when entering caecum
(12mg) oral
E
BGG492 TBPH in pH-sensitive matrix suspension
(30mg) rectal
F BGG492 nanosuspension
(30mg) rectal
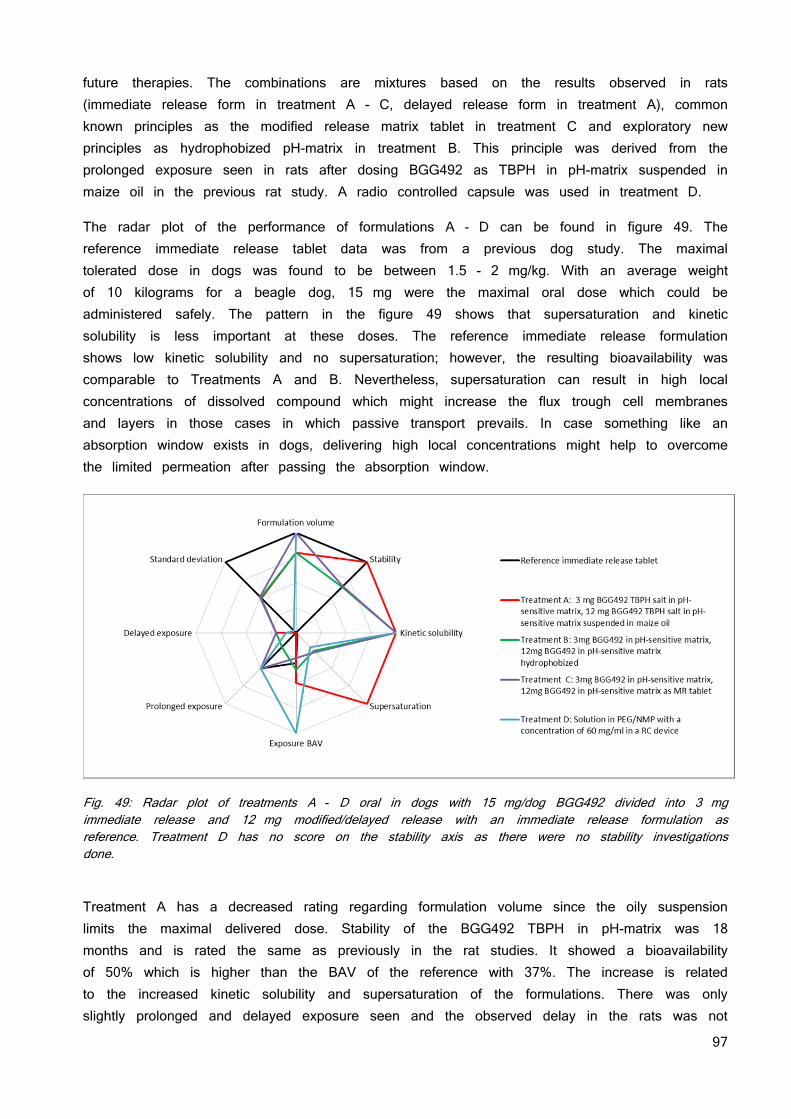
97
future therapies. The combinations are mixtures based on the results observed in rats (immediate release form in treatment A - C, delayed release form in treatment A), common known principles as the modified release matrix tablet in treatment C and exploratory new principles as hydrophobized pH-matrix in treatment B. This principle was derived from the prolonged exposure seen in rats after dosing BGG492 as TBPH in pH-matrix suspended in maize oil in the previous rat study. A radio controlled capsule was used in treatment D.
The radar plot of the performance of formulations A - D can be found in figure 49. The reference immediate release tablet data was from a previous dog study. The maximal tolerated dose in dogs was found to be between 1.5 - 2 mg/kg. With an average weight of 10 kilograms for a beagle dog, 15 mg were the maximal oral dose which could be administered safely. The pattern in the figure 49 shows that supersaturation and kinetic solubility is less important at these doses. The reference immediate release formulation shows low kinetic solubility and no supersaturation; however, the resulting bioavailability was comparable to Treatments A and B. Nevertheless, supersaturation can result in high local concentrations of dissolved compound which might increase the flux trough cell membranes and layers in those cases in which passive transport prevails. In case something like an absorption window exists in dogs, delivering high local concentrations might help to overcome the limited permeation after passing the absorption window.
Fig. 49: Radar plot of treatments A - D oral in dogs with 15 mg/dog BGG492 divided into 3 mg immediate release and 12 mg modified/delayed release with an immediate release formulation as reference. Treatment D has no score on the stability axis as there were no stability investigations done.
Treatment A has a decreased rating regarding formulation volume since the oily suspension limits the maximal delivered dose. Stability of the BGG492 TBPH in pH-matrix was 18 months and is rated the same as previously in the rat studies. It showed a bioavailability of 50% which is higher than the BAV of the reference with 37%. The increase is related to the increased kinetic solubility and supersaturation of the formulations. There was only slightly prolonged and delayed exposure seen and the observed delay in the rats was not
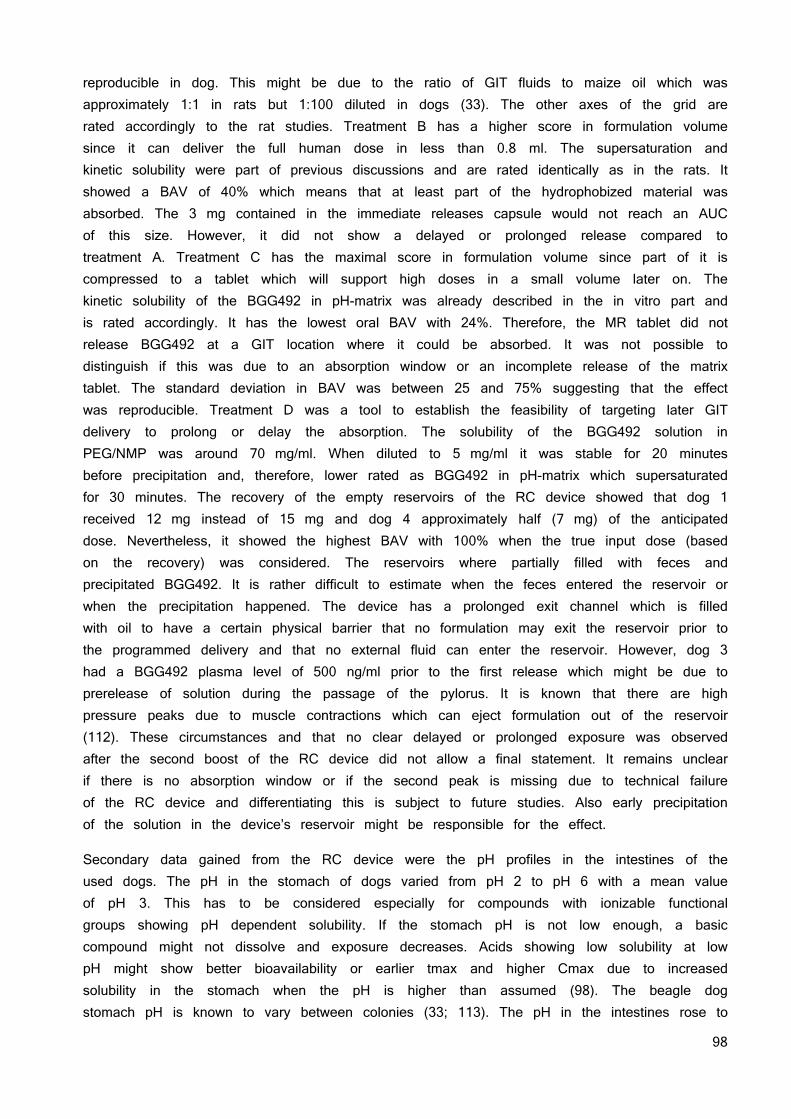
98
reproducible in dog. This might be due to the ratio of GIT fluids to maize oil which was approximately 1:1 in rats but 1:100 diluted in dogs (33). The other axes of the grid are rated accordingly to the rat studies. Treatment B has a higher score in formulation volume since it can deliver the full human dose in less than 0.8 ml. The supersaturation and kinetic solubility were part of previous discussions and are rated identically as in the rats. It showed a BAV of 40% which means that at least part of the hydrophobized material was absorbed. The 3 mg contained in the immediate releases capsule would not reach an AUC of this size. However, it did not show a delayed or prolonged release compared to treatment A. Treatment C has the maximal score in formulation volume since part of it is compressed to a tablet which will support high doses in a small volume later on. The kinetic solubility of the BGG492 in pH-matrix was already described in the in vitro part and is rated accordingly. It has the lowest oral BAV with 24%. Therefore, the MR tablet did not release BGG492 at a GIT location where it could be absorbed. It was not possible to distinguish if this was due to an absorption window or an incomplete release of the matrix tablet. The standard deviation in BAV was between 25 and 75% suggesting that the effect was reproducible. Treatment D was a tool to establish the feasibility of targeting later GIT delivery to prolong or delay the absorption. The solubility of the BGG492 solution in PEG/NMP was around 70 mg/ml. When diluted to 5 mg/ml it was stable for 20 minutes before precipitation and, therefore, lower rated as BGG492 in pH-matrix which supersaturated for 30 minutes. The recovery of the empty reservoirs of the RC device showed that dog 1 received 12 mg instead of 15 mg and dog 4 approximately half (7 mg) of the anticipated dose. Nevertheless, it showed the highest BAV with 100% when the true input dose (based on the recovery) was considered. The reservoirs where partially filled with feces and precipitated BGG492. It is rather difficult to estimate when the feces entered the reservoir or when the precipitation happened. The device has a prolonged exit channel which is filled with oil to have a certain physical barrier that no formulation may exit the reservoir prior to the programmed delivery and that no external fluid can enter the reservoir. However, dog 3 had a BGG492 plasma level of 500 ng/ml prior to the first release which might be due to prerelease of solution during the passage of the pylorus. It is known that there are high pressure peaks due to muscle contractions which can eject formulation out of the reservoir (112). These circumstances and that no clear delayed or prolonged exposure was observed after the second boost of the RC device did not allow a final statement. It remains unclear if there is no absorption window or if the second peak is missing due to technical failure of the RC device and differentiating this is subject to future studies. Also early precipitation of the solution in the device’s reservoir might be responsible for the effect.
Secondary data gained from the RC device were the pH profiles in the intestines of the used dogs. The pH in the stomach of dogs varied from pH 2 to pH 6 with a mean value of pH 3. This has to be considered especially for compounds with ionizable functional groups showing pH dependent solubility. If the stomach pH is not low enough, a basic compound might not dissolve and exposure decreases. Acids showing low solubility at low pH might show better bioavailability or earlier tmax and higher Cmax due to increased solubility in the stomach when the pH is higher than assumed (98). The beagle dog stomach pH is known to vary between colonies (33; 113). The pH in the intestines rose to
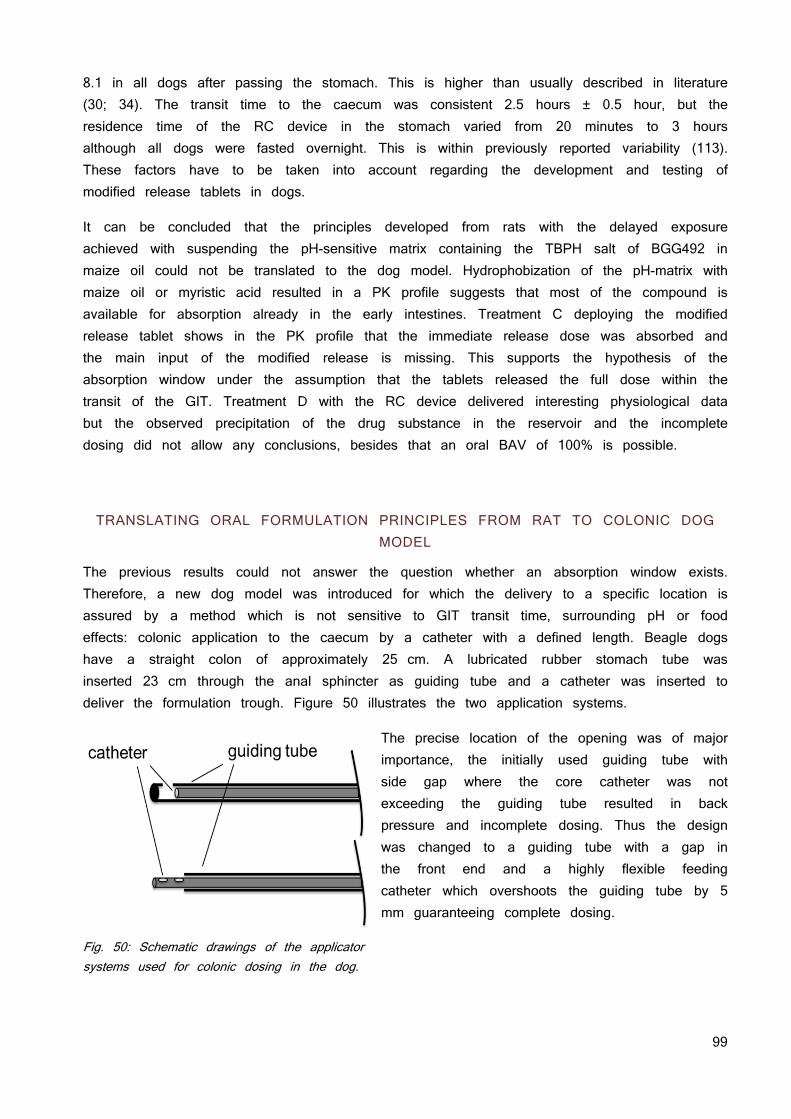
99
8.1 in all dogs after passing the stomach. This is higher than usually described in literature (30; 34). The transit time to the caecum was consistent 2.5 hours ± 0.5 hour, but the residence time of the RC device in the stomach varied from 20 minutes to 3 hours although all dogs were fasted overnight. This is within previously reported variability (113). These factors have to be taken into account regarding the development and testing of modified release tablets in dogs.
It can be concluded that the principles developed from rats with the delayed exposure achieved with suspending the pH-sensitive matrix containing the TBPH salt of BGG492 in maize oil could not be translated to the dog model. Hydrophobization of the pH-matrix with maize oil or myristic acid resulted in a PK profile suggests that most of the compound is available for absorption already in the early intestines. Treatment C deploying the modified release tablet shows in the PK profile that the immediate release dose was absorbed and the main input of the modified release is missing. This supports the hypothesis of the absorption window under the assumption that the tablets released the full dose within the transit of the GIT. Treatment D with the RC device delivered interesting physiological data but the observed precipitation of the drug substance in the reservoir and the incomplete dosing did not allow any conclusions, besides that an oral BAV of 100% is possible.
TRANSLATING ORAL FORMULATION PRINCIPLES FROM RAT TO COLONIC DOG MODEL
The previous results could not answer the question whether an absorption window exists. Therefore, a new dog model was introduced for which the delivery to a specific location is assured by a method which is not sensitive to GIT transit time, surrounding pH or food effects: colonic application to the caecum by a catheter with a defined length. Beagle dogs have a straight colon of approximately 25 cm. A lubricated rubber stomach tube was inserted 23 cm through the anal sphincter as guiding tube and a catheter was inserted to deliver the formulation trough. Figure 50 illustrates the two application systems.
The precise location of the opening was of major importance, the initially used guiding tube with side gap where the core catheter was not exceeding the guiding tube resulted in back pressure and incomplete dosing. Thus the design was changed to a guiding tube with a gap in the front end and a highly flexible feeding catheter which overshoots the guiding tube by 5 mm guaranteeing complete dosing.
Fig. 50: Schematic drawings of the applicator systems used for colonic dosing in the dog.
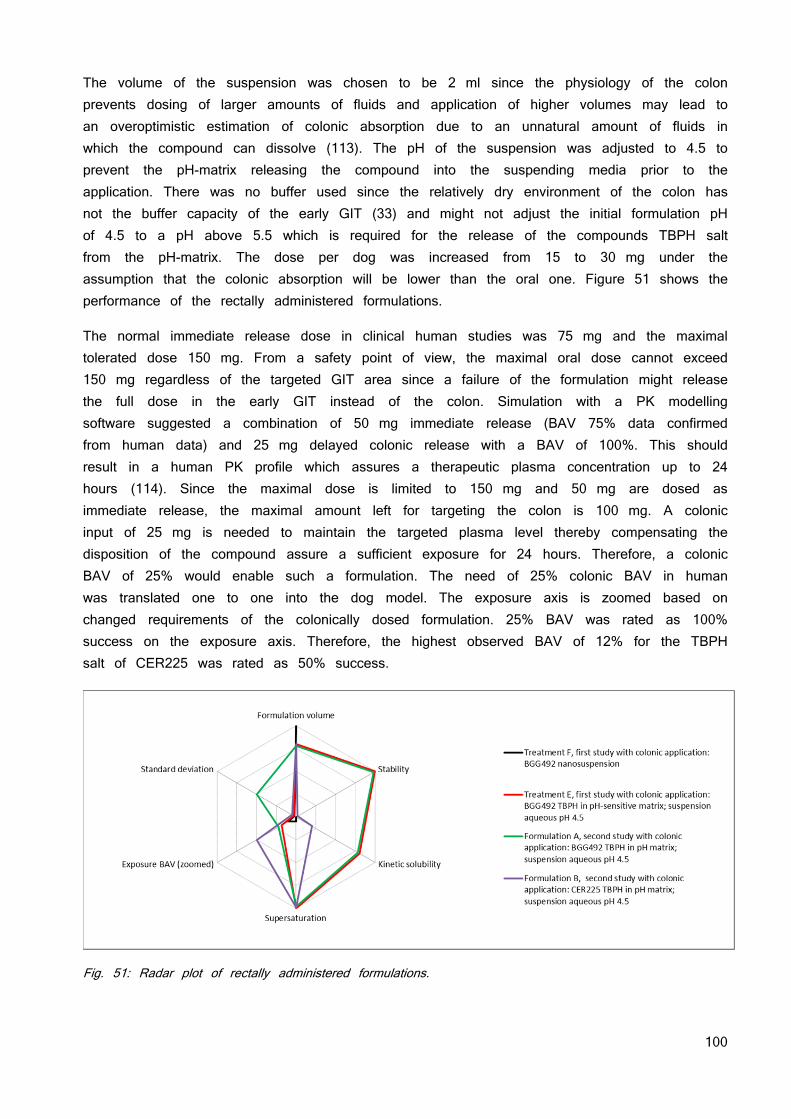
100
The volume of the suspension was chosen to be 2 ml since the physiology of the colon prevents dosing of larger amounts of fluids and application of higher volumes may lead to an overoptimistic estimation of colonic absorption due to an unnatural amount of fluids in which the compound can dissolve (113). The pH of the suspension was adjusted to 4.5 to prevent the pH-matrix releasing the compound into the suspending media prior to the application. There was no buffer used since the relatively dry environment of the colon has not the buffer capacity of the early GIT (33) and might not adjust the initial formulation pH of 4.5 to a pH above 5.5 which is required for the release of the compounds TBPH salt from the pH-matrix. The dose per dog was increased from 15 to 30 mg under the assumption that the colonic absorption will be lower than the oral one. Figure 51 shows the performance of the rectally administered formulations.
The normal immediate release dose in clinical human studies was 75 mg and the maximal tolerated dose 150 mg. From a safety point of view, the maximal oral dose cannot exceed 150 mg regardless of the targeted GIT area since a failure of the formulation might release the full dose in the early GIT instead of the colon. Simulation with a PK modelling software suggested a combination of 50 mg immediate release (BAV 75% data confirmed from human data) and 25 mg delayed colonic release with a BAV of 100%. This should result in a human PK profile which assures a therapeutic plasma concentration up to 24 hours (114). Since the maximal dose is limited to 150 mg and 50 mg are dosed as immediate release, the maximal amount left for targeting the colon is 100 mg. A colonic input of 25 mg is needed to maintain the targeted plasma level thereby compensating the disposition of the compound assure a sufficient exposure for 24 hours. Therefore, a colonic BAV of 25% would enable such a formulation. The need of 25% colonic BAV in human was translated one to one into the dog model. The exposure axis is zoomed based on changed requirements of the colonically dosed formulation. 25% BAV was rated as 100% success on the exposure axis. Therefore, the highest observed BAV of 12% for the TBPH salt of CER225 was rated as 50% success.
Fig. 51: Radar plot of rectally administered formulations.
101
The nanosuspension (treatment F) was used as reference since it was given a higher chance to see absorption than from a conventional suspension based on the increased surface as of the decreased particle size. It shows low performance in vivo. 2 dogs out of 4 showed no exposure and the average BAV was 0.8%. The rating regarding standard deviation is low for the formulations F, E and A based on the deviations which were higher than their mean values. Formulation B showed variability between 60 and 74% which was rated as 50% success on the axis. In general, there was no significant difference in AUC, Cmax or tmax and only trends are discussed here. Treatment E and A were identical formulations, only the application method was improved with the modified application components described in figure 50. It was concluded that the modified application device had no influence on the result.
The TBPH salt in the pH-sensitive matrix showed a BAV of 4% which is a 5 fold increase compared to the BGG492 nanosuspension reference. This was considered as 18% success regarding the BAV axis in the spider plot. Formulation B with the acetylated pro-drug of BGG492 was prone to degradation. Hydrolytic elimination of the acetate resulting in the parent compound. As 6.5% BGG492 were found in the CER255 formulation, its stability was rated as 0% success. The CER225 has a modified pKa value of 7.6 compared to 6.7 of BGG492 which resulted in lower solubility as the parent compound. However, it showed comparable supersaturation behavior and the highest BAV with 12%. This is in accordance with the Caco2 data which showed an increased permeation of CER225 compared to BGG492. All formulations showed a correlation between defecation prior to 60 minutes and decreased exposure thus the variability can partially be related to it. The two dogs with the lowest exposure were the 2 dogs defecating after 13 and 20 minutes. It was unclear if defecation resulted by coincidence, as reaction of the manipulation in the colon when dosing the formulation or if it was related to the compounds pharmacodynamic properties.
The hypothesis of the absorption window after oral application was not proven nor disproven due to technical issues. Colonic application showed almost no absorption for the nanosuspension; hence a conventional formulation or nanosuspension targeting the colon is not feasible. When administered as TBPH salt or CER225 TBPH salt in pH-matrix, the colonic BAV was still low compared to oral BAV but could be increased by factor 5 for the BGG492 TBPH in pH-matrix with 4% BAV and by factor 15 for the CER225 TBPH in pH-matrix with 12% BAV. The needed 25% colonic BAV were not met but the low lattice force approach showed superior BAV also under conditions where the absorption of crystalline nanosized form is almost absent.
Although the specific primary goals of the animal studies were not met, the approach with lowering the lattice forces by solid dispersion and formation of new salts showed its justification. Solid dispersion with a pH-sensitive matrix increased the BAV by factor 3 - 4 at doses of 100 mg/kg in rats and decreased the tmax from 3 hours to 15 minutes. This opens new indications such as acute migraine therapy where a rapid onset of action is desired. The mechanism behind this performance is linked to the high kinetic solubility of the amorphous solid dispersion compared to the micronized but crystalline free acid. Lowering the lattice forces by applying the concept of ionic liquid resulted in superior
102
dissolution, solubility and an increase of BAV by factor 2 at high doses in rat. However, since the TBPH salt was prone to precipitation at acidic pH environment in the stomach, it was combined with the solid dispersion principle with a pH-sensitive matrix polymer which resulted in a BAV increase of factor 4. On a mechanistically level, the observed supersaturation behavior of the TBPH salt in pH-matrix may be correlated to the superior performance. Whereas the compound in a solid dispersion showed a high kinetic solubility which is stable in the range of minutes, the TBPH salt solid dispersion showed supersaturation in the range of hours.
In dogs, the oral administered dose was too low to see a major difference between the different formulation principles since the free acid showed good results already. This changed as the principles were delivered into the colon. The nanosuspension of the crystalline form showed exposure under the limit of quantification in 2 animals out of 4 and the average BAV was 0.8%. The TBPH salt in pH-matrix showed a 5 fold increase and the TBPH salt of CER225 showed a 15 fold increase in BAV. This results and the absence of clinical signs of toxicology so far qualifies the new salt form for further investigations in combination with other acidic compounds on one hand and demands the clinical investigation of its toxicology profile on the other hand.
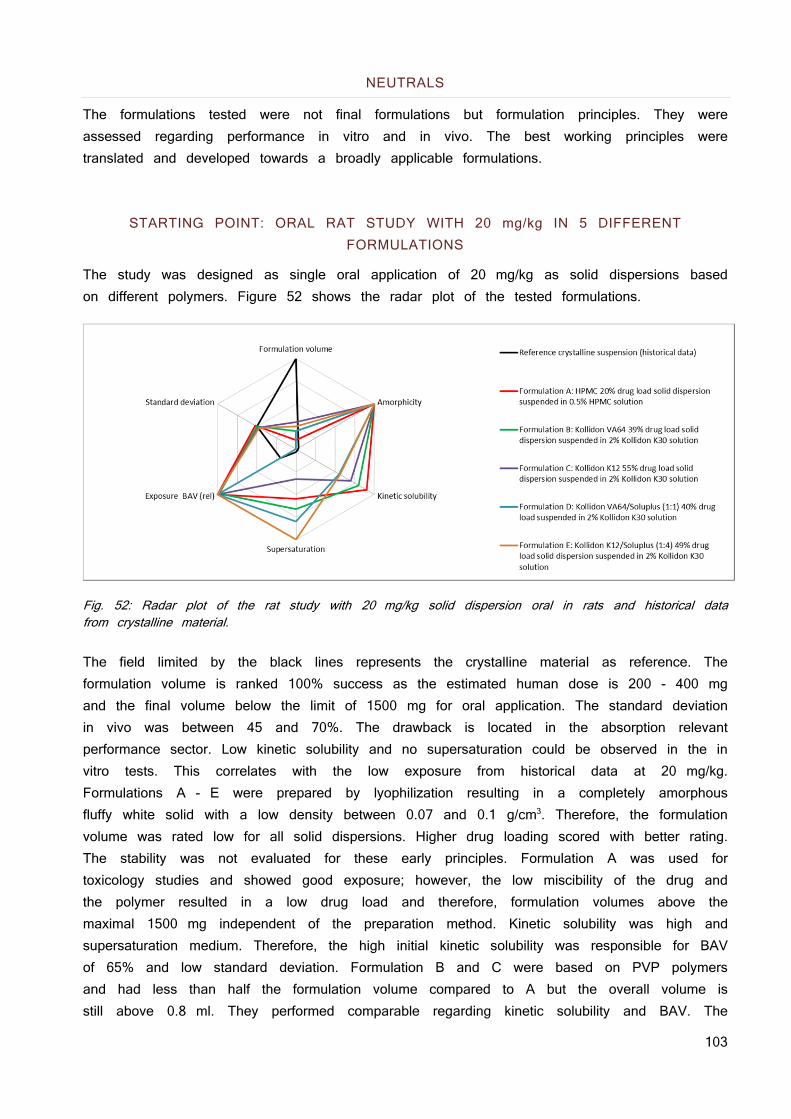
103
NEUTRALS
The formulations tested were not final formulations but formulation principles. They were assessed regarding performance in vitro and in vivo. The best working principles were translated and developed towards a broadly applicable formulations.
STARTING POINT: ORAL RAT STUDY WITH 20 mg/kg IN 5 DIFFERENT FORMULATIONS
The study was designed as single oral application of 20 mg/kg as solid dispersions based on different polymers. Figure 52 shows the radar plot of the tested formulations.
Fig. 52: Radar plot of the rat study with 20 mg/kg solid dispersion oral in rats and historical data from crystalline material. The field limited by the black lines represents the crystalline material as reference. The formulation volume is ranked 100% success as the estimated human dose is 200 - 400 mg and the final volume below the limit of 1500 mg for oral application. The standard deviation in vivo was between 45 and 70%. The drawback is located in the absorption relevant performance sector. Low kinetic solubility and no supersaturation could be observed in the in vitro tests. This correlates with the low exposure from historical data at 20 mg/kg. Formulations A - E were prepared by lyophilization resulting in a completely amorphous fluffy white solid with a low density between 0.07 and 0.1 g/cm3. Therefore, the formulation volume was rated low for all solid dispersions. Higher drug loading scored with better rating. The stability was not evaluated for these early principles. Formulation A was used for toxicology studies and showed good exposure; however, the low miscibility of the drug and the polymer resulted in a low drug load and therefore, formulation volumes above the maximal 1500 mg independent of the preparation method. Kinetic solubility was high and supersaturation medium. Therefore, the high initial kinetic solubility was responsible for BAV of 65% and low standard deviation. Formulation B and C were based on PVP polymers and had less than half the formulation volume compared to A but the overall volume is still above 0.8 ml. They performed comparable regarding kinetic solubility and BAV. The
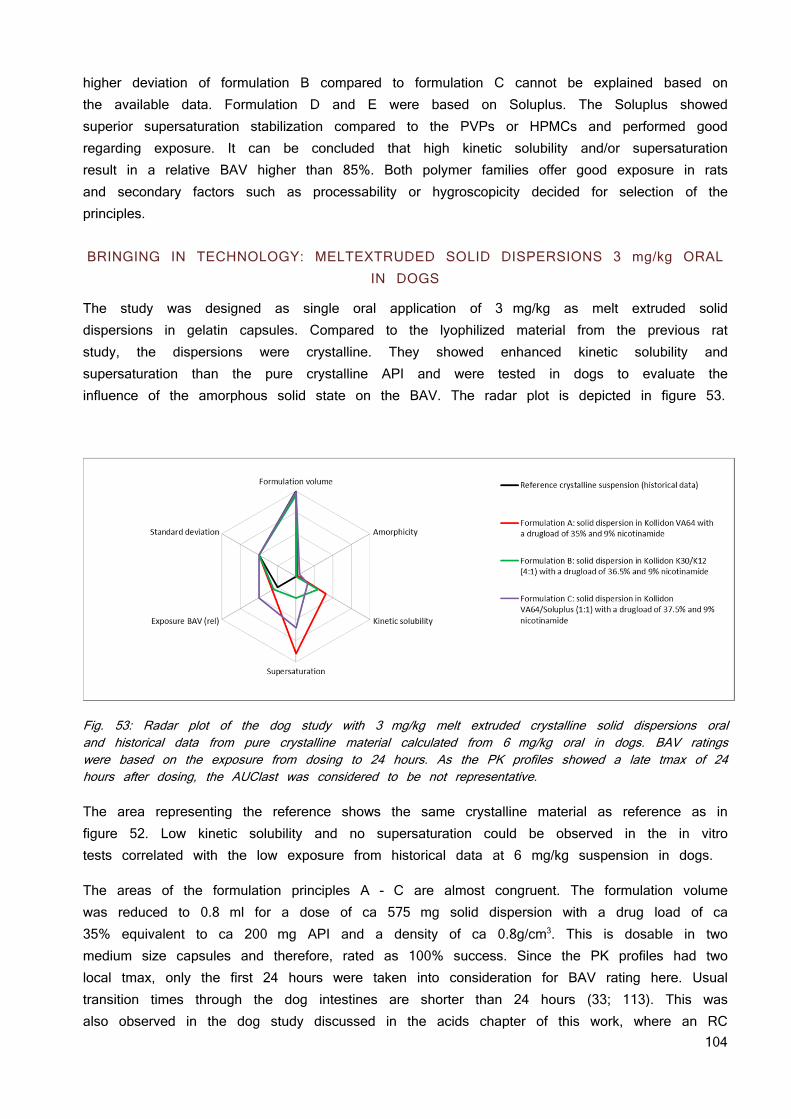
104
higher deviation of formulation B compared to formulation C cannot be explained based on the available data. Formulation D and E were based on Soluplus. The Soluplus showed superior supersaturation stabilization compared to the PVPs or HPMCs and performed good regarding exposure. It can be concluded that high kinetic solubility and/or supersaturation result in a relative BAV higher than 85%. Both polymer families offer good exposure in rats and secondary factors such as processability or hygroscopicity decided for selection of the principles.
BRINGING IN TECHNOLOGY: MELTEXTRUDED SOLID DISPERSIONS 3 mg/kg ORAL IN DOGS
The study was designed as single oral application of 3 mg/kg as melt extruded solid dispersions in gelatin capsules. Compared to the lyophilized material from the previous rat study, the dispersions were crystalline. They showed enhanced kinetic solubility and supersaturation than the pure crystalline API and were tested in dogs to evaluate the influence of the amorphous solid state on the BAV. The radar plot is depicted in figure 53.
Fig. 53: Radar plot of the dog study with 3 mg/kg melt extruded crystalline solid dispersions oral and historical data from pure crystalline material calculated from 6 mg/kg oral in dogs. BAV ratings were based on the exposure from dosing to 24 hours. As the PK profiles showed a late tmax of 24 hours after dosing, the AUClast was considered to be not representative. The area representing the reference shows the same crystalline material as reference as in figure 52. Low kinetic solubility and no supersaturation could be observed in the in vitro tests correlated with the low exposure from historical data at 6 mg/kg suspension in dogs.
The areas of the formulation principles A - C are almost congruent. The formulation volume was reduced to 0.8 ml for a dose of ca 575 mg solid dispersion with a drug load of ca 35% equivalent to ca 200 mg API and a density of ca 0.8g/cm3. This is dosable in two medium size capsules and therefore, rated as 100% success. Since the PK profiles had two local tmax, only the first 24 hours were taken into consideration for BAV rating here. Usual transition times through the dog intestines are shorter than 24 hours (33; 113). This was also observed in the dog study discussed in the acids chapter of this work, where an RC
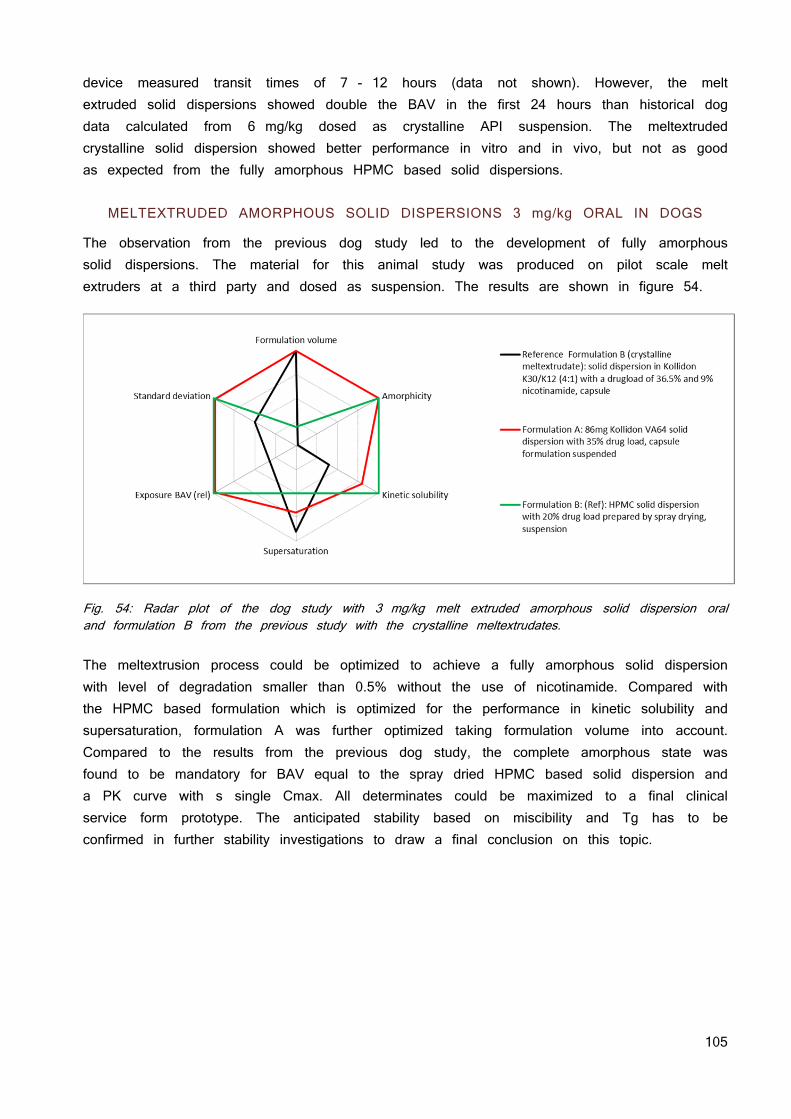
105
device measured transit times of 7 - 12 hours (data not shown). However, the melt extruded solid dispersions showed double the BAV in the first 24 hours than historical dog data calculated from 6 mg/kg dosed as crystalline API suspension. The meltextruded crystalline solid dispersion showed better performance in vitro and in vivo, but not as good as expected from the fully amorphous HPMC based solid dispersions.
MELTEXTRUDED AMORPHOUS SOLID DISPERSIONS 3 mg/kg ORAL IN DOGS
The observation from the previous dog study led to the development of fully amorphous solid dispersions. The material for this animal study was produced on pilot scale melt extruders at a third party and dosed as suspension. The results are shown in figure 54.
Fig. 54: Radar plot of the dog study with 3 mg/kg melt extruded amorphous solid dispersion oral and formulation B from the previous study with the crystalline meltextrudates. The meltextrusion process could be optimized to achieve a fully amorphous solid dispersion with level of degradation smaller than 0.5% without the use of nicotinamide. Compared with the HPMC based formulation which is optimized for the performance in kinetic solubility and supersaturation, formulation A was further optimized taking formulation volume into account. Compared to the results from the previous dog study, the complete amorphous state was found to be mandatory for BAV equal to the spray dried HPMC based solid dispersion and a PK curve with s single Cmax. All determinates could be maximized to a final clinical service form prototype. The anticipated stability based on miscibility and Tg has to be confirmed in further stability investigations to draw a final conclusion on this topic.
106
SUMMARY
Lattice forces are based on the attraction between the single moieties of molecules. The strength of lattice forces has an impact on the solid state and related physical properties such as melting point, boiling point, vapor pressure solvation and solubility. For solvation to occur, energy is required to break the lattice forces attracting ions and molecules among themselves. The energy for breaking up the attraction between the molecules is gained from the energy released when ions or molecules of the lattice associate with molecules of the solvent. Solubility is therefore, directly linked to the energy which is required to break the lattice forces and the energy which is liberated by solvation of the molecules or ions. Based on this relation, the lattice forces in two acidic compounds and a neutral compound were subsequently lowered by different approaches with the intention to increase the solubility, supersaturation, and dissolution rate.
The conversion to an ionic liquid and the embedding of the compound in a pH-sensitive matrix in an amorphous state were investigated with an acidic compound and its pro-drug. The tetrabutylphosphonium (TBPH) salt showed the most promising properties among the tested counter ions. It alters the properties of the compound from a highly crystalline physicochemical state to an amorphous readily soluble material showing supersaturation in a wider pH range and higher solubility than the sodium and potassium salts. A solid dispersion approach was developed in parallel. Solid dispersions with two different pH-sensitive polymers and different drug load were prepared by lyophilization to determine the miscibility of the compound and the polymer by differential scanning calorimetry (DSC). A miscibility of 50% of the amorphous acid with the pH-sensitive Eudragit L100-55 matrix and a miscibility of 40% with hydroxypropyl methylcellulose acetate succinate (HPMC-AS) was found. Both approaches, the TBPH salt and the solid dispersion based on the pH-sensitive Eudragit L100-55 were tested in vivo. The TBPH salt was dosed in a buffered solution to prevent precipitation in the acidic stomach pH. This resulted in BAV higher than the crystalline suspension but lower than the solid dispersion. There were no acute toxicology effects seen. Thus, TBPH was considered safe for further studies. The TBPH salts were very hygroscopic, sticky and prone to precipitation as free compound when exposed to low pH when simulating the passage through the stomach. Thus, the principle of the ionic liquid was combined with the principle of an amorphous solid dispersion. This mitigated the risk of precipitation of the TBPH salt during the passage of the stomach. Also delinquency upon open storage was improved by embedding the TBPH salt in a pH-sensitive polymer. Dissolution tests mimicking the pH gradient in the gastro intestinal tract confirmed the protective properties of the pH-sensitive polymer matrices against recrystallization at low stomach pH in vitro. Furthermore, supersaturation at pH ranges relevant in the intestines of preclinical species or humans was observed. The TBPH solid dispersion showed superior supersaturation behavior in vitro compared to the free acid in pH-sensitive matrix. However, equally increased bioavailability (BAV) was observed when the amorphous solid dispersion contained the free acid form or the TBPH salt. Absorption seemed to be so fast that the short in vitro supersaturation observed for the free from in pH-sensitive matrix was already sufficient for complete absorption within 15 - 30 minutes. This is in accordance with the
107
short tmax of around 15 - 30 minutes after oral application of the low lattice force principles. The pharmacokinetic (PK) profile became the main focus of further optimization as the BAV was maximized already. Early maximal plasma concentration (tmax) went along with high maximal plasma concentration (Cmax) for the low lattice force principles. Central nervous system related side effects as consequence of the PK profile with such a high Cmax were likely to happen and therefore, the formulation principles were modified to maintain the doubled BAV and reduce the observed Cmax. Additionally, the compound showed a short half-life requiring a two times daily dose, which is suboptimal for a chronic treatment. The amorphous acid in pH-matrix showed a modified PK profile when dosed in a hydrogel but not in an oleo gel. Surprisingly, administration of the TBPH salt in pH-matrix suspended in oil showed a massive delay of the tmax to 8 hours and a reduction of Cmax by factor 2 - 3 with unchanged good BAV when administered as a suspension in oil without increased viscosity. TBPH salt solution with a high viscosity resulted in the same PK profile as when administered without increased viscosity.
The animal model was changed from rat to dog. The dose was limited to 15 mg/dog since they reacted much more sensitively to the drug. BAV at this dose level was 100% for the crystalline suspension already, thus the focus of this study was not increasing BAV but to achieve prolonged and/or delayed exposure using different formulation principles elaborated in rats before. An immediate release formulation of 3 mg was combined with a delayed/modified release principle containing 12 mg of the compound. An additional study arm was conducted with a remote controlled device programmed to deliver a first dose of 3 mg instantaneously after passing the stomach and a second dose of 12 mg when entering the caecum. The tmax remained short for all formulation principles and it seemed that delayed and modified release lead to BAV reduction. The modified PK profiles could not be translated to an oral dog model which endorsed the hypothesis of an absorption window; however, the in vitro results could be translated to a dog model for colonic absorption. A nanosuspension of the crystalline compound, the TBPH salt in pH-matrix and the TBPH salt of the pro-drug of the compound were administered rectally to determine colonic absorption. The nanosuspension showed exposure around the limit of quantification whereas the TBPH in pH-matrix showed 4% BAV and the pro-drug as TBPH salt in pH-matrix resulted in 12% BAV although the pro-drug is factor 3 less soluble. This was in line with the increased permeation of the pro-drug which was observed in the Caco2 experiments. The bioavailability was increased by using the low lattice force principles and validated the hypothesis for the acidic drug and its pro-drug in the colonic dog model. Chemical and physicochemical stability of the investigated solid dispersions was confirmed for at least 18 months at room temperature.
Amorphous solid dispersions were investigated to lower lattice forces of a neutral molecule. Solid dispersions are well known from literature; however, they are not frequently used as principles for dosage forms due to limitations in physical stability and complex manufacturing processes. A viable formulation principle was developed for a neutral compound assuming that the stability of a solid dispersion with a drug load below the maximal miscibility will be better than one which exceeds the maximal miscibility. The dispersed and amorphous state
108
of the neutral compound resulted in a higher energy level and chemical potential compared to a crystalline form implying that they are thermodynamically instable and sensitive to recrystallization. This was confirmed by the fast recrystallization of an amorphous solid dispersion made from HPMC with 50% drug load which recrystallized within a few days. Solid dispersions with different drug loads in different polymers and in polymer mixtures were prepared by lyophilization. The miscibility of the compound and the polymer was determined by DSC as the miscibility is a surrogate for maximal stable drugload of the solid dispersion. HPMC was found to be miscible with 20% compound confirming the instability of the 50% HPMC solid dispersion observed earlier. Based on dosing needs, a miscibility/drug load of at least 30% was mandatory because of the dosing requirements to dose less than 1500 mg of final formulation. This was considered as maximal swallowable volume for later clinical development. Thus, all systems with a miscibility higher or equal to 30% drug in polymer were evaluated in an in vitro dissolution test and ranked in comparison with amorphous pure compound, crystalline compound and a 20% drug load solid dispersion made from HPMC. The HPMC based solid dispersion which gave good exposure in previous in vivo experiments did not support the high drugload that was needed. Therefore, similar in vitro behavior of this solid dispersion should result in similar in vivo performance. The polyvinylpyrrolidone (PVP) based solid dispersions scored with high drug load and medium initial kinetic solubility. The Soluplus based solid dispersion offer lower drug load and slightly lower initial kinetic solubility, but showed an extended supersaturation. The 4 best performing systems were evaluated in rats. They resulted in a short Tmax of 15 minutes and BAV higher than 85% indicating fast and complete absorption. The reference HPMC based solid dispersion with a drug load of 20% showed 65% BAV. This showed that higher drug loads were feasible and did not limit absorption in this animal model.
Since the estimated human dose required a higher formulation density than obtained from lyophilization or spray drying, melt extrusion of the solid dispersion was considered to be the most adequate technology. The process temperature needed to be below 200 °C as this value represents the degradation temperature of the polymers. It was investigated by differential scanning calorimetry whether the compound can be mixed with the molten polymer. None of the polymers could dissolve the crystalline compound below the degradation point of the polymer. The temperature had to be increased to 260 °C until the compound was molten together to a monophasic system with polymer. This resulted in degradation of the polymers. Therefore, different plasticizers and small organic molecules with similar functional groups as the compound were investigated on their ability to reduce the melting point of the mixture of polymer and compound. Positive results were obtained with several small molecules. Based on a literature review, nicotinamide had the least concerning pharmaceutical activities and was chosen for further development. Solid dispersions with the same composition as the ones tested in rat were prepared with 9% nicotinamide as softener. Extrusion without nicotinamide was not possible at 135 °C or at 170 °C whereas the addition of 9% nicotinamide led to a homogenous extrudate when processed at 135 °C. The solid state of the extrudates was not molecularly dispersed but the compound was in a crystalline state. They could not reach the in vitro performance observed for the lyophilized
109
solid dispersions with Soluplus or PVP derivatives. Nevertheless, the performances in the supersaturation assay were comparable to the HPMC based lyophilized solid dispersion. The Soluplus and PVP based crystalline extrudates were evaluated in a dog PK showing that the crystalline solid dispersion does not enable BAV higher than 90% within 24 hours after application. In parallel, the hygroscopicity of the meltextrudates was investigated by DVS and the best performing system based on Kollidon VA64 was further optimized regarding the solid state after its extrusion. The minimal process temperature to obtain a fully amorphous solid dispersion was determined by hot stage X-ray powder diffraction analysis (XRPD) and confirmed by lab scale extrusion. Addition of 9% nicotinamide lowered the process temperature from 220 °C (without nicotinamide) to 200 °C with nicotinamide. The minimal temperature for obtaining crystal free material was independent of the nicotinamide amount as soon as it exceeded 9%. Lowering the process temperature with nicotinamide reduced the impurity levels from 3.5% at 220 °C to 1.1% at 200 °C. The fully amorphous extrudates performed now better in the in vitro supersaturation assay than the lyophilized amorphous HPMC solid dispersion and the crystalline extrudates which were extruded at 135 °C. The process was up-scaled to a pilot scale extruder with alternative screw designs increasing mechanical shear forces and mixing which enabled lower process temperatures. This resulted in a maximal process temperature of 195 °C when nicotinamide was present and 205 °C without nicotinamide. However, shorter process time and reduced process temperatures (compared to the lab scale equipment) resulted in impurity levels smaller than 0.5% for both compositions and temperatures and made the nicotinamide obsolete. The amorphous extrudates from the pilot scale extruder performed better in vitro than the crystalline extrudates from the lab scale extruder and the lyophilized HPMC solid dispersion. A comparable PK profile of the HPMC solid dispersion and the amorphous melt extruded formulation principle was anticipated from these in vitro results. This was confirmed by the pharmacokinetic profile in dogs after oral administration of the final extruded solid dispersion formulation which was equivalent with the pharmacokinetic profile of the HPMC based solid dispersion formulation. The assumption that using a drug load below the miscibility prevents the solid dispersion from recrystallization was verified at least for a limited time by a stability test at elevated temperatures for 3 months showing no change in solid state. This indicates the opportunities of the low lattice forces approach, but also showed the importance of developing principles first assuring stable solid state, performance in vitro and in vivo, tailor them in a second step based on performance and combine them with technology such as melt extrusion as third step. If these steps are done in the context of clinical needs and quality it can rationalize the development of a solid dispersion and minimalize the formulation related risks regarding biopharmacy and stability.
110
ZUSAMMENFASSUNG
Gitterkräfte basieren auf der Interaktion zwischen einzelnen funktionellen Gruppen und Regionen von Molekülen oder Ionen. Die Summe der Interaktionen beeinflusst physikalische Eigenschaften wie Schmelzpunkt, Siedepunkt, Dampfdruck, Solvatisierung und Löslichkeit. Für die Solvatisierung eines Moleküls aus einem Feststoff muss zum einen Energie aufgewendet werden, damit das Molekül seine Interaktionen mit den es umgebenden Molekülen überwinden kann. Zum anderen wird Energie frei, wenn das herausgelöste Molekül mit dem Solvens interagiert. Die Differenz zwischen der benötigten Energie, um die Interaktionen im festen Zustand zu überwinden, und der Energie, die frei wird, wenn das gelöste Molekül oder Ion mit dem Solvens interagiert, bestimmt die Löslichkeit. Auf dieser Gesetzmässigkeit aufbauend wurden die Gitterkräfte von zwei sauren Arzneistoffen und einem neutralen Arzneistoff sukzessive reduziert, um ihre Löslichkeit entsprechend zu erhöhen.
Die sauren Verbindungen, das Stamm-Molekül und dessen Prodrug, wurden mit verschiedenen Gegenionen in ionische Flüssigkeiten umgewandelt. Verschiedene Gegenionen aus der Literatur wurden in die Untersuchungen miteinbezogen. Das Tetrabutylphosphonium-Gegenion (TBPH) hatte besonders vielversprechende Eigenschaften. Es modifizierte den Feststoffzustand von hochkristallin zu amorph. Dies resultierte in guten Löslichkeiten in ungepufferten wässrigen Systemen, vergleichbar mit den bereits bekannten Natriumsalze. Zusätzlich zeigten sie eine massiv verbesserte Löslichkeit bei biorelevantem pH. Die ionischen Flüssigkeiten blieben in Lösung in pH-Bereichen, in denen die klassischen Salze aufgrund ihres Eigen-pHs bereits präzipitierten. Bei einem tiefen pH, wie er im Magen vorkommt, fiel jedoch unmittlerbar die freie Form aus. Daher wurde parallel zum TBPH-Salz eine Solid Dispersion entwickelt auf Basis von pH-sensitiven Polymeren. Diese sollten zum einen den amorphen Zustand stabilisieren, zum anderen verhindern, dass der amorphe Arzneistoff bereits im Magen freigesetzt wird, da er als Säure bei tiefem pH schlecht löslich ist und ausfallen kann. Es wurden Trägermaterialen evaluiert, welche erst bei einem pH grösser als 5.5 löslich sind. Kriterium war die Mischbarkeit der Matrixpolymere mit dem Arzneistoff. Dazu wurden Solid Dispersions, bestehend aus der Verbindung und den Polymermatrices, in verschiedenen Verhältnissen lyophilisiert und anschliessend mit dynamischer Differenzkalorimetrie (DSC) auf ihre Mischbarkeit hin untersucht. Eudragit L100-55 wurde als pH-sensitives Matrixpolymer ausgewählt, da es bis zu 50% mit der Verbindung mischbar war. Hydroxypropyl-methylcellulose-Acetat-Succinat (HPMC-AS) jedoch nur zu 40%. In einer Tierstudie wurden das TBPH-Salz und die Solid Dispersion gegen eine Suspension des kristallinen Arzneistoffes getestet. Aufgrund der stark pH-abhängigen Löslichkeit des TBPH-Salzes wurde es als gepufferte Lösung appliziert, die Solid Dispersion als Suspension. Die beste Pharmakokinetik (PK) wurde für die Solid Dispersion gemessen, gefolgt von der TBPH-Salz-Lösung. Da das TBPH-Salz auch Schwächen im Bereich der Hygroskopizität und der Verarbeitung (wie Zerfliessen und Kleben) zeigte, wurde die ionische Flüssigkeit und die freie, amorphe Form des Arzneistoffes in eine pH-sensitive Matrix inkorporiert. Dissolutionsversuche, welche den pH-Verlauf nach oraler Applikation wiederspiegelten, zeigten, dass die anfänglich beobachtete Präzipitation bei den ionischen Flüssigkeiten bei tiefem pH ausbleibt, wenn sie in die pH-Matrix inkorporiert sind. Zusätzlich konnte eine Übersättigung in Kombination mit der pH-
111
sensitiven Matrix beobachtet werden, nachdem der pH-Wert auf Niveau des Dünndarms anstieg. Der Effekt der Supersaturierung war jedoch mit der ionischen Flüssigkeit signifikant länger. Ebenso verbesserte sich mit der Solid Dispersion die Handhabung der ionischen Flüssigkeiten als Feststoff. Die modifizierten Löslichkeitseigenschaften in vitro führten auch zu einer verdoppelten Bioverfügbarkeit (BAV) in Ratten. Im PK-Profil war kein Unterschied auszumachen, ob der Arzneistoff amorph in pH-Matrix appliziert wurde oder als ionische Flüssigkeit in der pH-Matrix. Die Supersaturierung der freien amorphen Form in pH-Matrix, obwohl wesentlich kürzer als mit dem TBPH-Salz, reichte bereits für eine komplette Absorption in 15-30 Minuten. Dies widerspiegelte auch der tmax-Wert von 30 Minuten. Da Nebenwirkungen oft einhergehen mit hohen maximalen Plasmakonzentrationen (Cmax) und der Arzneistoff relativ schnell aus der Blutzirkulation eliminiert wird, wurde nun versucht, das PK-Profil entsprechend zu modifizieren, um eine längere Exposition und einen tiefere Cmax-Wert bei gleicher Fläche unter der Kurve (AUC) zu erreichen. Die freie amorphe Form des sauren Arzneistoffes zeigte eine leicht verlängerte Zeitspanne, bis Cmax erreicht wurde (tmax), und einen tieferen Cmax-Wert, wenn die Viskosität der dosierten Suspension mit Hydroxypropylmethylcellulose (HPMC) erhöht wurde. Überraschenderweise zeigte das in Maisöl dosierte TBPH-Salz ein um 7 Stunden verzögertes tmax und einen reduzierten Cmax-Wert. Da die Ratte nur bedingt Rückschlüsse und Extrapolation für ein humanes PK-Profil zulässt, wurde der Beagle-Hund als finales und repräsentatives Tiermodel gewählt. Die Hunde reagierten viel sensitiver auf die Verbindung. Deshalb war die maximale Dosis auf 15 mg pro Hund limitiert. Bei dieser Dosis beträgt die BAV für die kristalline freie Form des Arzneistoffes bereits 100%. Das Interesse lag primär auf der Modifizierung des PK-Profils hin zu tieferen Cmax-Werten und späterem tmax bei gleichbleibender AUC. Die Formulierungsansätze aus der Rattenstudie wurden zu einer Dosis von 3 mg kombiniert, welche unmittelbar freigesetzt wird, und einer zweiten Dosis von 12 mg, welche verzögert oder langsamer aufgenommen werden sollte. Zusätzlich wurde eine ferngesteuerte Kapsel benutzt, welche 3 mg sofort nach der Passage des Magens und 12 mg bei Ankunft im Caecum freisetzen sollte. Das tmax blieb für alle Kombinationen kurz und die verzögert oder langsamer freisetzenden Prinzipien resultierten in einer tieferen Exposition. Dies führte zur Formulierung der Hypothese, dass dieser Arzneistoff ein Absorptionsfenster haben könnte. Daher würde die Aufnahme, zumindest im Wesentlichen, auf den Dünndarm beschränkt. Die Entwicklung verzögert freisetzender Arzneiformen, die Anteile der Wirkstoffbeladung distal zum intestinalen Teil des Darmes freisetzen, wäre dann nicht zweckmäßig. Dieser Wirkstoffanteil würde in geringerem Maße, gegebenenfalls auch gar nicht, aufgenommen werden. Da technische Probleme bei der verzögerten Freisetzung nicht ausgeschlossen werden konnten, wurden die Formulierungen nun rektal in den Bereich des Caecums appliziert. Der Arzneistoff wurde als Nanosuspension, als TBPH in pH-Matrix und als TBPH des Prodrugs rektal appliziert. Die Exposition bei der Nanosuspension bewegte sich nahe dem Detektionslimit und ein wenig höher beim TBPH in pH-Matrix. Die Bioverfügbarkeit des Prodrugs als TBPH in pH-Matrix verglichen mit dem TBPH der Grundverbindung in der pH-Matrix war viermal höher. Dies passt gut zur besseren Permeation des Prodrugs in Caco2-Zellen, obwohl das Prodrug um Faktor 3 schlechter löslich ist.
112
Amorphe Solid Dispersions wurden auf ihre Fähigkeit untersucht, die Gitterkräfte im Kristall eines neutralen Moleküls zu senken. Solid Dispersions sind seit ungefähr 50 Jahren in der Literatur bekannt, werden jedoch erst seit kürzerer Zeit erfolgreich von der Pharmaindustrie vermarktet. Die amorphe Form mit dem latenten Risiko der Rekristallisation bedeutet ein grosses Risiko in Bezug auf die Haltbarkeit eines Arzneimittels. In der vorliegenden Arbeit wurde diesem Risiko Rechnung getragen, indem die Mischbarkeit der Substanz mit den Polymeren gründlich untersucht wurde. Systeme, welche mischbar sind, haben ein wesentlich kleineres Risiko, bei der Lagerung zu rekristallisieren. Der amorphe Zustand geht einher mit einer höheren Energie im System, welche das System anfällig macht, durch Kristallisation in den tieferen Energiezustand überzugehen. Dies wurde bei einer HPMC-basierten Solid Dispersion mit 50% Beladung beobachtet. Die Bestimmung der Mischbarkeit deutete auf eine maximale Mischbarkeit von nur 20% hin. Dies korrelierte mit der Rekristallisation dieser Solid Dispersion innerhalb von zwei Wochen, wohingegen diejenige mit nur 20% Beladung wesentlich stabiler war. Basierend auf der zu erwartenden Dosis von 200 400 mg im Menschen, wie sie mit Hilfe der PK-Software vorhergesagt wurde, wurde eine Beladung von mindestens 30% spezifiziert. Alle Kombinationen, die bei der Analyse von den lyophilisierten Systemen mit DSC eine Mischbarkeit von 30% und mehr zeigten, wurden daher in einem Dissolutionstest untersucht. Die Resultate wurden in Relation zum reinen amorphen Arzneistoff, der kristallinen Form und der Solid Dispersion mit HPMC und 20% Beladung bewertet. Diese Solid Dispersion zeigte in Ratten bereits sehr gute Ergebnisse. Daher galt sie als positive Referenz. Systeme, die in vitro gleich gut oder besser abschnitten, sollten ebenfalls in vivo gut abschneiden. Polyvinylpyrrolidon (PVP)-basierte Systeme punkteten mit guter Mischbarkeit und hoher kinetischer Löslichkeit. Soluplus-basierte Systeme zeichneten sich hingegen eher durch lange Supersaturation bei etwas tieferen kinetischen Löslichkeiten und etwas tieferen Mischbarkeiten aus. In der Ratte zeigten alle getesteten Solid Dispersions eine bessere BAV als diejenige mit HPMC. Das tmax war mit 15 Minuten früh und die Absorption vollständig. Dies zeigte, dass höhere Beladungen durchaus möglich sind, ohne dass dies einen negativen Einfluss auf die PK hat. Mit der antizipierten Dosis für den Menschen fielen alle Herstellungsverfahren weg, bei denen das finale Produkt eine kleine Dichte hat. Als adäquat wurde somit die Hot Melt-Extrusion als Herstellungsmethode gewählt. Dieser Prozess hat seine Limitierung jedoch in der maximal möglichen Prozesstemperatur, welche je nach Gerät und Polymer bei ungefähr 200 °C liegt. DSC-Untersuchungen zeigten, dass aber 260 °C nötig sind, um die Substanz und das Polymer zu einer amorphen Phase zusammenzuschmelzen. Dies resultierte in einer Verkohlung der Polymere und war somit nicht umsetzbar. Verschiedene klassische plastifizierende Substanzen und kleinere organische Moleküle mit homologen funktionellen Gruppen wurden auf ihre schmelzpunktreduzierende Wirkung hin untersucht. Vielversprechende Resultate wurden mit mehreren kleinen organischen Molekülen beobachtet. Die klassischen plastifizierenden Substanzen waren allesamt nicht mischbar mit dem Arzneistoff. Nicotinamid wurde aufgrund seines Status als Nahrungsergänzungsmittel für die weitere Entwicklung ausgewählt. Die Solid Dispersions aus der Rattenstudie wurden mit den identischen Beladungen gemischt, jedoch waren die Pulvermischungen bei Temperaturen unter 170 °C nicht extrudierbar. Bei Zugabe von 9% Nicotinamid war die Mischung leicht über dem Schmelzpunkt von Nicotinamid bei 135 °C extrudierbar. Die Extrudate waren für alle verwendeten Polymere kristallin, die Resultate im
113
Auflösungstest im Bereich der HPMC-Solid Dispersion mit 20% Beladung konnten aber mit den Ergebnissen der Kollidon- und Soluplus-basierten Systeme aus der Rattenstudie (alle amorph) nicht mithalten. Die folgende Hundestudie, welche mit einer Formulierung basierend auf Kollidon VA64, einer auf Kollidon K12/K30 und einer auf Basis Kollidon VA64/Soluplus Formulierung durchgeführt wurde, zeigte eine Verbesserung der PK im Hund. Gleichzeitig war aber auch ersichtlich, dass die amorphe HPMC-Solid Dispersion mit 20% Beladung noch wesentlich besser abschnitt. Daher wurde der Extrusionsprozess optimiert, um ein komplett amorphes Extrudat zu erhalten. Parallel wurden die Solid Dispersions per DVS auf ihre Hygroskopizität hin getestet. Kollidon VA64 zeigte die geringste Wasseraufnahme. Zusätzlich ist das Polymer laut Hersteller temperaturstabil bis ungefähr 230 °C. Die Prozesstemperatur wurde mittels Hot Stage-Pulverdiffraktometrie (XRPD) bestimmt, indem eine physikalische Mischung erhitzt wurde und dabei jeweils XRP-Diffraktogramme erstellt wurden, bis bei 230 °C keine kristallinen Signale mehr beobachtbar waren. Diese Temperatur lieferte auch auf dem im Labormassstab arbeitenden Extruder komplett amorphes Material. Die minimale Extrusionstemperatur betrug 220 °C ohne Nicotinamid und 200 °C mit 9% Nicotinamid. Höhere Nicotinamidanteile reduzierten die minimale Extrusionstemperatur nicht weiter, kleinere Anteile erhöhten sie jedoch. Die um 20 °C reduzierte Prozesstemperatur senkte den Anteil von Abbauprodukten von 3.5% ohne Nicotinamid auf 1.1% mit Nicotinamid. Der Wechsel auf einen grösseren Extruder mit variablem Schraubendesign und verschiedenen Temperaturzonen ermöglichte grössere Scherkräfte, was tiefere Prozesstemperaturen ohne kristalline Anteile im Extrudat erlaubte. 195 °C waren mit 9% Nicotinamid nötig, 205 °C ohne. Beide Extrudate zeigten unter 0.5% Abbauprodukte. Dies machte den Gebrauch von Nicotinamid obsolet. Die Extrudate vom grösseren Extruder zeigten Dissolutionsergebnisse, welche identisch mit den lyophilisierten aus den Rattenstudien waren. Diese waren somit besser als die kristallinen Extrudate oder die HPMC-basierte 20% beladene Solid Dispersion. Das gute Abschneiden im in vitro-Test bestätigte sich in einer Hundestudie. Die Exposition der Kollidon basierten Extrudate war mit der PK des HPMC-Systems vergleichbar. Die Stabilität der beiden extrudierten Varianten wurde in einem Stabilitätstest unter Stressbedingungen verifiziert. Keines der Systeme zeigte physikalische Instabilitäten, und die Annahme, dass Beladungen von Systemen unterhalb ihrer maximalen Mischbarkeit physikalisch stabil sind, wurde für den gewählten Zeitraum von 3 Monaten auch unter Stressbedingungen bestätigt. Dies zeigt, dass eine rationale Entwicklung einer Solid Dispersion in einem finalen Produkt resultiert, welches die biopharmazeutischen Ansprüche ebenso erfüllt wie jene bezüglich der physikalischen Stabilität.
114
CONCLUSIONS AND OUTLOOK
Lattice forces are based on the attraction between the single moieties of molecules. The strength of lattice forces has an impact on the solid state and related physical properties such as melting point, solvation solubility and dissolution rate. The results summarized in this thesis indicated the pharmaceutical potential of reducing lattice forces in APIs to overcome PK limitations for a compound group belonging to the BCS II class. Their solubility is mainly limited by the high lattice forces indicated by a logP smaller than 2 and a melting point higher than 225 °C. These values are taken as rough decision guidance to select future compounds which can be developed with the same principles used in the thesis. The scope of compounds needs to be extended to higher logP values and lower melting points on the one hand and to a third group of compounds besides acids and neutrals: Bases. The data presented are in line with various other publications emphasizing the future use of ionic liquids as pharmaceutical formulation tool to increase solubility and exposure of any ionizable compound. Thus, a future perspective may be the expansion to basic compounds.
Ionic liquids are well known in literature; however, there is a lack of current literature about making use of ionic liquids in a pharmaceutical product development context. This thesis provides an insight on the in vitro performance of 2 tetrabutylphosphonium (TBPH) salts forming an ionic liquid. The compounds were not sufficiently soluble nor had an adequate dissolution rate. They showed insufficient bioavailability at high doses with classical approaches such as nanosuspensions or salts. A pH-sensitive solid dispersion was developed with the ionic liquids to mitigate observed in vitro and handling limitations of the pure ionic liquid. The successful in vitro supersaturation testing of these solid dispersions was followed by the first oral applications of an ionic liquid into multiple animal species and the first colonic application into a dog model. The positive results of the TBPH salts in vitro and the correlation to in vivo studies is a ground breaking step towards the use of ionic liquids as a direct formulation strategy for compounds suffering from high lattice forces and related solubility or dissolution limitations leading to limited exposure. The thesis chapter about ionic liquids is focused on exploratory approaches. Efforts towards confirmatory investigations are necessary to evolve the ionic liquid from a formulation tool for animal models to a potential clinical formulation principle. This compromises systematic screening for ionic liquids forming compounds and counter ions, such as artificial sweeteners or well established excipients as sodium lauryl sulfate, benzalkonium or other ionizable molecules. Toxicological investigations of counter ions such as organo-phosphonium and ammonium ions are mandatory since they seem to form ionic liquids also with other model compounds. The new salts bring along other challenges. Hygroscopicity or the viscous appearance demands new principles requiring polymers or inorganic molecules as carriers for the ionic liquid. Additionally is it fundamental to understand the molecular interaction leading to the observed and prolonged supersaturation of ionic liquids and investigate their interaction with biological systems such as membranes or transporters. The conglomerate of this information will be necessary to harness the full potential of ionic liquids in the pharmaceutical development of innovative medicines.
115
Amorphous solid dispersions are investigated for decades within pharmaceutical development. The rational development of stable amorphous solid dispersions is well known in literature, nevertheless the pharmaceutical industry has reservations based the inherent risks of such a formulation principle. Adequate knowledge is essential to avoid limited physicochemical stability and the stabilization of the high energy solid state goes along with a resource intensive development and/or production. Additionally, the drug content of such formulations is limited to below 100 milligrams for a conventional oral dosing unit. Furthermore, the expected human dose being about 200 - 400 mg requested a high drug load solid dispersion of a highly crystalline compound.
Plenty of literature exists on how to stabilize the solid state of amorphous solid dispersions; however, the current work provides one of the first and fastest successful rational developments of a clinical service form prototype of a complex high drug load solid dispersion of a highly crystalline compound. Refined methodology from literature enabled the investigation of the maximal miscibility of the polymer and compound as basis for determination of the maximal stable drug load in a specific polymer or polymer mixtures. The in vitro assessment of solubility and supersaturation correlated to the in vivo performance in rats and dogs. Hot melt extrusion technology was successfully merged with the validated principles from the previous rat study. The high melting point of the compound was reduced with the help of nonconventional softeners allowing a melt extrusion process temperature 100 °C below the melting point of the compound. This prevented the polymers from degradation. The resulting crystalline meltextrudates with improved in vitro solubility and supersaturation showed an unsatisfying performance in dogs, probably due the crystalline state of the compound in the meltextrudates. This initiated the development of fully amorphous extrudates that were extruded at 200 °C, which is still 60 °C under the melting point of the crystalline compound. In vivo experiments established the newly adapted and up scaled principle from the biopharmaceutical prospective and led to the conclusion that a fully amorphous state of the compound in the solid dispersion is mandatory for sufficient exposure in dogs. A short term stability investigation at elevated temperatures confirmed the stability of the initially determined drug load based on the miscibility of the compound and the polymer. Finally, within 6 months the developed formulation principle enables oral delivery of a few 100 mgs in a single oral dosing unit. This work was a first step to overcome the existing prejudice about this powerful formulation tool. This is of major importance since the percentage of low soluble molecules rose tremendously since the introduction of high throughput systems in compound screening. In vivo experiments established the newly adapted and up scaled principles from a biopharmaceutical prospective. Nevertheless, the pharmaceutical industry still has reservations based on the need to avoid as many risks in development as possible. Further compounds and projects are necessary to validate the development tools such as miscibility measuring or adequate in vitro testing.
As one of the main hurdles of an amorphous solid dispersion is its physicochemical stability, new short term stability test are mandatory for an exploratory investigation and selection of principles. Solid state stability is a function of the compound mobility in a solid system which is required for nucleation and growing of crystal seeds. Nucleation and
116
growing need different environments, therefore a stability test might consist of temperature cycles similar to classical crystallization in chemistry. The Tg of a system indicates an increased mobility in a solid and can give the range of such temperature cycles. Confirmatory real time stability testing according to ICH will validate the exploratory results and helps to correlate the exploratory stability upon temperature cycling to the real time stability. In conclusion, the challenge of a solid dispersion is to rationalize the development based on pharmacokinetic properties, stability and technology in the context of the pharmaceutical industry.
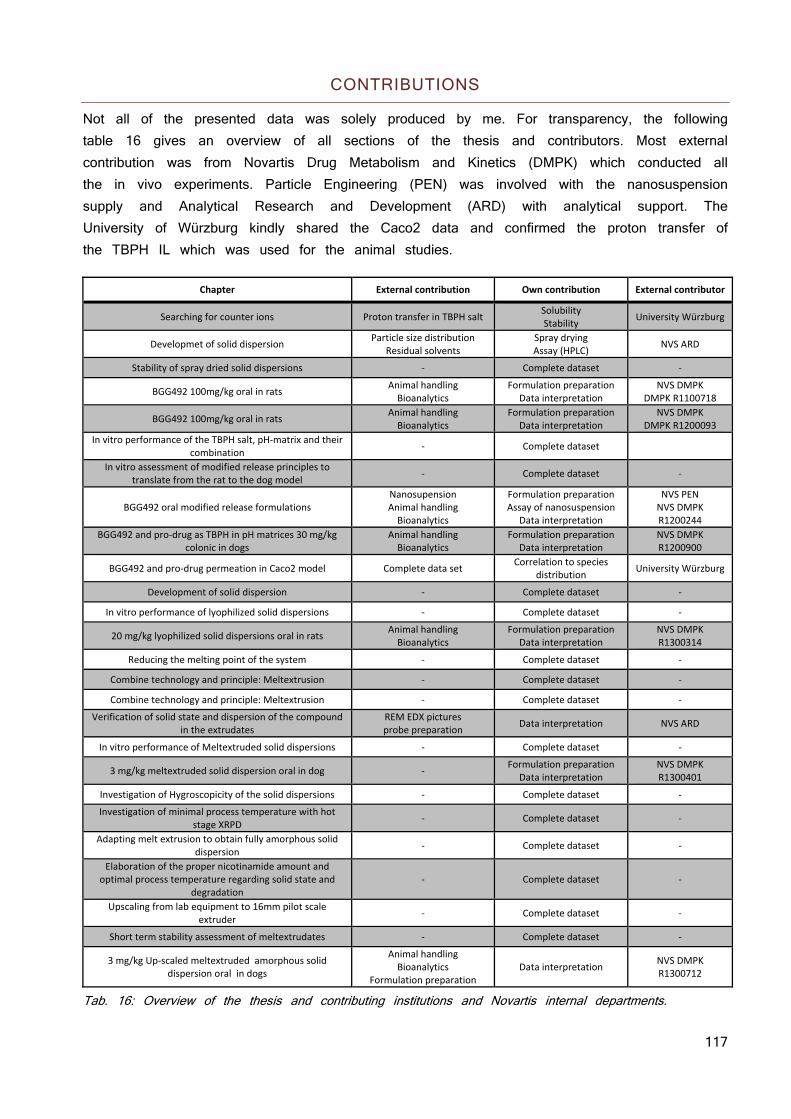
117
CONTRIBUTIONS
Not all of the presented data was solely produced by me. For transparency, the following table 16 gives an overview of all sections of the thesis and contributors. Most external contribution was from Novartis Drug Metabolism and Kinetics (DMPK) which conducted all the in vivo experiments. Particle Engineering (PEN) was involved with the nanosuspension supply and Analytical Research and Development (ARD) with analytical support. The University of Würzburg kindly shared the Caco2 data and confirmed the proton transfer of the TBPH IL which was used for the animal studies.
Chapter External contribution Own contribution External contributor
Searching for counter ions Proton transfer in TBPH salt Solubility Stability
University Würzburg
Developmet of solid dispersion Particle size distribution
Residual solvents Spray drying Assay (HPLC)
NVS ARD
Stability of spray dried solid dispersions ‐ Complete dataset ‐
BGG492 100mg/kg oral in rats Animal handlingBioanalytics
Formulation preparation Data interpretation
NVS DMPKDMPK R1100718
BGG492 100mg/kg oral in rats Animal handlingBioanalytics
Formulation preparation Data interpretation
NVS DMPKDMPK R1200093
In vitro performance of the TBPH salt, pH‐matrix and their combination
‐ Complete dataset
In vitro assessment of modified release principles to translate from the rat to the dog model
‐ Complete dataset ‐
BGG492 oral modified release formulations NanosupensionAnimal handling Bioanalytics
Formulation preparation Assay of nanosuspension
Data interpretation
NVS PENNVS DMPK R1200244
BGG492 and pro‐drug as TBPH in pH matrices 30 mg/kg colonic in dogs
Animal handlingBioanalytics
Formulation preparation Data interpretation
NVS DMPKR1200900
BGG492 and pro‐drug permeation in Caco2 model Complete data set Correlation to species
distribution University Würzburg
Development of solid dispersion ‐ Complete dataset ‐
In vitro performance of lyophilized solid dispersions ‐ Complete dataset ‐
20 mg/kg lyophilized solid dispersions oral in rats Animal handlingBioanalytics
Formulation preparation Data interpretation
NVS DMPKR1300314
Reducing the melting point of the system ‐ Complete dataset ‐
Combine technology and principle: Meltextrusion ‐ Complete dataset ‐
Combine technology and principle: Meltextrusion ‐ Complete dataset ‐
Verification of solid state and dispersion of the compound in the extrudates
REM EDX picturesprobe preparation
Data interpretation NVS ARD
In vitro performance of Meltextruded solid dispersions ‐ Complete dataset ‐
3 mg/kg meltextruded solid dispersion oral in dog ‐ Formulation preparation
Data interpretation NVS DMPKR1300401
Investigation of Hygroscopicity of the solid dispersions ‐ Complete dataset ‐
Investigation of minimal process temperature with hot stage XRPD
‐ Complete dataset ‐
Adapting melt extrusion to obtain fully amorphous solid dispersion
‐ Complete dataset ‐
Elaboration of the proper nicotinamide amount and optimal process temperature regarding solid state and
degradation ‐ Complete dataset ‐
Upscaling from lab equipment to 16mm pilot scale extruder
‐ Complete dataset ‐
Short term stability assessment of meltextrudates ‐ Complete dataset ‐
3 mg/kg Up‐scaled meltextruded amorphous solid dispersion oral in dogs
Animal handlingBioanalytics
Formulation preparation Data interpretation
NVS DMPK R1300712
Tab. 16: Overview of the thesis and contributing institutions and Novartis internal departments.
118
EXPERIMENTAL
MATERIALS
Water was used from a Nanopur® device from Barnstead (Thermo Scientific, Reinach, Switzerland), all other chemicals and solvents were purchased from Sigma Aldrich (Buchs, Switzerland) in analytical quality if not stated otherwise. Tetrabutylphosphonium (TBPH) hydroxide solution (40 % in water W/W), was of technical quality. Nicotinamide was of pharm. eur. Quality, both supplied by Sigma Aldrich (Buchs, Switzerland). Eudragit EPO and L-100-55 were kind gifts of Evonik (Essen, Germany), PVP K12 and K30 Kollidon VA64, Soluplus and Kolliphor RH40 were gifts of BASF (Basel, Switzerland). HPMC 603, HPMC AS-LF, PEG4000, Poloxamer 188, Vit E TPGS, Croscarmellose Sodium, Mannitol. HPMC 603, HPMC AS-LF, Croscarmellose Sodium, Mannitol, Mg-stearate and Aerosil 200 were received from Novartis AG (Stein, Switzerland). Gelatin capsules size 3 and 2 were purchased from Capsugel (Colmar, France).Maize oil Sabo came from COOP AG (Basel, Switzerland)
The BGG492 and its pro-drug CER225 were synthesized by Novartis AG (Basel, Switzerland) with a purity >99.8%. The neutral compound was synthesized by Novartis AG (Basel, Switzerland) with a purity >99.8%.
IntelliCapTM from (11 x 26 mm) Medimetrics (Heilbronn, Germany) was used. Software, application and evaluation of the pH profiles were done by an external support team from Medimetrics.
PREPARATION OF BIORELEVANT MEDIA
Two simulated intestinal were used: Fed State Simulated Intestinal Fluid (FeSSIF) and Fasted State Simulated Intestinal Fluid (FaSSIF).
To obtain 100 ml FeSSIF, the following recipe was used: 538.7 mg sodium taurocholate were dissolved in 3.5 ml water. 155 mg lipoid E PCS were added upon the solution was clear. 178.3 mg glyceryl monooleate and 24.4 mg sodium oleate were added. The clear solution was completed to 100 ml with FeSSIF buffer. The buffer consisting of 0.73 mg NaCl and 0.64 mg maleic acid per 100 ml which were titrated to pH 5.8 with 0.2 M NaOH.
To obtain 100 ml FaSSIF, the following recipe was used: 161.4 mg sodium taurocholate were dissolved in 1 ml water. 15.5 mg lipoid E PCS were added upon the solution was clear. The clear solution was completed to 100 ml with FaSSIF buffer. The buffer consisting of 0.41 mg NaCl and 0.22 mg maleic acid per 100 ml which were titrated to pH 6.5 with 0.2M NaOH.
119
METHODS ACIDS
IN SILICO TOX ASSESMENT
Derek Nexus v. 3.0.1, a rule-based expert system, based on the basis of open accessible and proprietary data was used for toxicology estimation.
HIGH PERFORMANCE LIQUID CHROMATOGRAPHY (HPLC)
HPLC analytics were done with an Agilent 1100 and 1290 (Waldbronn, Germany) with DAD detector and an ambient temperature auto sampler. Chromeleon® 6.8 (Dionex), was used to operate the HPLC system and for data evaluation.
An Agilent Zorbax 1.8μm, SB-C18 4.6x 50 mm column was used and mobile phase A consisted of water with 5% acetonitrile and 0.05 % TFA (V/V), mobile phase B of acetonitrile with 5% water and 0.05 % TFA (V/V). The gradient profile for mobile phase B was 0-3.5 min 15-65%; 3.5-3.7 min 65-15% and 3.7-5 min 15%. The flow rate was set at 1.2 ml/min. Column temperature was 40 °C and detection at λ = 325 nm. Injection volumes of 5, 10 and 20 μl were used in a calibrated range of 0.0005 mg/ml to 0.1 mg/ml.
GAS CHROMATOGRAPHY (GC)
A HP6890 GC apparatus in combination with a HP7694 auto sampler with split/split less injector in split mode connected to an Agilent HP624 column with 30m length and a FI-detector was used. The temperature in the oven was set to 100 °C, the temperature of the loop to 120 °C and the transfer line to 135 °C. Cycle time was 30 minutes, vial equilibration time 15 minutes and pressurize time 30 seconds. Helium was used as carrier gas at a flow of 5 ml/min. 40-50 mg of the samples was dissolved in 2 ml DMSO. An internal standard containing 1% acetone (W/V) was used. Chromeleon® 6.8 was used to operate the GC system and for data evaluation
SCANNING ELECTRON MICROSCOPE (SEM)
The probes were coated with approximately 30nm gold with a Sputter Coater SCD500 (Bal-Tec). Microscope was a Zeiss Supra 40 with a SE detector and measured was with an accelerating voltage of 6kV. A working distance of 6.7 mm was used with an aperture size of 30 μm and a filament current of 2.359 A.
PARTICLE-SIZE DISTRIBUTION (PSD)
A Malvern mastersizer 2000 was used with the associated software. Approximately 20 mg of sample were suspended in approximately 10 ml nanopure water and measured.
120
THERMOGRAVIMETRICAL ANALYSIS (TGA)
A Q5000 TGA (TA instruments, New Castle, DE) was used for thermo gravimetric analysis. The platinum crucible was tarred first and then loaded with substance. The scan rate was 10 °C/min from 30 °C to 300 °C under 50 ml/min nitrogen flow.
POWDER XRAY (XRPD)
Bruker D8 GADDS Discover (Karlsruhe, Germany) with CuKa anode at a power of 40 kV and 40 mA, a focusing Goebel mirror and a 1.0 mm microfocus alignment. Sample Detector distance 30 cm, two frames merged. A sample amount of ca 2-5 mg is placed on an objective slide and centered in the X-ray beam. Data collection and processing was done with the software packages DIFFRAC. Suite (V1.8, Bruker, Karlsruhe, Germany) and DIFFRAC. EVA (Version 1.8, Bruker, Karlsruhe, Germany). Simulation of the theoretic pattern of the free acid was done from the cif-file obtained from single crystal analysis with the program Mercury (Mercury 3.1 Development – Build RC5, CCDC 2001–2012, Cambridge, UK).
DIFFERENTIAL SCANNING CALORIMETRY (DSC)
DSC was performed on a Q2000 (TA instruments) using scanning rate of 10 °C and 50 °C/min. Sealed aluminum pans were used with pinhole and the sample size was between 1.5 and 2.5 mg for the solid forms and between 5 mg and 10 mg for the ILs.
IONIC LIQUID SYNTHESIS
The ionic liquids were prepared by metathesis of the free acid of the compound and the free base of the counter ion. Briefly, 500 mg free acid was suspended in 40 ml acetone after which equimolar amount of the counter ion was added and mixed until a clear solution was obtained. Solvents were evaporated in a RotaVap at 45 °C, 150 – 300 mbar until approximately 1 ml were left. The viscous liquid was transferred onto a watch crystal and dried at 50 °C and 5-10 mbar for one day.
PREPARATION OF SOLID DISPERSIONS BY LYOPHILIZATION
Solutions of 10 mg/ml solid in dioxane were pipetted in 20 ml lyophilization vials resulting in different drug loads in different polymers. The solution was shock frozen by placing the vials for 10 minutes in a polystyrene box filled with dry ice. The lyophilisator was preconditioned to 0 °C to prevent unthawing of the lyo vials after loading them into the lyophilisator. The solid dispersions were post dried for 5-6 hours at 10 mbar after lyophilization and checked for residual solvents by TGA.
121
SOLUTIONS FOR SPRAY DRYING
Free acid in pH-matrix: Acetone/water 9/1 (W/W) was used as solvent. 10 g Eudragit L-100-55 were dissolved in 350g solvent by stirring 2 h on a magnetic stirrer. 10 g compound were added and the clear solution was sprayed after complete dissolution (which took approximately 10 minutes) of the compound.
IL in pH-matrix: Acetone/water 9/1 (W/W) was used as solvent. 10 g Eudragit L-100-55 were dissolved in 350 g solvent by stirring 2 h on a magnetic stirrer. 10 g compound were added and equimolar amount of tetrabutylphosphonium hydroxide solution (40% in water W/W) was added upon complete dissolution of the compound. The clear solution was sprayed immediately after everything was dissolved.
SPRAY DRYING
A Büchi Spray Dryer B-290 was used with an inlet temperature of 65-75 °C and an outlet temperature of 40-45 °C. The solutions had 5-6% (W/W) material dissolved. The feed was 30% (approximately 8 g/min), the drying gas flow 20-23 m3/min and the vaporizing gas flow 15-17 l/min with a pressure of 2.4-2.6 bar. The obtained powder was dried at 10 mBar for 2 days.
STABILITY OF SPRAY DRIED MATERIAL
The material was stored in transparent glass container in ambient temperature and humidity conditions.
SOLUBILITY MEASUREMENTS
The solubility of the compounds was determined by putting excess material into an Eppendorf tube followed by adding 1 ml media and shaking overnight. Approximately 150 μl of the suspensions were drawn and filtered with 45um filtration tubes on a micro spin centrifuge at 14’000 rpm for 2 minutes. The filtrate was diluted 10:990 with acetonitrile/water 1:1 and analyzed by HPLC. The pH was measured during equilibration and pH was adjusted when altered by more than 1 pH unit from initial pH.
122
SUPERSATURATION MEASUREMENTS
Supersaturation measurements were done with a PolyBLOCK® (HEL, Hertfordshire , UK) reactor equipped with a liquid dosing unit in combination with a pH probe unit from Mettler (Mettler Toledo, Bichelsee, Switzerland). The compound or pH-matrix respectively was placed in a reactor vial of 30 ml with a magnetic stirrer and the reactors were equilibrated at 37 °C. A 50mmol maleate buffer was used for simulation of the early intestines pH environment and a 50mmol phosphate buffer to simulate the later GI environment. The buffers were prepared with an initial pH of 2 to represent the acidic stomach conditions. 15 ml buffer (preheated to 37 °C) were added to the powder and the stirrer started with 500U/min. the pH was kept at 2 for 9 minutes and titrated to 6.5 ± 0.1 for simulation of early GI tract respectively to 7.4 ± 0.1 to represent later GI tract. Approximately 200 μl of the suspensions were drawn and filtered with 45μm filtration tubes on a micro spin centrifuge at 14’000 rpm for 2 minutes. The filtrate was diluted 10:990 with acetonitrile/water 1:1 and analyzed by HPLC.
Influence of solubilized Eudragit on the solubility of the compound was done by dissolving 3g Eudragit L100-55 in 90 ml 0.1 M NaOH. The pH of the solution was adjusted with 0.1 HCl to 6.5 and 7.4 respectively and filled up to 100 ml with water.
Supersaturation out of a 60 mg/ml PEG/NMP solution of BGG492 was measured by diluting 1 ml of the solution in 15 ml FaSSIF pH 6.5.
IN VITRO PERMEABILITY THROUGH THE CACO-2 CELL MONOLAYER MODEL (84)
Cells were grown in Dulbecco’s modified Eagle’s medium high glucose (DMEM) with penicillin and streptomycin (Pen/Strep). 500 ml medium were prepared with DMEM powder containing 4.5 g glucose, 50 ml Fetal Bovine Serum, 5 ml 100x nonessential amino acids and 5 ml Pen/Strep (penicillin 10,000 U/ml and streptomycin 10 mg/ml solution 100x). Caco2 cells were cultured at 37 °C and 5% CO2 in cell culture medium. 2.7 x 10⁵ cells/cm2 (counted with Neubauer improved hemocytometer; LO-Laboroptik) were seeded on polycarbonate filter inserts (diameter 12 mm; 0.4 μm membrane pore size) on 12 well plates (Corning life science). Cells typically had 54 -56 passages. The monolayer integrity was monitored by measuring the trans epithelial electrical resistance (TEER) and fluorescein added to the apical compartment as a leakage marker. TEER measurements were performed for each cell-seeded filter using a chopstick electrode EVOM2 STX3 electrode and EVOM2 epithelial voltammeter (World Precision Instruments). Specifications for cell-seeded filters required TEER values exceeding 600 (Ω*cm2). Sodium fluorescein was applied to two filters of each 12 well plate. 20 μM sodium fluorescein HBSS buffer solution were applied apically. Samples for reading the fluorescence were taken at all time points when samples were collected for the drug transport study and analyzed on 96 well plates (96F nontreated white micro well SH; Nunc) with a LS50B fluorescence spectrometer (Perkin Elmer). The apparent permeability coefficients (Papp; cm/sec) were calculated as follows: ⁄ 1 ∗⁄ and ⁄ being the steady-state flux [μmol/sec], being the insert/filter surface area [cm2] and being the
123
starting concentration in the apical (donor) chamber [μM]. Transport studies were performed 21-23 days after seeding of the cells on the inserts. For that, HBSS buffer pH 7.4 was used for sample preparation and as the basolateral medium. The compounds were applied apically either as a solution with a concentration of 0.27 mM for the free acid, 0.26 mM for the ionic liquid or 0.04 mM for CER225 (maximal CER225 concentrations in solution (0.12 mM at pH 7.4) were lower as those for the ionic liquid (8 mM at pH 7.4) and the free acid (0.79 mM at pH 7.4) due to solubility limitation). Another transport study explored the drugs applied as suspensions to the apical (donor) compartment. For that, suspensions were prepared in 400 μl of HBSS buffer for each filter insert, holding amounts of 1.47 ± 0.08 μmol for the free acid, 1.55 ± 0.05 μmol for the ionic liquid or 1.33 ± 0.05 μmol for the CER225 (n ≥ 5 filter inserts per group). Samples were collected from the basolateral compartment after 30 minutes. Sodium fluorescein samples were analyzed by fluorescence spectroscopy and the free acid, ionic liquid and CER225 by HPLC. The monolayers were further characterized after completion of the transport studies by cell nuclei stain and in representative filters for e-cadherin (cell contacts) labeling. For that, cells on the filters were exposed to 4% formaldehyde in PBS for 20 minutes and filters were treated with 0.1% Triton X in PBS for 10 minutes and exposed to 5% BSA in PBS buffer for 60 minutes, thereafter. Mouse antibody against human e-cadherin was diluted 1:100 in PBS and applied for 2 hours at room temperature after which a secondary anti-mouse Alexa Fluor 488 antibody (diluted 1:200 in blocking solution) was applied and subject to the confocal microscopy, thereafter. Cell nuclei were labeled with DAPI diluted 1:1000 in PBS and subject to the confocal microscopy (Leica TCS-SP2, lens 63/1.4 oil), thereafter.
124
ANIMAL TESTING ACIDS
The experiments with rats were conducted under License 18, Kantonales Veterinäramt Basel Stadt; the experiments with dogs were conducted under License 458, Kantonales Veterinäramt Basel Stadt. The blood was centrifuged at 3000g for 10 minutes at 4 °C to obtain approx. 100 μl plasma for each sample. The plasma samples were stored below –18 °C until analysis.
For the analysis of the plasma samples, an aliquot was injected into the LTQ Velos LC-MS/MS system mass spectrometer. A Flux Rheos A liquid chromatograph was used with a CTC Pal HTS run auto sampler at 4 °C in combination with a Synergy Max RP 3 μm column at 25 °C. Solvent A was 1 % formic acid (V/V) in water, solvent B was a 1:1 mixture of methanol and acetonitrile with 1 % (V/V) formic acid. Flow was set to 350 μl/min and the gradient was from 80% solvent A to 60%, 35%, and 5% after 0.9, 3.3 and 3.4 minutes, respectively. Thereafter, flow was set to 450 μl/min and the solvent mixture was kept constant until 4.5 minutes, after which solvent A was increased to 80% until 4.6 minutes and kept constant until 6 minutes after which a new injection cycle commenced. The injection volume was 2 μl. The HESI ion source was run at positive polarity with a capillary temperature of 375 °C, sheath gas flow was 55 and auxiliary gas flow was 30 units, respectively. Spray voltage was set to 4.2 kV. The pharmacokinetic evaluation of the time profiles was performed with Phoenix WinNonlin (Version 6.1, Pharsight Corporation) using the non-compartmental approach.
125
BGG492 100 mg/kg ORAL IN RATS
Four Male wistar rats from Harlan were used for each formulation tested. They were in a non-fasted feeding status on all days of the study and had free access to tap water and NAFAG pellets No. 890, (Eberle NAFAG AG, Gossau, Switzerland). 5g formulation per kg rat resulting in 100 mg drug substance/kg rat was orally administered by gavage. Approximately 0.3 ml EDTA-K3 blood was collected by puncture of a sublingual vein under light isoflurane anesthesia at the time points 0.25, 0.5, 1, 2, 4, 6, 8, and 24 hours after dose. The following formulations were tested: Formulation A: BGG492 micronized; suspension aqueous (pH 2): 241 mg micronized BGG492 was suspended in 12g 0.5% HPMC 603 solution whose pH was adjusted to pH 2 with HCl Final concentration: 20.1 mg/g BGG492 Formulation B: pH-sensitive matrix; suspension aqueous (pH 2): 481 mg BGG492 in pH-sensitive matrix (50% drug load) was suspended in 12g 0.5% HPMC 603 solution whose pH was adjusted to pH 2 with HCl Final concentration: 20.1 mg/g BGG492 Formulation C: BGG492 in pH-sensitive matrix; suspension in maize oil: 482 mg BGG492 in pH-sensitive matrix (50% drug load) was suspended in 12 g maize oil. Final concentration: 20.1 mg/g Formulation D: BGG492 in pH-sensitive matrix; suspension in maize oleo gel: 482 mg BGG492 in pH-sensitive matrix (50% drug load) and 481 mg Aerosil 200 were suspended in 11.5 g maize oil. Final concentration: 20.1 mg/g BGG492 Formulation E: BGG492 as tetrabutylphosphonium (TBPH) salt in Tris-buffer: 403 mg BGG492 TBPH was dissolved in 11.6 g Tris 100 mM (pH 8.2). Final concentration: 19.93 mg/g
126
BGG492 100 mg/kg ORAL IN RATS
Four Male wistar rats from Harlan were used for each formulation tested. They were in a non-fasted feeding status on all days of the study and had free access to tap water and NAFAG pellets No. 890, (Eberle NAFAG AG, Gossau, Switzerland). 5 g formulation per kg rat resulting in 100 mg drug substance/kg rat was orally administered by gavage. Approximately 0.3 ml EDTA-K3 blood was collected by puncture of a sublingual vein under light isoflurane anesthesia at the time points 0.25, 0.5, 1, 2, 4, 6, 8, and 24 hours after dose. The following formulations were tested: Formulation A: BGG492-TBPH salt in pH-sensitive matrix, suspension in maize oil: 825 mg BGG492-TBPH in pH-sensitive matrix (43% drug load) was suspended in 11.0 g Maize oil. Final concentration: 19.4 mg/g BGG492. Formulation B: BGG492 in pH-sensitive matrix; aqueous suspension in hydrogel pH 2.5: 483 mg BGG492 in pH-sensitive matrix (50% drug load) and 3.22 g HPMC 603 were suspended in 0.845 g 0.1 molar HCl, and 7.46 g Water. Final concentration: 20.11 mg/g BGG492. Formulation C: BGG492 TBPH salt in buffered hydrogel (pH 8.2): 407 mg BGG492-TBPH and 3.40g HPMC 603 were dissolved in and 8.20g Tris 100 mM, pH 8.2. Final concentration: 20.12 mg/g BGG492.
127
BGG492 ORAL MODIFIED RELEASE FORMULATIONS; NANOSUSPENSION AND TBPH SALT IN pH-MATRIX COLONIC IN DOGS
NANOSUSPENSION
The nanosuspension was prepared by Planetenschnellmühle PM400 from Retsch. The suspension consisted of 640 mg BGG, 128 mg PVPK30, 64 mg Docusate sodium salt and 5.625 ml water. 2148 mg ZrO2 with a bulk density of 3.58 g/cm3 were added as grinding material and the suspension was divided into 10 grinding matrixes. They were milled for 4h at 400 rpm.
PREPARATION OF HYDRPHOBIZED pH-MATRIX
1g myristic acid was carefully heated to melting (55-60 °C) on a heated magnetic stirrer. 500 mg of BGG492 in pH-matrix were added and the mix was stirred for 2 minutes. The homogeneous suspension was cooled to room temperature and broken into pieces. These pieces were frozen by mixing them with approximately 1g dry ice pellets and grinded to a powder with mortar and pistil.
MODIFIED RELEASE TABLET AND DISSOLUTION TESTING
For sieving and mixing powders a 0.5 mm sieve and a turbula-mixer from Willy Bachofen AG was used. Powders were sieved, 10 minutes mixed, sieved and mixed again for 5 minutes.
A half- automated EK0 tableting machine with a 6 mm concave punch was used for tablet pressing. A disintegration tester was used according to Test A pharm. Eur. 2.9.1 (Disintegration of tablets and capsules), a hardness tester according to Ph. Eur. 2.9. 8 (Resistance to crushing of tablets) and a dissolution apparatus 2 (Paddle apparatus) according to USP 711 (Dissolution) were used. A two media system was selected. Test was started with 750 ml Medium 1 (0.1 M HCl, pH 1). After 2 hours, 250 ml of test medium 2 (Concentrate for Phosphate buffer pH 6.8 + 1.0 % SDS) was added to the apparatus to change the pH of the test solution to 6.8. A sinker was used to ensure that the tablet is fully surrounded by dissolution media during the whole measurement. Samples were taken automatically at time points: 0, 0.5, 1, 2, 3, 4, 5, 6 and 7 h. Approximately 1 ml was filtered through a 0.45 μm nanopore filter and filled to vials for content determination.
128
Male Beagle dogs originated from Marshall Resources, Italy and were housed individually during the experiment. They were fasted 15h before dosing but had free access to tap water. Three hours after dosing, they received the daily portions of 250 g standard dog chow. The study was designed as cross over study with one week wash out period between the dosing.
All formulations were prepared on the day of dosing. Formulations A-C were dosed orally in gelatin capsules size 3 with exception of the BGG492 TBPH salt in pH-matrix in maize oil which was filled into a size 2 capsule, formulation D orally in a radio controlled capsule, E and F rectally according to the following description:
A lubricated stomach tube (external diameter: 7 mm) was inserted as a guiding tube through the anal sphincter and advanced proximally up to 24 cm. A urinary catheter (Arnolds, Size 4F, 50 cm) was advanced through the guiding tube up to 23cm into the colon. Both formulations were administered via a syringe attached to the catheter. After administration of 2 ml formulation per dog, the tube was flushed with 2 ml of air, followed by 2 ml of the corresponding vehicle (0.5% HPMC solution pH 4.5).
EDTA-K3 blood (approx. 1.0 ml) was collected by puncture of the vena cephalica at the forelegs. For sampling times were: 0, 0.25, 0.5, 1, 2, 4, 6, 8, and 24h post-dose or after release of the first burst of the IntelliCap. The IntelliCap capsule (Treatment D) was programmed and radio-controlled to release 3 mg BGG492 after the capsule left the stomach and 12 mg when reaching the caecum. To confirm the location of the IntelliCap (stomach or small intestine), 20 ml of cold HCl 0.05M was orally administered using a gavage tube. An immediate drop of pH and/or temperature indicated that the capsule was still located in the stomach. The IntelliCaps were recovered and after excretion to determine the amount of BGG492 remaining in the capsules and calculate the effectively released dose.
Treatment A: 3 mg BGG492 TBPH salt in pH-sensitive matrix as capsule and 12 mg BGG492 TBPH salt in pH-sensitive matrix suspended in oil as capsule. 150 mg Mannitol, 30 mg Croscarmellose Sodium and 7 mg BGG492 TBPH in pH-matrix were mixed on a weighing paper and manually filled into the capsule. The second capsule was filled with 0.4 ml maize oil and 28 mg BGG492 TBPH in pH-matrix was suspended into the oil. Final dose: 15 mg Treatment B: 3 mg BGG492 in pH-sensitive matrix as capsule and 12 mg BGG492 in pH-sensitive matrix hydrophobized with myristic acid in gelatin capsules: 150 mg Mannitol, 30 mg Croscarmellose Sodium and 7 mg BGG492 TBPH in pH-matrix were mixed on a weighing paper and manually filled into the capsule. 150 mg Mannitol, 30 mg Croscarmellose Sodium and 116 mg BGG492 TBPH in pH-matrix hydrophobized were mixed on a weighing paper and manually filled into the second capsule Final dose: 15 mg
129
Treatment C: 3 mg BGG492 in pH-sensitive matrix as capsule and 12 mg BGG492 in pH-sensitive matrix as modified release tablet consisting of BGG492 lactose cellulose HPMC aerosol Mg-stearate, 30.5/28/15/25/0.5/1, (W/W/W/W/W) Final dose: 15 mg Treatment D: 240 mg BGG492 were dissolved in 4 ml PEG200/NMP (93/7, V/V) in IntelliCaps: Final solution with a concentration of 60 mg/ml was loaded into reservoir. Final dose: 15 mg Treatment E: BGG492 TBPH in pH-sensitive matrix: 85 mg BGG492 TBPH in pH-matrix was suspended in 2.4 ml 0.5% HPMC 603 solution of pH 2 (pH adjusted with HCl) resulting in a final pH of 4.2-4.5. The formulations were prepared freshly for each dog. Final concentration: 15 mg/ml Treatment F: BGG492 nanosuspension: The initial nanosuspension with a concentration of 100 mg/ml was diluted 1/5.67 with 0.5% HPMC 603 solution. Final concentration: 15 mg/ml.
130
BGG492 AND PRO-DRUG CER225 AS TBPH IN pH-MATRICES 30 mg/kg COLONIC IN DOGS
Male Beagle dogs originated from Marshall Resources, Italy and were housed individually during the experiment. They were fasted 15 h before dosing but had free access to tap water. Three hours after dosing, they received the daily portions of 250 g standard dog chow. The study was designed as cross over study with one week wash out period between the dosing.
A lubricated stomach tube (external diameter: 7 mm) was inserted as a guiding tube through the anal sphincter and advanced proximally up to 22 cm. The urinary catheter was replaced by a more flexible feeding catheter (Braun Medical, 50 cm) and was inserted through the guiding tube up to 23 cm into the colon. Both formulations were administered via a syringe attached to the catheter. After administration of 2 ml formulation per dog, the tube was flushed with 1.5 ml of air, followed by 1.5 ml of the corresponding vehicle (0.5% HPMC solution pH 4.5).
EDTA-K3 blood (approx. 1.0 ml) was collected by puncture of the vena cephalica at one of the forelegs. For treatment A, B, and C, the sampling times were: 0, 0.25, 0.5, 1, 2, 4, 6, 8, 24h post-dose.
Equal molar nominal doses of 30 mg BGG492 and CER225 were administered per dog.
Formulation A: BGG492 TBPH in pH-sensitive matrix: 115 mg BGG492 TBPH in pH-matrix (40% drug load) was suspended in 3 ml 0.5% HPMC 603 solution of pH 2 (adjusted with 0.1M HCl) resulting in a final pH of 4.2-4.5. The formulation was prepared freshly for every dog. Final concentration: 15.3 mg/ml Formulation B: CER225 TBPH in pH-sensitive matrix: Equal molar mg of the CER225 TBPH in pH-matrix (40% drug load) was suspended in 3 ml 0.5% HPMC 603 solution of pH 2 (adjusted with 0.1M HCl) resulting in a final pH of 4.4-4.8. The formulation was prepared freshly for every dog. Final concentration: represents 15 mg/ml BGG492
131
METHODS NEUTRALS
HIGH PERFORMANCE LIQUID CHROMATOGRAPHY (HPLC)
CONTENT DETERMINATION:
HPLC analytics were done with an Agilent 1290 (Waldbronn, Germany) with DAD detector and an ambient temperature auto sampler. Chromeleon® 6.8 (Dionex), was used to operate the HPLC system and for data evaluation.
An Agilent Zorbax 1.8 μm, SB-C18 4.6x 50 mm column was used and mobile phase A consisted of water with 5% acetonitrile and 0.05 % TFA (V/V), mobile phase B of acetonitrile with 5% water and 0.05 % TFA (V/V). The gradient profile for mobile phase B was 0 - 4 min 10-70% and 4-5 min 10% The flow rate was set at 1.2 ml/min. Column temperature was 40 °C and detection at λ = 248 nm. Injection volumes of 5 μl were used.
RELATED SUBSTANCES:
HPLC analytics were done with a 1290 with DAD detector and an ambient temperature auto sampler. Chromeleon® 6.8 was used to operate the HPLC system and for data evaluation.
A Waters Atlantis T3 3 μm, 3x150 mm column was used and mobile phase A consisted of water with 5% acetonitrile and 0.05% TFA (V/V), mobile phase B of acetonitrile with 5% water and 0.05 % TFA (V/V). The gradient profile for mobile phase B was 0 - 4.5 min 0-25%; 4.5-6.5 min 25% and 6.5-15 min 25-100% and 15-18 min 0%. The flow rate was set at 0.7 ml/min. Column temperature was 30 °C and detection at λ = 248 nm. Injection volumes of 5 μl were used.
GAS CHROMATOGRAPHY (GC)
A HP6890 GC apparatus in combination with a HP7694 auto sampler with split/split less injector in split mode connected to an Agilent HP624 column with 30m length and a FI-detector was used. The temperature in the oven was set to 100 °C, the temperature of the loop to 120 °C and the transfer line to 135 °C. Cycle time was 30 minutes, vial equilibration time 15 minutes and pressurize time 30 seconds. Helium was used as carrier gas at a flow of 5 ml/min. 40-50 mg of the samples was dissolved in 2 ml DMSO. An internal standard containing 1% acetone (W/V) was used. Chromeleon® 6.8 was used to operate the GC system and for data evaluation
132
SCANNING ELECTRON MICROSCOPE (SEM & SEM EDX)
The probes were coated with approximately 30nm gold with a Sputter Coater SCD500 (Bal-Tec). Microscope was a Zeiss Supra 40 with a SE” detector and measured was with an accelerating voltage of 6kV. A working distance of 6.7mm was used with an aperture size of 30 μm and a filament current of 2.359A. The samples for the SEM EDX analysis were casted in epoxy resin and cut with a microtome.
PARTICLE-SIZE DISTRIBUTION (PSD)
A Malvern mastersizer 2000 was used with the associated software. Approximately 20 mg of sample were suspended in nanopure water and measured.
THERMOGRAVIMETRICAL ANALYSIS (TGA)
A Q5000 TGA (TA instruments) was used for thermo gravimetric analysis. The platinum crucible was tarred first and then loaded with substance. The scan rate was 10 °C/min from 30 °C to 300 °C under 50 ml/min nitrogen flow.
POWDER XRAY (XRPD)
A Bruker Discover D8 XRPD was used. Samples were prepared on a microscope slide. Data processing was done with the software package DIFFRAC.EVA (Bruker, Version 1.8) Acquisition time for the two frames was 120 seconds standard and 300 seconds in cases where some crystal peaks were detected in the 120 seconds run but close to the LOD.
DIFFERENTIAL SCANNING CALORIMETRY (DSC)
DSC was performed on a Q2000 (TA instruments) using scanning rate of 10 °C and 50 °C/min. Sealed aluminum pans were used with pinhole and the sample size was between 1.0 and 1.5 mg.
PREPARATION OF SOLID DISPERSIONS BY LYOPHILIZATION
Solutions of 10 mg/ml solid in Dioxane were pipetted in 10 ml lyophilization vials resulting in different drug loads in different polymers. The solution was shock frozen by placing the vials for 10 minutes in a polystyrene box filled with dry ice. The lyophilisator was preconditioned to 0 °C to prevent unthawing of the lyo vials after loading them into the lyophilisator. The solid dispersions were post dried for 5-6 hours at 10 mbar after lyophilization and checked for residual solvents by TGA.
133
SOLUTIONS FOR SPRAY DRYING
Acetone/water 4/1 (W/W) was used as solvent. 80 g HPMC 603 were dissolved in 1.08 kg solvent by stirring on a magnetic stirrer overnight resulting in a turbid solution. 20 g compound were added and stirred for 10 minutes and then sprayed.
SPRAY DRYING
A Büchi Spray Dryer B-290 was used with an inlet temperature of 165-175 °C and an outlet temperature of 80-85 °C. The solution had 6.5% (W/W) material dissolved. The feed was 50% (approximately 11.5 g/min), the drying gas flow 13-15 m3/min and the vaporizing gas flow 12-13 l/min with a pressure of 2.0 bar. The obtained powder was dried at 10mBar for 2 days.
POWDER PREPARATION FOR MELTEXTRUSION
The polymers and the nicotinamide were sieved prior to weighing. The coarse compound was un-sievable and was therefore weight in directly. The powders were mixed with a Turbula mixer from Willi Bachofen AG (Basel) for 10 minutes.
MELTEXTRUSION SMALL SCALE
A haake minilab extruder was used with a bypass operation for circulation and extrusion and co rotating standard screws. The feeding was done manually at a screw speed of 150 U/min. Once 5-6 g were fed, the melt was circulated for 45 seconds to assure complete mixing followed by extrusion through the die.
MELTEXTRUSION SCALE UP
A Leistritz Nano 16 was used with co rotating trilobed screw elements. 4 elements of the highest pitch screws for feeding the mixture were followed by 3 elements of medium pitch for melting and 4 elements of the lowest pitch for extrusion through the dye. The temperature sensors were placed in barrel segment 2 and 3. The feeding was done manually.
MILLING OF MELT EXTRUDATES
A stainless steel tissue smasher with a single ball was used to mill the extrudates. The powder was sieved through a 0.5 mm sieve and dried at 10mbar for 4 hours to remove adsorbed water.
134
SUPERSATURATION MEASUREMENTS
Supersaturation measurements were done by weighting solid dispersion containing 2 mg compound into a 4 ml screw vial with a magnetic stir bar. 2 ml of FeSSIF were added and the stirring was started with 150 U/min. 150 μl of the suspensions were drawn and filtered with 45μm filtration tubes on a micro spin centrifuge at 14’000 rpm for 20 seconds. The filtrate was diluted 1:9 with acetonitrile/water 1:1 and analyzed by HPLC.
DYNAMIC VAPOR SORPTION (DVS)
Moisture sorption isotherms of different substances were detected at 25 °C using a DVS Advantage instrument (Surface Measurement Systems). Samples were equilibrated at 50% RH. Equilibrium state was assumed to be reached, when change in mass was less than 0.02 dm/dt. Relative humidity was increased in steps of 10% RH when the equilibrium state was reached. The moisture sorption was measured from 10% to 90% RH.
ANIMAL TESTING NEUTRALS
The experiments with rats were conducted under License 18, Kantonales Veterinäramt Basel Stadt, the experiments with dogs were conducted under License 458, Kantonales Veterinäramt Basel Stadt. The blood was centrifuged at 3000g for 10 minutes at 4 °C to obtain approx. 100 μl plasma for each sample. The plasma samples were stored below –18 °C until analysis.
For the analysis of the plasma samples, an aliquot was injected into a MS/MS system mass spectrometer. Detailed information can be found in: DMPK R1300712a. Zhou W (2014)
The pharmacokinetic evaluation of the time profiles was performed with Phoenix WinNonlin (Version 6.1, Pharsight Corporation) using the non-compartmental approach.
135
20 MG/KG SOLID DISPERSIONS ORAL IN RATS
Three Male wistar rats from Harlan were used for each formulation tested. They were in a non-fasted feeding status on all days of the study and had free access to tap water and NAFAG pellets No. 890, (Eberle NAFAG AG, Gossau, Switzerland). 5 g formulation per kg rat resulting in 20 mg drug substance/kg rat was orally administered by gavage. Approximately 0.3 ml EDTA-K3 blood was collected by puncture of a sublingual vein under light isoflurane anesthesia at the time points 0.25, 0.5, 1, 2, 4, 6, 8, and 24 hours after dose. The formulations were prepared by weighting the lyophilized material into a 4 ml vial, 1.66 ml polymer solution was added and stirred until a homogeneous suspension was obtained (maximal 5-10 min) resulting in a concentration of 5 mg compound/ml. One vial was prepared on the day of dosing for each animal with the following formulations:
Formulation A: 40.3 mg of the HPMC solid dispersion with a drug load of 20.6% was weighted in a vial and suspended in 0.5% HPMC solution.
Formulation B: 21.5 mg of the Kollidon VA64 solid dispersion with a drug load of 38.7% was weighted in a vial and suspended in a 2% Kollidon K30 solution.
Formulation C: 15.1 mg of the Kollidon K12 solid dispersion with a drug load of 54.8% was weighted in a vial and suspended in a 2% Kollidon K30 solution.
Formulation D: 20.7 mg of the Kollidon VA64/Soluplus (1:1) solid dispersion with a drug load of 40.0% was weighted in a vial and suspended in a 2% Kollidon K30 solution.
Formulation E: 17.1 mg of the Kollidon K12/Soluplus (1:4) solid dispersion with a drug load of 48.4% was weighted in a vial and suspended in a 2% Kollidon K30 solution.
136
3 mg/kg ORAL IN DOGS
Male Beagle dogs originated from Marshall Resources, Italy and were housed individually during the first 24 hours of the experiment and afterwards they were housed in their group. They were fasted 15h before dosing but had free access to tap water. Four hours after dosing, they received the daily portions of 250g standard dog chow Provimi Kliba SA, 4303 Kaiseraugst, Switzerland. The study was designed as cross over study with one week wash out period between the dosing.
All capsules (gelatin capsules size 3) were prepared approximately 1h prior to dosing. The capsules were administered by deep throat deposition followed by a 20 ml rinse with drinking water. The final amount of compound dosed was 29.8 - 33.4 mg/capsule (depending on the body weight of the dogs) to reach a target dose level of 3 mg/kg (referring to the free base). The solid dispersion was weighted in a weighing boat, Mannitol (filler) was added up to 150 mg total formulation. 25 mg NaCMC was weighted on top receiving a final formulation amount of 175 mg per capsule. The powders were manually mixed with a spatula und then filled from the weighting boat into the capsule.
EDTA-K3 blood (approx. 1.0 ml) was collected by puncture of the vena cephalica at the forelegs. For sampling times were: 0, 0.25, 0.5, 1, 2, 3, 4, 6, 8, 24, 48 and 72h post-dose.
Formulation A: 86-93 mg (depending of the dog’s bodyweight) of the Kollidon VA64 solid dispersion with a drug load of 34.9%.
Formulation B: 82-88 mg (depending of the dog’s bodyweight) of the Kollidon K12/K30 (4:1) with a drug load of 36.5%.
Formulation C: 80-89 mg (depending of the dog’s bodyweight) of the Soluplus/VA64 (1:1) with a drug load of 37.4%.
137
3 mg/kg ORAL IN DOGS
Male Beagle dogs originated from Marshall Resources, Italy and were housed individually during the first 24 hours of the experiment and afterwards they were housed in their group. They were fasted 15 h before dosing but had free access to tap water. Four hours after dosing, they received the daily portions of 250 g standard dog chow Provimi Kliba SA, 4303 Kaiseraugst, Switzerland. The study was designed as cross over study with one week wash out period between the dosing.
The formulations were delivered, TRD Novartis, East Hanover, USA and were stored at minus 80 °C until final formulation preparation. Per dog one vial was delivered containing 30 mg of the neutral compound. The formulations were prepared shortly before dosing by adding 30 ml water to each vial. All formulations were dosed within 10 min after formulation preparation. At all dosing sessions, dogs received 30 mg/dog by oral gavage followed by a 20 ml rinse with drinking water, which has been used before to rinse the empty dosing vial. The final concentrations of the dose formulations were 1 mg/g.
EDTA-K3 blood (approx. 1.0 ml) was collected by puncture of the vena cephalica at the forelegs. For sampling times were: 0, 0.25, 0.5, 1, 2, 3, 4, 6, 8, 12, 24, 48 and 72h post-dose.
Formulation A: 86 mg Kollidon VA64 polymer based solid dispersion with 35% drug load, 19 mg microcrystalline cellulose, 12 mg PVP XL, 6 mg Aerosil and 1.2 mg Mg Stearate
Formulation C: (Ref): HPMC based solid dispersion with 20% drug load prepared by spray drying
138
ACKNOWLEDGEMENTS
I would like to thank Prof. Dr. Meinel for the opportunity to join this collaboration between the University of Würzburg and Novartis Pharma AG. It taught me the balancing act between academic thoroughness and pharmaceutical industry demands. Working as scientifically as possible in the context of pharmaceutical development was not always ordinary. I also want to give props to Anja and Johannes for the friendly and professional exchange between Novartis and University. The hours we discussed or planed experiments will not be forgotten. Many thanks go to Jörg Berghausen, Frank Seiler and all members of CPP Basel for integrating my PhD position in their daily business; I think it is not self-evident that a PhD student can access all equipment without reservations. The same applies to Patricia Seiler and Jörg Herren who introduced me to various analytical techniques. Cornelius and the PEN network also contributed to this work whit equipment, knowhow but also with scientific discussions, thank you.
Many people connected with formulation and analytical activities supported my work with their experience, guidance and support of experiments. Hubi Thoma, Hans Küenzler, Francois Brugger and Dirk Maertin, sincere thanks are given to all of you.
Special thanks go to Bruno Galli for mentoring me and watching my back through these 4 years within Novartis. You learned me combining science with limited resources and time but also thinking outside the box, being unconventional and work with principles; always with an eye on the context and the focus on the target. I will not forget all the discussions we had about scientific topics, but also the introduction into project management and related subjects like philosophy or psychology. When you told me that reaching a PhD degree is more than writing a scientific work, I did not knew what you meant. Now I experienced what you were talking about and growing in other fields than science might be even more valuable to me than an academic title.
139
BIBLIOGRAPHY
1. Sherry K. M. Use of the Biopharmaceutical Classification System in Early Drug Development. American Association of Pharmaceutical Scientists. 2008, Vol. 10, 1.
2. Amidon G. L., Lennernas H., Shah V. P., Crison J. R. A Theoretical Basis for a Biopharmaceutic Drug Classification: The Correlation of In Vitro Drug Product Dissolution and In Vivo Bioavailability. Pharmaceutical Research. 1995, Vol. 12, 3.
3. Williams H. D., Trevaskis N. L., Charman S. A., Shanker R. M., Charman W. N. Strategies to Address Low Drug Solubility. Pharmacological Reviews. 2013, Vol. 65, 1.
4. Sinko J. P. Martin's Physical Pharmacy and Pharmaceutical Sciences: Physical Chemical and Biopharmaceutical Principles in the Pharmaceutical Sciences. Baltimore : Lippincott Williams & Wilkins, 2006. 978-0-7817-9766-5.
5. Wilkinson A., McNaught A. D. IUPAC Compendium of Chemical Terminology. Oxford : Blackwell Scientific Publications, 1997.
6. Innovative Drug Delivery Systems: Novel Product and Formulation Technology Licensing Opportunities for Generic Pharmaceutical Companies. [Online] 06 15, 2013. [Cited: 10 10, 2013.] http://marketpublishers.com/report/medical_devices/drug_delivery/innovative-drug-delivery-systems-novel-product-n-formulation-technology-licensing-opportunities-4-generic-pharmaceutical-companies.html.
7. Yu L. X., Amidon G. L., Polli J. E., Zhao H., Dale M. U., Conner P., Shah V. P., Lesko L. J., Chen M-L., Lee V. H. Biopharmaceutics Classification System: The Scientific Basis for Biowaiver Extensions. Pharmaceutical Research. 2002, Vol. 19, 7.
8. FDA. http://www.fda.gov/downloads/Drugs/GuidanceComplianceRegulatoryInformation/Guidances/ ucm073246.pdf. [Online] FDA, January 2010. [Cited: 11 06, 2013.]
9. Artursson P., Karlsson J. Correlation Between Oral Drug Absorption in Humans and Apparent Drug Permeability Coefficients in Human Intestinal Epithelial (Caco-2) Cells. Biochemical and Biophysical Research Communications. 1991, Vol. 175, 3.
10. Pignata S., Maggini L., Zarrili R., Acquaviva A. M. The Enterocyte-like Differentiation of the Caco-2 Tumor Cell Line Strongly Correlates with Responsiveness to cAMP and Activation of kinase A Pathway. Cell Growth & Differentiation. 1994, Vol. 5.
11. Lipinski C. A. Drug-like properties and the causes of poor solubility and poor permeability. Journal Pharmacology and Toxicology Methods. 2000, Vol. 44, 1.
12. Benet L. Z. Pharmacokinetics: Basic Principles and Its Use as a Tool in Drug Metabolism. [book auth.] Mitchell J., Horning M-G. Drug metabolism and drug toxicity. New York : Raven Press. ISBN 0-89004-997-1, 1984.
140
13. Custodio J. M., Wu C-Y., Benet L. Z. Predicting drug disposition, absorption/elimination/transporter interplay and the role of food on drug absorption. Advanced Drug Delivery Reviews. 2008, Vol. 60, 6.
14. Stahl H., Wermuth C. G. Handbook of Pharmaceutical Salts. Weinheim : WILEY-VCH Verlag GmBH, 2008. ISBN 3-90639058-6.
15. Löbenberga R., Amidon G. L. Modern bioavailability, bioequivalence and biopharmaceutics classification system. New scientific approaches to international regulatory standards. European Journal of Pharmaceutics and Biopharmaceutics. Vol. 50, 1.
16. Pade V., Stavchansky S. Link between drug absorption solubility and permeability measurements in Caco-2 cells. Journal of Pharmaceutical Sciences. 1998, Vol. 87, 12.
17. Smith B. P., Vandenhende F. R., DeSante K. A., Farid N. A. Confidence Interval Criteria for Assessment of Dose Proportionality. Pharmaceutical Research. 2000, Vol. 17, 10.
18. Kesisoglou F., Santipharp P., Yunhui W. Application of Nanoparticles in Oral Delivery of Immediate Release Formulations. Current Nanoscience. 2007, Vol. 3, 2.
19. Amidon R. L., Oberle G. L. The Influence of Variable Gastric Emptying and Intestinal Transit Rates on the Plasma Level Curve of Cimetidine; An Explanation for the Double Peak Phenomenon. Journal of Pharmacokinetics and Biopharmacy. 1987, Vol. 15, pp. 529-544.
20. Ran Y., Yalkowsky S.H. Prediction of Drug Solubility by the General Solubility Equation. Journal of chemical information and computer sciences. 2001, Vol. 41, 2.
21. Blagden N., deMatas M., Gavan P. T., York P. Crystal engineering of active pharmaceutical ingredients to improve solubility and dissolution rates. Advanced Drug Delivery Reviews. 2007, Vol. 59, 7.
22. Hefter G. T., Tomkins R. P. T. The Experimental Determination of Solubilities. West Sussex : JOHN WILEY & SONS LTD, 2003.
23. Kawakami K. Modification of physicochemical characteristics of active pharmaceutical ingredients and application of supersaturatable dosage forms for improving bioavailability of poorly absorbed drugs. Advanced Drug Delivery Reviews. 2012, Vol. 64, 6.
24. Brouwers J., Brewster M. E., Augustijns P. Supersaturating drug delivery systems: The answer to solubility-limited oral bioavailability? Journal of Pharmaceutical Sciences. 2009, Vol. 98, 8.
25. Persson R., Nordholm S., Perlovich G., Lindfors L. Monte Carlo Studies of Drug Nucleation 1: Formation of Crystalline Clusters of Bicalutamide in Water. Journal of Physical Chemistry. 2011, 115.
26. Chen J., Sarma B., Evans J., Myerson A. S. Pharmaceutical Crystallization. Crystal Growth & Design. 2011, Vol. 11, 4.
141
27. Rodriguez-Hornedo N., Murphy D. Significance of controlling crystallization mechanisms and kinetics in pharmaceutical systems. Pharmaceutical Sciences. 1999, Vol. 88.
28. Guzmán H. R., Tawa M., Zhang Z., Ratanabanangkoon P., Shaw P.,Gardner C. R., Chen H, Moreau J. P., Almarsson O., Remenar J. F. Combined use of crystalline salt forms and precipitation inhibitors to improve oral absorption of celecoxib from solid oral formulations. Journal of Pharmaceutical Sciences. 2007, Vol. 96, 10.
29. White R. E., Manitpisitkul P. Pharmacokinetic Theory of Cassette Dosing in Drug Discovery Screenin. Drug Metabolism and Disposition. 2001, Vol. 29, 7.
30. DeSesso J. M, Jacobson C. F. Anatomical and physiological parameters affecting gastrointestinal absorption in humans and rats. Food and Chemical Toxicology. 2001, Vol. 39, 3.
31. McConnell E. L., Basit A. W., Murdan S. Measurements of rat and mouse gastrointestinal pH, fluid and lymphoid tissue, and implications for in-vivo experiments. Journal of Pharmacy and Pharmacology. 2008, Vol. 60, 1.
32. Streng W. H., Hsi S. K., Helms P. E., Tan G. H. General Treatment of pH-Solubility Profiles of Weak Acids and Bases and the Effects of Different Acids on the Solubility of a Weak Base. Journal of Pharmaceutical Sciences. 1984, Vol. 73, 12.
33. Kararli T. T. Comparison of the gastrointestinal anatomy, physiology, and biochemistry of humans and commonly used laboratory animals. Biopharmaceutics & Drug Disposition. 1995, Vol. 16, 5.
34. Sutton S. C. Companion animal physiology and dosage form performance. Advanced Drug Delivery Reviews. 2004, Vol. 56, 10.
35. Guerrieri P., Rumondor A., Li T., Taylor L. Analysis of Relationships Between Solid-State Properties, Counterion, and Developability of Pharmaceutical Salts. American Association of Pharmaceutical Scientists. 2010, Vol. 11, 3.
36. Serajuddin A. Salt formation to improve drug solubility. Advanced Drug Delivery Reviews. 2007, Vol. 59, 7.
37. Kramer S. F., Flynn G. L. Solubility of organic hydrochlorides. Journal of Pharmaceutical Sciences. 1972, Vol. 61, 12.
38. Bogardus J. B., Blackwood R. K. Solubility of doxycycline in aqueous solution. Journal of pharmaceutical sciences. 1979, Vol. 68, 2.
39. Overhoff K. A., Moreno A., Miller D. A., Johnston K. P., Williams R. O. Solid dispersions of itraconazole and enteric polymers made by ultra-rapid freezing. International Journal of Pharmaceutics. 2006, Vol. 336, 1.
142
40. Pokharkar V. B., Mandpe L. P., Padamwar M. N., Ambike A. A., Mahadik K. R., Paradkar A. Development, characterization and stabilization of amorphous form of a low Tg drug. Powder Technology. 2006, Vol. 167.
41. Craig D. The mechanisms of drug release from solid dispersions in water-soluble polymers. International Journal of Pharmaceutics. 2002, Vol. 231, 2.
42. Konno H., Taylor L.S. Influence of different polymers on the crystallization tendency of molecularly dispersed amorphous felodipine. Journal of Pharmaceutical Sciences. 2006, Vol. 95, 12.
43. Leuner Ch., Dressman J. Improving drug solubility for oral delivery using solid dispersions. European Journal of Pharmaceutics and Biopharmaceutics. 2000, Vol. 50, 1.
44. Bikiarisa D., Papageorgiou G. Z., Stergiou A., Pavlidoub E., Georgarakisd M. hysicochemical studies on solid dispersions of poorly water-soluble drugs: Evaluation of capabilities and limitations of thermal analysis techniques. Thermochimica Acta. 2005, Vol. 439, 1-2.
45. Crowley K. J., Zografi G. The Effect of Low Concentrations of Molecularly Dispersed Poly(Vinylpyrrolidone) on Indomethacin Crystallization from the Amorphous State. Pharmaceutical research. 2003, Vol. 20, 9.
46. Taylor L. S., Zografi G. Spectroscopic characterization of interactions between PVP and indomethacin in amorphous molecular dispersions. Pharmaceutical Research. 1997, Vol. 14.
47. Hancock B. C., Shamblin S. L., Zografi G. Molecular mobility of amorphous pharmaceutical solids below their glass transition temperatures. Pharmaceutical Research. 1995, Vol. 12, 6.
48. ICH. Guidelines Quality Stability Testing. [Online] [Cited: 04 15, 2015.] http://www.ich.org/fileadmin/Public_Web_Site/ICH_Products/Guidelines/Quality/Q1A_R2/Step4/Q1A_R2__Guideline.pdf.
49. Gordon M., Taylor J. S. Ideal copolymers and the second-order transitions of synthetic rubbers in non-crystalline copolymers. Journal of Applied Chemistry. 1952, Vol. 2, 9.
50. Brostow W., Chiu R., Kalogeras I. M.,Vassilikou-Dova A. Prediction of glass transition temperatures: Binary blends and copolymers. Materials Letters. 2008.
51. Angell C. A. Liquid Fragility and the Glass Transition in Water and Aqueous Solutions. American Chemical Society. 2002.
52. He H., Yang R., Tang X. In vitro and in vivo evaluation of fenofibrate solid dispersion prepared by hot-melt extrusion. Drug Development and Industrial Pharmacy. 2010, Vol. 36, 6.
53. Vasconcelos T., Sarmento B., Costa P. Solid dispersions as strategy to improve oral bioavailability of poor water soluble drugs. Drug Discovery Today. 2007, Vol. 12, 23.
54. Serajuddin A. Solid Dispersion of Poorly Water-Soluble Drugs: Early Promises,Subsequent Problems, and Recent Breakthroughs. Journal of Pharmaceutical Sciences. 1999, Vol. 88, 10.
143
55. Karanth H., Shenoy V.S. Industrially feasible alternative approaches in the manufacture of solid dispersions: A technical report. American Association of Pharmaceutical Scientists PharmSciTech. Vol. 7, 4.
56. Oraina D., Ofner S., Koller M., Carcache D. A., Froestl W., Allgeier H. 6-Amino quinazolinedione sulfonamides as orally active competitive AMPA receptor antagonists. Bioorganic & Medicinal Chemistry Letters. 2012, Vol. 22, 12.
57. Bradford H. Glutamate, GABA and Epilepsy. Progress in Neurobiology. 1995, Vol. 47.
58. Gomez-Mancilla B., Brand R., Jürgens T. P., Göbel H., Sommer C., Straube A., Evers S., Sommer M., Campos V., Kalkman H. O., Hariry S., Pezous N., Johns D., Diener H. C. Randomized, multicenter trial to assess the efficacy, safety and tolerability of a single dose of a novel AMPA receptor antagonist BGG492 for the treatment of acute migraine attacks. Cephalalgia an International Journal of Headache. 2013, Vol. online published.
59. U.S. National Institutes of Health. Study of BGG492 in Patients With Chronic Subjective Tinnitus. [Online] 2013. [Cited: November 15, 2013.] http://clinicaltrials.gov/show/NCT01302873.
60. Rautio J., Kumpulainen H., Heimbach T., Oliyai R., Oh D., Järvinen T., Savolainen J. Prodrugs: design and clinical applications. Nature Reviews Drug Discovery. 2008, Vol. 7.
61. Wymann M. P., Zvelebil M., Laffargue M. Phosphoinositide 3-kinase signalling – which way to target? TRENDS in Pharmacological Sciences. 2003, Vol. 24, 7.
62. Oncology, Novartis. Inhibiting tumor proliferation and survival by blocking the phosphatidylinositol-3-kinase (PI3K) pathway. [Online] Novartis, 2013. [Cited: 11 15, 2013.] http://www.novartisoncology.us/research/pipeline/bkm120.jsp.
63. Porter C. J. H., Trevaskis N. L., Charman W. N. Lipids and lipid-based formulations: optimizing the oral delivery of lipophilic drugs. Nature Reviews Drug Discovery. 2007, Vol. 6.
64. Berghausen J., Lui Y., Bajusz I. Developability Assesment for BGG492. Basel : Novartis Pharma AG, 2006.
65. MacFarlane D. R., Forsyth M., Izgorodina E. I., Abbott A. P., Annat G., Fraser K. On the concept of ionicity in ionic liquids. Physical Chemistry Chemical Physics. 2009, Vol. 11.
66. Weber C. C., Mastersa A.F., Maschmeyer T. Structural features of ionic liquids: Consequences for material preparation and organic reactivity. Green Chemistry. 2013, Vol. 15.
67. Kumar V., Malhotra S. V. Ionic Liquids as Pharmaceutical Salts: A Historical Perspective. [book auth.] S. V. Malhotra. Ionic Liquid Applications: Pharmaceuticals, Therapeutics, and Biotechnology. s.l. : American Chemical Society, 2010, 1, pp. 1-12.
68. Bicaza K., Rijksen C., Nieuwenhuyzena M., Rogers R. D. In search of pure liquid salt forms of aspirin: ionic liquid approaches. Physical Chemistry Chemical Physics. 2010, Vol. 12, pp. 2011-2017.
144
69. Hough W. L., Smiglak M., Rodriguez H., Swatloski R. P., Rogers R. D. The third evolution of ionic liquids: active pharmaceutical ingredients. New Journal of Chemistry. 2007, Vol. 31, pp. 1429-1436 .
70. Cho C-W., Pham T., Jeon Y-C., Vijayaraghavan K. Toxicity of imidazolium salt with anion bromide to a phytoplankton Selenastrum capricornutum: Effect of alkyl-chain length. Chemosphere. 2007, Vol. 69.
71. FDA. Guidance for Industry - Food and Drug Administration. [Online] 2005. [Cited: Januray 10., 2014.] http://www.fda.gov/ohrms/dockets/98fr/2002d-0389-gdl0002.pdf.
72. Shah N. H., Carvajal M. T., Patel C. I., Infeld M. H. , Malick A. W. Selfemulsifying drug delivery systems (SEDDS) with polyglycolized glycerides for improving in vitro dissolution and oralabsorption of lipophilic drugs. International Journal of Pharmaceutics. 1994, Vol. 106.
73. Joshiemail S. C. Sol-Gel Behavior of Hydroxypropyl Methylcellulose (HPMC) in Ionic Media Including Drug Release. Materials. 2011, Vol. 4, 10.
74. Faraldo-Gómez J. D., Kutluay E. , Jogini V., Zhao Y., Heginbotham L., Roux B. Mechanism of Intracellular Block of the KcsA K+ Channel by Tetrabutylammonium: Insights from X-ray Crystallography, Electrophysiology and Replica-exchange Molecular Dynamics Simulations. Journal of Molecular Biology. 2007, Vol. 365, 3.
75. Goldberg A. H., Gibaldi M., Kanig J. L. Increasing dissolution rates and gastrointestinal absorption of drugs via solid solutions and eutectic mixtures II: Experimental evaluation of a eutectic mixture: Urea-acetaminophen system. Journal of Pharmaceutical Sciences. 1966, Vol. 55, 5.
76. Sekiguchi K., Obi N., Ueda Y. Studies on Absorption of Eutectic Mixture. II. Absorption of fused Conglomerates of Chloramphenicol and Urea in Rabbits. Chemical & pharmaceutical bulletin. 1964, Vol. 12.
77. Claassen, V. Biopharmaceutics, Animal characteristics, Maintenance, Testing conditions. Neglected Factors in Pharmacology and Neuroscience Research. Amsterdam : Elsevier, 1994.
78. Yamashita S., Takashima T., Kataoka M., Watanabe Y. PET Imaging of the Gastrointestinal Absorption of Orally Administered Drugs in Conscious and Anesthetized Rats. Journal of Nuclear Medicine. 2011, Vol. 52, 2.
79. Dressman J. B., Vertozini M., Reppas C. Estimating drug solubility in the gastrointestinal tract. Advanced Drug Delivery Reviews. 2007, Vol. 59, 7.
80. Xu X., Brining D., Rafiq A., Hayes J., Chen JD. Effects of enhanced viscosity on canine gastric and intestinal motility. Journal of Gastroenterology and Hepatology. 2005, Vol. 20, 3.
81. Bennink R., de Jonge W., Symonds E., van den Wijngaard R., Spijkerboer A., Benninga M., Boeckxstaens G. Validation of Gastric-Emptying Scintigraphy of Solids and Liquids in Mice
145
Using Dedicated Animal Pinhole Scintigraphy . The Journal of Nuclear Medicine. 2003, Vol. 44, 7.
82. Tannergren Ch., Bergendal A., Lennernäs H., Abrahamsson B. Toward an Increased Understanding of the Barriers to Colonic Drug Absorption in Humans: Implications for Early Controlled Release Candidate Assessment. Molecular Pharmaceutics. 2009, Vol. 6, 1.
83. Satwara R., Patel S., Jivani R., Patel P., Pancholi S. Formulation Approaches to Enhance the Bioavailability of Narrow Absorption Window Drugs. Inventi Rapid: Pharm Tech. 2011, 3.
84. Balk A., Widmer T., Wiest J., Rybak J-C., Matthes P., Müller-Buschbaum K., Sakalis A., Lühmann T., Berghausen J., Holzgrabe U., Galli B., Meinel L. Ionic liquid versus Prodrug Strategy to Address Formulation. Pharmaceutical Research. 2014, Vol. 31, 12.
85. Thakral N. K., Ray A. R., Bar-Schalom D.,Majumdar D. K. Enhanced dissolution of celecoxib by supersaturating self-emulsifying drug delivery system (S-SEDDS) formulation. AAPS PharmSciTech. 2012, Vol. 13, 1.
86. Kolter K., Karl M., Gryczke A. Hot-Melt Extrusion with BASF Pharma Polymers. 67056 Ludwigshafen : BASF SE Pharma Ingredients & Services, 2012. ISBN 978-3-00-039415-7.
87. Breitenbach, J. Melt extrusion: from process to drug delivery technology. European Journal of Pharmaceutics and Biopharmaceutics. 2002, Vol. 54, 2.
88. Computational Toxicology Research. [Online] United States Environmental Protection Agency. [Cited: March 15, 2014.] http://actor.epa.gov/actor/GenericChemical?casrn=98-92-0.
89. Fraser K. J., MacFarlane D. R. Phosphonium-Based Ionic Liquids: An Overview. Australian Journal of Chemistry. 2009, Vol. 62, 4.
90. Qian F., Wang J., Hartley R., Tao J., Haddadin R., Mathias N., Hussain M. Revealing facts behind spray dried solid dispersion technology used for solubility enhancement . Pharmaceutical Research. 2012, Vol. 29, 10.
91. Friesen D. T., Shanker R., Crew M., Smithey D. T., Curatolo W.J. , Nightingale J.A. Hydroxypropyl Methylcellulose Acetate Succinate-Based Spray-Dried Dispersions: An Overview. Molecular Pharmaceutics. 2008, Vol. 5, 6.
92. Tao J., Sun Y., Zhang G. G., Yu L. Solubility of small-molecule crystals in polymers: D-mannitol in PVP, indomethacin in PVP/VA, and nifedipine in PVP/VA. Pharmaceutical Research. 2009, Vol. 26, 4.
93. Wyttenbach N., Janas C., Siam M., Eckhard M., Jacob L., Scheubel E., Page S. Miniaturized screening of polymers for amorphous drug stabilization (SPADS): Rapid assessment of solid dispersion systems. European Journal of Pharmaceutics and Biopharmaceutics. 2013, Vol. 84.
94. Qian F., Huang J., Hussain M. Drug–polymer solubility and miscibility: Stability consideration and practical challenges in amorphous solid dispersion development. Journal of Pharmaceutical Sciences. 2010, Vol. 99, 7.
146
95. Varma M. M., Pandi J. K. Dissolution, Solubility, XRD, and DSC Studies on Flurbiprofen-Nicotinamide Solid Dispersions. Drug Development and Industrial Pharmacy. 2005, Vol. 31, 4.
96. Lia B., Koneckea S., Harich K., Wegiel L., Taylor L. S., Edgar K. J. Solid dispersion of quercetin in cellulose derivative matrices influences both solubility and stability. 2013, Vol. 92, 2.
97. Rumondor A., Ivanisevic I., Bates S., Alonzo D. E., Taylor L. S. Evaluation of Drug-Polymer Miscibility in Amorphous Solid Dispersion Systems. Pharmaceutical Research. 2009, Vol. 26, 11.
98. Cundy K. C., Sue I-L., Visor G. C., Marshburn J., Shaw J-P. Oral formulations of adefovir dipivoxil: In vitro dissolution and in vivo bioavailability in dogs. Journal of Pharmaceutical Sciences. 1997, Vol. 86, 12.
99. Yu, Lian. Amorphous pharmaceutical solids: preparation, characterization and stabilization. Advanced Drug Delivery Reviews. 2001, Vol. 48, 1.
100. Balakrishnan T., Damodarkumar S. Phase-transfer catalysis: Free-radical Polymerization of Acrylonitrile Using Potassium Peroxomonosulphate– Tetrabutyl Phosphonium Chloride Catalyst System: A Kinetic Study. Journal of Applied Polymer Science. 2000, Vol. 76, 10.
101. Avdeef V., Box K. J., Hibbert C., Tam K. Y. pH-Metric logP 10. Determination of Liposomal Membrane-Water Partition Coefficients of lonizable Drugs. Pharmaceutical Research . 1998, Vol. 15, 2.
102. Yamashita K., Nakate T., Okimoto K., Ohike A., Tokunaga Y., Ibuki R. Establishment of new preparation method for solid dispersion formulation of tacrolimus. International Journal of Pharmaceutics. 2003, Vol. 237, 1-2.
103. Gao P., Rush B. D., Pfund W. P., Huang T., Bauer J. M., Morozowich W. Development of a supersaturable SEDDS (S-SEDDS) formulation of paclitaxel with improved oral bioavailability. Journal of Pharmaceutical Sciences. 2003, Vol. 92, 12.
104. Alonzo D. E., Zhang G. G., Zhou D., Gao Y., Taylor L. S. Understanding the Behavior of Amorphous Pharmaceutical Systems During Diissolution. Pharmaceutical Research. 2010, Vol. 27, 4.
105. Raghavan R. L., Kiepfer B., Davis A.F., Kazarian S. G., Hadgraft J. Membrane transport of hydrocortisone acetate from supersaturated solutions; the role of polymers. International Journal of Pharmaceutics. 2001, 7.
106. Yamashita S., Furubayashib T., Sezakia H., Tokudac H. Optimized conditions for prediction of intestinal drug permeability using Caco-2 cells. European Journal of Pharmaceutical Sciences. 2000, Vol. 10, 3.
147
107. N., Ghebremeskel A. Use of surfactants as plasticizers in preparing solid dispersions of poorly soluble API: Selection of polymer–surfactant combinations using solubility parameters and testing the processability. International Journal of Pharmaceutics. 2007, Vol. 328, 2.
108. Qian F., Huang J., Zhu Q., Gawel J., Haddadin R., Garmise R., Hussain M. Is a distinctive single Tg a reliable indicator for the homogeneity of amorphous solid dispersion? International Journal of Pharmaceutics. 2010, Vol. 395, 2.
109. Ford J. L., Mann T. E. Fast-Scan DSC and its role in pharmaceutical physical form characterisation and selection . Advanced Drug Delivery Reviews. 2012, Vol. 64, 5.
110. Marsac P. J., Konno H., Taylor L. S. A Comparison of the Physical Stability of Amorphous Felodipine and Nifedipine Systems. Pharmaceutical Research. 2006, Vol. 23, 10.
111. Palin K. J., Whalley D. R., Wilson C. G., Davis S. S., Phillips A. J. Determination of gastric-emptying profiles in the rat: influence of oil structure and volume. International Journal of Pharmaceutics. 1982, Vol. 12, 4.
112. Rao S. S .C, Kuo B., McCallum R. W., Chey W.D., Parkman H. P. Investigation of Colonic and Whole-Gut Transit With Wireless Motility Capsule and Radiopaque Markers in Constipation. Clinical Gastroenterology and Hepatology. 2009, Vol. 7, 5.
113. Dressman, J. Comparison of Canine and Human Gastrointestinal Physiology. Pharmaceutical Research. 1986, Vol. 3, 3.
114. Steiner R., Werner I., Galli B., Widmer T. Diploma Thesis: The Path from Formulation Principles: Formulations – in vitro / in vivo Testing – Modeling. s.l. : ETH Zurich & Novartis Pharma AG, 2012.
115. Ku M. S. Use of the Biopharmaceutical Classification System in Early Drug Development. American Association of Pharmaceutical Scientists. 2008, 1.
116. Vagt, U. Toxicology of Ionic Liquids. Basel : BASF SE, 2010.
PERMISSIONS
Figure 2: License Number: 3706460688197
Publication: Journal of Pharmaceutical Sciences Title: Supersaturating drug delivery systems: The answer to solubility-limited oral bioavailability? Type Of Use: Dissertation/Thesis

148