Embed Size (px)
Citation preview
This is a repository copy of Lung cancer screening: Does pulmonary nodule detection affect a range of smoking behaviours?.
White Rose Research Online URL for this paper:https://eprints.whiterose.ac.uk/139428/
Version: Accepted Version
Article:
Clark, ME, Young, Ben orcid.org/0000-0001-6451-9360, Bedford, LE et al. (8 more authors) (2018) Lung cancer screening: Does pulmonary nodule detection affect a range of smoking behaviours? Journal of public health. pp. 1-9. ISSN 1741-3842
https://doi.org/10.1093/pubmed/fdy158
[email protected]://eprints.whiterose.ac.uk/
Reuse
Items deposited in White Rose Research Online are protected by copyright, with all rights reserved unless indicated otherwise. They may be downloaded and/or printed for private study, or other acts as permitted by national copyright laws. The publisher or other rights holders may allow further reproduction and re-use of the full text version. This is indicated by the licence information on the White Rose Research Online record for the item.
Takedown
If you consider content in White Rose Research Online to be in breach of UK law, please notify us by emailing [email protected] including the URL of the record and the reason for the withdrawal request.
Lung cancer screening: Does pulmonary nodule detection affect a range of smoking
behaviours?
Authors
Dr Marcia E Clark, Academic Clinical Fellow, Division of Primary Care, Floor 13, Tower Building,
University Park, University of Nottingham, Nottingham, NG7 2RD.
Ben Young, PhD student, Division of Primary Care, Floor 13, Tower Building, University Park, University
of Nottingham, Nottingham, NG7 2RD.
Laura E Bedford, Research Fellow, School of Pharmacy, Queen’s University Belfast, 97 Lisburn Road,
Belfast, BT9 7BL.
Prof John FR Robertson, Professor of Surgery, Faculty of Medicine and Health Sciences, University of
Nottingham, Queen’s Medical Centre, Nottingham, NG7 2UH
Prof Roshan das Nair, Professor of Clinical Psychology & Neuropsychology, C22, Institute of Mental
Health, Jubilee Campus, University of Nottingham, Nottingham, NG8 1BB
Prof Kavita Vedhara, Professor of Health Psychology, Division of Primary Care, Floor 13, Tower
Building, University Park, University of Nottingham, Nottingham, NG7 2RD
Prof Francis Sullivan, Professor of Primary Care Medicine, University of St Andrews, School of
Medicine, North Haugh, St Andrews, KY16 9TF
Prof Frances S Mair, Norie Miller Professor of General Practice, Head of General Practice and Primary
Care, Institute of Health and Wellbeing, MVLS, University of Glasgow, 1 Horselethill Road, Glasgow,
G12 9LX
Dr Stuart Schembri, Consultant in Respiratory Medicine, Scottish Centre for Respiratory Research,
University of Dundee, Ninewells Hospital and Medical School, Dundee, DD1 9SY
Dr Roberta C Littleford, Assistant Director , Tayside Clinical Trials Unit (TCTU), Tayside Medical
Science Centre (TASC), University of Dundee, School of Medicine, Ninewells Hospital and
Medical School, Residency Block, Level 3, George Pirie Way, Dundee DD1 9SY
*Prof Denise Kendrick, Professor of Primary Care Research, Division of Primary Care, Floor 13, Tower
Building, University Park, University of Nottingham, Nottingham, NG7 2RD
*Corresponding author
Email address: [email protected]
Abstract word count: 200
Article word count: 2950 (excluding abstract, references, tables and figures)
Abstract
Background
Lung cancer screening can reduce lung cancer mortality by 20%. Screen-detected abnormalities may
provide teachable moments for smoking cessation. This study assesses impact of pulmonary nodule
detection on smoking behaviours within the first UK trial of a novel auto-antibody test, followed by
chest x-ray and serial CT scanning for early detection of lung cancer (Early Cancer Detection Test-Lung
Cancer Scotland Study).
Methods
Test-positive participants completed questionnaires on smoking behaviours at baseline, 1, 3 and
6 months. Logistic regression compared outcomes between nodule (n=95) and normal CT groups
(n=174) at 3 and 6 months follow-up.
Results
No significant differences were found between the nodule and normal CT groups for any smoking
behaviours and odds ratios comparing the nodule and normal CT groups did not vary significantly
between 3 and 6 months. There was some evidence the nodule group were more likely to report
significant others wanted them to stop smoking than the normal CT group (OR across 3 and 6 month
time points: 3.04, 95%CI 0.95, 9.73; p=0.06).
Conclusion
Pulmonary nodule detection during lung cancer screening has little impact on smoking behaviours.
Further work should explore whether lung cancer screening can impact on perceived social pressure
and promote smoking cessation.
Keywords
Pulmonary nodules, lung cancer screening, smoking behaviour
Introduction
Lung cancer is the most common cause of cancer-related death, with approximately 1.59 million
deaths worldwide in 2012.1 Despite 1-year survival in England improving from 17% in 1990 to 29%
and 33% for men and women respectively in 2010,2 mortality remains high, with a 5-year survival rate
in England and Wales of only 9.5%.1 In Scotland, both lung cancer incidence and mortality are
significantly higher than those for England, Wales and Northern Ireland.1
Lung cancer mortality could be reduced with screening. The National Lung Cancer Screening Trial
(NLST) showed serial computed tomography (CT) scanning reduced lung cancer mortality by 20%. 3
However, before introduction of screening programmes, it is necessary to ensure that the overall
benefits outweigh the harms.4 Pulmonary nodules, an incidental finding, are an example of a potential
harm 5 and were found in 25% of screened individuals in the NLST.3 Pulmonary nodules are widely
defined as lesions in the lung less than 3cm in diameter that are entirely surrounded by normal lung
tissue.6, 7 Depending on size and patient history they are regularly monitored for changes for 1-5
years.8 As a result, individuals found to have pulmonary nodules may perceive that regular
surveillance means that smoking cessation is not necessary, reducing motivations to quit.9 Concern
has also been expressed that those with normal CT scans may interpret this as a “licence to smoke”.10
As the majority (85-90%) of lung cancer is attributable to smoking and lung cancer risk reduces
substantially (by 80-90%) after smoking is stopped for more than 15 years11, it is important to assess
the impact of CT findings from lung cancer screening on smoking behaviour. Several lung cancer
screening studies from outside the UK have shown that individuals with an abnormal CT scan
(including pulmonary nodules) are more likely to remain abstinent from smoking or stop smoking than
those with a normal CT scan.10, 12-17 More recently, the UK Lung Cancer Screening Trial (UKLS) reported
no significant effect of needing additional investigations following an abnormal CT result on smoking
cessation compared to those with a negative CT result in the short term (approximately 2 weeks
following CT result). However, those needing additional investigations were significantly more likely
to have stopped smoking up to 2 years later than those with a negative CT result. 18
The Early Cancer Detection Test – Lung Cancer Scotland Study (ECLS Study)19 is evaluating use of a
novel auto-antibody test20 as a method of case finding in lung cancer screening. This differs from
previous lung cancer screening studies, as only those with a positive auto-antibody test receive CT
scanning. Our study assesses the short and medium-term impact on self-reported smoking behaviour,
intentions, confidence in stopping smoking, motivation, perceived health benefits and social pressure
to stop smoking amongst auto-antibody test positive participants in the ECLS study, comparing those
who were and those who were not found to have pulmonary nodules on their first CT scan.
Methods
The ECLS study is a randomised controlled trial assessing the effectiveness of a blood test, measuring
autoantibodies against seven antigens (Early CDT®-Lung test) as a technique for lung cancer
screening.19, 20 Individuals from Greater Glasgow and Clyde or Tayside NHS board areas were invited
to participate in the study if they were aged 50-75 years with a minimum of a 20 pack-year smoking
history (current and ex-smokers) or those with fewer pack-years and a first degree relative with lung
cancer. Participants completed a baseline questionnaire prior to randomisation to an Early CDT®-Lung
test group or a non-screened control group. Those with positive Early CDT®-Lung tests were given
verbal and written information explaining the subsequent investigations; a chest x-ray and CT scan,
followed by 6-monthly CT scans for 2 years. The potential for finding a pulmonary nodule on their CT
scan was also explained. The majority of CT scan results were provided in writing, with a small number
given verbally.
ECLS study participants who consented to be contacted were invited to participate in a sub-study,
assessing psychological and behavioural responses to lung cancer screening. Additional
questionnaires were completed at 1, 3, 6 and 12 months by those in the control and Early CDT®-
negative groups and at 1, 3, 6, 12, 18 and 24 months in the Early CDT®-positive group. Responders to
questionnaires were sent a £5 gift voucher. Non-responders were given postal and telephone
reminders. This paper presents analyses of outcomes in relation to smoking behaviours (short and
medium-term impact on self-reported smoking behaviour, intentions, confidence in stopping
smoking, motivation, perceived health benefits and social pressure to stop smoking) from participants
in the Early CDT®-positive group who completed baseline and at least one follow-up questionnaire at
3 or 6 months, and had a CT scan within the first three months of the study. 1 month follow-up data
was not used in these analyses as most participants had not received their CT scan results at this time
point. Those with pulmonary nodule(s) ≤ 8 mm in diameter on their first CT scan were categorised as
being in the nodule group and those with a normal CT (this includes those with previously known
stable pathology) were categorised as being in the normal CT group. Those diagnosed with lung
cancer, those withdrawing from the study, those with CT findings other than normal or nodule(s)
≤8mm in diameter and those not responding to ≥2 consecutive follow-up questionnaires were
ineligible for the current study.
Data collection
Participant baseline demographics including age, gender, smoking history, ethnic group, marital
status, postcode, age at leaving full time education, employment status, family history of lung cancer
(first-degree relative) and antidepressant medication use was collected at trial recruitment between
December 2013 and April 2015. Baseline data was collected prior to receiving the Early CDT®-Lung test
result. A number of questions were used to determine smoking behaviours for those participants who
had smoked cigarettes or tobacco during the previous week. Supplementary Table I summarises the
data collected.
Analysis
Data analysis was undertaken using Stata Statistical Software version 13.1.21 Continuous baseline
characteristics were non-normally distributed and are described using medians and interquartile
ranges (IQR). Frequencies and percentages were used to describe categorical data. Baseline data for
the normal CT and nodule groups was compared using chi-squared tests and Mann-Whitney U tests
for categorical and continuous variables respectively. Fisher’s exact test was used where expected
numbers were small.
Logistic regression models, with standard errors adjusted to account for multiple responses per
participant, were used to compare smoking behaviours between the normal CT and nodule groups.
Group by time interaction terms were added to models to assess whether any differences between
the nodule and normal CT groups varied between 3 and 6 months, with a p-value of <0.01 taken as
significant. Where there were no significant differences over time, a single odds ratio was presented
across all follow-up time points. The number of cigarettes smoked per day was the only continuous
outcome. Model checking indicated residual values were not normally distributed with constant
variance. Assumptions were still not met using a logarithmic transformation, hence the number of
cigarettes smoked per day was dichotomised into <median or ≥median and analysed using logistic
regression as described above. In the main analysis, models were adjusted for baseline values of the
outcome variable. In addition, models were also adjusted for study centre, age group (50-54, 55-59,
60-64, 65-69, 70-74 years), and sex as these were the minimisation variables for randomisation to
Early CDT®-Lung test or no-test group in the ECLS trial.
Results
Supplementary figure 1 outlines the flow of participants through the study. In total, 338 test-positive
ECLS trial participants took part in the smoking behaviour study. Of these 269 (174 in the normal CT
group and 95 in the nodule group) were eligible to be included in the analyses presented in this paper.
Completion rates for follow-up questionnaires were 95% at 3 months and 94% at 6 months. The
baseline demographics of the participants by nodule status are shown in Table I. There were no
statistically significant differences between the two groups.
Table II shows baseline smoking behaviours. No significant differences were seen for any of the
behaviours between the two groups. Smoking behaviours at 3 and 6 months are shown in Table III.
Of note, the proportion smoking in the last week or in the period since the preceding questionnaire
were lower at both follow-up time points than at baseline with similar reductions in the nodule and
normal CT group (e.g. 58% and 56% smoking in the last week in the nodule and normal CT groups
respectively at baseline compared to 47% and 46% at 3 months and 47% and 44% at 6 months
respectively). Other smoking behaviours also appeared stable between 3 and 6 months in both the
nodule and normal CT groups. There were few differences between the nodule and normal CT groups
at 3 or 6 months for most smoking behaviours. At both 3 and 6 months, a higher proportion of nodule
group participants smoked within thirty minutes of waking and were certain they could give up
smoking for good and a lower proportion were trying to stop smoking than those in the normal CT
group. However the differences between the nodule and normal CT group were of a similar magnitude
to those at baseline (table II).
Table IV shows odds ratios across both follow-up time points, adjusted for baseline values, comparing
the nodule to the normal CT group. There were no significant differences in any smoking behaviours
between the nodule and normal CT groups across both follow-up time points and odds ratios
comparing the nodule and normal CT groups did not vary significantly between 3 and 6 months.. There
was some evidence that the nodule group were more likely to report significant others wanted them
to stop smoking than the normal CT group (OR across 3 and 6 month time points: 3.04, 95%CI 0.95,
9.73; p=0.06). Adjusting models for study centre, age group and sex made little difference to the
findings (supplementary table II).
Discussion
Main study findings
This study found being diagnosed with pulmonary nodules following lung cancer screening with a
positive Early CDT®-test and a CT scan appeared to have little impact on smoking behaviour,
intentions, confidence in stopping smoking, motivation or perceived health benefits. Being diagnosed
with pulmonary nodules may impact on social pressure to stop smoking as there was some evidence
that those with pulmonary nodules were more likely to report that significant others wanted them to
stop compared to the normal CT group.
What is already known on this topic?
A small number of studies have explored smoking behaviour of individuals diagnosed with pulmonary
nodules during lung cancer screening. A systematic review in 201422 reported findings from five
studies,10, 12, 13, 23, 24 with three studies finding significantly higher abstinence rates amongst those with
CT results that were concerning, but not diagnostic for lung cancer, than in those whose scan results
were not concerning for lung cancer.12, 13, 23 They also found that a higher number of abnormal CT
results may be associated with higher abstinence rates. 22 However, two studies failed to find a
significant difference between those with and without abnormal CT results,10, 24 and our findings are
consistent with these. A more recent UK study also found those needing additional investigations were
significantly more likely to stop smoking up to 2 years after screening than the control group or the
screen negative group.18 Studies showing higher abstinence rates in those with abnormal CT results12,
13, 18, 23 had similar study populations to ours, but had longer follow-up periods or a greater number of
screening rounds and most had lower follow-up rates. 12, 18, 23 These studies also used different
measures of smoking behaviour than in our study. These differences may account for variation in
findings between these studies and our study. Our finding that smoking behaviours appeared stable
over time in the normal CT group suggests a normal result is not being interpreted by participants as
a “licence to smoke”. This is consistent with findings from several previous studies.10, 14, 18
Why might a positive Early CDT®-test coupled with pulmonary nodules on CT scan have little impact
on smoking behaviour? Both groups showed reductions in smoking prevalence at 3 and 6 months
compared to baseline so the positive EarlyCDT-Lung test may have had a greater impact on smoking
than the finding of pulmonary nodules on CT scans. One potential explanation is that those in the
nodule group may have been provided with a degree of reassurance because they may have perceived
their nodules as a reason for having a positive Early CDT®-Lung test. This is supported by a qualitative
study from America, which found individuals diagnosed with nodules felt that this meant that
screening was working, that lung nodules represented lung cancer found so early that it was harmless
at that point in time and that repeated scans would indicate when it was time to stop smoking, for
example, when changes were seen on future imaging.9 However, it would seem that this reassurance
may not have been felt by the friends and family of study participants as the nodule group appeared
to be more likely to report significant others wanted them to stop than the normal CT group. To our
knowledge, this is a new finding in the context of lung cancer screening, and one that requires
confirmation from other studies. It is also possible that the impact of an abnormal CT result may be
more apparent at later follow-up time points. The UKLS reported short and longer term follow-up,
finding no impact on smoking cessation in the short term (2 weeks post CT result), but a significant
impact up to 2 years later in those requiring additional investigations.18 This, coupled with the finding
of a dose-response relationship between the number of abnormal CT scans and abstinence rates,
suggests exploring the impact of pulmonary nodules on smoking behaviour at later time points in the
ECLS trial may be useful.
Several lung cancer screening studies have incorporated and evaluated smoking cessation
interventions,25-28 with some positive findings, and although further research is needed in this area,
smoking cessation interventions are recommended, at each screening round, for smokers who take
part in lung cancer screening programmes.29 One issue to consider is whether providing smoking
cessation support as part of a lung cancer screening programme may affect willingness to undergo
screening. Lung cancer screening studies, including those in the UK, have shown evidence of
participation bias, with lower participation rates in current than ex-smokers.30-32 Lower participation
rates amongst those at higher risk of lung cancer will impact on the effectiveness of screening
programmes. A recent meta-synthesis of qualitative studies exploring cancer screening attendance
decisions in the UK found screening can be perceived as an attempt to exert control over individuals,
which individuals felt should be resisted.33 Focus groups conducted prior to the ECLS trial also found
some individuals worried about being coerced into stopping smoking if they took part in lung cancer
screening.34 It is possible that smokers may decline lung cancer screening because they do not want
to stop smoking. It is therefore important that screening information addresses this issue and that
smoking cessation provided as part of a lung cancer screening programme is delivered in a sensitive
and non-threatening manner.
What this study adds
Detection of pulmonary nodules on a CT scan following lung cancer screening in the UK does not
appear to impact substantially on smoking behaviour. However, receiving a positive Early CDT®-Lung
test may have reduced smoking prevalence and this possibility will be explored in the main trial
analysis. If the UK implements a lung cancer screening programme, this would present an ideal
opportunity to evaluate the impact of smoking cessation support nested within the screening
programme. Our findings suggest research exploring the potential for, and impact of exploiting the
greater perceived social pressure to quit in those with pulmonary nodules would be useful. In
addition, it would also be important to explore the impact of the information provided to those invited
to screening, the impact of providing screening results and abnormal CT findings in the presence of
significant others (with appropriate patient consent) and the impact of incorporating smoking
cessation on screening uptake and whether this differs by lung cancer risk.
Study limitations
This is the first study examining the smoking behaviour following detection of pulmonary nodules on
a chest CT scan in those with a positive Early CDT®-Lung test within a UK population. We achieved a
very high follow-up rate which was higher than several previous studies,12, 18, 23 used a range of
questions to establish smoking behaviour and adjusted analyses for baseline responses. Our study
sample comprised those with positive Early CDT®-Lung test results in the main trial and a post-hoc
power calculation indicates it provided 80% power at the 5% significance level to detect a difference
at 3 months follow-up of 18% in the proportion reporting smoking in the last month (i.e. 40% in the
nodule group and 58% in the normal CT group; equivalent to 31% of smokers stopping smoking). This
is similar to quit rates in those with abnormal CT results from several other studies; 62% in the study
by Ostroff10, 42% in the study by Townsend,12 30% in the UKLS pilot study18 and 26% in the study by
Styn,13 but higher than quit rates in the Danish LCST (18%)23 and the NELSON trial (12%).24 Our study
therefore may not have had adequate power to detect small, but potentially clinically important
differences in smoking outcomes. Also, as only a small proportion of participants would have received
their CT scan result at the time of completing the 1 month questionnaires, we were unable to explore
the immediate impact of pulmonary nodule detection on smoking outcomes.
Funding
This work was supported by a National Institute for Health Research (NIHR) School for Primary Care
Research (SPCR) funded academic clinical fellowship. The views expressed are those of the author(s)
and not necessarily those of the NIHR, the NHS or the Department of Health. The ECLS study was
supported by the Chief Scientist Office and Oncimmune Ltd. The follow-up data collection was
supported by University of Nottingham PhD studentships and by Oncimmune Ltd.
Ethical approval
Ethical approval was given by the East of Scotland Research Ethics Service as an amendment to the
main ECLS study: REC reference 13/ES/0024, amendment number AM16.
Competing Interests
The University of Nottingham (DK and KV) received funding from Oncimmune Ltd for follow-up data
collection. JR has shares and share options in Oncimmune Ltd, but has not had any company
involvement for over 2 years.
Acknowledgements
We would like to thank participants and general practices for taking part in the study. We also thank
ECLS trial staff for recruiting participants and collecting baseline data. We gratefully acknowledge
the contribution to this study and publication made by the Tayside Clinical Trials Unit (TCTU).
References
1. Cancer Research UK. Lung cancer statistics. Available from:
http://www.cancerresearchuk.org/health-professional/cancer-statistics/statistics-by-cancer-
type/lung-cancer. Accessed 18/5/18.
2. National Cancer Intelligence Network. Recent trends in lung cancer incidence, mortality and
survival. Available from:http://www.ncin.org.uk/publications/. Accessed 18/5/18.
3. The National Lung Screening Trial Research Team. Reduced Lung-Cancer Mortality with Low-
Dose Computed Tomographic Screening. New England Journal of Medicine. 2011; 365:395-409.
4. Nielsen C, Lang RS. Principles of screening. Medical Clinics of North America. 1999; 83:1323-
37.
5. Bach PB, Mirkin JN, Oliver TK, et al. Benefits and harms of CT screening for lung cancer: A
systematic review. JAMA. 2012; 307:2418-29.
6. Callister MEJ, Baldwin DR, Akram AR, Barnard S, Cane P, Draffan J, et al. British Thoracic Society
guidelines for the investigation and management of pulmonary nodules: accredited by NICE. Thorax.
2015; 70:ii1-ii54.
7. Folch EE, Mazzone PJ. Assessment of solitary pulmonary nodule BMJ Best Practice. 2015.
8. MacMahon H, Naidich DP, Goo JM, Lee KS, Leung ANC, Mayo JR, et al. Guidelines for
Management of Incidental Pulmonary Nodules Detected on CT Images: From the Fleischner Society
2017. Radiology. 0:161659.
9. Zeliadt SB, Heffner JL, Sayre G, et al. Attitudes and perceptions about smoking cessation in the
context of lung cancer screening. JAMA internal medicine. 2015; 175:1530-7.
10. Ostroff JS, Buckshee N, Mancuso CA, Yankelevitz DF, Henschke CI. Smoking Cessation
Following CT Screening for Early Detection of Lung Cancer. Preventive Medicine. 2001; 33:613-21.
11. Dela Cruz CS, Tanoue LT, Matthay RA. Lung cancer: epidemiology, etiology, and prevention.
Clinics in chest medicine. 2011; 32:605-44.
12. Townsend CO, Clark MM, Jett JR, Patten CA, Schroeder DR, Nirelli LM, et al. Relation between
smoking cessation and receiving results from three annual spiral chest computed tomography scans
for lung carcinoma screening. Cancer. 2005; 103:2154-62.
13. Styn MA, Land SR, Perkins KA, Wilson DO, Romkes M, Weissfeld JL. Smoking Behavior 1 Year
after Computed Tomography Screening for Lung Cancer: Effect of Physician Referral for Abnormal CT
Findings. Cancer Epidemiology Biomarkers & Prevention. 2009; 18:3484-9.
14. Tammemagi MC, Berg CD, Riley TL, Cunningham CR, Taylor KL. Impact of lung cancer screening
results on smoking cessation. Journal of the National Cancer Institute. 2014; 106:dju084.
15. Borondy Kitts AK, McKee AB, Regis SM, Wald C, Flacke S, McKee BJ. Smoking cessation results
in a clinical lung cancer screening program. Journal of thoracic disease. 2016; 8:S481-7.
16. Clark MA, Gorelick JJ, Sicks JD, Park ER, Graham AL, Abrams DB, et al. The Relations Between
False Positive and Negative Screens and Smoking Cessation and Relapse in the National Lung Screening
Trial: Implications for Public Health. Nicotine & tobacco research : official journal of the Society for
Research on Nicotine and Tobacco. 2016; 18:17-24.
17. Freiman MR, Clark JA, Slatore CG, Gould MK, Woloshin S, Schwartz LM, et al. Patients'
Knowledge, Beliefs, and Distress Associated with Detection and Evaluation of Incidental Pulmonary
Nodules for Cancer: Results from a Multicenter Survey. Journal of thoracic oncology : official
publication of the International Association for the Study of Lung Cancer. 2016; 11:700-8.
18. Brain K, Carter B, Lifford KJ, Burke O, Devaraj A, Baldwin DR, et al. Impact of low-dose CT
screening on smoking cessation among high-risk participants in the UK Lung Cancer Screening Trial.
Thorax. 2017; 72:912.
19. Sullivan FM, Farmer E, Mair FS, Treweek S, Kendrick D, Jackson C, et al. Detection in blood of
autoantibodies to tumour antigens as a case-finding method in lung cancer using the EarlyCDT®-Lung
Test (ECLS): study protocol for a randomized controlled trial. BMC cancer. 2017; 17:187.
20. Chapman CJ, Healey GF, Murray A, Boyle P, Robertson C, Peek LJ, et al. EarlyCDT®-Lung test:
improved clinical utility through additional autoantibody assays. Tumour Biology. 2012; 33:1319-26.
21. StataCorp. Stata Statistical Software. Texas.
22. Slatore CG, Baumann C, Pappas M, Humphrey LL. Smoking behaviors among patients receiving
computed tomography for lung cancer screening. Systematic review in support of the U.S. preventive
services task force. Annals of the American Thoracic Society. 2014; 11:619-27.
23. Ashraf H, Tønnesen P, Holst Pedersen J, Dirksen A, Thorsen H, Døssing M. Effect of CT
screening on smoking habits at 1-year follow-up in the Danish Lung Cancer Screening Trial (DLCST).
Thorax. 2009; 64:388-92.
24. van der Aalst CM, van Klaveren RJ, van den Bergh KAM, Willemsen MC, de Koning HJ. The
impact of a lung cancer computed tomography screening result on smoking abstinence. European
Respiratory Journal. 2011; 37:1466-73.
25. Clark MM, Cox LS, Jett JR, Patten CA, Schroeder DR, Nirelli LM, et al. Effectiveness of smoking
cessation self-help materials in a lung cancer screening population. Lung cancer (Amsterdam,
Netherlands). 2004; 44:13-21.
26. Ferketich AK, Otterson GA, King M, Hall N, Browning KK, Wewers ME. A pilot test of a
combined tobacco dependence treatment and lung cancer screening program. Lung cancer
(Amsterdam, Netherlands). 2012; 76:211-5.
27. Taylor KL, Hagerman CJ, Luta G, Bellini PG, Stanton C, Abrams DB, et al. Preliminary evaluation
of a telephone-based smoking cessation intervention in the lung cancer screening setting: A
randomized clinical trial. Lung cancer (Amsterdam, Netherlands). 2017; 108:242-6.
28. van der Aalst CM, de Koning HJ, van den Bergh KA, Willemsen MC, van Klaveren RJ. The
effectiveness of a computer-tailored smoking cessation intervention for participants in lung cancer
screening: a randomised controlled trial. Lung cancer (Amsterdam, Netherlands). 2012; 76:204-10.
29. Fucito LM, Czabafy S, Hendricks PS, Kotsen C, Richardson D, Toll BA, et al. Pairing smoking-
cessation services with lung cancer screening: A clinical guideline from the Association for the
Treatment of Tobacco Use and Dependence and the Society for Research on Nicotine and Tobacco.
Cancer. 2016; 122:1150-9.
30. Ali N, Lifford KJ, Carter B, McRonald F, Yadegarfar G, Baldwin DR, et al. Barriers to uptake
among high-risk individuals declining participation in lung cancer screening: a mixed methods analysis
of the UK Lung Cancer Screening (UKLS) trial. BMJ open. 2015; 5.

31. McRonald FE, Yadegarfar G, Baldwin DR, Devaraj A, Brain KE, Eisen T, et al. The UK Lung Screen
(UKLS): demographic profile of first 88,897 approaches provides recommendations for population
screening. Cancer prevention research (Philadelphia, Pa). 2014; 7:362-71.
32. The National Lung Screening Trial Research Team Writing committee, Aberle DR, Adams AM,
Berg CD, Clapp JD, Clingan KL, et al. Baseline Characteristics of Participants in the Randomized National
Lung Screening Trial. Journal of the National Cancer Institute. 2010; 102:1771-9.
33. Young B, Bedford L, Kendrick D, Vedhara K, Robertson JFR, das Nair R. Factors influencing the
decision to attend screening for cancer in the UK: a meta-ethnography of qualitative research. Journal
of public health (Oxford, England). 2017:1-25.
34. das Nair R, Orr KS, Vedhara K, Kendrick D. Exploring recruitment barriers and facilitators in
early cancer detection trials: the use of pre-trial focus groups. Trials. 2014; 15:98.
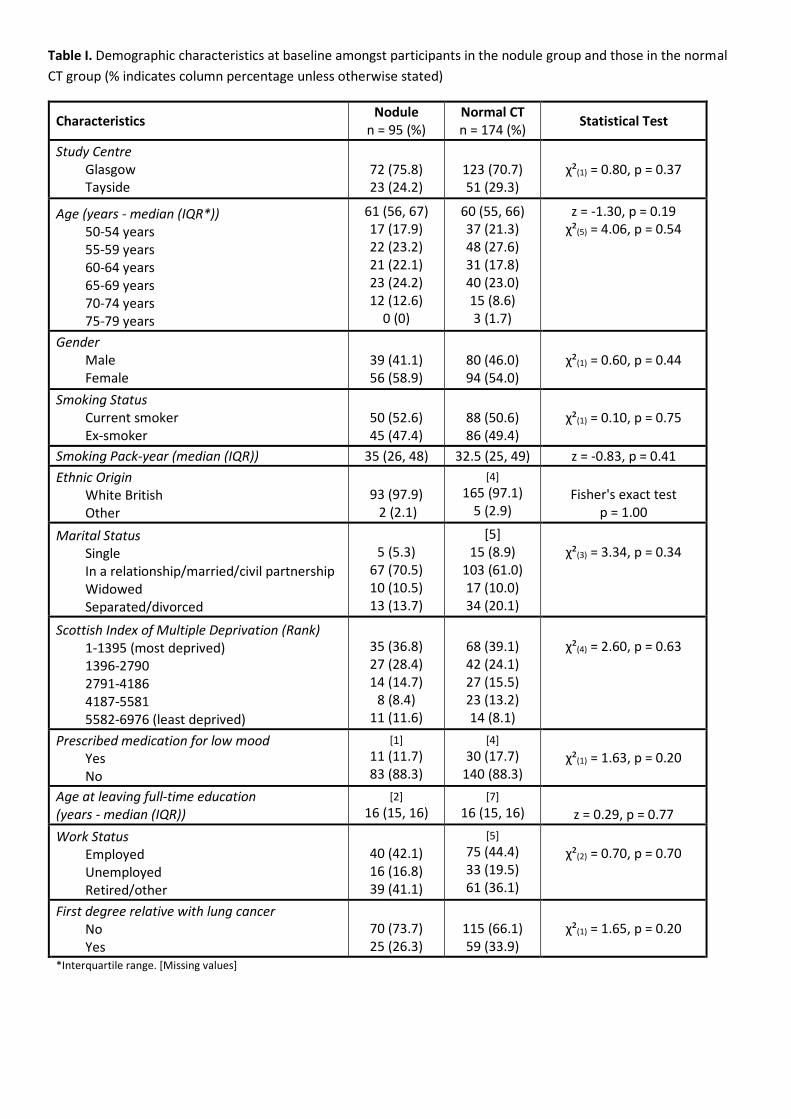
Table I. Demographic characteristics at baseline amongst participants in the nodule group and those in the normal
CT group (% indicates column percentage unless otherwise stated)
Characteristics Nodule
n = 95 (%)
Normal CT
n = 174 (%) Statistical Test
Study Centre
Glasgow
Tayside
72 (75.8)
23 (24.2)
123 (70.7)
51 (29.3)
χ²(1) = 0.80, p = 0.37
Age (years - median (IQR*))
50-54 years
55-59 years
60-64 years
65-69 years
70-74 years
75-79 years
61 (56, 67)
17 (17.9)
22 (23.2)
21 (22.1)
23 (24.2)
12 (12.6)
0 (0)
60 (55, 66)
37 (21.3)
48 (27.6)
31 (17.8)
40 (23.0)
15 (8.6)
3 (1.7)
z = -1.30, p = 0.19
χ²(5) = 4.06, p = 0.54
Gender
Male
Female
39 (41.1)
56 (58.9)
80 (46.0)
94 (54.0)
χ²(1) = 0.60, p = 0.44
Smoking Status
Current smoker
Ex-smoker
50 (52.6)
45 (47.4)
88 (50.6)
86 (49.4)
χ²(1) = 0.10, p = 0.75
Smoking Pack-year (median (IQR)) 35 (26, 48) 32.5 (25, 49) z = -0.83, p = 0.41
Ethnic Origin
White British
Other
93 (97.9)
2 (2.1)
[4]
165 (97.1)
5 (2.9)
Fisher's exact test
p = 1.00
Marital Status
Single
In a relationship/married/civil partnership
Widowed
Separated/divorced
5 (5.3)
67 (70.5)
10 (10.5)
13 (13.7)
[5]
15 (8.9)
103 (61.0)
17 (10.0)
34 (20.1)
χ²(3) = 3.34, p = 0.34
Scottish Index of Multiple Deprivation (Rank)
1-1395 (most deprived)
1396-2790
2791-4186
4187-5581
5582-6976 (least deprived)
35 (36.8)
27 (28.4)
14 (14.7)
8 (8.4)
11 (11.6)
68 (39.1)
42 (24.1)
27 (15.5)
23 (13.2)
14 (8.1)
χ²(4) = 2.60, p = 0.63
Prescribed medication for low mood
Yes
No
[1]
11 (11.7)
83 (88.3)
[4]
30 (17.7)
140 (88.3)
χ²(1) = 1.63, p = 0.20
Age at leaving full-time education
(years - median (IQR))
[2]
16 (15, 16)
[7]
16 (15, 16)
z = 0.29, p = 0.77
Work Status
Employed
Unemployed
Retired/other
40 (42.1)
16 (16.8)
39 (41.1)
[5]
75 (44.4)
33 (19.5)
61 (36.1)
χ²(2) = 0.70, p = 0.70
First degree relative with lung cancer
No
Yes
70 (73.7)
25 (26.3)
115 (66.1)
59 (33.9)
χ²(1) = 1.65, p = 0.20
*Interquartile range. [Missing values]
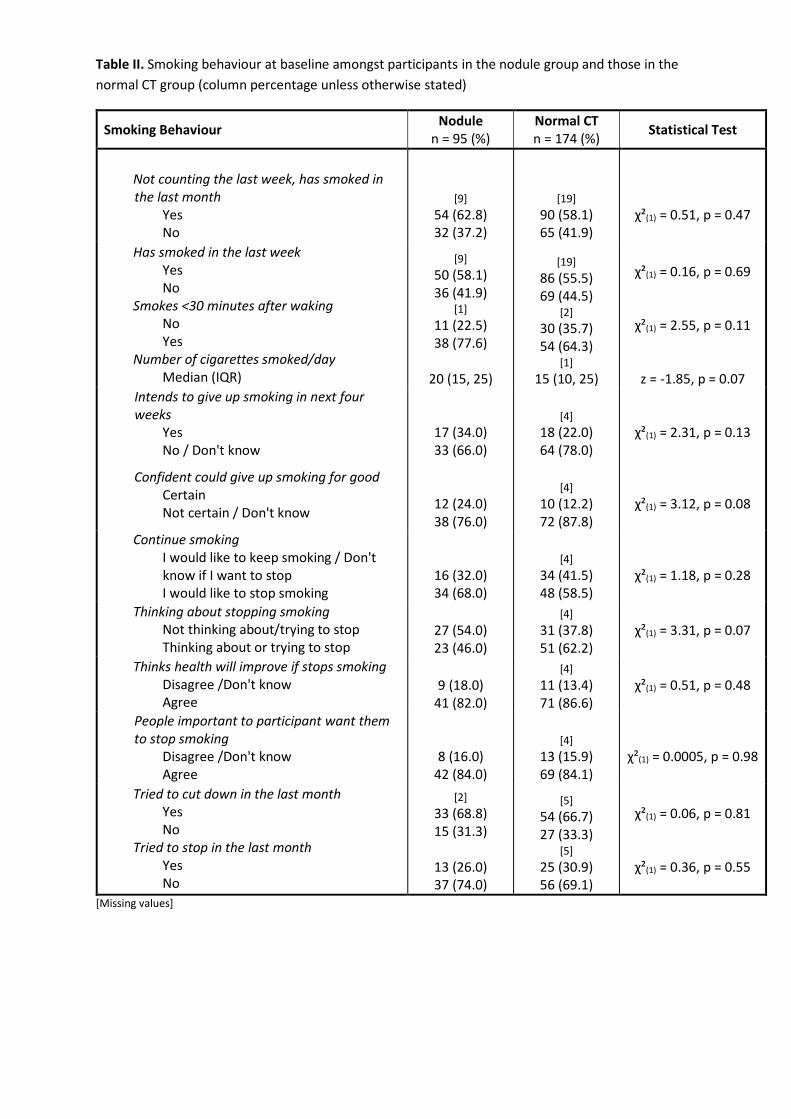
Table II. Smoking behaviour at baseline amongst participants in the nodule group and those in the
normal CT group (column percentage unless otherwise stated)
Smoking Behaviour Nodule
n = 95 (%)
Normal CT
n = 174 (%) Statistical Test
Not counting the last week, has smoked in
the last month
Yes
No
[9]
54 (62.8)
32 (37.2)
[19]
90 (58.1)
65 (41.9)
χ²(1) = 0.51, p = 0.47
Has smoked in the last week
Yes
No
Smokes <30 minutes after waking
No
Yes
Number of cigarettes smoked/day
Median (IQR)
[9]
50 (58.1)
36 (41.9) [1]
11 (22.5)
38 (77.6)
20 (15, 25)
[19]
86 (55.5)
69 (44.5) [2]
30 (35.7)
54 (64.3) [1]
15 (10, 25)
χ²(1) = 0.16, p = 0.69
χ²(1) = 2.55, p = 0.11
z = -1.85, p = 0.07
Intends to give up smoking in next four
weeks
Yes
No / Don't know
17 (34.0)
33 (66.0)
[4]
18 (22.0)
64 (78.0)
χ²(1) = 2.31, p = 0.13
Confident could give up smoking for good
Certain
Not certain / Don't know 12 (24.0)
38 (76.0)
[4]
10 (12.2)
72 (87.8)
χ²(1) = 3.12, p = 0.08
Continue smoking
I would like to keep smoking / Don't
know if I want to stop
I would like to stop smoking
16 (32.0)
34 (68.0)
[4]
34 (41.5)
48 (58.5)
χ²(1) = 1.18, p = 0.28
Thinking about stopping smoking
Not thinking about/trying to stop
Thinking about or trying to stop
27 (54.0)
23 (46.0)
[4]
31 (37.8)
51 (62.2)
χ²(1) = 3.31, p = 0.07
Thinks health will improve if stops smoking
Disagree /Don't know
Agree
9 (18.0)
41 (82.0)
[4]
11 (13.4)
71 (86.6)
χ²(1) = 0.51, p = 0.48
People important to participant want them
to stop smoking
Disagree /Don't know
Agree
8 (16.0)
42 (84.0)
[4]
13 (15.9)
69 (84.1)
χ²(1) = 0.0005, p = 0.98
Tried to cut down in the last month
Yes
No
Tried to stop in the last month
Yes
No
[2]
33 (68.8)
15 (31.3)
13 (26.0)
37 (74.0)
[5]
54 (66.7)
27 (33.3) [5]
25 (30.9)
56 (69.1)
χ²(1) = 0.06, p = 0.81
χ²(1) = 0.36, p = 0.55
[Missing values]
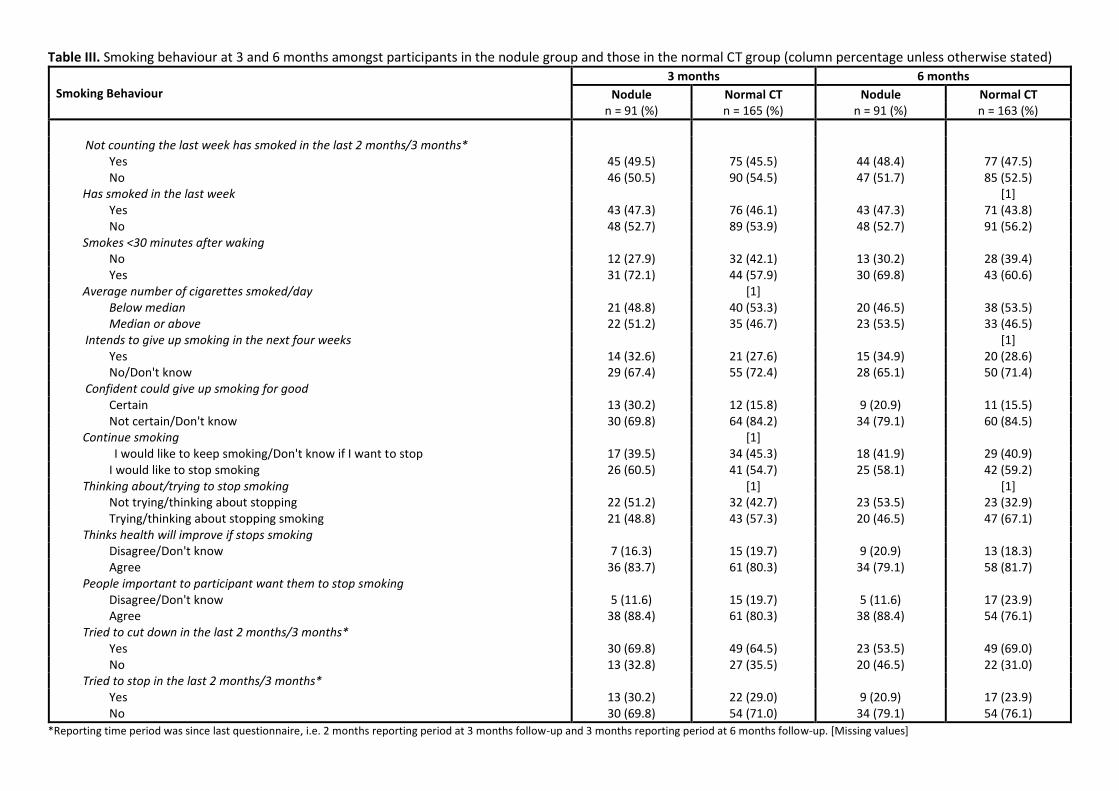
Table III. Smoking behaviour at 3 and 6 months amongst participants in the nodule group and those in the normal CT group (column percentage unless otherwise stated)
Smoking Behaviour
3 months 6 months
Nodule Normal CT Nodule Normal CT
n = 91 (%) n = 165 (%) n = 91 (%) n = 163 (%)
Not counting the last week has smoked in the last 2 months/3 months*
Yes 45 (49.5) 75 (45.5) 44 (48.4) 77 (47.5)
No 46 (50.5) 90 (54.5) 47 (51.7) 85 (52.5)
Has smoked in the last week [1]
Yes 43 (47.3) 76 (46.1) 43 (47.3) 71 (43.8)
No 48 (52.7) 89 (53.9) 48 (52.7) 91 (56.2)
Smokes <30 minutes after waking
No 12 (27.9) 32 (42.1) 13 (30.2) 28 (39.4)
Yes 31 (72.1) 44 (57.9) 30 (69.8) 43 (60.6)
Average number of cigarettes smoked/day [1]
Below median
Median or above
21 (48.8)
22 (51.2)
40 (53.3)
35 (46.7)
20 (46.5)
23 (53.5)
38 (53.5)
33 (46.5)
Intends to give up smoking in the next four weeks [1]
Yes 14 (32.6) 21 (27.6) 15 (34.9) 20 (28.6)
No/Don't know 29 (67.4) 55 (72.4) 28 (65.1) 50 (71.4)
Confident could give up smoking for good
Certain 13 (30.2) 12 (15.8) 9 (20.9) 11 (15.5)
Not certain/Don't know 30 (69.8) 64 (84.2) 34 (79.1) 60 (84.5)
Continue smoking [1]
I would like to keep smoking/Don't know if I want to stop 17 (39.5) 34 (45.3) 18 (41.9) 29 (40.9)
I would like to stop smoking 26 (60.5) 41 (54.7) 25 (58.1) 42 (59.2)
Thinking about/trying to stop smoking [1] [1]
Not trying/thinking about stopping 22 (51.2) 32 (42.7) 23 (53.5) 23 (32.9)
Trying/thinking about stopping smoking 21 (48.8) 43 (57.3) 20 (46.5) 47 (67.1)
Thinks health will improve if stops smoking
Disagree/Don't know 7 (16.3) 15 (19.7) 9 (20.9) 13 (18.3)
Agree 36 (83.7) 61 (80.3) 34 (79.1) 58 (81.7)
People important to participant want them to stop smoking
Disagree/Don't know 5 (11.6) 15 (19.7) 5 (11.6) 17 (23.9)
Agree 38 (88.4) 61 (80.3) 38 (88.4) 54 (76.1)
Tried to cut down in the last 2 months/3 months*
Yes 30 (69.8) 49 (64.5) 23 (53.5) 49 (69.0)
No 13 (32.8) 27 (35.5) 20 (46.5) 22 (31.0)
Tried to stop in the last 2 months/3 months*
Yes 13 (30.2) 22 (29.0) 9 (20.9) 17 (23.9)
No 30 (69.8) 54 (71.0) 34 (79.1) 54 (76.1)
*Reporting time period was since last questionnaire, i.e. 2 months reporting period at 3 months follow-up and 3 months reporting period at 6 months follow-up. [Missing values]
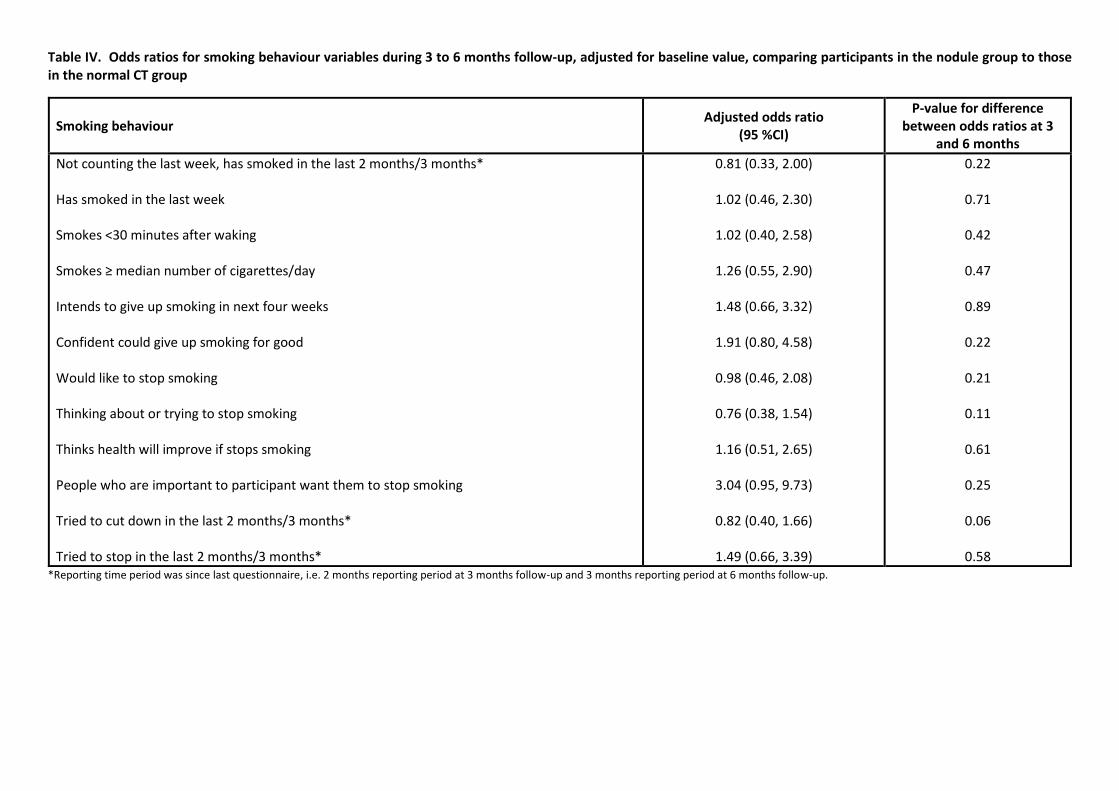
Table IV. Odds ratios for smoking behaviour variables during 3 to 6 months follow-up, adjusted for baseline value, comparing participants in the nodule group to those
in the normal CT group
Smoking behaviour Adjusted odds ratio
(95 %CI)
P-value for difference
between odds ratios at 3
and 6 months
Not counting the last week, has smoked in the last 2 months/3 months*
Has smoked in the last week
Smokes <30 minutes after waking
Smokes ≥ median number of cigarettes/day
Intends to give up smoking in next four weeks
Confident could give up smoking for good
Would like to stop smoking
Thinking about or trying to stop smoking
Thinks health will improve if stops smoking
People who are important to participant want them to stop smoking
Tried to cut down in the last 2 months/3 months*
Tried to stop in the last 2 months/3 months*
0.81 (0.33, 2.00)
1.02 (0.46, 2.30)
1.02 (0.40, 2.58)
1.26 (0.55, 2.90)
1.48 (0.66, 3.32)
1.91 (0.80, 4.58)
0.98 (0.46, 2.08)
0.76 (0.38, 1.54)
1.16 (0.51, 2.65)
3.04 (0.95, 9.73)
0.82 (0.40, 1.66)
1.49 (0.66, 3.39)
0.22
0.71
0.42
0.47
0.89
0.22
0.21
0.11
0.61
0.25
0.06
0.58
*Reporting time period was since last questionnaire, i.e. 2 months reporting period at 3 months follow-up and 3 months reporting period at 6 months follow-up.
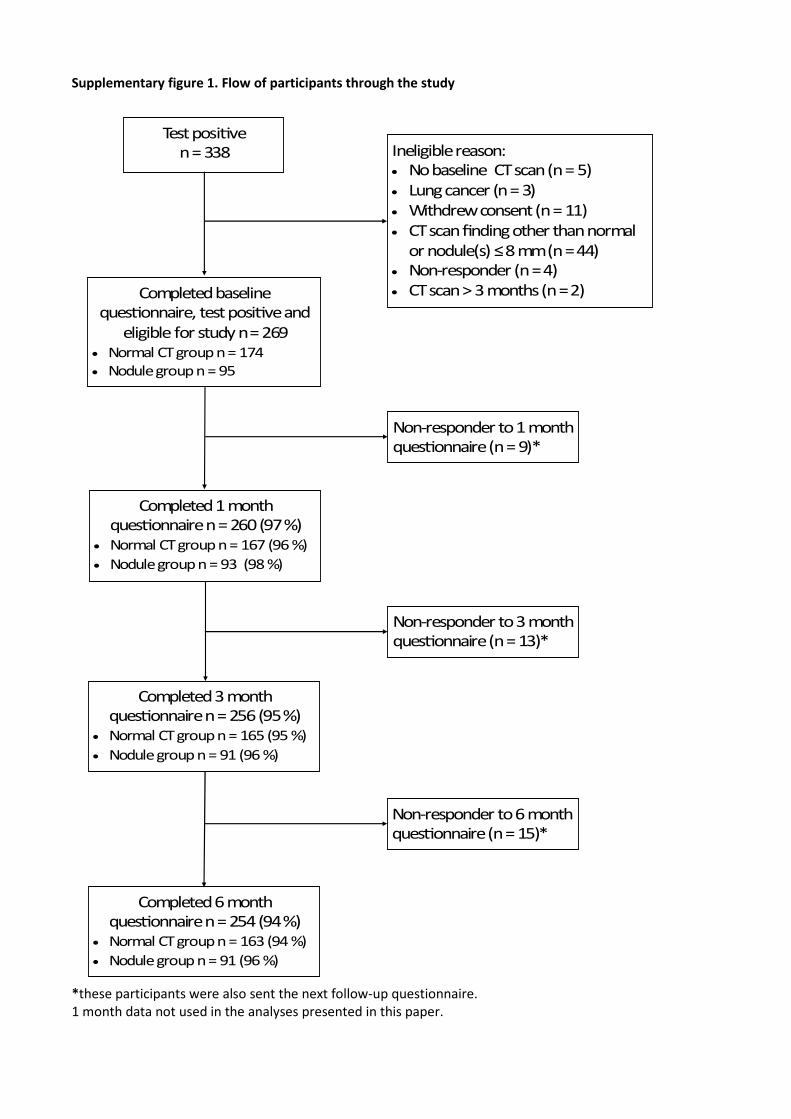
Supplementary figure 1. Flow of participants through the study
*these participants were also sent the next follow-up questionnaire.
1 month data not used in the analyses presented in this paper.
Test posi�ve
n = 338
Completed baseline
ques�onnaire, test posi�ve and
eligible for study n = 269
�� Normal CT group n = 174
�� Nodule group n = 95
Ineligible reason:
�� No baseline CT scan (n = 5)
�� Lung cancer (n = 3)
�� Withdrew consent (n = 11)
�� CT scan finding other than normal
or nodule(s) ≤ 8 mm (n = 44)
�� Non-responder (n = 4)
�� CT scan > 3 months (n = 2)
Completed 1 month
ques�onnaire n = 260 (97 %)
�� Normal CT group n = 167 (96 %)
�� Nodule group n = 93 (98 %)
Completed 3 month
ques�onnaire n = 256 (95 %)
�� Normal CT group n = 165 (95 %)
�� Nodule group n = 91 (96 %)
Completed 6 month
ques�onnaire n = 254 (94 %)
�� Normal CT group n = 163 (94 %)
�� Nodule group n = 91 (96 %)
Non-responder to 1 month
ques�onnaire (n = 9)*
Non-responder to 3 month
ques�onnaire (n = 13)*
Non-responder to 6 month
ques�onnaire (n = 15)*
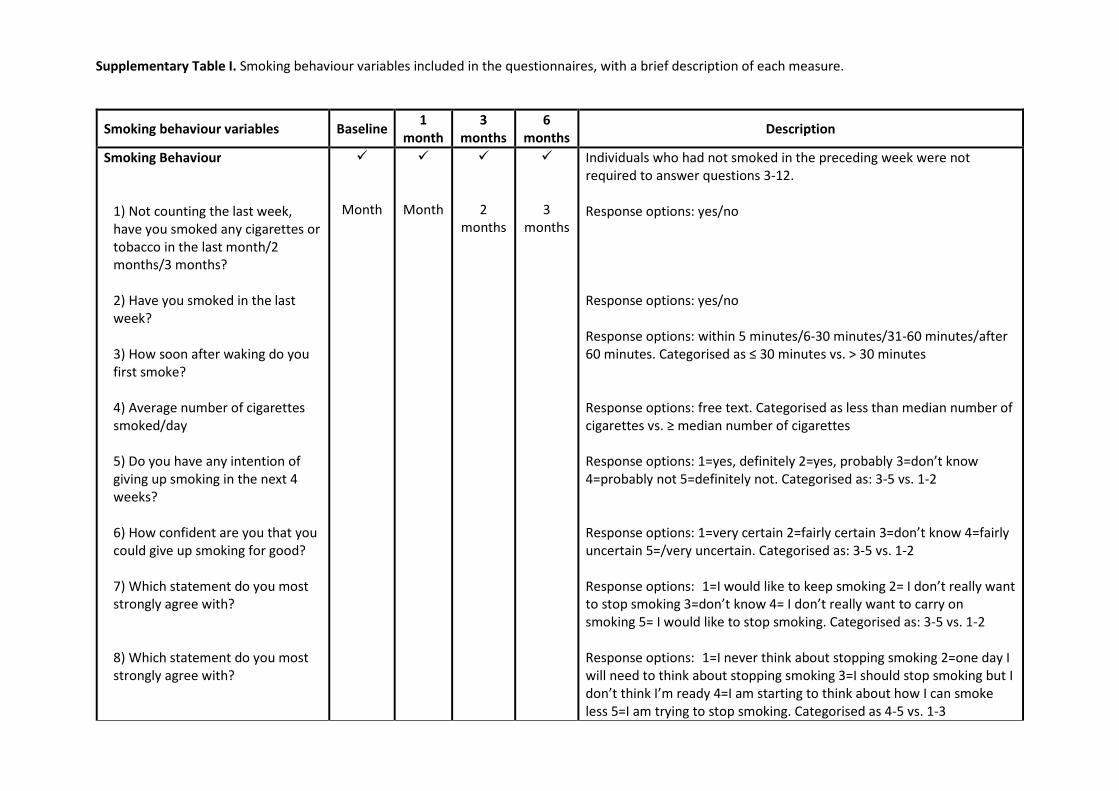
Supplementary Table I. Smoking behaviour variables included in the questionnaires, with a brief description of each measure.
Smoking behaviour variables Baseline 1
month
3
months
6
months Description
Smoking Behaviour
1) Not counting the last week,
have you smoked any cigarettes or
tobacco in the last month/2
months/3 months?
2) Have you smoked in the last
week?
3) How soon after waking do you
first smoke?
4) Average number of cigarettes
smoked/day
5) Do you have any intention of
giving up smoking in the next 4
weeks?
6) How confident are you that you
could give up smoking for good?
7) Which statement do you most
strongly agree with?
8) Which statement do you most
strongly agree with?
�
Month
�
Month
�
2
months
�
3
months
Individuals who had not smoked in the preceding week were not
required to answer questions 3-12.
Response options: yes/no
Response options: yes/no
Response options: within 5 minutes/6-30 minutes/31-60 minutes/after
60 minutes. Categorised as ≤ 30 minutes vs. > 30 minutes
Response options: free text. Categorised as less than median number of
cigarettes vs. ≥ median number of cigarettes
Response options: 1=yes, definitely 2=yes, probably 3=don’t know
4=probably not 5=definitely not. Categorised as: 3-5 vs. 1-2
Response options: 1=very certain 2=fairly certain 3=don’t know 4=fairly
uncertain 5=/very uncertain. Categorised as: 3-5 vs. 1-2
Response options: 1=I would like to keep smoking 2= I don’t really want
to stop smoking 3=don’t know 4= I don’t really want to carry on
smoking 5= I would like to stop smoking. Categorised as: 3-5 vs. 1-2
Response options: 1=I never think about stopping smoking 2=one day I
will need to think about stopping smoking 3=I should stop smoking but I
don’t think I’m ready 4=I am starting to think about how I can smoke
less 5=I am trying to stop smoking. Categorised as 4-5 vs. 1-3

9) My health will improve if I stop
smoking
10) People who are important to
me want me to stop smoking
11) Have you tried to cut down in
the last month/2 months/3
months?
12) Have you tried to stop in the
last month/2 months/3 months?
Month
Month
Month
Month
2
months
2
months
3
months
3
months
Response options: 1=disagree strongly 2=disagree 3= don’t know
4=agree 5= strongly agree. Categorised as 4-5 vs. 1-3
Response options: 1=disagree strongly 2=disagree 3= don’t know
4=agree 5= strongly agree. Categorised as 4-5 vs. 1-3
Response options: yes/ no
Response options: yes/no
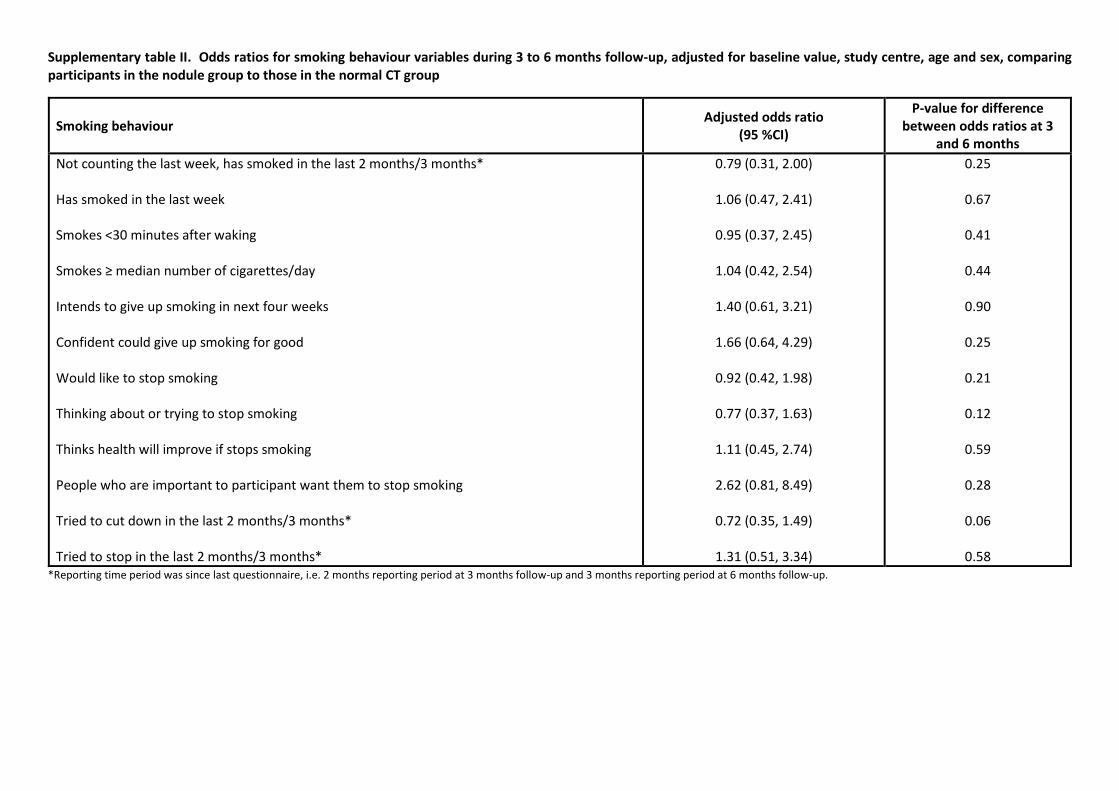
Supplementary table II. Odds ratios for smoking behaviour variables during 3 to 6 months follow-up, adjusted for baseline value, study centre, age and sex, comparing
participants in the nodule group to those in the normal CT group
Smoking behaviour Adjusted odds ratio
(95 %CI)
P-value for difference
between odds ratios at 3
and 6 months
Not counting the last week, has smoked in the last 2 months/3 months*
Has smoked in the last week
Smokes <30 minutes after waking
Smokes ≥ median number of cigarettes/day
Intends to give up smoking in next four weeks
Confident could give up smoking for good
Would like to stop smoking
Thinking about or trying to stop smoking
Thinks health will improve if stops smoking
People who are important to participant want them to stop smoking
Tried to cut down in the last 2 months/3 months*
Tried to stop in the last 2 months/3 months*
0.79 (0.31, 2.00)
1.06 (0.47, 2.41)
0.95 (0.37, 2.45)
1.04 (0.42, 2.54)
1.40 (0.61, 3.21)
1.66 (0.64, 4.29)
0.92 (0.42, 1.98)
0.77 (0.37, 1.63)
1.11 (0.45, 2.74)
2.62 (0.81, 8.49)
0.72 (0.35, 1.49)
1.31 (0.51, 3.34)
0.25
0.67
0.41
0.44
0.90
0.25
0.21
0.12
0.59
0.28
0.06
0.58
*Reporting time period was since last questionnaire, i.e. 2 months reporting period at 3 months follow-up and 3 months reporting period at 6 months follow-up.


![Lung Cancer in the United States - OSU Center for ... - Lung Cancer Screening... · Philadelphia Pulmonary Neoplasm Research Project ... definition of “nodule” and [b] ... •](https://img.pdfslide.net/doc/110x75/5ac48c3c7f8b9a12608d06dc/lung-cancer-in-the-united-states-osu-center-for-lung-cancer-screeningphiladelphia.jpg)