Embed Size (px)
Citation preview
IJSRSET1732182 | 09 April 2017 | Accepted : 19 April 2017 | March-April-2017 [(2)2: 642-647]
© 2017 IJSRSET | Volume 3 | Issue 2 | Print ISSN: 2395-1990 | Online ISSN : 2394-4099 Themed Section: Engineering and Technology
642
Lung Nodule Detection
Rasika N. Kachore, Kivita Singh
CSE Department, Yeshwantrao Chavan College of Engineering, Nagpur, Maharashtra, India
ABSTRACT
Various image processing and computer vision techniques can be used to determine cancer cells from medical
images. Medical image classification plays an important role in medical research field. The patient lung images are
classified into either benign (non-cancer) or malignant (cancer). There are many effective algorithms to analyze
different salient detection methods. Here salient region is lung nodule, we have to detect nodule by using fast pixel-
wise image saliency aggregation (F-PISA). This paper analyzes summarize some of the information about F-PISA
framework for the purpose of early detection and diagnosis of lung cancer. This present work proposes a method to
detect the cancerous nodule effectively from the CT scan images by reducing the detection error.
Keywords : Visual Saliency, Pixel-Wise Image Saliency, Object Detection, Feature Engineering, Image Filtering.
I. INTRODUCTION
A lung nodule is small masses of tissue in the lung.
Lung cancer is usually visible as small round lesion
called „nodules‟ through Medical images like CT. The
major problem in identifying the nodules with CT image
is that the characteristics of nodules in terms of size,
shape and density. Lung nodules are usually about 0.2
inch (5 millimeters) to 1.2 inches (30 millimeters) in
size. Human eye is sensitive to certain colors and
intensities and objects with such features are considered
more salient. Detection of salient image regions is
useful for applications like region-based image retrieval,
image segmentation etc. It is important to enhance and
detect the nodules in CT images in order to identify the
lung cancer at early stage. Different methods and
algorithms are developed to effectively detect the
nodules.
Image segmentation is an important task of image
processing. Its main purpose is to detect and diagnose
death threatening diseases. The goal of segmentation is
to simplify and/or change the image into some patches
that is more meaningful and easier to understand. Every
pixel in an image is associated with a label and pixels
with same label shows similar behavior. The various
techniques used are histogram based technique, edge
based technique, region based technique, and hybrid
technique. The hybrid technique that combines the
features of both edge based and region based methods.
The problem definition of the system is to Detect
finding object of interest in image. Additionally
improve detection of background as salient in certain
images where the background is complex or object is
too large. Natural images usually contain rich
appearances of salient region but, in case of medical
images it is not possible to detect exact location of
salient region. By using some shape adaptive volume
filter on medical images to detect salient region.
The remaining paper is organized as follows: Section 2
introduces literature survey, Section 3 introduces
background knowledge. Salient object detection
characteristics and limitation is presented in Section 4.
The paper summary and conclusion in Section 5
II. METHODS AND MATERIAL
1. Literature Survey
The F-PISA framework helps to enhance the CT images.
The various techniques used are histogram based
technique, hybrid technique; the hybrid technique that
combines the features of both edge based and region
based methods, edge based technique, region based
International Journal of Scientific Research in Science, Engineering and Technology (ijsrset.com) 643
technique, etc. Some of the methods are described in the
below section.
The authors, T. Zhao, et al., proposed a saliency
detection method with spaces of the background
distribution (SBD) [14] proposed saliency detection
methods considering viz; first, patches from the image
borders are used to generate a group of space of the
background distribution to compute the saliency map
second, bayesian methods to enhance saliency map and
the last, get a saliency map using novel up-sampling
methods based on geodesic distance.
Later the authors, M. Liu, et al., proposed a novel visual
saliency detection model by studying the complex input
image [19] also, proposed a general framework
combines image complexity locally and globally for
visual saliency. Proposed CWS saliency detection
model to define more effectiveness result. CWS have a
complex mixture of a color with verified intensity.
In 2016 the authors, S. Foolad, A. Maleki introduced the
methods can highlight the region effectively.
Highlighted regions are known as a salient region [17].
Authors proposed a bottom-up model to detect salient
region, later the authors shows an adaptive
segmentation technique which shows less error, L. Ma,
et al., introduced an efficient and accurate approach
known as superficial-to-pixel saliency detection for
region-of-interest (ROI) [18]. The input image is down-
sample and the image is segmented into super-pixel to
reduce the complexity of input image. Later B. Yang, et
al., presented patch-wise saliency detection algorithm
based on principal component analysis (PCA) [22].
PCA generally uses to convert the color space into
patch-wise representation. Compact patch
representation is based on global rarity and center
surrounded contrast.
V. A. Gajdhane, et al., introduced the image
improvement technique is developing for earlier disease
detection and treatment stages; the time factor is taken
in account to discover the abnormality issues in target
images. The CT captured images are processed. The
region of interest i.e., tumor is identified accurately
from the original image. Gabor filter and watershed
segmentation gives best results for pre-processing stage
[24]. From the extracted region of interest, three
features are extracted i.e., area, perimeter and
eccentricity. These three features help to identify the
stage of lung cancer.
Bhavanishankar .K and Dr. M.V.Sudhamani introduced
various approaches towards an automated detection of
lung nodules, classifications are summarized. It is
apparent from the review that the algorithms with
multiple detection approaches provided the better results
[26].
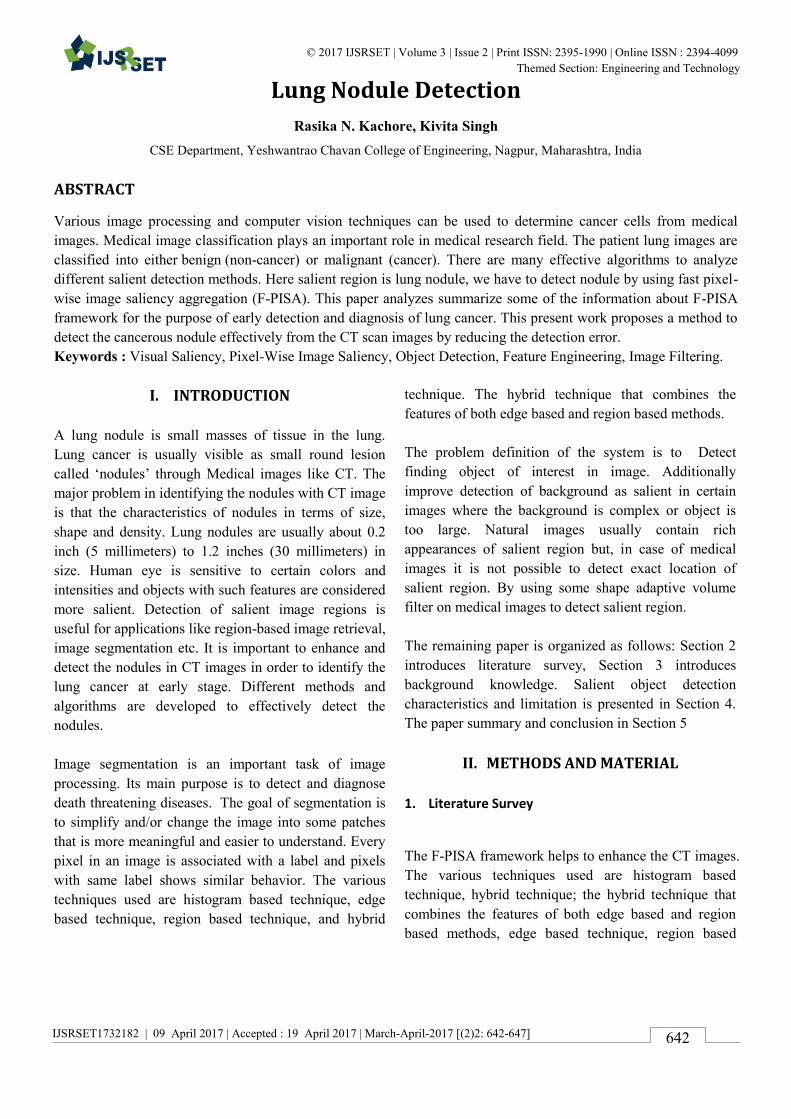
A detailed architecture of the proposed system is shown
in Figure1.
Figure 1. Architecture of lung nodule detection system
2. Methodology
[1] Preprocessing
Preprocessing is the method of resizing the image into a
number of small patches. The aim of preprocessing is an
improvement of the image data that suppresses
unwanted distortion or enhances some image feature
important for further processing. Median filter and
Gaussian filter these techniques are used for noise
elimination and lung area identification. These two
techniques are worked out simultaneously.
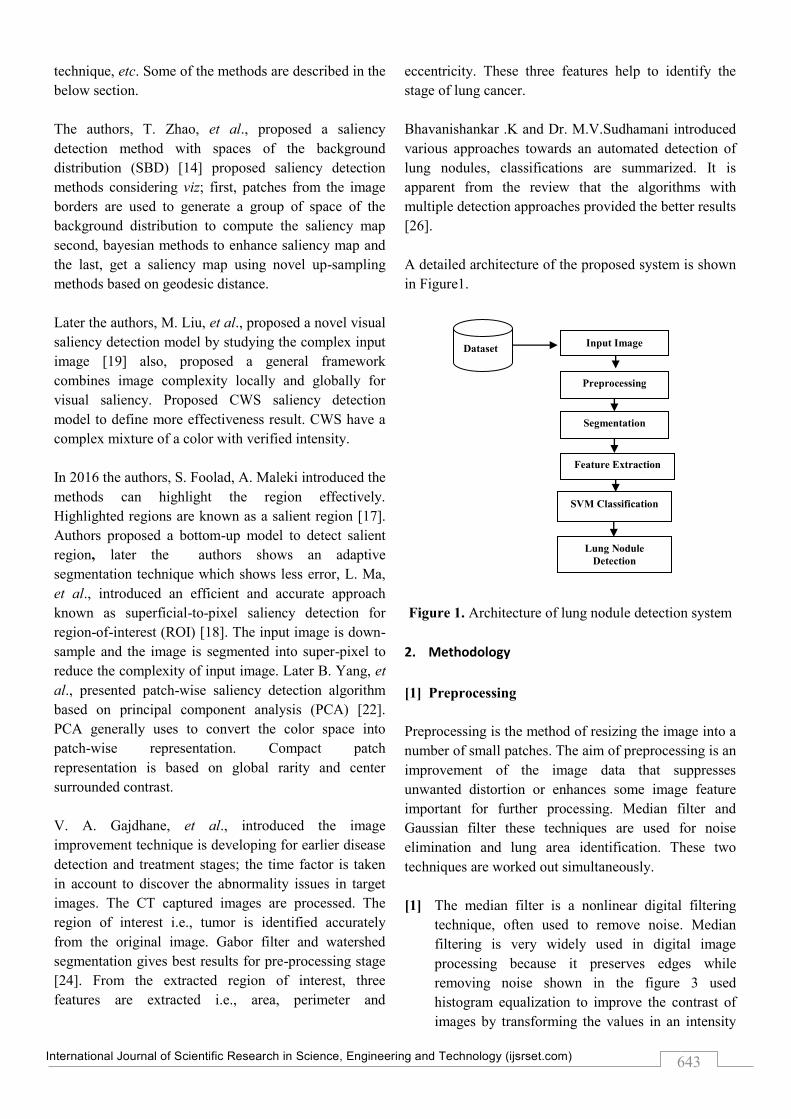
[1] The median filter is a nonlinear digital filtering
technique, often used to remove noise. Median
filtering is very widely used in digital image
processing because it preserves edges while
removing noise shown in the figure 3 used
histogram equalization to improve the contrast of
images by transforming the values in an intensity
Dataset
Input Image
Preprocessing
Segmentation
Feature Extraction
eeexextraction
SVM Classification
Lung Nodule
Detection
International Journal of Scientific Research in Science, Engineering and Technology (ijsrset.com) 644
of an image. So that easily compares median filter
and Gaussian filter histogram of the output image.
[2] Gaussian filtering G is used to blur images and
remove noise and detail. In one dimension, the
Gaussian function is: Where σ is the standard
deviation of the distribution. The distribution is
G(x) =
Where σ is the standard deviation of the distribution.
The distribution is assumed to have a mean of 0.
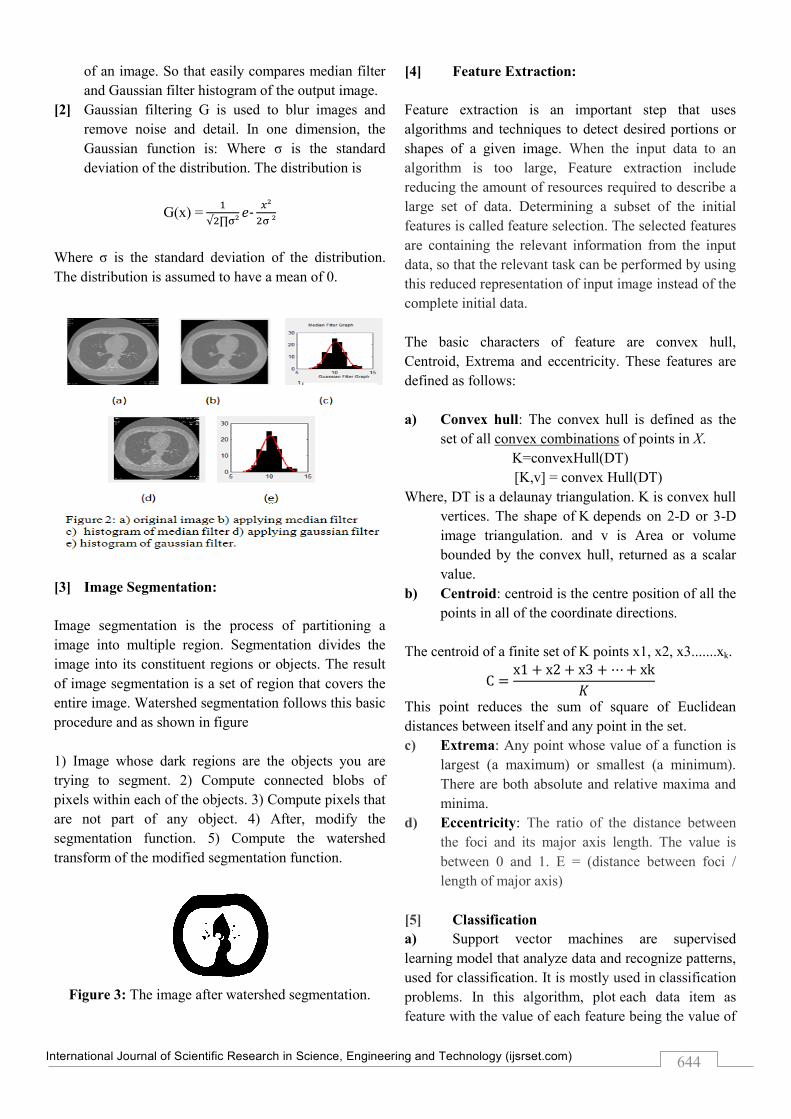
[3] Image Segmentation:
Image segmentation is the process of partitioning a
image into multiple region. Segmentation divides the
image into its constituent regions or objects. The result
of image segmentation is a set of region that covers the
entire image. Watershed segmentation follows this basic
procedure and as shown in figure
1) Image whose dark regions are the objects you are
trying to segment. 2) Compute connected blobs of
pixels within each of the objects. 3) Compute pixels that
are not part of any object. 4) After, modify the
segmentation function. 5) Compute the watershed
transform of the modified segmentation function.
Figure 3: The image after watershed segmentation.
[4] Feature Extraction:
Feature extraction is an important step that uses
algorithms and techniques to detect desired portions or
shapes of a given image. When the input data to an
algorithm is too large, Feature extraction include
reducing the amount of resources required to describe a
large set of data. Determining a subset of the initial
features is called feature selection. The selected features
are containing the relevant information from the input
data, so that the relevant task can be performed by using
this reduced representation of input image instead of the
complete initial data.
The basic characters of feature are convex hull,
Centroid, Extrema and eccentricity. These features are
defined as follows:
a) Convex hull: The convex hull is defined as the
set of all convex combinations of points in X.
K=convexHull(DT)
[K,v] = convex Hull(DT)
Where, DT is a delaunay triangulation. K is convex hull
vertices. The shape of K depends on 2-D or 3-D
image triangulation. and v is Area or volume
bounded by the convex hull, returned as a scalar
value.
b) Centroid: centroid is the centre position of all the
points in all of the coordinate directions.
The centroid of a finite set of K points x1, x2, x3.......xk.
This point reduces the sum of square of Euclidean
distances between itself and any point in the set.
c) Extrema: Any point whose value of a function is
largest (a maximum) or smallest (a minimum).
There are both absolute and relative maxima and
minima.
d) Eccentricity: The ratio of the distance between
the foci and its major axis length. The value is
between 0 and 1. E = (distance between foci /
length of major axis)
[5] Classification
a) Support vector machines are supervised
learning model that analyze data and recognize patterns,
used for classification. It is mostly used in classification
problems. In this algorithm, plot each data item as
feature with the value of each feature being the value of
International Journal of Scientific Research in Science, Engineering and Technology (ijsrset.com) 645
a particular coordinate. Then, perform classification by
finding the hyper-plane that differentiates the two
classes very well.
b)
c) In K-NN classification, an object is classified
into positive and negative class i.e, cancerous and non-
cancerous. It works better than SVM, it indicates that
dataset is not easily separable using the decision planes
that have SVM use, i.e. the basic SVM uses linear hyper
planes to separate classes. KNN can provide good
results, it suggests that classes are quite separable
shown in table 1.
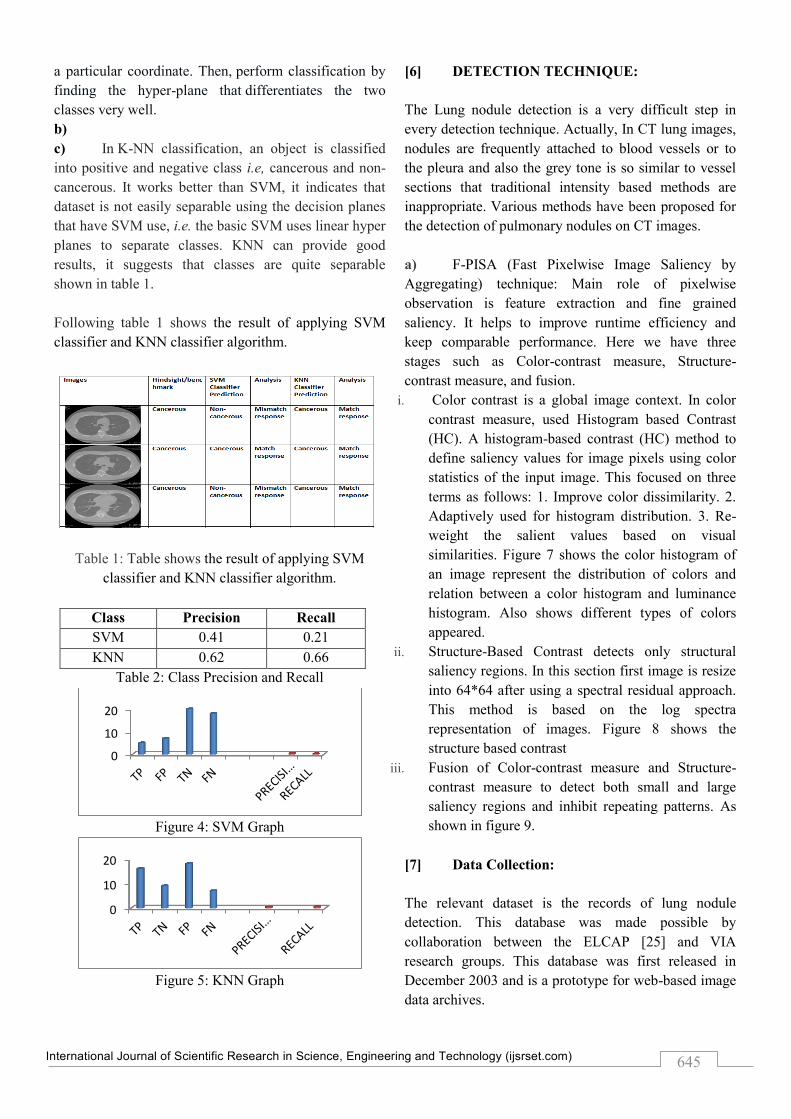
Following table 1 shows the result of applying SVM
classifier and KNN classifier algorithm.
Table 1: Table shows the result of applying SVM
classifier and KNN classifier algorithm.
Class Precision Recall
SVM 0.41 0.21
KNN 0.62 0.66
Table 2: Class Precision and Recall
Figure 4: SVM Graph
Figure 5: KNN Graph
[6] DETECTION TECHNIQUE:
The Lung nodule detection is a very difficult step in
every detection technique. Actually, In CT lung images,
nodules are frequently attached to blood vessels or to
the pleura and also the grey tone is so similar to vessel
sections that traditional intensity based methods are
inappropriate. Various methods have been proposed for
the detection of pulmonary nodules on CT images.
a) F-PISA (Fast Pixelwise Image Saliency by
Aggregating) technique: Main role of pixelwise
observation is feature extraction and fine grained
saliency. It helps to improve runtime efficiency and
keep comparable performance. Here we have three
stages such as Color-contrast measure, Structure-
contrast measure, and fusion.
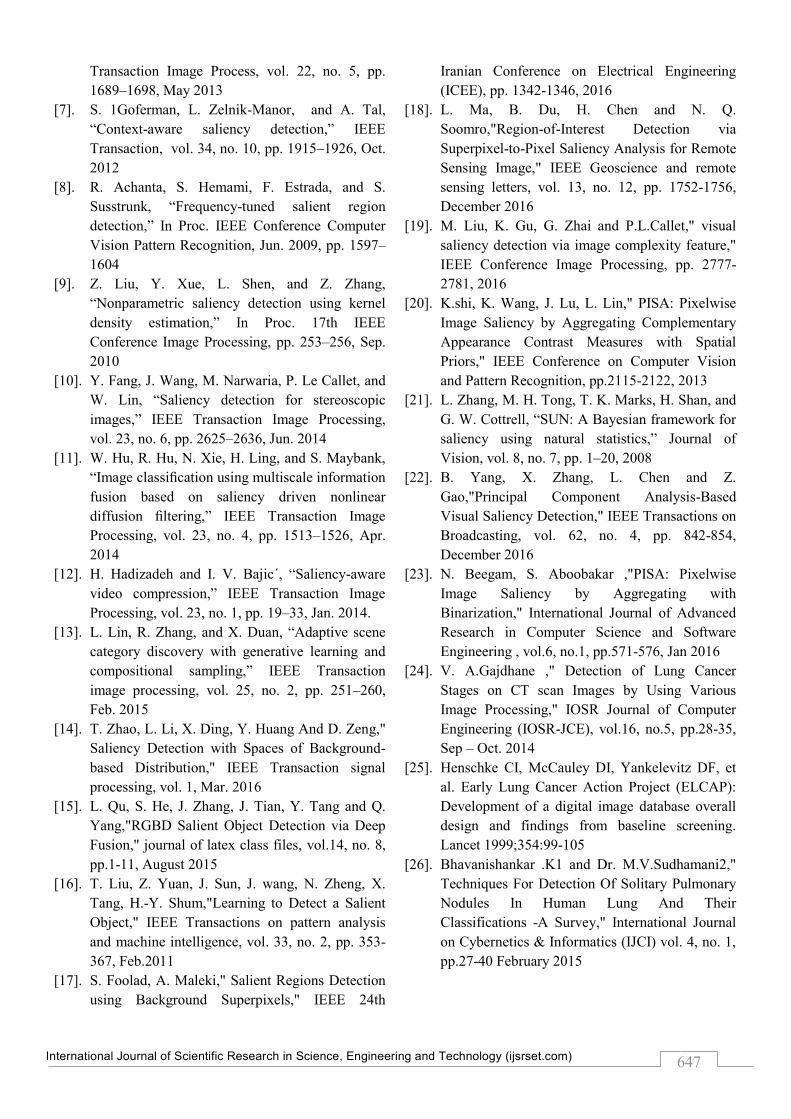
i. Color contrast is a global image context. In color
contrast measure, used Histogram based Contrast
(HC). A histogram-based contrast (HC) method to
define saliency values for image pixels using color
statistics of the input image. This focused on three
terms as follows: 1. Improve color dissimilarity. 2.
Adaptively used for histogram distribution. 3. Re-
weight the salient values based on visual
similarities. Figure 7 shows the color histogram of
an image represent the distribution of colors and
relation between a color histogram and luminance
histogram. Also shows different types of colors
appeared.
ii. Structure-Based Contrast detects only structural
saliency regions. In this section first image is resize
into 64*64 after using a spectral residual approach.
This method is based on the log spectra
representation of images. Figure 8 shows the
structure based contrast
iii. Fusion of Color-contrast measure and Structure-
contrast measure to detect both small and large
saliency regions and inhibit repeating patterns. As
shown in figure 9.
[7] Data Collection:
The relevant dataset is the records of lung nodule
detection. This database was made possible by
collaboration between the ELCAP [25] and VIA
research groups. This database was first released in
December 2003 and is a prototype for web-based image
data archives.
0
10
20
0
10
20
International Journal of Scientific Research in Science, Engineering and Technology (ijsrset.com) 646
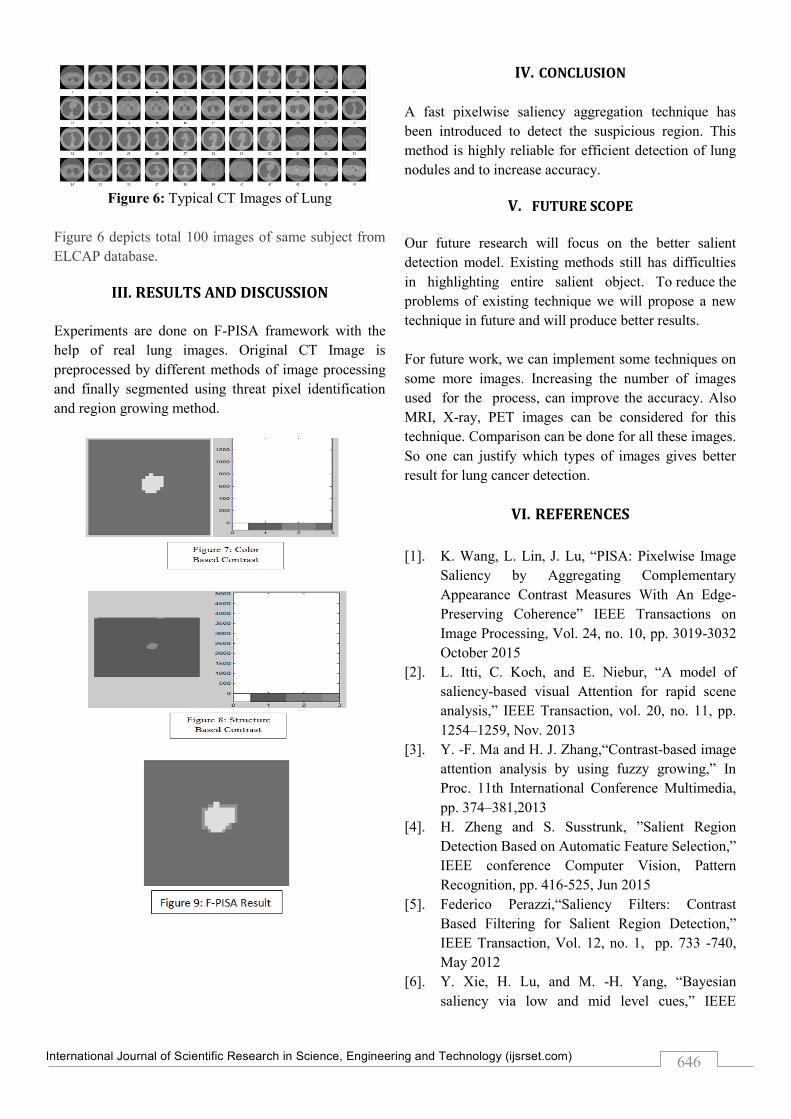
Figure 6: Typical CT Images of Lung
Figure 6 depicts total 100 images of same subject from
ELCAP database.
III. RESULTS AND DISCUSSION
Experiments are done on F-PISA framework with the
help of real lung images. Original CT Image is
preprocessed by different methods of image processing
and finally segmented using threat pixel identification
and region growing method.
IV. CONCLUSION
A fast pixelwise saliency aggregation technique has
been introduced to detect the suspicious region. This
method is highly reliable for efficient detection of lung
nodules and to increase accuracy.
V. FUTURE SCOPE
Our future research will focus on the better salient
detection model. Existing methods still has difficulties
in highlighting entire salient object. To reduce the
problems of existing technique we will propose a new
technique in future and will produce better results.
For future work, we can implement some techniques on
some more images. Increasing the number of images
used for the process, can improve the accuracy. Also
MRI, X-ray, PET images can be considered for this
technique. Comparison can be done for all these images.
So one can justify which types of images gives better
result for lung cancer detection.
VI. REFERENCES
[1]. K. Wang, L. Lin, J. Lu, “PISA: Pixelwise Image
Saliency by Aggregating Complementary
Appearance Contrast Measures With An Edge-
Preserving Coherence” IEEE Transactions on
Image Processing, Vol. 24, no. 10, pp. 3019-3032
October 2015
[2]. L. Itti, C. Koch, and E. Niebur, “A model of
saliency-based visual Attention for rapid scene
analysis,” IEEE Transaction, vol. 20, no. 11, pp.
1254–1259, Nov. 2013
[3]. Y. -F. Ma and H. J. Zhang,“Contrast-based image
attention analysis by using fuzzy growing,” In
Proc. 11th International Conference Multimedia,
pp. 374–381,2013
[4]. H. Zheng and S. Susstrunk, ”Salient Region
Detection Based on Automatic Feature Selection,”
IEEE conference Computer Vision, Pattern
Recognition, pp. 416-525, Jun 2015
[5]. Federico Perazzi,“Saliency Filters: Contrast
Based Filtering for Salient Region Detection,”
IEEE Transaction, Vol. 12, no. 1, pp. 733 -740,
May 2012
[6]. Y. Xie, H. Lu, and M. -H. Yang, “Bayesian
saliency via low and mid level cues,” IEEE
International Journal of Scientific Research in Science, Engineering and Technology (ijsrset.com) 647
Transaction Image Process, vol. 22, no. 5, pp.
1689–1698, May 2013
[7]. S. 1Goferman, L. Zelnik-Manor, and A. Tal,
“Context-aware saliency detection,” IEEE
Transaction, vol. 34, no. 10, pp. 1915–1926, Oct.
2012
[8]. R. Achanta, S. Hemami, F. Estrada, and S.
Susstrunk, “Frequency-tuned salient region
detection,” In Proc. IEEE Conference Computer
Vision Pattern Recognition, Jun. 2009, pp. 1597–
1604
[9]. Z. Liu, Y. Xue, L. Shen, and Z. Zhang,
“Nonparametric saliency detection using kernel
density estimation,” In Proc. 17th IEEE
Conference Image Processing, pp. 253–256, Sep.
2010
[10]. Y. Fang, J. Wang, M. Narwaria, P. Le Callet, and
W. Lin, “Saliency detection for stereoscopic
images,” IEEE Transaction Image Processing,
vol. 23, no. 6, pp. 2625–2636, Jun. 2014
[11]. W. Hu, R. Hu, N. Xie, H. Ling, and S. Maybank,
“Image classification using multiscale information
fusion based on saliency driven nonlinear
diffusion filtering,” IEEE Transaction Image
Processing, vol. 23, no. 4, pp. 1513–1526, Apr.
2014
[12]. H. Hadizadeh and I. V. Bajic´, “Saliency-aware
video compression,” IEEE Transaction Image
Processing, vol. 23, no. 1, pp. 19–33, Jan. 2014.
[13]. L. Lin, R. Zhang, and X. Duan, “Adaptive scene
category discovery with generative learning and
compositional sampling,” IEEE Transaction
image processing, vol. 25, no. 2, pp. 251–260,
Feb. 2015
[14]. T. Zhao, L. Li, X. Ding, Y. Huang And D. Zeng,"
Saliency Detection with Spaces of Background-
based Distribution," IEEE Transaction signal
processing, vol. 1, Mar. 2016
[15]. L. Qu, S. He, J. Zhang, J. Tian, Y. Tang and Q.
Yang,"RGBD Salient Object Detection via Deep
Fusion," journal of latex class files, vol.14, no. 8,
pp.1-11, August 2015
[16]. T. Liu, Z. Yuan, J. Sun, J. wang, N. Zheng, X.
Tang, H.-Y. Shum,"Learning to Detect a Salient
Object," IEEE Transactions on pattern analysis
and machine intelligence, vol. 33, no. 2, pp. 353-
367, Feb.2011
[17]. S. Foolad, A. Maleki," Salient Regions Detection
using Background Superpixels," IEEE 24th
Iranian Conference on Electrical Engineering
(ICEE), pp. 1342-1346, 2016
[18]. L. Ma, B. Du, H. Chen and N. Q.
Soomro,"Region-of-Interest Detection via
Superpixel-to-Pixel Saliency Analysis for Remote
Sensing Image," IEEE Geoscience and remote
sensing letters, vol. 13, no. 12, pp. 1752-1756,
December 2016
[19]. M. Liu, K. Gu, G. Zhai and P.L.Callet," visual
saliency detection via image complexity feature,"
IEEE Conference Image Processing, pp. 2777-
2781, 2016
[20]. K.shi, K. Wang, J. Lu, L. Lin," PISA: Pixelwise
Image Saliency by Aggregating Complementary
Appearance Contrast Measures with Spatial
Priors," IEEE Conference on Computer Vision
and Pattern Recognition, pp.2115-2122, 2013
[21]. L. Zhang, M. H. Tong, T. K. Marks, H. Shan, and
G. W. Cottrell, “SUN: A Bayesian framework for
saliency using natural statistics,” Journal of
Vision, vol. 8, no. 7, pp. 1–20, 2008
[22]. B. Yang, X. Zhang, L. Chen and Z.
Gao,"Principal Component Analysis-Based
Visual Saliency Detection," IEEE Transactions on
Broadcasting, vol. 62, no. 4, pp. 842-854,
December 2016
[23]. N. Beegam, S. Aboobakar ,"PISA: Pixelwise
Image Saliency by Aggregating with
Binarization," International Journal of Advanced
Research in Computer Science and Software
Engineering , vol.6, no.1, pp.571-576, Jan 2016
[24]. V. A.Gajdhane ," Detection of Lung Cancer
Stages on CT scan Images by Using Various
Image Processing," IOSR Journal of Computer
Engineering (IOSR-JCE), vol.16, no.5, pp.28-35,
Sep – Oct. 2014
[25]. Henschke CI, McCauley DI, Yankelevitz DF, et
al. Early Lung Cancer Action Project (ELCAP):
Development of a digital image database overall
design and findings from baseline screening.
Lancet 1999;354:99-105
[26]. Bhavanishankar .K1 and Dr. M.V.Sudhamani2,"
Techniques For Detection Of Solitary Pulmonary
Nodules In Human Lung And Their
Classifications -A Survey," International Journal
on Cybernetics & Informatics (IJCI) vol. 4, no. 1,
pp.27-40 February 2015