Embed Size (px)
Citation preview
Lyon County
Behavioral Health
Summary Prepared by the Division of
Public and Behavioral Health
1
Contents
Selected Demographics for Lyon County .......................................................................................................................................... 3
Top 5 Mental and Behavioral Clinics Service Locations for Lyon County Residents, 2010-2014 ...................................................... 5
Most Common Diagnosis among Lyon County Residents, 2010-2014 .............................................................................................. 6
Percentages of Lyon County Residents at Mental and Behavioral Clinics by Patient City of Residence, 2010-2014 ........................ 7
Demographics of Lyon County Residents at Mental and Behavioral Clinics, 2010-2014 .................................................................. 8
Trend of Lyon County Resident Admissions to ED for Mental Health and Substance Related Disorders – Selected Mental Health
Disorders, 2009-2013 ........................................................................................................................................................................ 9
Demographics of Lyon County Residents Admissions to ED for Mental Health and Substance Related Disorders – Selected
Mental Health Disorders, 2009-2013 .............................................................................................................................................. 10
Trend of Lyon County Resident Admissions to ED for Mental Health and Substance Related Disorders – Alcohol and Substance
Abuse Related, 2009-2013 .............................................................................................................................................................. 11
Demographics of Lyon County Resident Admissions to ED for Mental Health and Substance-Related Disorders – Alcohol and
Substance Abuse Related, 2009-2013 ............................................................................................................................................ 12
Percentages of Lyon County Resident Admissions to ED for Mental Health and Substance-Related Disorders by Hospital, 2009-
2013 (n =16,839) ............................................................................................................................................................................. 13
Percentages of Lyon County Resident Admissions to ED for Mental Health and Substance-Related Disorders by Payment Type,
2009-2013 (n =16,839).................................................................................................................................................................... 14
Percentages of Lyon County Resident Inpatient Discharges for Mental Health and Substance Related Disorders – Selected
Mental Health Disorders, 2009-2013 .............................................................................................................................................. 15
Demographics of Lyon County Resident Inpatient Discharges for Mental Health and Substance Related Disorders – Selected
Mental Health Disorders, 2009-2013 .............................................................................................................................................. 16
Demographics of Lyon County Residents Inpatient Discharges for Mental Health and Substance Related Disorders – Alcohol and
Substance Abuse Related, 2009-2013 ............................................................................................................................................ 17
Demographics of Lyon County Residents Inpatient Discharges for Mental Health and Substance Related Disorders – Suicidal
Ideation and Methods, 2009-2013 ................................................................................................................................................. 18
Percentages of Lyon County Resident Inpatient Discharges for Mental Health and Substance-Related Disorders by Hospitals,
2009-2013 (n = 17,372) ................................................................................................................................................................... 19
Percentages of Lyon County Resident Inpatient Discharges for Mental Health and Substance-Related Disorders by Payment
Type, 2009-2013 (n = 17,372) ......................................................................................................................................................... 20
Average length-of-stay of Lyon County Resident Inpatient Discharges for Mental Health and Substance-Related Disorders, 2009-
2013 ................................................................................................................................................................................................ 20
Percentages of Lyon County Residents in Nevada Substance Abuse Treatment Facilities ............................................................. 21
Top 5 Substances, 2014 .................................................................................................................................................................. 21
Trends of Lyon County Residents in Nevada Substance Abuse Treatment Facilities by Select Substances, 2010-2014 ................. 22
Demographics of Lyon County Residents in Nevada Substance Abuse Treatment Facilities for Alcohol Abuse, 2010-2014 ......... 23
Demographics of Lyon County Residents in Nevada Substance Abuse Treatment Facilities for Meth/Amphetamines, 2010-2014
........................................................................................................................................................................................................ 24
Demographics of Lyon County Residents in Nevada Substance Abuse Treatment Facilities for Marijuana, 2010-2014 ................ 25
2
Prenatal Substance Abuse Birth Rate (Self-Reported), Lyon County, 2010-2014 ........................................................................... 26
Immediate Cause of Death by Suicide, Lyon County, 2010-2014 ................................................................................................... 27
Trend of Mental and Behavioral Disorders Deaths, Lyon County 2010-2014 ................................................................................. 27
Trend of Substance-Related Deaths, Lyon County 2010-2014........................................................................................................ 28
Demographics of Substance Related Deaths, Lyon County 2010-2014 .......................................................................................... 28
Percentages of Mental Health and Substance Related Chief Complaints at South Lyon Medical Center, Lyon County, 2014-May
2015 (n=32) ..................................................................................................................................................................................... 29
Biosense: Mental Health and Substance-Related Chief Complaints ay South Lyon Medical Center, Patient Demographics, Lyon
County, 2014-May 2015 ................................................................................................................................................................. 30
EMS: Abnormal Mental Health Status by Zip Code, Lyon County, 2013-May 2015 ........................................................................ 30
2011-2014 BRFSS: Percentage of adult Lyon County residents who used illegal substances or painkillers by gender in the last 30
days ................................................................................................................................................................................................. 31
2011-2014 BRFSS: Percentages of adult Lyon County residents who are considered “heavy drinkers” - more than one drink
(females) or two drinks (males) per day ......................................................................................................................................... 31
2012 BRFSS: Percentages of adult Lyon County residents who have felt depressed at least one day in the past 30 days and had a
mental/emotional health problem that interfered with daily activities at least once in the last 30 days ...................................... 32
2012 BRFSS: Percentages of adult Lyon County residents who agree that with treatment, people with a mental illness can live
normal lives .................................................................................................................................................................................... 32
2012 BRFSS: Percentages of adult Lyon County residents who have felt the following mental health concerns in the past 30 days
........................................................................................................................................................................................................ 33
Percentages of High School Students Mental Health Status (last 12 months), Lyon, Mineral, and Storey, 2013 ........................... 34
Percentages of High School Students Current Tobacco Use, Lyon, Mineral, and Storey, 2013 ...................................................... 34
Percentages of High School Students - Alcohol Behavior Summary, Lyon, Mineral, and Storey, 2013 .......................................... 35
Percentages of High School Students - Marijuana Behavior Summary, Lyon, Mineral, and Storey, 2013 ...................................... 35
Percentages of High School Students Nonprescription Substance Summary, Lyon, Mineral, and Storey, 2013 ............................ 35
Percentages of High School Students - Substance Abuse Summary, Lyon, Mineral, and Storey, 2013 .......................................... 36
Percentages of High School Students’ Lifetime Substance Abuse Summary, Lyon, Mineral, and Storey, 2013 ............................. 36
Number of Habitual Truants, Lyon County, 2009 -2014 ................................................................................................................. 37
High School Graduation Rates, Lyon County, 2011 – 2013 by Class Cohort ................................................................................... 37
3
Demographic Snapshot
Selected Demographics for Lyon County
Lyon Nevada
2014 Population 51,789 2,839,099
2010 Population 51,980 2,700,692
Percent Change (2014-2010) -0.4% 5.10%
Males 50.5% 50.4%
Females 49.5% 49.6%
Land Area (square miles) 2,001.19 109,781.18
Median Household Income (2009-2013) $46,137 $52,800
Percent persons below poverty level (2009-2013) 15.7% 15.8% Source: US Census Bureau
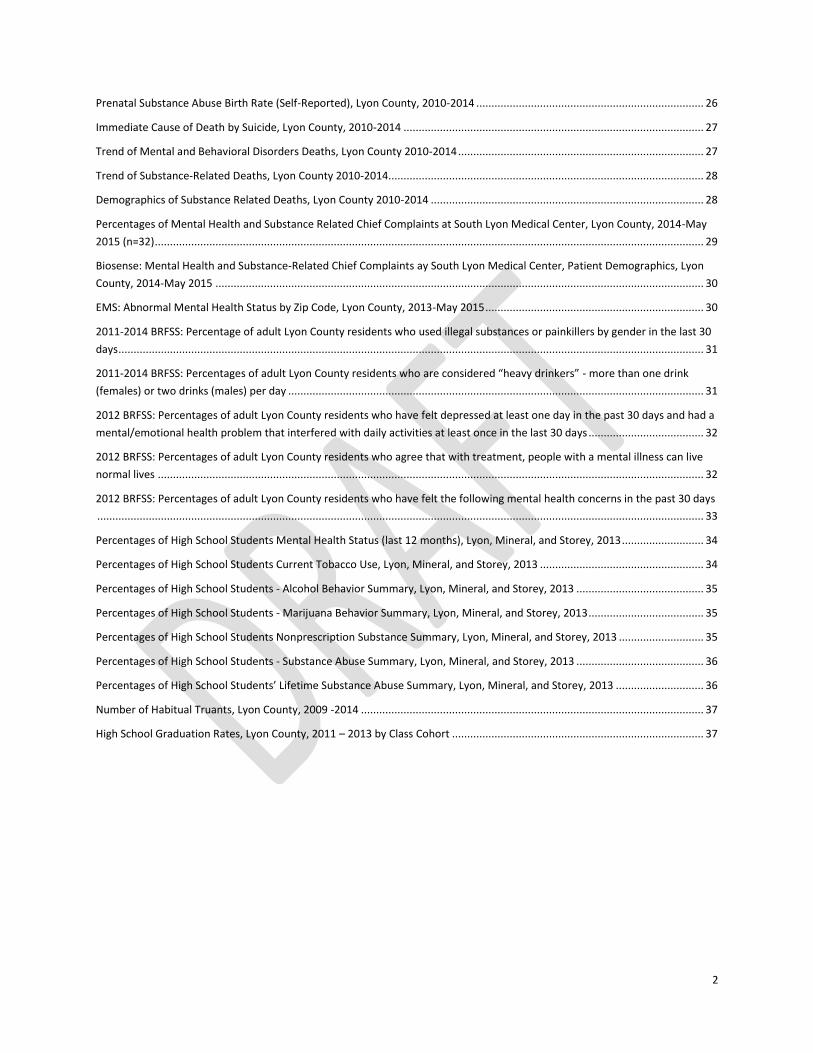
In 2014, the estimated population for Lyon County, Nevada was 51,789, a slight decrease from
the estimated 2010 population. Despite the -0.4% decline in population, Lyon County is the 2nd
most populous rural county in
Nevada following Elko County.
Prior to the national recession,
Lyon County was one of the
fastest growing counties by
percentage in the United States.
This is nearly even population
of females and males. Lyon
County land area is
approximately 2,001.19 square
miles and represents 1.8% of
Nevada’s land area. The median
household income was $46,137,
less than Nevada’s median
household income; however,
Lyon County and the state have
approximately equal percent of persons below poverty level.
4
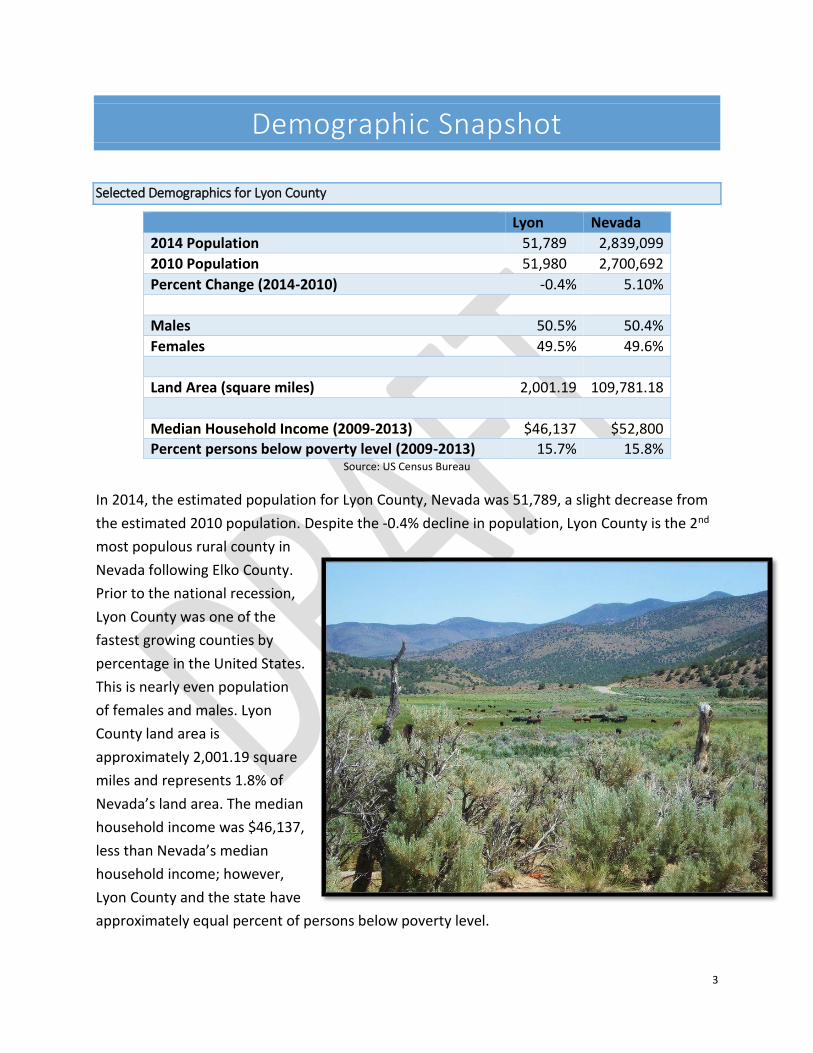
Source: Nevada Health Statistics Portal
Lyon County has a higher percentage of the total population aged 65+ years (18.9%) as
compared to Nevada at up 13.7%. The 15-24 and 55-64 age groups are also higher than the
state’s average. On the contrast, Nevada’s 25-34 year old population (13.2%) is notably larger
than Lyon’s County’s (7.9%).
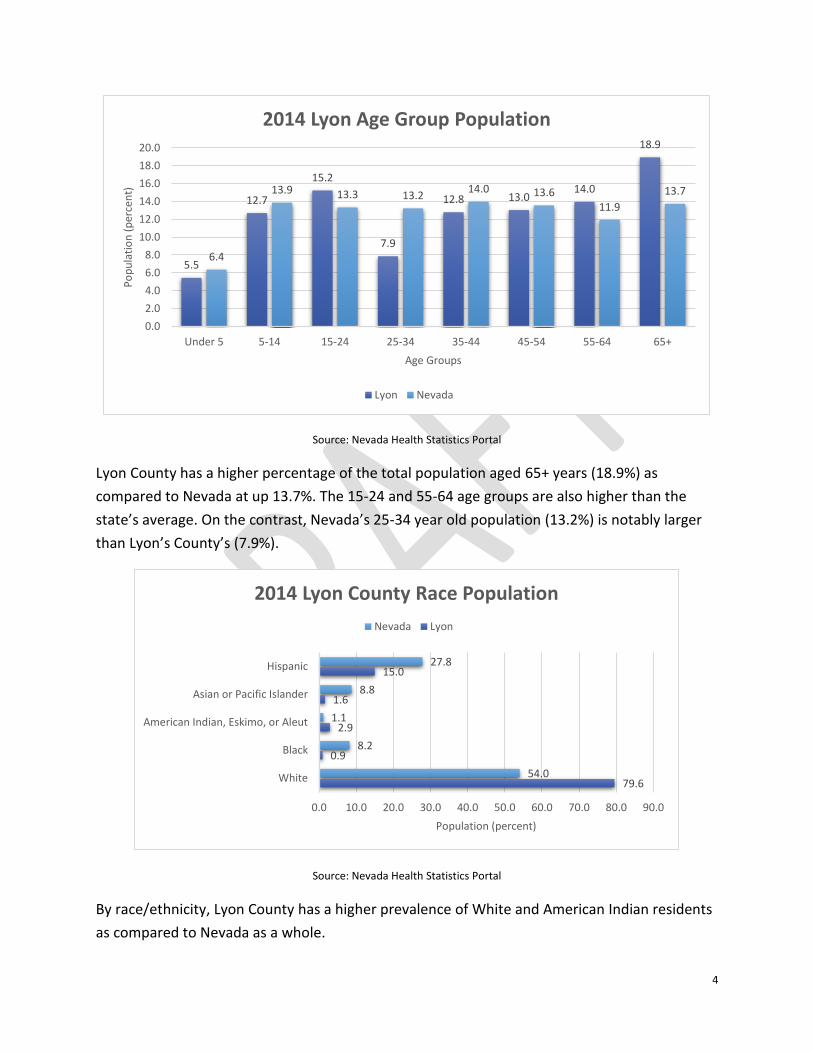
Source: Nevada Health Statistics Portal
By race/ethnicity, Lyon County has a higher prevalence of White and American Indian residents
as compared to Nevada as a whole.
5.5
12.7
15.2
7.9
12.8 13.014.0
18.9
6.4
13.9 13.3 13.214.0 13.6
11.9
13.7
0.0
2.0
4.0
6.0
8.0
10.0
12.0
14.0
16.0
18.0
20.0
Under 5 5-14 15-24 25-34 35-44 45-54 55-64 65+
Po
pu
lati
on
(p
erce
nt)
Age Groups
2014 Lyon Age Group Population
Lyon Nevada
79.6
0.9
2.9
1.6
15.0
54.0
8.2
1.1
8.8
27.8
0.0 10.0 20.0 30.0 40.0 50.0 60.0 70.0 80.0 90.0
White
Black
American Indian, Eskimo, or Aleut
Asian or Pacific Islander
Hispanic
Population (percent)
2014 Lyon County Race Population
Nevada Lyon
5
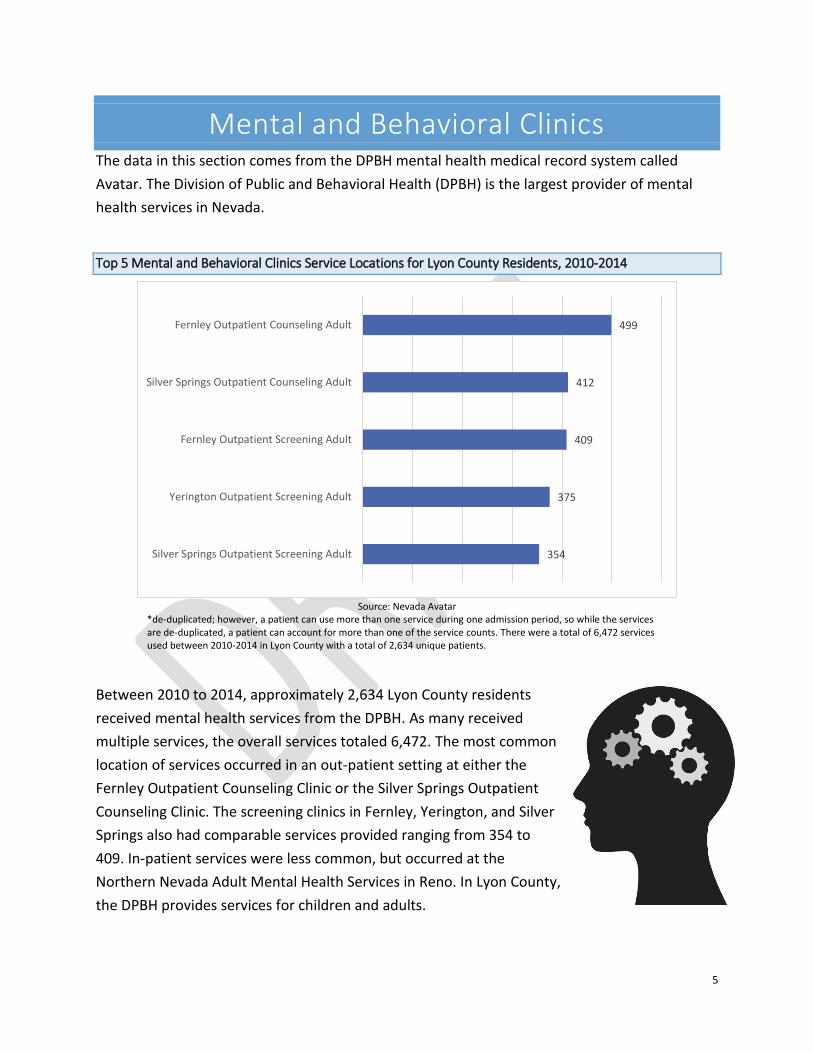
Mental and Behavioral Clinics The data in this section comes from the DPBH mental health medical record system called
Avatar. The Division of Public and Behavioral Health (DPBH) is the largest provider of mental
health services in Nevada.
Top 5 Mental and Behavioral Clinics Service Locations for Lyon County Residents, 2010-2014
Between 2010 to 2014, approximately 2,634 Lyon County residents
received mental health services from the DPBH. As many received
multiple services, the overall services totaled 6,472. The most common
location of services occurred in an out-patient setting at either the
Fernley Outpatient Counseling Clinic or the Silver Springs Outpatient
Counseling Clinic. The screening clinics in Fernley, Yerington, and Silver
Springs also had comparable services provided ranging from 354 to
409. In-patient services were less common, but occurred at the
Northern Nevada Adult Mental Health Services in Reno. In Lyon County,
the DPBH provides services for children and adults.
499
412
409
375
354
Fernley Outpatient Counseling Adult
Silver Springs Outpatient Counseling Adult
Fernley Outpatient Screening Adult
Yerington Outpatient Screening Adult
Silver Springs Outpatient Screening Adult
Source: Nevada Avatar *de-duplicated; however, a patient can use more than one service during one admission period, so while the services are de-duplicated, a patient can account for more than one of the service counts. There were a total of 6,472 services used between 2010-2014 in Lyon County with a total of 2,634 unique patients.
6
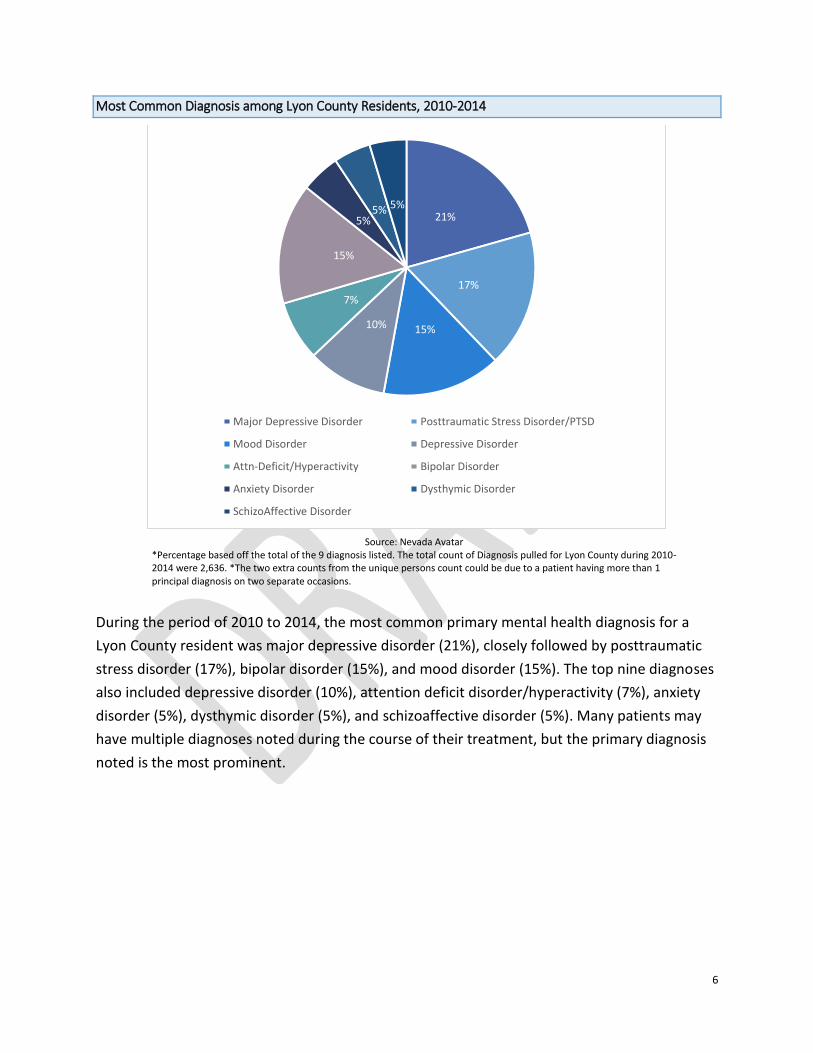
Most Common Diagnosis among Lyon County Residents, 2010-2014
During the period of 2010 to 2014, the most common primary mental health diagnosis for a
Lyon County resident was major depressive disorder (21%), closely followed by posttraumatic
stress disorder (17%), bipolar disorder (15%), and mood disorder (15%). The top nine diagnoses
also included depressive disorder (10%), attention deficit disorder/hyperactivity (7%), anxiety
disorder (5%), dysthymic disorder (5%), and schizoaffective disorder (5%). Many patients may
have multiple diagnoses noted during the course of their treatment, but the primary diagnosis
noted is the most prominent.
21%
17%
15%10%
7%
15%
5%5% 5%
Major Depressive Disorder Posttraumatic Stress Disorder/PTSD
Mood Disorder Depressive Disorder
Attn-Deficit/Hyperactivity Bipolar Disorder
Anxiety Disorder Dysthymic Disorder
SchizoAffective Disorder
Source: Nevada Avatar *Percentage based off the total of the 9 diagnosis listed. The total count of Diagnosis pulled for Lyon County during 2010-2014 were 2,636. *The two extra counts from the unique persons count could be due to a patient having more than 1 principal diagnosis on two separate occasions.
7
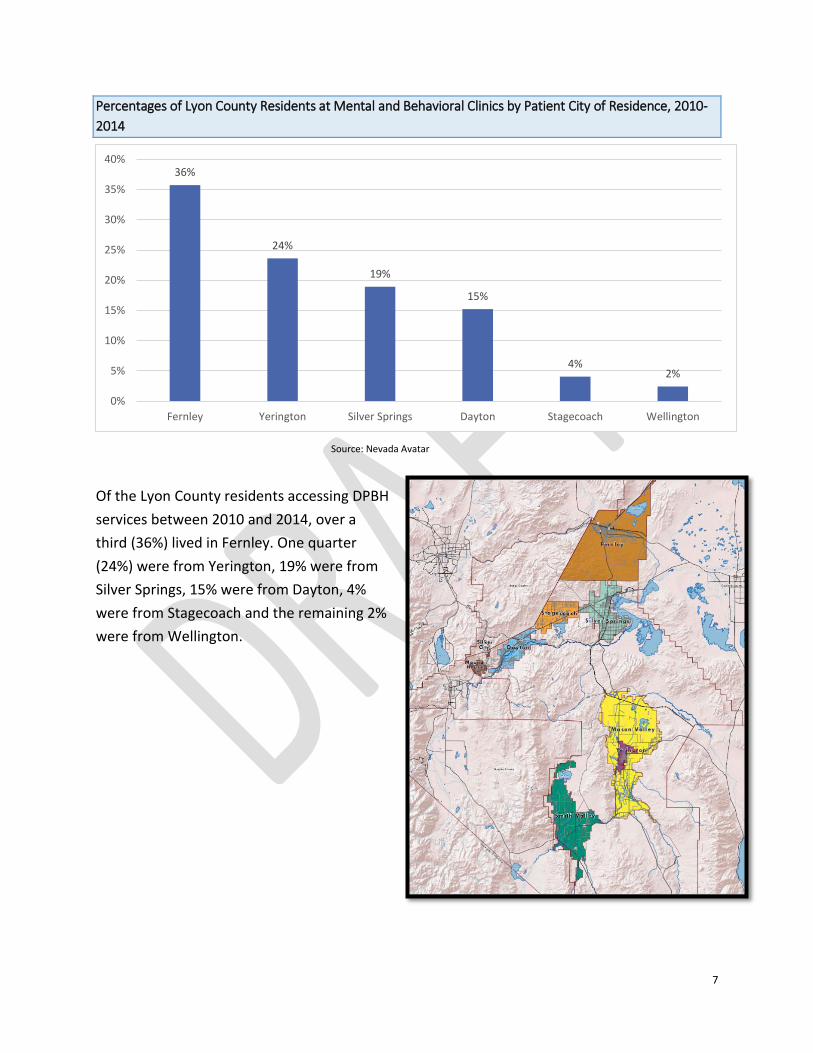
Percentages of Lyon County Residents at Mental and Behavioral Clinics by Patient City of Residence, 2010-
2014
Of the Lyon County residents accessing DPBH
services between 2010 and 2014, over a
third (36%) lived in Fernley. One quarter
(24%) were from Yerington, 19% were from
Silver Springs, 15% were from Dayton, 4%
were from Stagecoach and the remaining 2%
were from Wellington.
36%
24%
19%
15%
4%2%
0%
5%
10%
15%
20%
25%
30%
35%
40%
Fernley Yerington Silver Springs Dayton Stagecoach Wellington
Source: Nevada Avatar
8
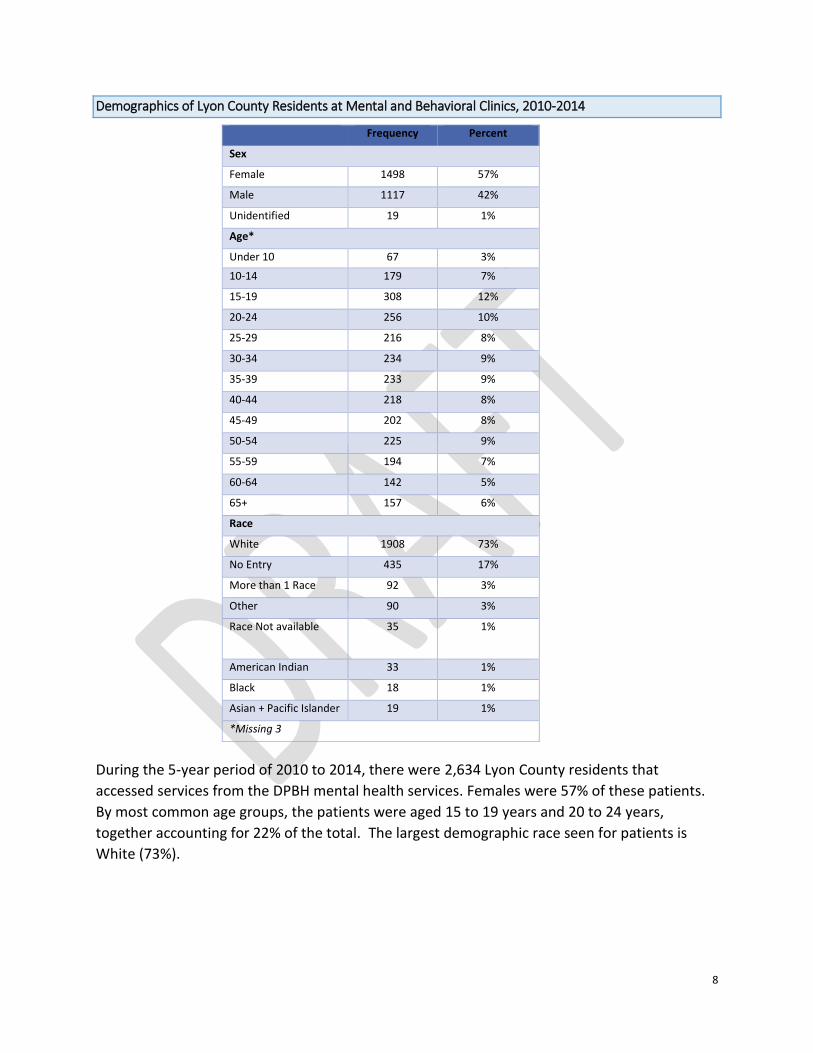
Demographics of Lyon County Residents at Mental and Behavioral Clinics, 2010-2014
Frequency Percent
Sex
Female 1498 57%
Male 1117 42%
Unidentified 19 1%
Age*
Under 10 67 3%
10-14 179 7%
15-19 308 12%
20-24 256 10%
25-29 216 8%
30-34 234 9%
35-39 233 9%
40-44 218 8%
45-49 202 8%
50-54 225 9%
55-59 194 7%
60-64 142 5%
65+ 157 6%
Race
White 1908 73%
No Entry 435 17%
More than 1 Race 92 3%
Other 90 3%
Race Not available 35 1%
American Indian 33 1%
Black 18 1%
Asian + Pacific Islander 19 1%
*Missing 3
During the 5-year period of 2010 to 2014, there were 2,634 Lyon County residents that
accessed services from the DPBH mental health services. Females were 57% of these patients.
By most common age groups, the patients were aged 15 to 19 years and 20 to 24 years,
together accounting for 22% of the total. The largest demographic race seen for patients is
White (73%).
9
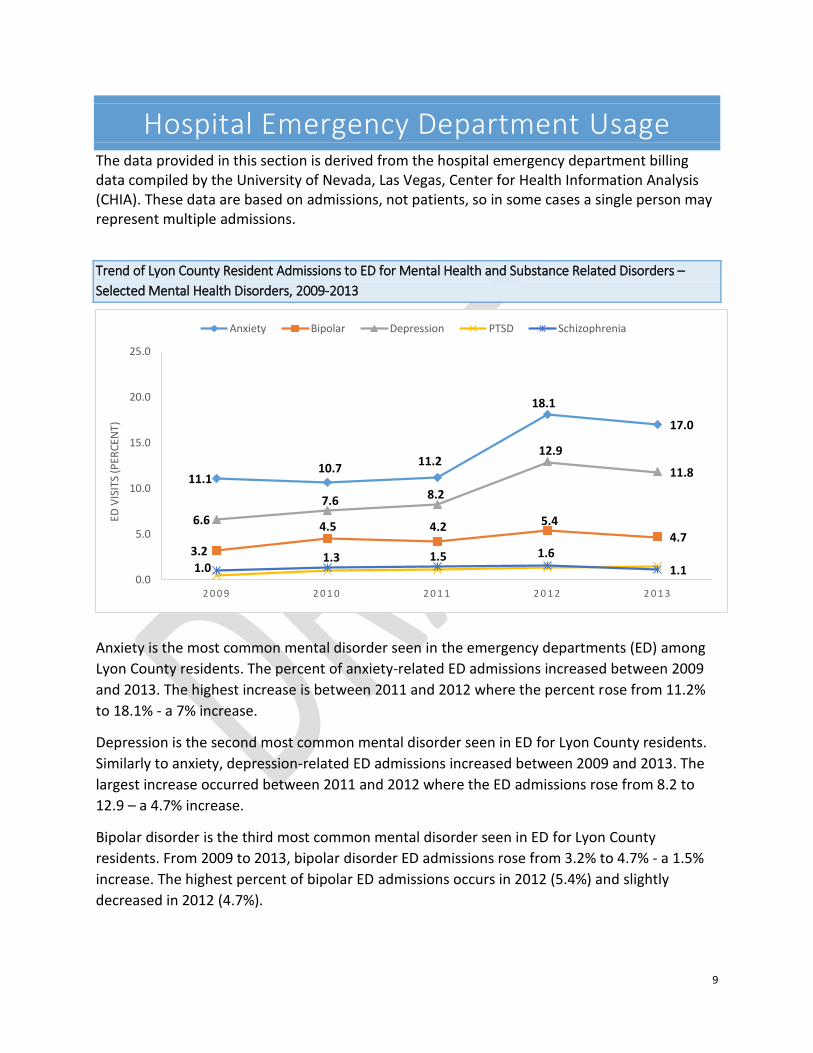
Hospital Emergency Department Usage The data provided in this section is derived from the hospital emergency department billing data compiled by the University of Nevada, Las Vegas, Center for Health Information Analysis (CHIA). These data are based on admissions, not patients, so in some cases a single person may represent multiple admissions.
Trend of Lyon County Resident Admissions to ED for Mental Health and Substance Related Disorders –
Selected Mental Health Disorders, 2009-2013
Anxiety is the most common mental disorder seen in the emergency departments (ED) among
Lyon County residents. The percent of anxiety-related ED admissions increased between 2009
and 2013. The highest increase is between 2011 and 2012 where the percent rose from 11.2%
to 18.1% - a 7% increase.
Depression is the second most common mental disorder seen in ED for Lyon County residents.
Similarly to anxiety, depression-related ED admissions increased between 2009 and 2013. The
largest increase occurred between 2011 and 2012 where the ED admissions rose from 8.2 to
12.9 – a 4.7% increase.
Bipolar disorder is the third most common mental disorder seen in ED for Lyon County
residents. From 2009 to 2013, bipolar disorder ED admissions rose from 3.2% to 4.7% - a 1.5%
increase. The highest percent of bipolar ED admissions occurs in 2012 (5.4%) and slightly
decreased in 2012 (4.7%).
11.110.7
11.2
18.1
17.0
3.2
4.5 4.2 5.44.7
6.6
7.6 8.2
12.9
11.8
1.01.3 1.5 1.6
1.10.0
5.0
10.0
15.0
20.0
25.0
2 0 0 9 2 0 1 0 2 0 1 1 2 0 1 2 2 0 1 3
ED V
ISIT
S (P
ERC
ENT)
Anxiety Bipolar Depression PTSD Schizophrenia
10
Posttraumatic stress disorder (PTSD) and schizophrenia are the least common mental disorders
seen in ED for Lyon County residents. The rates were consistently below 2.0% for both mental
health disorders between 2009 and 2013. There was a constant rise of PTSD ED admissions
from 2009 to 2013 - 0.5% to 1.5%. There was a slight increase from 2009 (1.0%) to 2012 (1.6%)
in schizophrenia admissions, but falls to 1.1% in 2013.
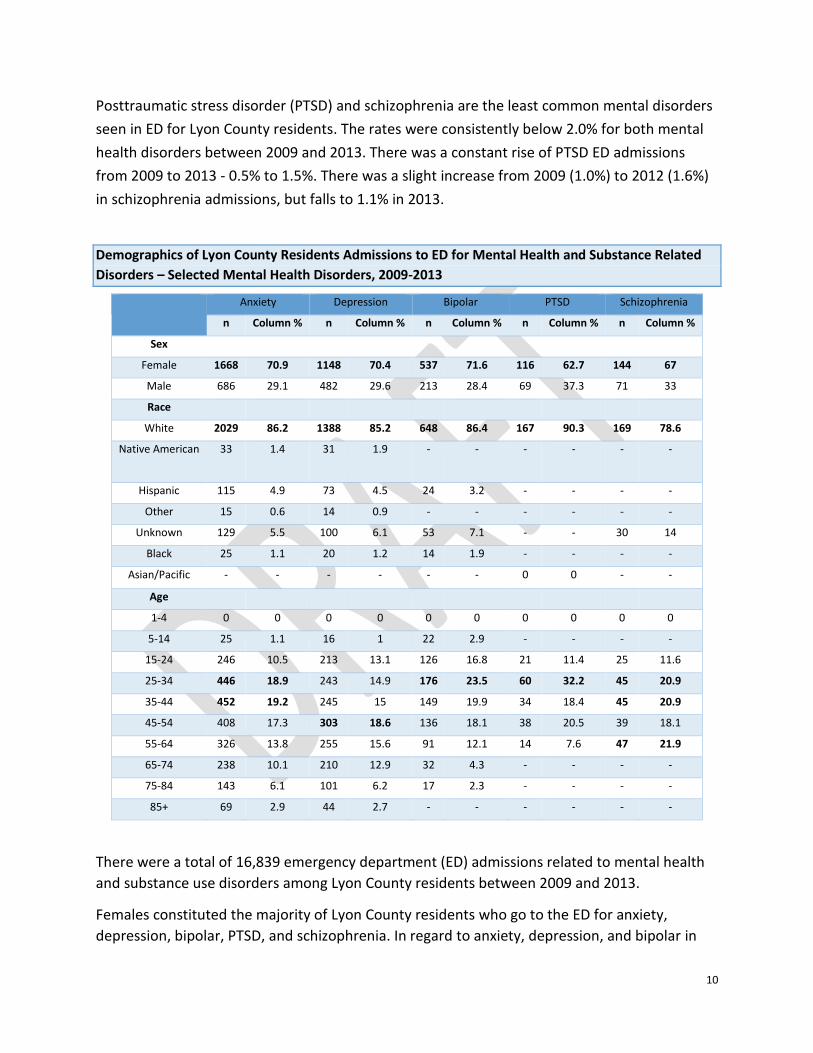
Demographics of Lyon County Residents Admissions to ED for Mental Health and Substance Related
Disorders – Selected Mental Health Disorders, 2009-2013
Anxiety Depression Bipolar PTSD Schizophrenia
n Column % n Column % n Column % n Column % n Column %
Sex
Female 1668 70.9 1148 70.4 537 71.6 116 62.7 144 67
Male 686 29.1 482 29.6 213 28.4 69 37.3 71 33
Race
White 2029 86.2 1388 85.2 648 86.4 167 90.3 169 78.6
Native American 33 1.4 31 1.9 - - - - - -
Hispanic 115 4.9 73 4.5 24 3.2 - - - -
Other 15 0.6 14 0.9 - - - - - -
Unknown 129 5.5 100 6.1 53 7.1 - - 30 14
Black 25 1.1 20 1.2 14 1.9 - - - -
Asian/Pacific - - - - - - 0 0 - -
Age
1-4 0 0 0 0 0 0 0 0 0 0
5-14 25 1.1 16 1 22 2.9 - - - -
15-24 246 10.5 213 13.1 126 16.8 21 11.4 25 11.6
25-34 446 18.9 243 14.9 176 23.5 60 32.2 45 20.9
35-44 452 19.2 245 15 149 19.9 34 18.4 45 20.9
45-54 408 17.3 303 18.6 136 18.1 38 20.5 39 18.1
55-64 326 13.8 255 15.6 91 12.1 14 7.6 47 21.9
65-74 238 10.1 210 12.9 32 4.3 - - - -
75-84 143 6.1 101 6.2 17 2.3 - - - -
85+ 69 2.9 44 2.7 - - - - - -
There were a total of 16,839 emergency department (ED) admissions related to mental health
and substance use disorders among Lyon County residents between 2009 and 2013.
Females constituted the majority of Lyon County residents who go to the ED for anxiety,
depression, bipolar, PTSD, and schizophrenia. In regard to anxiety, depression, and bipolar in
11
particular, about 70% are female. Over 60% of admissions for PTSD and schizophrenia were
females.
As Lyon County residents are primarily White, non-Hispanic, the ED data is reflective of that
demographic. Whites accounted for anywhere from 78.6% of admissions (schizophrenia) to
90.3% of admission (PTSD).
The 25-34 year olds and 35-44 year olds each consisted of approximately 19% of anxiety-related
ED admissions. Anxiety admissions decreased after 45 years or more of age. The group aged 45-
54 years made up nearly 19% of depression-related ED admissions and that percentage
decreased with age. Bipolar-related admissions peak at the age of 25-34 years and drops slowly
afterword. Similar to anxiety and bipolar, the 25-34 year age group comprised a large portion of
PTSD anxiety admissions (32%). There is a drop in admissions at the age of 35 and onwards. The
age groups with the largest ED admissions for schizophrenia are 25-44 years and 55-64 years.
These two age groups each make up over 20% of admissions.
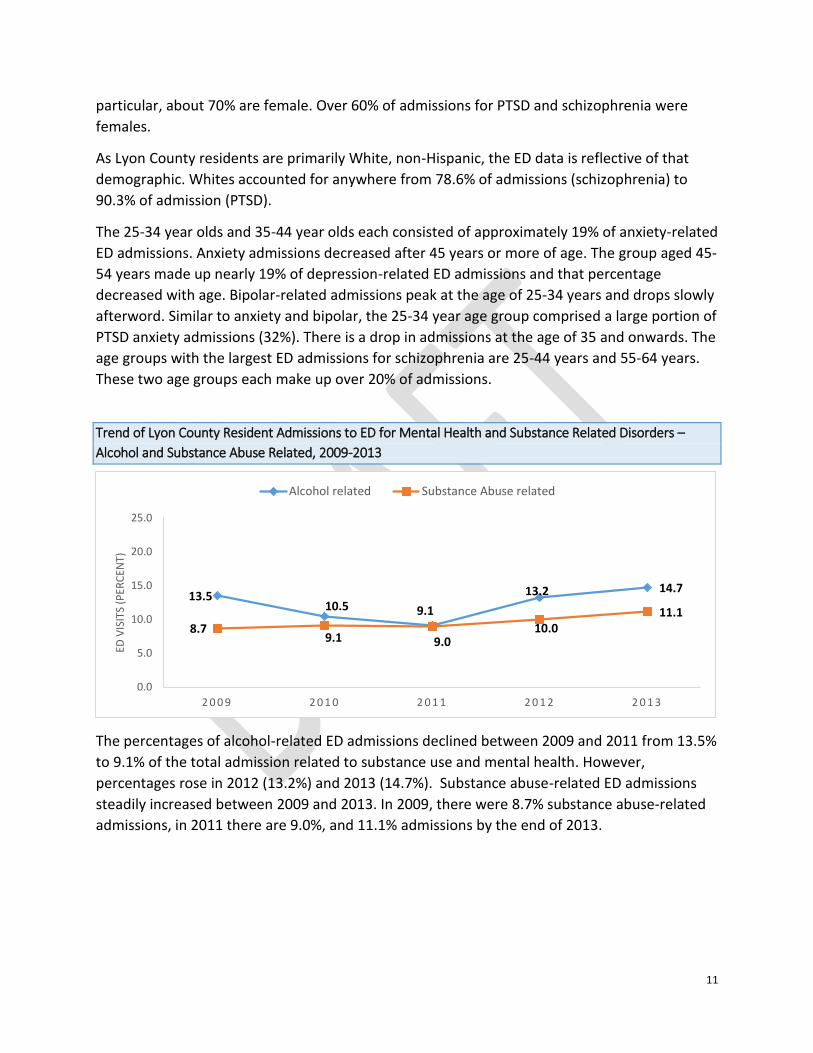
Trend of Lyon County Resident Admissions to ED for Mental Health and Substance Related Disorders –
Alcohol and Substance Abuse Related, 2009-2013
The percentages of alcohol-related ED admissions declined between 2009 and 2011 from 13.5%
to 9.1% of the total admission related to substance use and mental health. However,
percentages rose in 2012 (13.2%) and 2013 (14.7%). Substance abuse-related ED admissions
steadily increased between 2009 and 2013. In 2009, there were 8.7% substance abuse-related
admissions, in 2011 there are 9.0%, and 11.1% admissions by the end of 2013.
13.510.5 9.1
13.2 14.7
8.79.1 9.0
10.011.1
0.0
5.0
10.0
15.0
20.0
25.0
2 0 0 9 2 0 1 0 2 0 1 1 2 0 1 2 2 0 1 3
ED V
ISIT
S (P
ERC
ENT)
Alcohol related Substance Abuse related
12
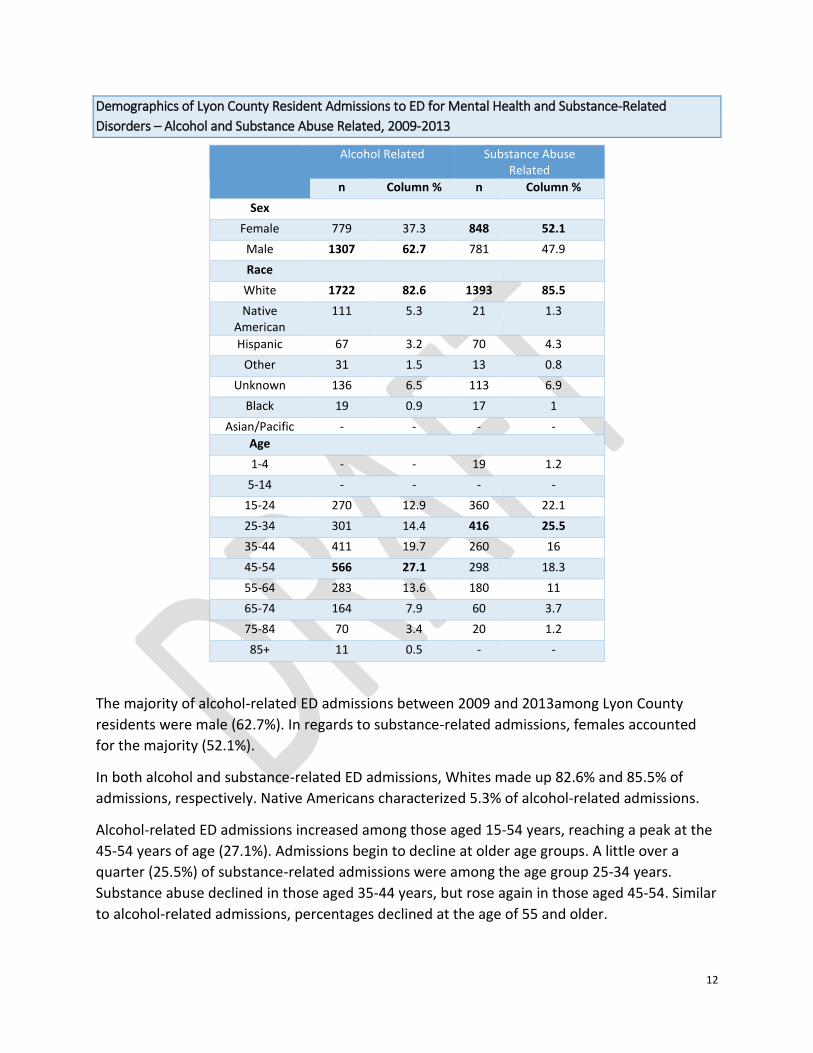
Demographics of Lyon County Resident Admissions to ED for Mental Health and Substance-Related
Disorders – Alcohol and Substance Abuse Related, 2009-2013
The majority of alcohol-related ED admissions between 2009 and 2013among Lyon County
residents were male (62.7%). In regards to substance-related admissions, females accounted
for the majority (52.1%).
In both alcohol and substance-related ED admissions, Whites made up 82.6% and 85.5% of
admissions, respectively. Native Americans characterized 5.3% of alcohol-related admissions.
Alcohol-related ED admissions increased among those aged 15-54 years, reaching a peak at the
45-54 years of age (27.1%). Admissions begin to decline at older age groups. A little over a
quarter (25.5%) of substance-related admissions were among the age group 25-34 years.
Substance abuse declined in those aged 35-44 years, but rose again in those aged 45-54. Similar
to alcohol-related admissions, percentages declined at the age of 55 and older.
Alcohol Related Substance Abuse Related
n Column % n Column %
Sex
Female 779 37.3 848 52.1
Male 1307 62.7 781 47.9
Race
White 1722 82.6 1393 85.5
Native American
111 5.3 21 1.3
Hispanic 67 3.2 70 4.3
Other 31 1.5 13 0.8
Unknown 136 6.5 113 6.9
Black 19 0.9 17 1
Asian/Pacific - - - -
Age
1-4 - - 19 1.2
5-14 - - - -
15-24 270 12.9 360 22.1
25-34 301 14.4 416 25.5
35-44 411 19.7 260 16
45-54 566 27.1 298 18.3
55-64 283 13.6 180 11
65-74 164 7.9 60 3.7
75-84 70 3.4 20 1.2
85+ 11 0.5 - -
13
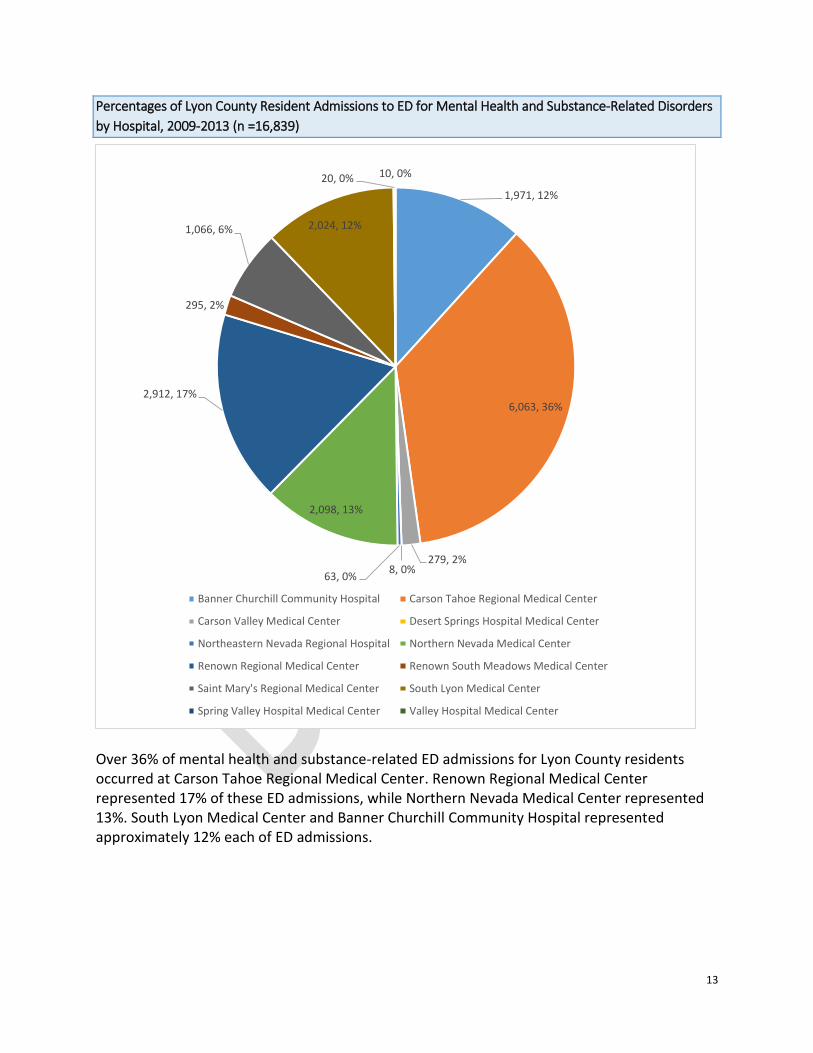
Percentages of Lyon County Resident Admissions to ED for Mental Health and Substance-Related Disorders
by Hospital, 2009-2013 (n =16,839)
Over 36% of mental health and substance-related ED admissions for Lyon County residents occurred at Carson Tahoe Regional Medical Center. Renown Regional Medical Center represented 17% of these ED admissions, while Northern Nevada Medical Center represented 13%. South Lyon Medical Center and Banner Churchill Community Hospital represented approximately 12% each of ED admissions.
1,971, 12%
6,063, 36%
279, 2%8, 0%
63, 0%
2,098, 13%
2,912, 17%
295, 2%
1,066, 6% 2,024, 12%
20, 0% 10, 0%
Banner Churchill Community Hospital Carson Tahoe Regional Medical Center
Carson Valley Medical Center Desert Springs Hospital Medical Center
Northeastern Nevada Regional Hospital Northern Nevada Medical Center
Renown Regional Medical Center Renown South Meadows Medical Center
Saint Mary's Regional Medical Center South Lyon Medical Center
Spring Valley Hospital Medical Center Valley Hospital Medical Center
14
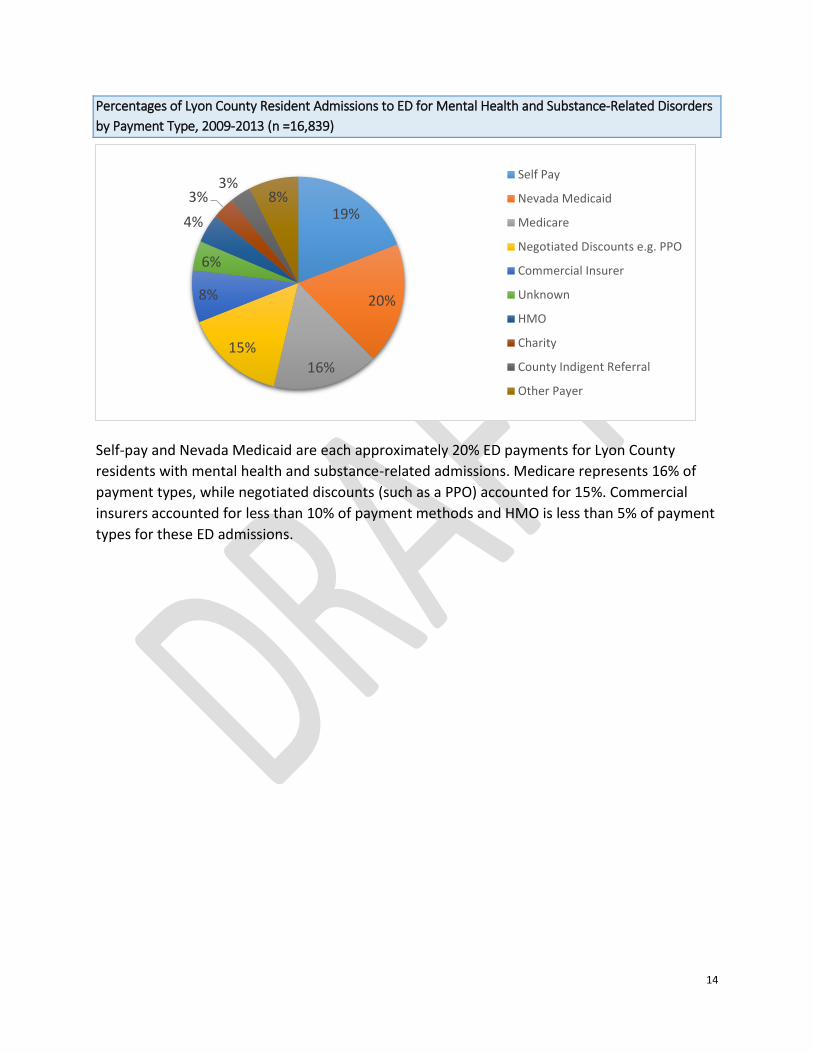
Percentages of Lyon County Resident Admissions to ED for Mental Health and Substance-Related Disorders
by Payment Type, 2009-2013 (n =16,839)
Self-pay and Nevada Medicaid are each approximately 20% ED payments for Lyon County
residents with mental health and substance-related admissions. Medicare represents 16% of
payment types, while negotiated discounts (such as a PPO) accounted for 15%. Commercial
insurers accounted for less than 10% of payment methods and HMO is less than 5% of payment
types for these ED admissions.
19%
20%
16%15%
8%
6%
4%
3%3%
8%
Self Pay
Nevada Medicaid
Medicare
Negotiated Discounts e.g. PPO
Commercial Insurer
Unknown
HMO
Charity
County Indigent Referral
Other Payer
15
Hospital Inpatient Discharge The data provided in this section is derived from the hospital inpatient billing data compiled by the University of Nevada, Las Vegas, Center for Health Information Analysis (CHIA). These data are based on admissions, not patients, so in some cases a single person may represent multiple admissions.
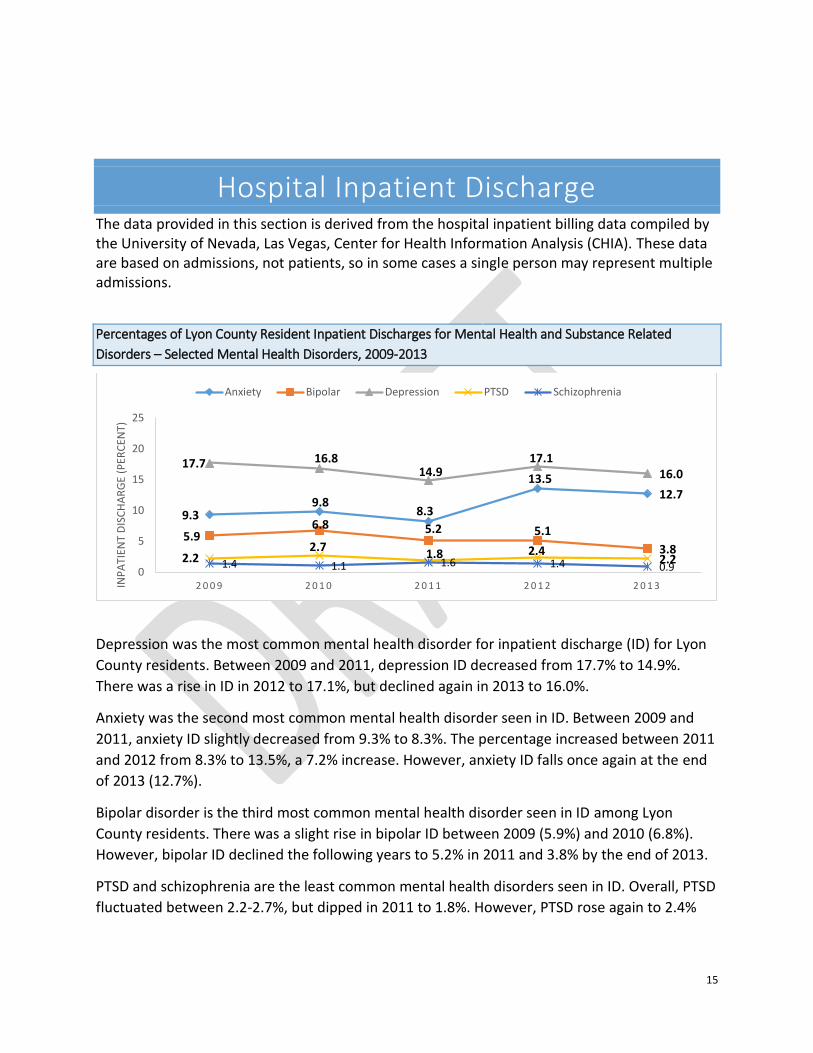
Percentages of Lyon County Resident Inpatient Discharges for Mental Health and Substance Related
Disorders – Selected Mental Health Disorders, 2009-2013
Depression was the most common mental health disorder for inpatient discharge (ID) for Lyon
County residents. Between 2009 and 2011, depression ID decreased from 17.7% to 14.9%.
There was a rise in ID in 2012 to 17.1%, but declined again in 2013 to 16.0%.
Anxiety was the second most common mental health disorder seen in ID. Between 2009 and
2011, anxiety ID slightly decreased from 9.3% to 8.3%. The percentage increased between 2011
and 2012 from 8.3% to 13.5%, a 7.2% increase. However, anxiety ID falls once again at the end
of 2013 (12.7%).
Bipolar disorder is the third most common mental health disorder seen in ID among Lyon
County residents. There was a slight rise in bipolar ID between 2009 (5.9%) and 2010 (6.8%).
However, bipolar ID declined the following years to 5.2% in 2011 and 3.8% by the end of 2013.
PTSD and schizophrenia are the least common mental health disorders seen in ID. Overall, PTSD
fluctuated between 2.2-2.7%, but dipped in 2011 to 1.8%. However, PTSD rose again to 2.4%
9.39.8
8.3
13.512.7
5.96.8 5.2 5.1
3.8
17.7 16.814.9
17.116.0
2.22.7
1.8 2.42.21.4 1.1 1.6 1.4 0.90
5
10
15
20
25
2 0 0 9 2 0 1 0 2 0 1 1 2 0 1 2 2 0 1 3INP
ATI
ENT
DIS
CH
AR
GE
(PER
CEN
T)
Anxiety Bipolar Depression PTSD Schizophrenia
16
the following year (2011). Between 2009 and 2012, schizophrenia ID ranged from 1.1-1.6%. In
2013, ID declined to 0.9%.
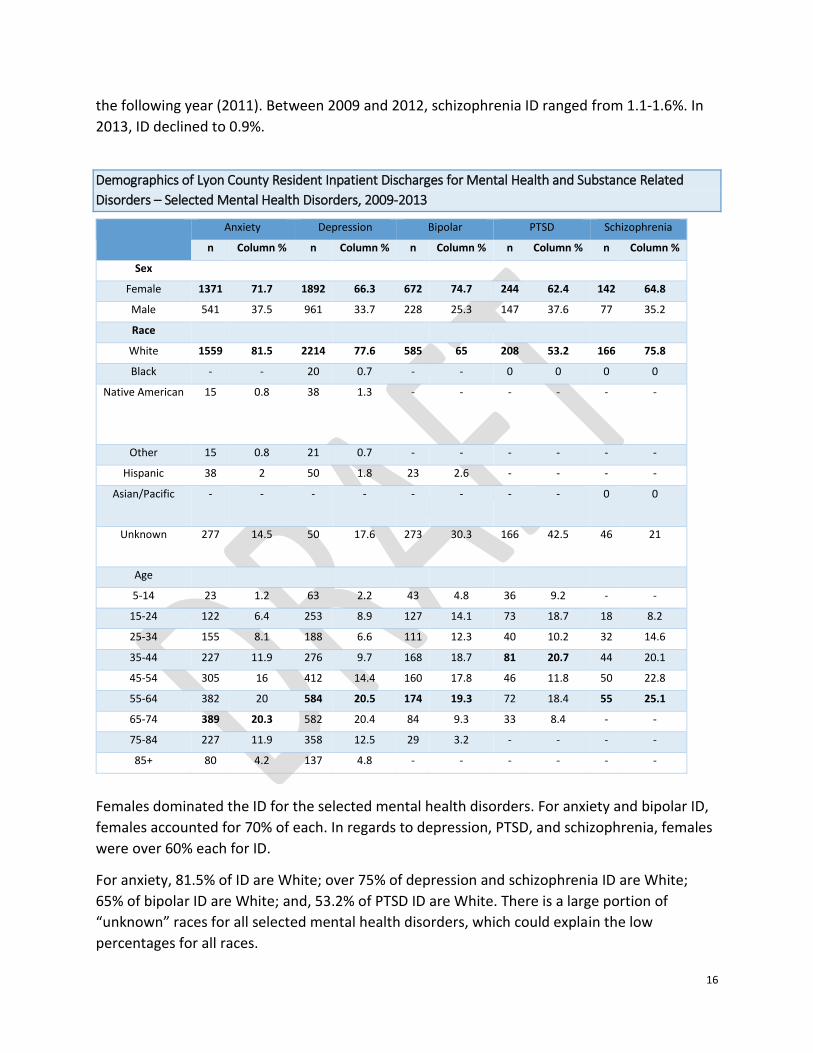
Demographics of Lyon County Resident Inpatient Discharges for Mental Health and Substance Related
Disorders – Selected Mental Health Disorders, 2009-2013
Anxiety Depression Bipolar PTSD Schizophrenia
n Column % n Column % n Column % n Column % n Column %
Sex
Female 1371 71.7 1892 66.3 672 74.7 244 62.4 142 64.8
Male 541 37.5 961 33.7 228 25.3 147 37.6 77 35.2
Race
White 1559 81.5 2214 77.6 585 65 208 53.2 166 75.8
Black - - 20 0.7 - - 0 0 0 0
Native American 15 0.8 38 1.3 - - - - - -
Other 15 0.8 21 0.7 - - - - - -
Hispanic 38 2 50 1.8 23 2.6 - - - -
Asian/Pacific - - - - - - - - 0 0
Unknown 277 14.5 50 17.6 273 30.3 166 42.5 46 21
Age
5-14 23 1.2 63 2.2 43 4.8 36 9.2 - -
15-24 122 6.4 253 8.9 127 14.1 73 18.7 18 8.2
25-34 155 8.1 188 6.6 111 12.3 40 10.2 32 14.6
35-44 227 11.9 276 9.7 168 18.7 81 20.7 44 20.1
45-54 305 16 412 14.4 160 17.8 46 11.8 50 22.8
55-64 382 20 584 20.5 174 19.3 72 18.4 55 25.1
65-74 389 20.3 582 20.4 84 9.3 33 8.4 - -
75-84 227 11.9 358 12.5 29 3.2 - - - -
85+ 80 4.2 137 4.8 - - - - - -
Females dominated the ID for the selected mental health disorders. For anxiety and bipolar ID,
females accounted for 70% of each. In regards to depression, PTSD, and schizophrenia, females
were over 60% each for ID.
For anxiety, 81.5% of ID are White; over 75% of depression and schizophrenia ID are White;
65% of bipolar ID are White; and, 53.2% of PTSD ID are White. There is a large portion of
“unknown” races for all selected mental health disorders, which could explain the low
percentages for all races.
17
The two largest age groups for anxiety and depression ID are those aged 55-64 years and 65-74
years. The dominant age groups for bipolar ID are those aged 35 to 64 years. The largest age
groups for PTSD are those aged 15-24 years, 35-44 years, and 55-64 years. The largest age
groups for schizophrenia are those aged the 45-54 years and 55-64 years.
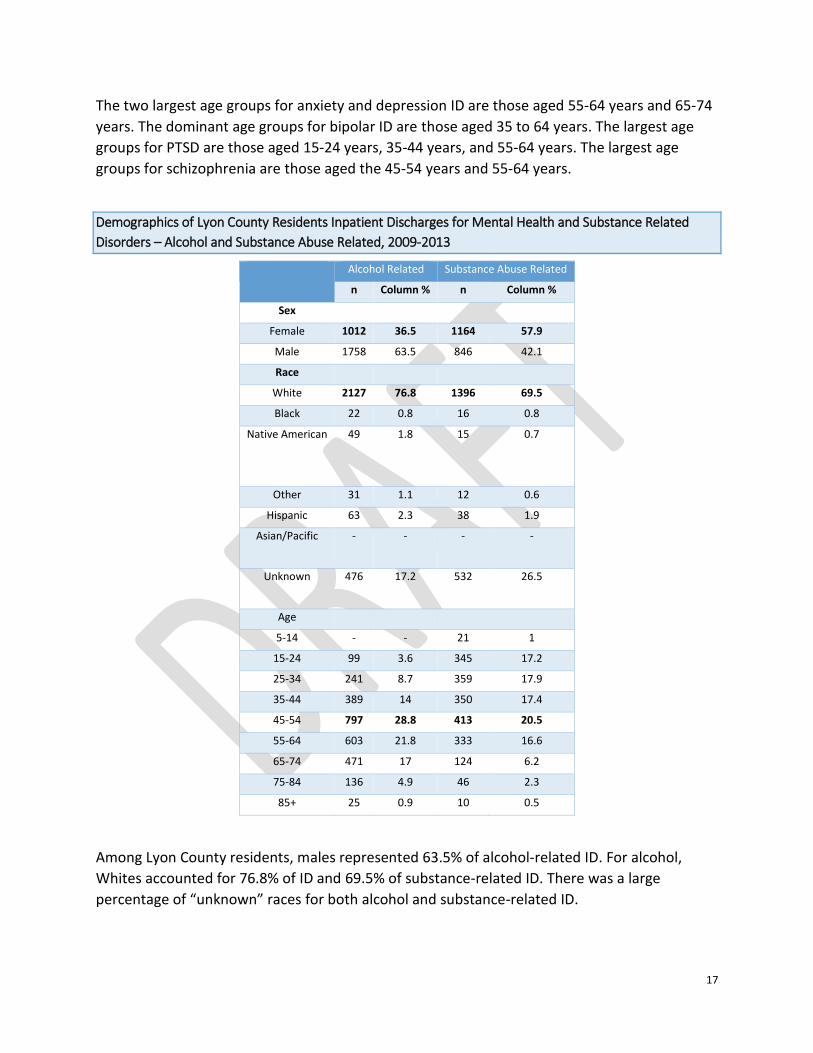
Demographics of Lyon County Residents Inpatient Discharges for Mental Health and Substance Related
Disorders – Alcohol and Substance Abuse Related, 2009-2013
Alcohol Related Substance Abuse Related
n Column % n Column %
Sex
Female 1012 36.5 1164 57.9
Male 1758 63.5 846 42.1
Race
White 2127 76.8 1396 69.5
Black 22 0.8 16 0.8
Native American 49 1.8 15 0.7
Other 31 1.1 12 0.6
Hispanic 63 2.3 38 1.9
Asian/Pacific - - - -
Unknown 476 17.2 532 26.5
Age
5-14 - - 21 1
15-24 99 3.6 345 17.2
25-34 241 8.7 359 17.9
35-44 389 14 350 17.4
45-54 797 28.8 413 20.5
55-64 603 21.8 333 16.6
65-74 471 17 124 6.2
75-84 136 4.9 46 2.3
85+ 25 0.9 10 0.5
Among Lyon County residents, males represented 63.5% of alcohol-related ID. For alcohol,
Whites accounted for 76.8% of ID and 69.5% of substance-related ID. There was a large
percentage of “unknown” races for both alcohol and substance-related ID.
18
The largest age groups for alcohol and substance-related ID was the group aged 45-54 years.
For alcohol, those aged 45-54 years accounted for 28.8% of ID and 30.5% for substance-related
ID.
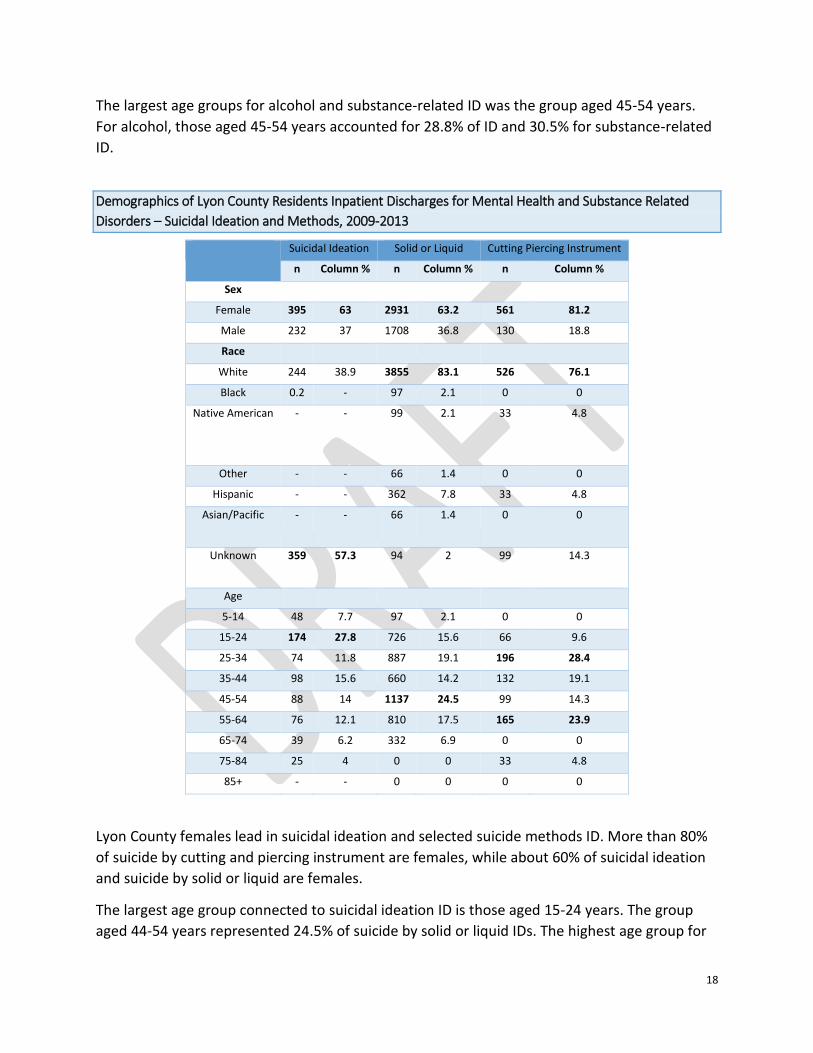
Demographics of Lyon County Residents Inpatient Discharges for Mental Health and Substance Related
Disorders – Suicidal Ideation and Methods, 2009-2013
Suicidal Ideation Solid or Liquid Cutting Piercing Instrument
n Column % n Column % n Column %
Sex
Female 395 63 2931 63.2 561 81.2
Male 232 37 1708 36.8 130 18.8
Race
White 244 38.9 3855 83.1 526 76.1
Black 0.2 - 97 2.1 0 0
Native American - - 99 2.1 33 4.8
Other - - 66 1.4 0 0
Hispanic - - 362 7.8 33 4.8
Asian/Pacific - - 66 1.4 0 0
Unknown 359 57.3 94 2 99 14.3
Age
5-14 48 7.7 97 2.1 0 0
15-24 174 27.8 726 15.6 66 9.6
25-34 74 11.8 887 19.1 196 28.4
35-44 98 15.6 660 14.2 132 19.1
45-54 88 14 1137 24.5 99 14.3
55-64 76 12.1 810 17.5 165 23.9
65-74 39 6.2 332 6.9 0 0
75-84 25 4 0 0 33 4.8
85+ - - 0 0 0 0
Lyon County females lead in suicidal ideation and selected suicide methods ID. More than 80%
of suicide by cutting and piercing instrument are females, while about 60% of suicidal ideation
and suicide by solid or liquid are females.
The largest age group connected to suicidal ideation ID is those aged 15-24 years. The group
aged 44-54 years represented 24.5% of suicide by solid or liquid IDs. The highest age group for
19
suicide by cutting and piercing instrument was those aged 25-34 years (28.4%). There was an
increase in the group aged 55-64 years for suicide by cutting and piercing instrument (23.9%).
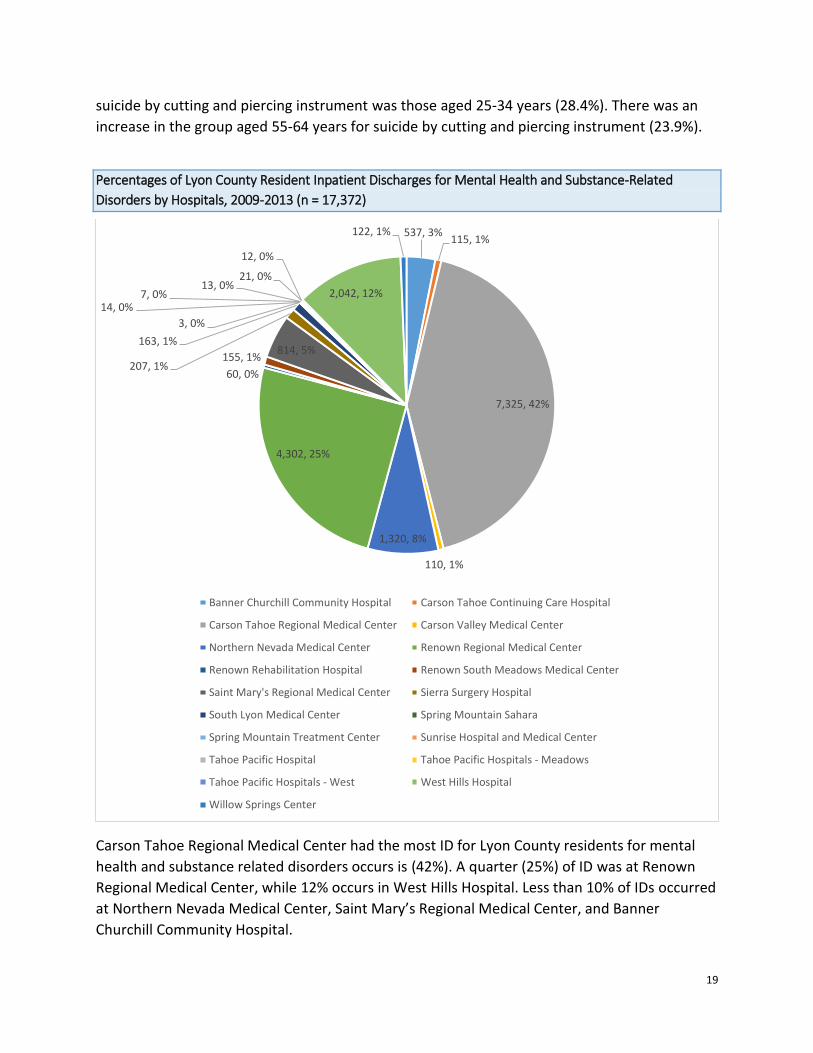
Percentages of Lyon County Resident Inpatient Discharges for Mental Health and Substance-Related
Disorders by Hospitals, 2009-2013 (n = 17,372)
Carson Tahoe Regional Medical Center had the most ID for Lyon County residents for mental
health and substance related disorders occurs is (42%). A quarter (25%) of ID was at Renown
Regional Medical Center, while 12% occurs in West Hills Hospital. Less than 10% of IDs occurred
at Northern Nevada Medical Center, Saint Mary’s Regional Medical Center, and Banner
Churchill Community Hospital.
537, 3%115, 1%
7,325, 42%
110, 1%
1,320, 8%
4,302, 25%
60, 0%
155, 1%814, 5%
207, 1%
163, 1%
3, 0%
14, 0%7, 0%
13, 0%21, 0%
12, 0%
2,042, 12%
122, 1%
Banner Churchill Community Hospital Carson Tahoe Continuing Care Hospital
Carson Tahoe Regional Medical Center Carson Valley Medical Center
Northern Nevada Medical Center Renown Regional Medical Center
Renown Rehabilitation Hospital Renown South Meadows Medical Center
Saint Mary's Regional Medical Center Sierra Surgery Hospital
South Lyon Medical Center Spring Mountain Sahara
Spring Mountain Treatment Center Sunrise Hospital and Medical Center
Tahoe Pacific Hospital Tahoe Pacific Hospitals - Meadows
Tahoe Pacific Hospitals - West West Hills Hospital
Willow Springs Center
20
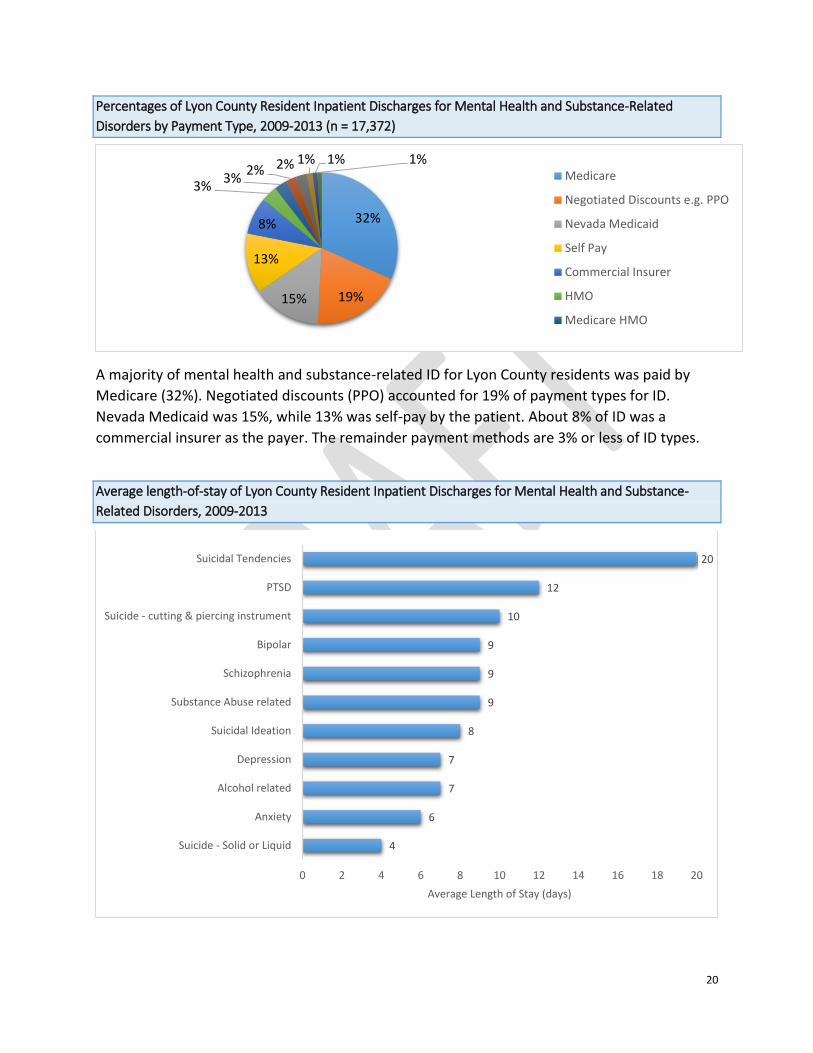
Percentages of Lyon County Resident Inpatient Discharges for Mental Health and Substance-Related
Disorders by Payment Type, 2009-2013 (n = 17,372)
A majority of mental health and substance-related ID for Lyon County residents was paid by
Medicare (32%). Negotiated discounts (PPO) accounted for 19% of payment types for ID.
Nevada Medicaid was 15%, while 13% was self-pay by the patient. About 8% of ID was a
commercial insurer as the payer. The remainder payment methods are 3% or less of ID types.
Average length-of-stay of Lyon County Resident Inpatient Discharges for Mental Health and Substance-
Related Disorders, 2009-2013
32%
19%15%
13%
8%
3%3%
2% 2% 1% 1% 1%Medicare
Negotiated Discounts e.g. PPO
Nevada Medicaid
Self Pay
Commercial Insurer
HMO
Medicare HMO
20
12
10
9
9
9
8
7
7
6
4
0 2 4 6 8 10 12 14 16 18 20
Suicidal Tendencies
PTSD
Suicide - cutting & piercing instrument
Bipolar
Schizophrenia
Substance Abuse related
Suicidal Ideation
Depression
Alcohol related
Anxiety
Suicide - Solid or Liquid
Average Length of Stay (days)
21
Suicidal tendencies have the highest average length of stay for IDs at 20 days, but where not
included in the previous analysis due to small counts. PTSD has an average length of stay of12
days, while suicide by cutting and piercing instrument had average stay of about 10 days.
Bipolar, schizophrenia, and substance-related ID had an average length of stay of 9 days. Those
discharged with suicidal ideation stayed an average of 8 days. Those with depression and
alcohol-related issues were admitted for a mean of 7 days. The average length of stay for
alcohol -related disorder was 6 days. Suicide by solid or liquid had the smallest length of stay at
an average of 4 days.
Substance Abuse Treatment Facilities The data in this section is reflective of services received by Lyon County residents at treatment
facilities funded by the DPBH’s Substance Abuse Treatment and Prevention Agency (SAPTA).
This is not a comprehensive accounting of all Lyon County residents who receive substance use
treatment.
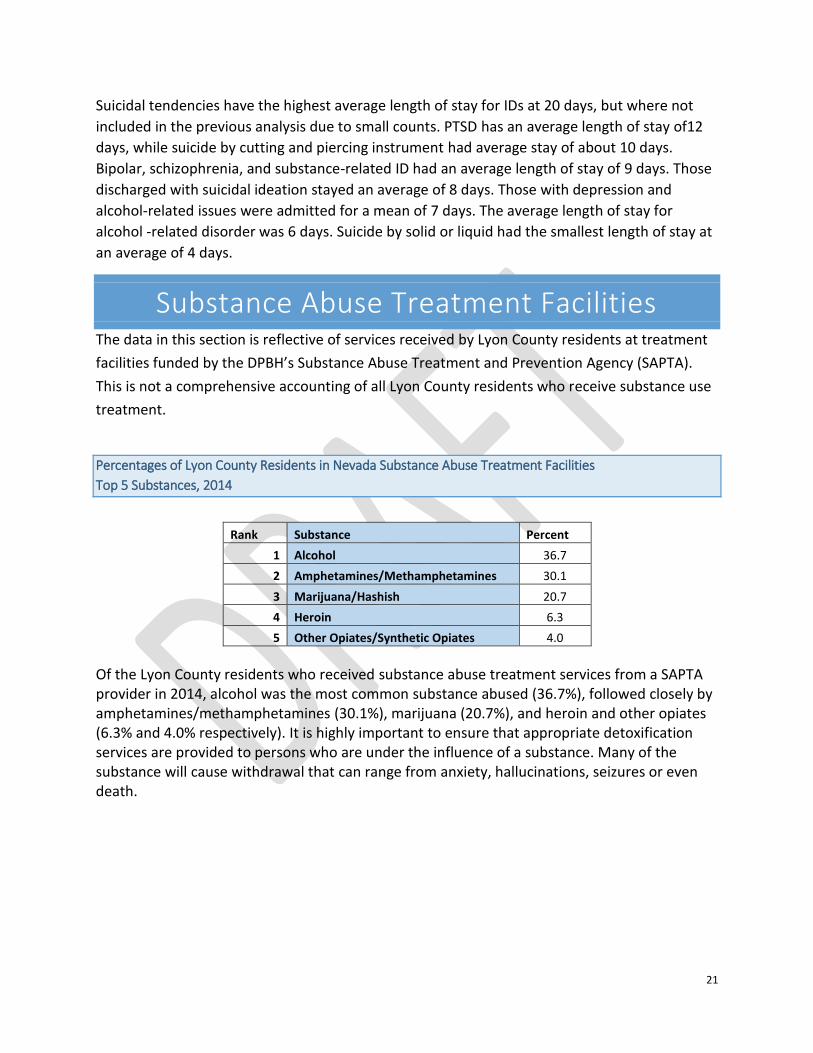
Percentages of Lyon County Residents in Nevada Substance Abuse Treatment Facilities
Top 5 Substances, 2014
Rank Substance Percent
1 Alcohol 36.7
2 Amphetamines/Methamphetamines 30.1
3 Marijuana/Hashish 20.7
4 Heroin 6.3
5 Other Opiates/Synthetic Opiates 4.0
Of the Lyon County residents who received substance abuse treatment services from a SAPTA provider in 2014, alcohol was the most common substance abused (36.7%), followed closely by amphetamines/methamphetamines (30.1%), marijuana (20.7%), and heroin and other opiates (6.3% and 4.0% respectively). It is highly important to ensure that appropriate detoxification services are provided to persons who are under the influence of a substance. Many of the substance will cause withdrawal that can range from anxiety, hallucinations, seizures or even death.
22
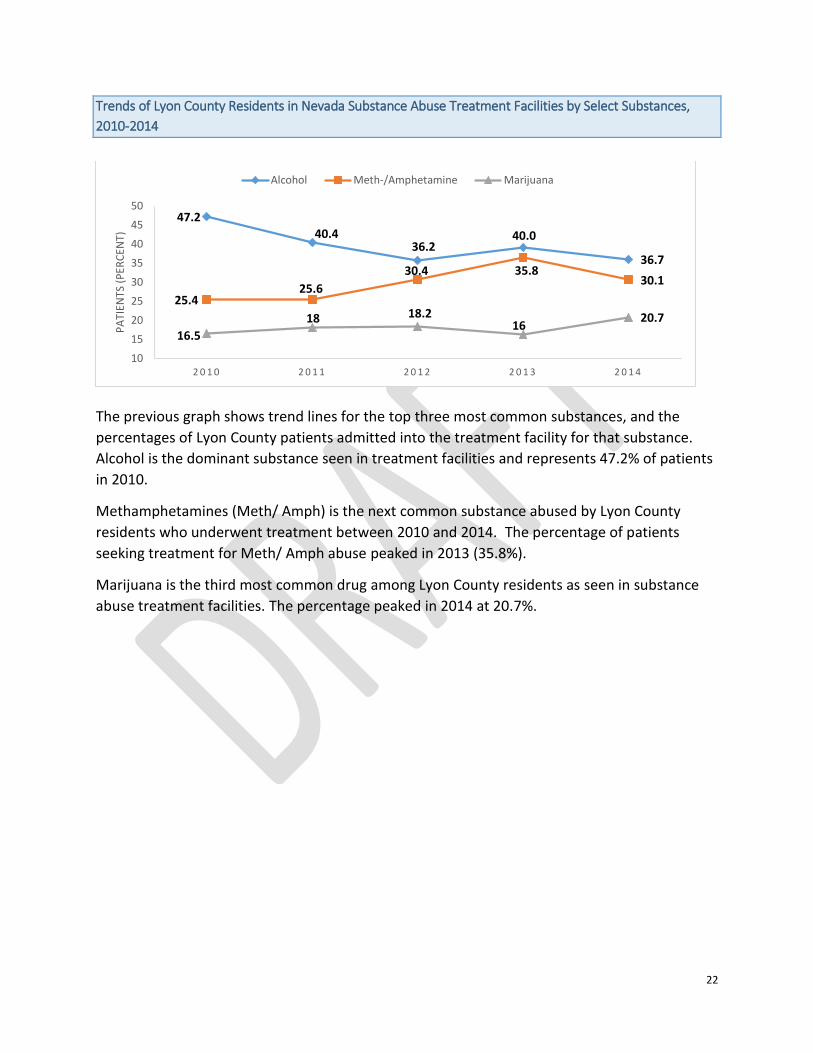
Trends of Lyon County Residents in Nevada Substance Abuse Treatment Facilities by Select Substances,
2010-2014
The previous graph shows trend lines for the top three most common substances, and the
percentages of Lyon County patients admitted into the treatment facility for that substance.
Alcohol is the dominant substance seen in treatment facilities and represents 47.2% of patients
in 2010.
Methamphetamines (Meth/ Amph) is the next common substance abused by Lyon County
residents who underwent treatment between 2010 and 2014. The percentage of patients
seeking treatment for Meth/ Amph abuse peaked in 2013 (35.8%).
Marijuana is the third most common drug among Lyon County residents as seen in substance
abuse treatment facilities. The percentage peaked in 2014 at 20.7%.
47.2
40.436.2
40.0
36.7
25.425.6
30.4 35.830.1
16.5
18 18.216
20.7
10
15
20
25
30
35
40
45
50
2 0 1 0 2 0 1 1 2 0 1 2 2 0 1 3 2 0 1 4
PA
TIEN
TS (
PER
CEN
T)
Alcohol Meth-/Amphetamine Marijuana
23
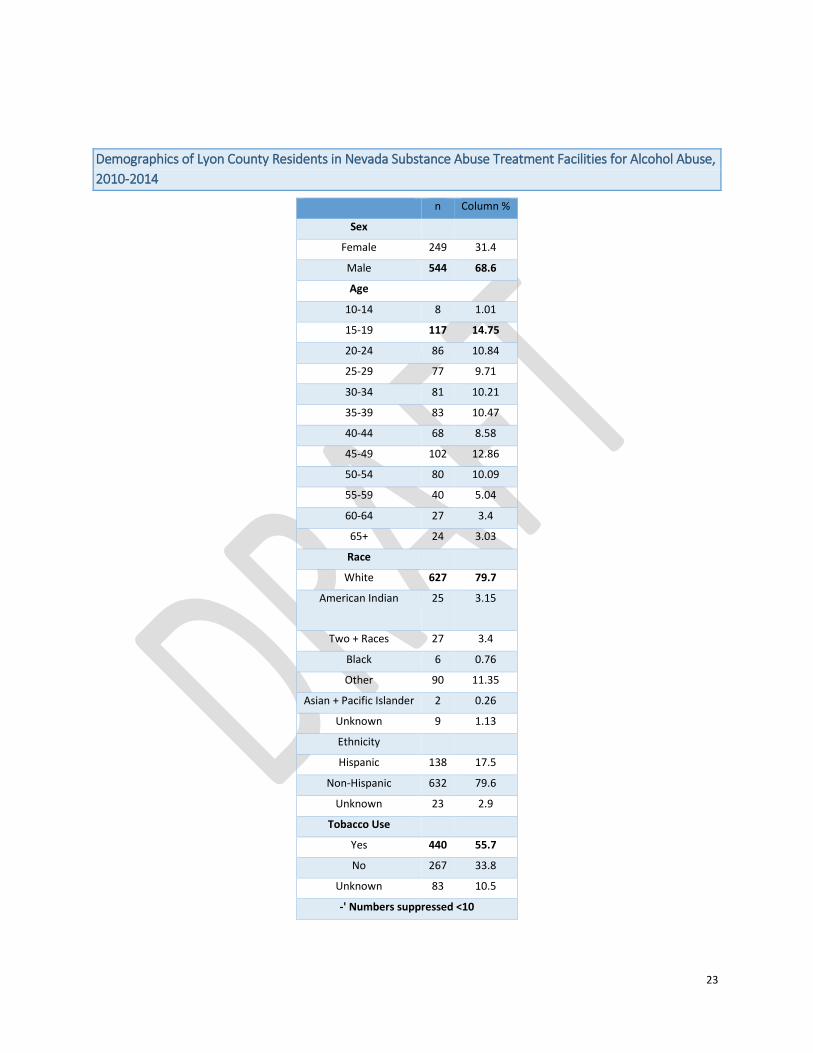
Demographics of Lyon County Residents in Nevada Substance Abuse Treatment Facilities for Alcohol Abuse,
2010-2014
n Column %
Sex
Female 249 31.4
Male 544 68.6
Age
10-14 8 1.01
15-19 117 14.75
20-24 86 10.84
25-29 77 9.71
30-34 81 10.21
35-39 83 10.47
40-44 68 8.58
45-49 102 12.86
50-54 80 10.09
55-59 40 5.04
60-64 27 3.4
65+ 24 3.03
Race
White 627 79.7
American Indian 25 3.15
Two + Races 27 3.4
Black 6 0.76
Other 90 11.35
Asian + Pacific Islander 2 0.26
Unknown 9 1.13
Ethnicity
Hispanic 138 17.5
Non-Hispanic 632 79.6
Unknown 23 2.9
Tobacco Use
Yes 440 55.7
No 267 33.8
Unknown 83 10.5
-' Numbers suppressed <10
24
There were a total of 793 Lyon County residents that sought alcohol-related substance use
treatment services from a SAPTA-funded providers between 2010 and 2014. The majority of the
patients were male (68.6%), White (79.7%), and used tobacco (55.7%) in addition to alcohol. By
age group, the most common groups that received treatment were between 15 to 19 years
(14.75%) and 45 to 49 years (12.86%).
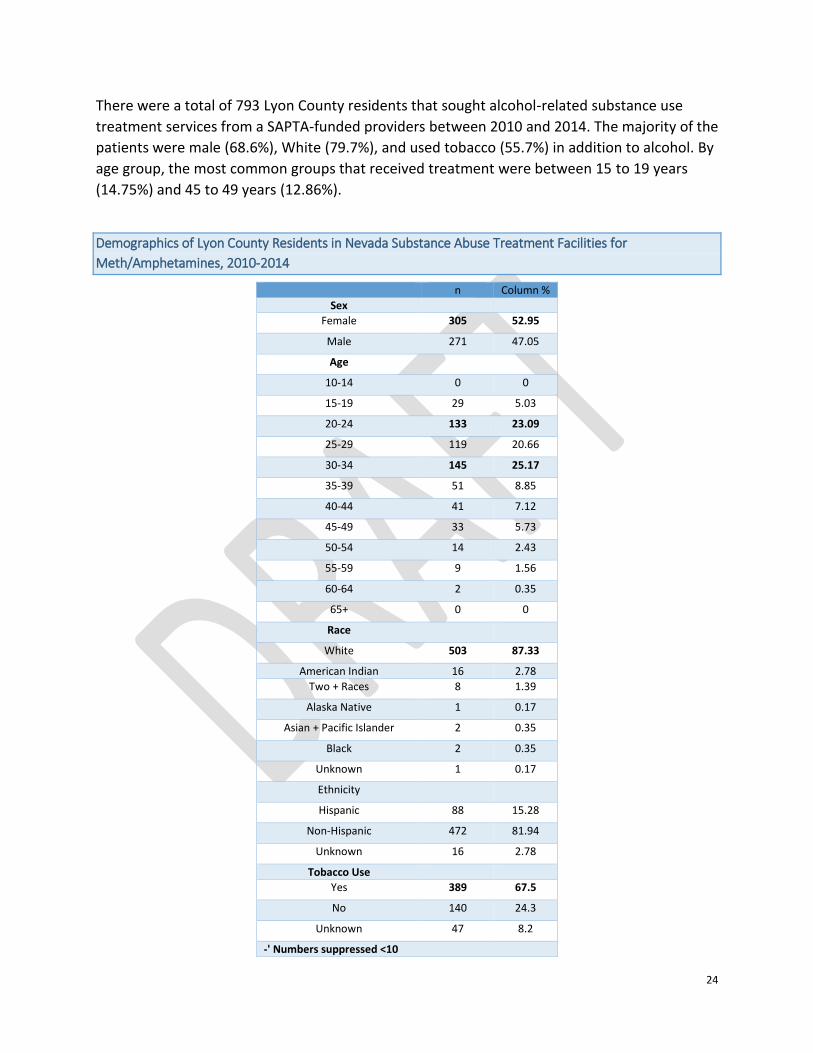
Demographics of Lyon County Residents in Nevada Substance Abuse Treatment Facilities for
Meth/Amphetamines, 2010-2014
n Column %
Sex
Female 305 52.95
Male 271 47.05
Age
10-14 0 0
15-19 29 5.03
20-24 133 23.09
25-29 119 20.66
30-34 145 25.17
35-39 51 8.85
40-44 41 7.12
45-49 33 5.73
50-54 14 2.43
55-59 9 1.56
60-64 2 0.35
65+ 0 0
Race
White 503 87.33
American Indian 16 2.78
Two + Races 8 1.39
Alaska Native 1 0.17
Asian + Pacific Islander 2 0.35
Black 2 0.35
Unknown 1 0.17
Ethnicity
Hispanic 88 15.28
Non-Hispanic 472 81.94
Unknown 16 2.78
Tobacco Use
Yes 389 67.5
No 140 24.3
Unknown 47 8.2
-' Numbers suppressed <10
25
Between 2010 and 2014, 576 Lyon County residents received treatment for methamphetamine
use. Unlike alcohol, females were more likely to seek service for this drug (52.95%). Use of this
drug and related treatment were highly concentrated among young adults aged 20 to 34 years
(68.92%). The majority of patients are White (87.33%) and used tobacco in addition to
methamphetamine (67.5%).
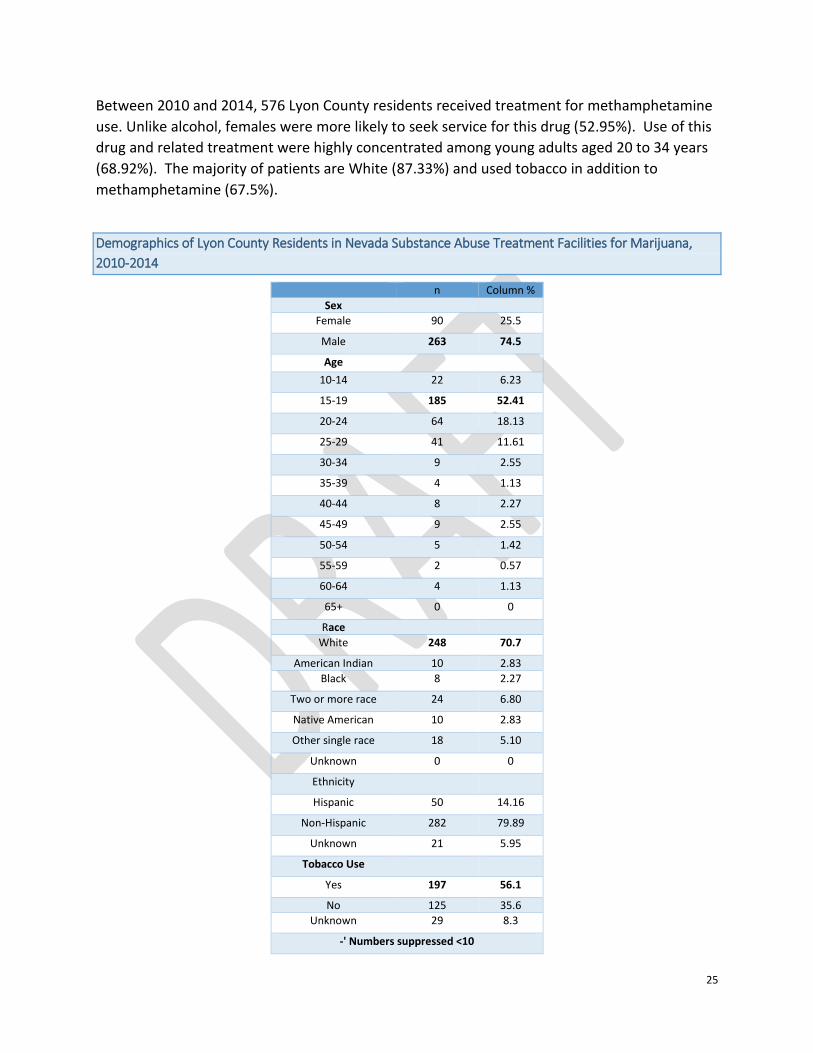
Demographics of Lyon County Residents in Nevada Substance Abuse Treatment Facilities for Marijuana,
2010-2014
n Column %
Sex
Female 90 25.5
Male 263 74.5
Age
10-14 22 6.23
15-19 185 52.41
20-24 64 18.13
25-29 41 11.61
30-34 9 2.55
35-39 4 1.13
40-44 8 2.27
45-49 9 2.55
50-54 5 1.42
55-59 2 0.57
60-64 4 1.13
65+ 0 0
Race
White 248 70.7
American Indian 10 2.83
Black 8 2.27
Two or more race 24 6.80
Native American 10 2.83
Other single race 18 5.10
Unknown 0 0
Ethnicity
Hispanic 50 14.16
Non-Hispanic 282 79.89
Unknown 21 5.95
Tobacco Use
Yes 197 56.1
No 125 35.6
Unknown 29 8.3
-' Numbers suppressed <10
26
There were a total of 353 Lyon County residents that received treatment for marijuana
between 2010 and 2014 at a SAPTA-funded treatment facility. Males represented 74.5% of
these patients. Over 88% of the patients were under the age of 30 years. Whites accounted for
70.7% of patients. More than half of these patients used tobacco (56.1%) in addition to
marijuana.
Prenatal Substance Use The data in this section is reflective of self-reported information provided by a mom on the
birth record.
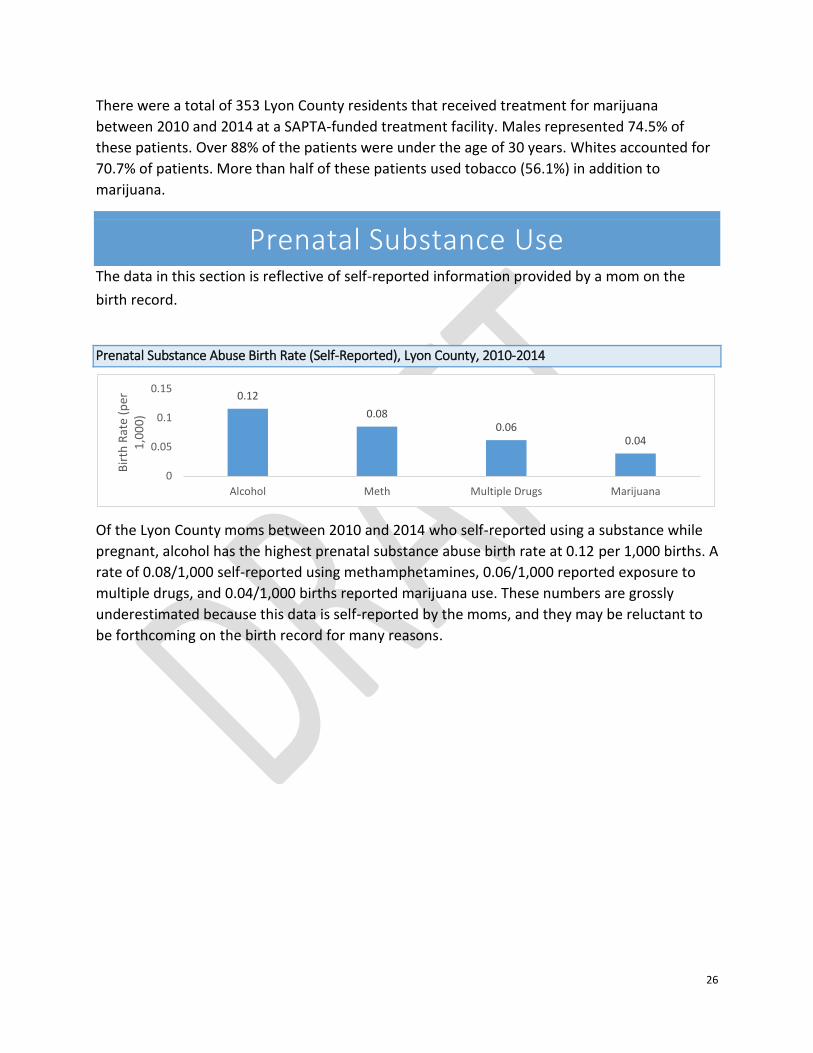
Prenatal Substance Abuse Birth Rate (Self-Reported), Lyon County, 2010-2014
Of the Lyon County moms between 2010 and 2014 who self-reported using a substance while
pregnant, alcohol has the highest prenatal substance abuse birth rate at 0.12 per 1,000 births. A
rate of 0.08/1,000 self-reported using methamphetamines, 0.06/1,000 reported exposure to
multiple drugs, and 0.04/1,000 births reported marijuana use. These numbers are grossly
underestimated because this data is self-reported by the moms, and they may be reluctant to
be forthcoming on the birth record for many reasons.
0.12
0.080.06
0.04
0
0.05
0.1
0.15
Alcohol Meth Multiple Drugs Marijuana
Bir
th R
ate
(per
1
,00
0)
27
Mental and Substance Abuse Deaths The data in this section is derived from the electronic death registry at the DPBH.
The Substance Abuse and Mental Health Service Administration (SAMHSA) reports that suicide
and mental illness are highly correlated with as much as 90% of those persons who die of
suicide having a diagnosable mental illness.
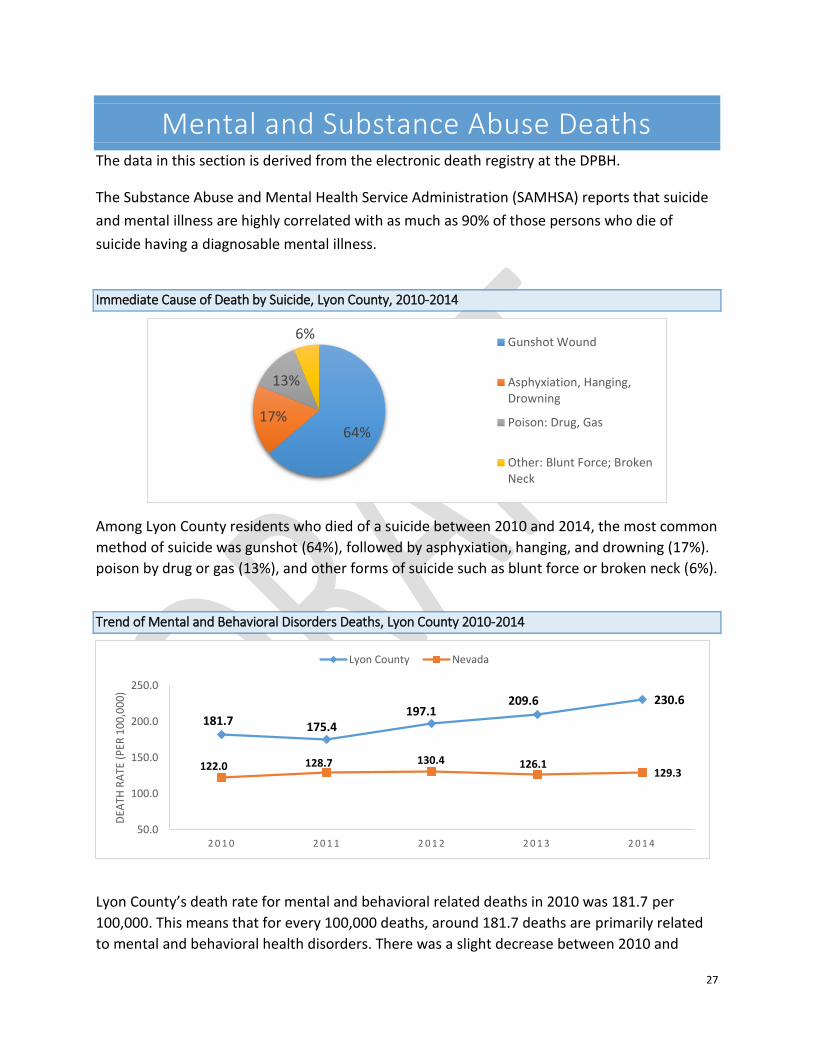
Immediate Cause of Death by Suicide, Lyon County, 2010-2014
Among Lyon County residents who died of a suicide between 2010 and 2014, the most common
method of suicide was gunshot (64%), followed by asphyxiation, hanging, and drowning (17%).
poison by drug or gas (13%), and other forms of suicide such as blunt force or broken neck (6%).
Trend of Mental and Behavioral Disorders Deaths, Lyon County 2010-2014
Lyon County’s death rate for mental and behavioral related deaths in 2010 was 181.7 per
100,000. This means that for every 100,000 deaths, around 181.7 deaths are primarily related
to mental and behavioral health disorders. There was a slight decrease between 2010 and
64%17%
13%
6%Gunshot Wound
Asphyxiation, Hanging,Drowning
Poison: Drug, Gas
Other: Blunt Force; BrokenNeck
181.7 175.4197.1
209.6 230.6
122.0 128.7 130.4 126.1129.3
50.0
100.0
150.0
200.0
250.0
2 0 1 0 2 0 1 1 2 0 1 2 2 0 1 3 2 0 1 4
DEA
TH R
ATE
(P
ER 1
00
,00
0)
Lyon County Nevada
28
2011, where the rate fell to 175.4. Between 2012 and 2014, the death rate increased to 197.1
in 2012, 209.6 in 2013, and 230.6 in 2014. Overall, Lyon County’s mental and behavioral related
death rates are higher than Nevada average, with the gap between the state and Lyon County
increasing in recent years.
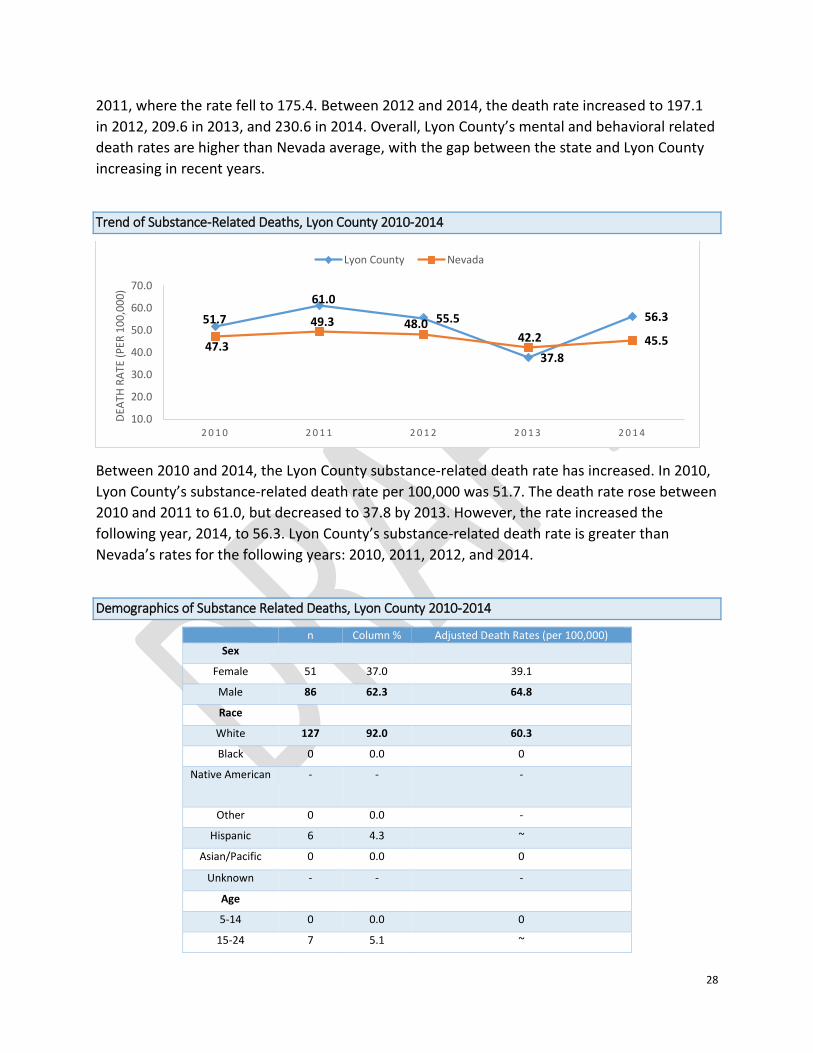
Trend of Substance-Related Deaths, Lyon County 2010-2014
Between 2010 and 2014, the Lyon County substance-related death rate has increased. In 2010,
Lyon County’s substance-related death rate per 100,000 was 51.7. The death rate rose between
2010 and 2011 to 61.0, but decreased to 37.8 by 2013. However, the rate increased the
following year, 2014, to 56.3. Lyon County’s substance-related death rate is greater than
Nevada’s rates for the following years: 2010, 2011, 2012, and 2014.
Demographics of Substance Related Deaths, Lyon County 2010-2014
n Column % Adjusted Death Rates (per 100,000)
Sex
Female 51 37.0 39.1
Male 86 62.3 64.8
Race
White 127 92.0 60.3
Black 0 0.0 0
Native American - - -
Other 0 0.0 -
Hispanic 6 4.3 ~
Asian/Pacific 0 0.0 0
Unknown - - -
Age
5-14 0 0.0 0
15-24 7 5.1 ~
51.7
61.0
55.5
37.8
56.3
47.3
49.3 48.042.2 45.5
10.0
20.0
30.0
40.0
50.0
60.0
70.0
2 0 1 0 2 0 1 1 2 0 1 2 2 0 1 3 2 0 1 4
DEA
TH R
ATE
(P
ER 1
00
,00
0)
Lyon County Nevada
29
25-34 12 8.7 53.8
35-44 11 8.0 32.4
45-54 40 29.0 115.9
55-64 43 31.2 115.7
65-74 20 14.5 66.6
75-84 5 3.6 36.6
85+ 0 0.0 0
In Lyon County, the most common groups to die of a substance-related death included: males (64.8%), Whites (60.3%), those aged 45 to 64 years of age (60.2%).
Syndromic Surveillance and Emergency Medical Services
The data contained in this section came from the DPBH’s BioSense, a syndromic surveillance
system that tracks chief complaints in emergency departments, and the National Emergency
Medical Services Information System (NEMSIS). The BioSense data was provided by South Lyon
Medical Center in Lyon County. Please note that data from this period of time was subject to a
couple system outages so data may be incomplete. This facility submits data daily. Not all EMS
agencies report regularly to NEMSIS, so the data may be underreported. The NEMSIS data are
not patient-specific, but are based on EMS resources.
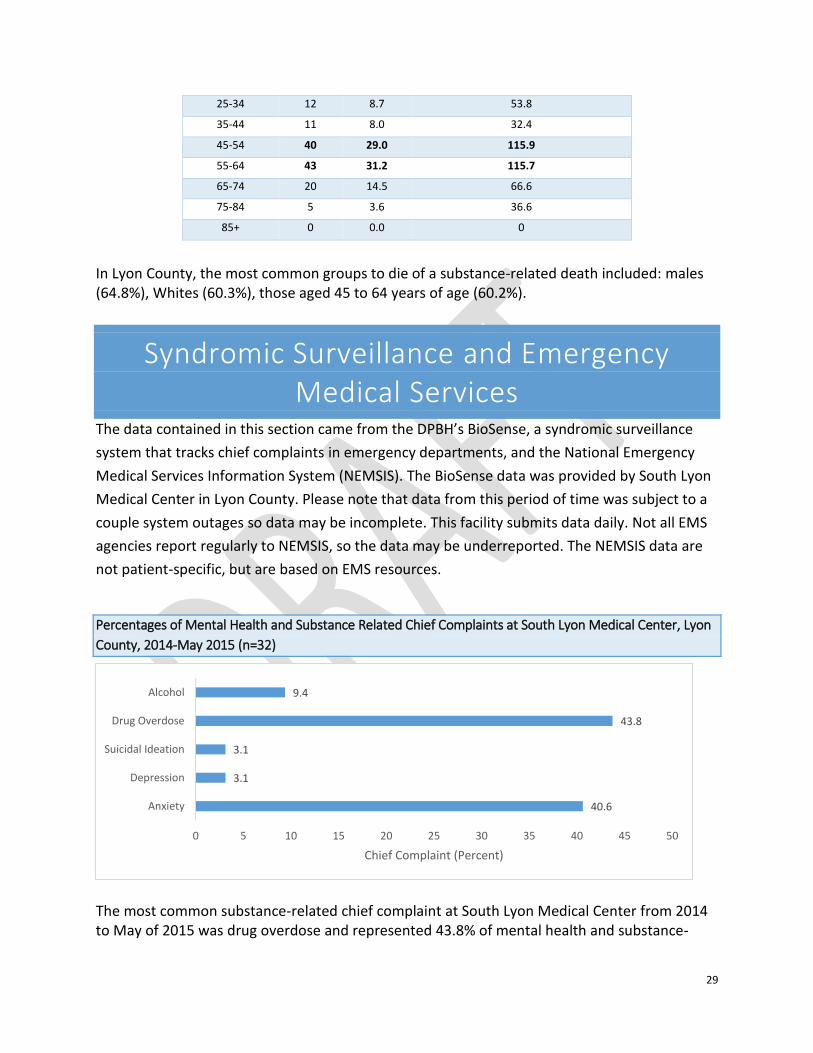
Percentages of Mental Health and Substance Related Chief Complaints at South Lyon Medical Center, Lyon
County, 2014-May 2015 (n=32)
The most common substance-related chief complaint at South Lyon Medical Center from 2014 to May of 2015 was drug overdose and represented 43.8% of mental health and substance-
40.6
3.1
3.1
43.8
9.4
0 5 10 15 20 25 30 35 40 45 50
Anxiety
Depression
Suicidal Ideation
Drug Overdose
Alcohol
Chief Complaint (Percent)
30
related complaints. Anxiety was the highest mental health complaint (40.6%). Alcohol was the lowest substance-related complaint reported at 9.4%. The smallest overall complaints were suicidal ideation (3.1%) and depression (3.1%).
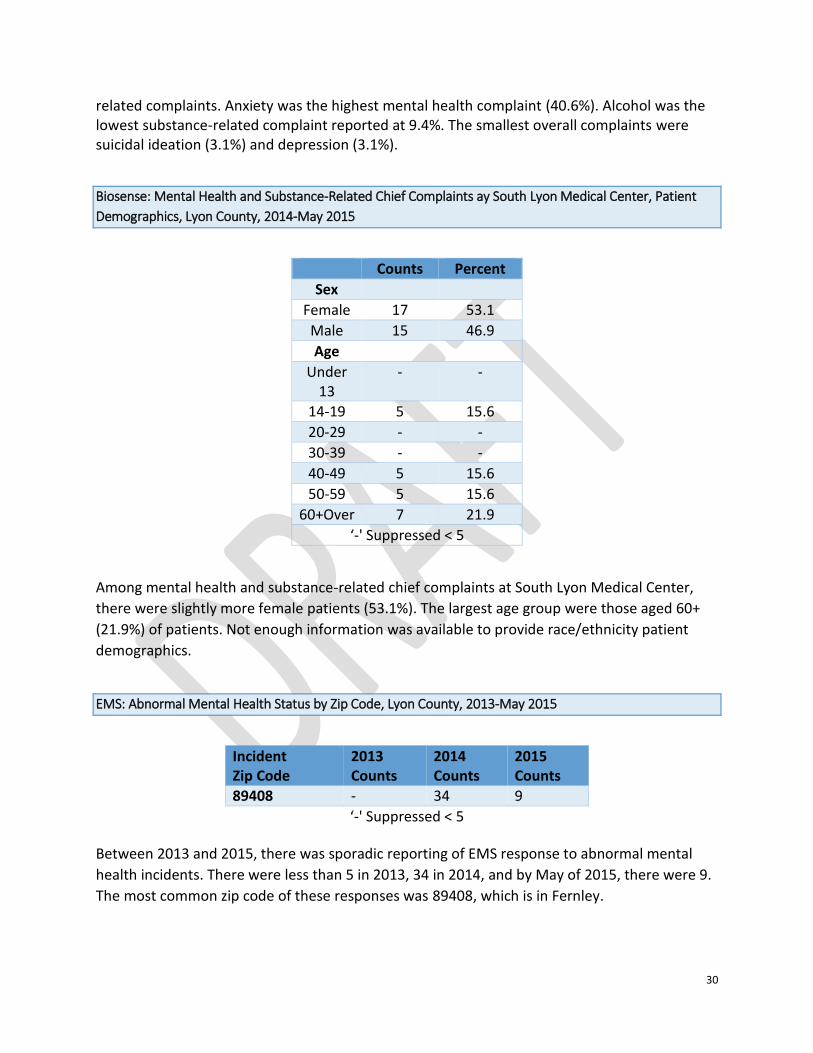
Biosense: Mental Health and Substance-Related Chief Complaints ay South Lyon Medical Center, Patient
Demographics, Lyon County, 2014-May 2015
Counts Percent
Sex
Female 17 53.1
Male 15 46.9
Age
Under 13
- -
14-19 5 15.6
20-29 - -
30-39 - -
40-49 5 15.6
50-59 5 15.6
60+Over 7 21.9
‘-' Suppressed < 5
Among mental health and substance-related chief complaints at South Lyon Medical Center,
there were slightly more female patients (53.1%). The largest age group were those aged 60+
(21.9%) of patients. Not enough information was available to provide race/ethnicity patient
demographics.
EMS: Abnormal Mental Health Status by Zip Code, Lyon County, 2013-May 2015
Incident Zip Code
2013 Counts
2014 Counts
2015 Counts
89408 - 34 9
‘-' Suppressed < 5
Between 2013 and 2015, there was sporadic reporting of EMS response to abnormal mental
health incidents. There were less than 5 in 2013, 34 in 2014, and by May of 2015, there were 9.
The most common zip code of these responses was 89408, which is in Fernley.
31
Behavioral Risk Factor Surveillance Survey Data in this section was compiled using the Behavioral Risk Factor Surveillance Survey (BRFSS).
The (BRFSS is the nation's premier system of health-related telephone surveys that collect state
data about U.S. residents regarding their health-related risk behaviors, chronic health
conditions, and use of preventive services. BRFSS collects data for adults aged 18 years and
older. It allows for representative data to be analyzed at the county-level for many indicators.
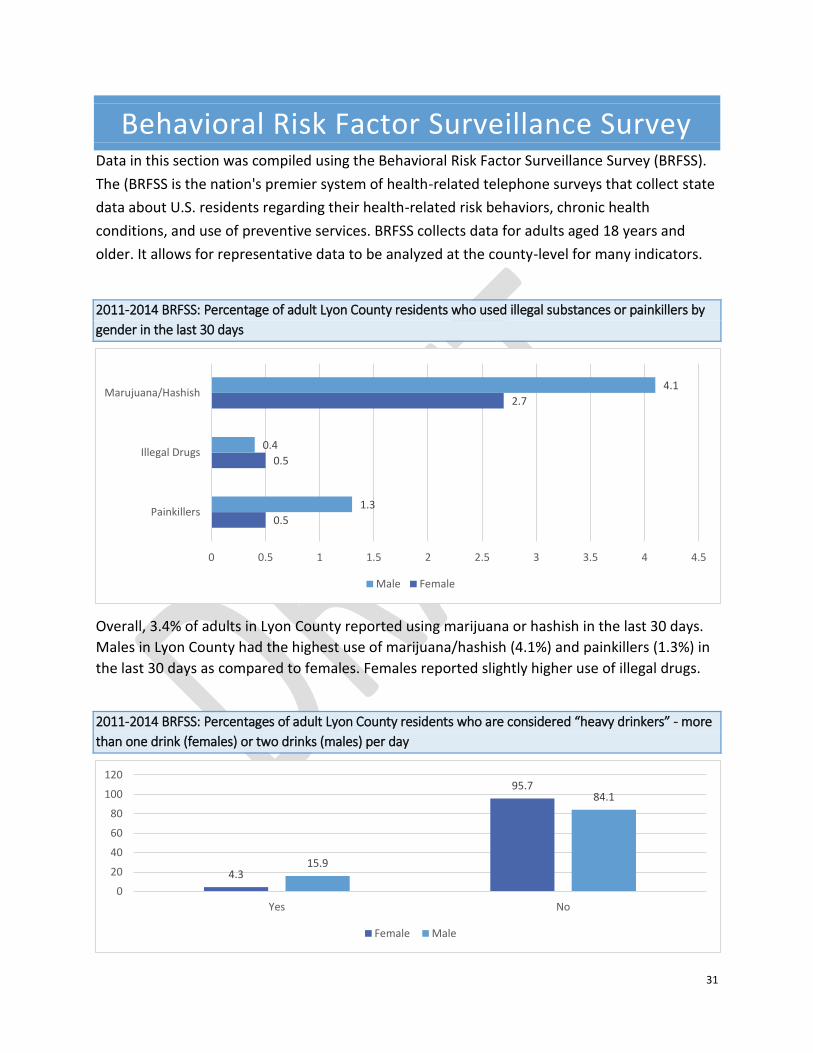
2011-2014 BRFSS: Percentage of adult Lyon County residents who used illegal substances or painkillers by
gender in the last 30 days
Overall, 3.4% of adults in Lyon County reported using marijuana or hashish in the last 30 days.
Males in Lyon County had the highest use of marijuana/hashish (4.1%) and painkillers (1.3%) in
the last 30 days as compared to females. Females reported slightly higher use of illegal drugs.
2011-2014 BRFSS: Percentages of adult Lyon County residents who are considered “heavy drinkers” - more
than one drink (females) or two drinks (males) per day
0.5
0.5
2.7
1.3
0.4
4.1
0 0.5 1 1.5 2 2.5 3 3.5 4 4.5
Painkillers
Illegal Drugs
Marujuana/Hashish
Male Female
4.3
95.7
15.9
84.1
0
20
40
60
80
100
120
Yes No
Female Male
32
Approximately 16% of Lyon County males and 4% of females reported being heavy drinkers.
The most common groups to report heavy drinking were between the ages of 45 to 54 years
(18.7%) and 25 to 34 years (16.5%).
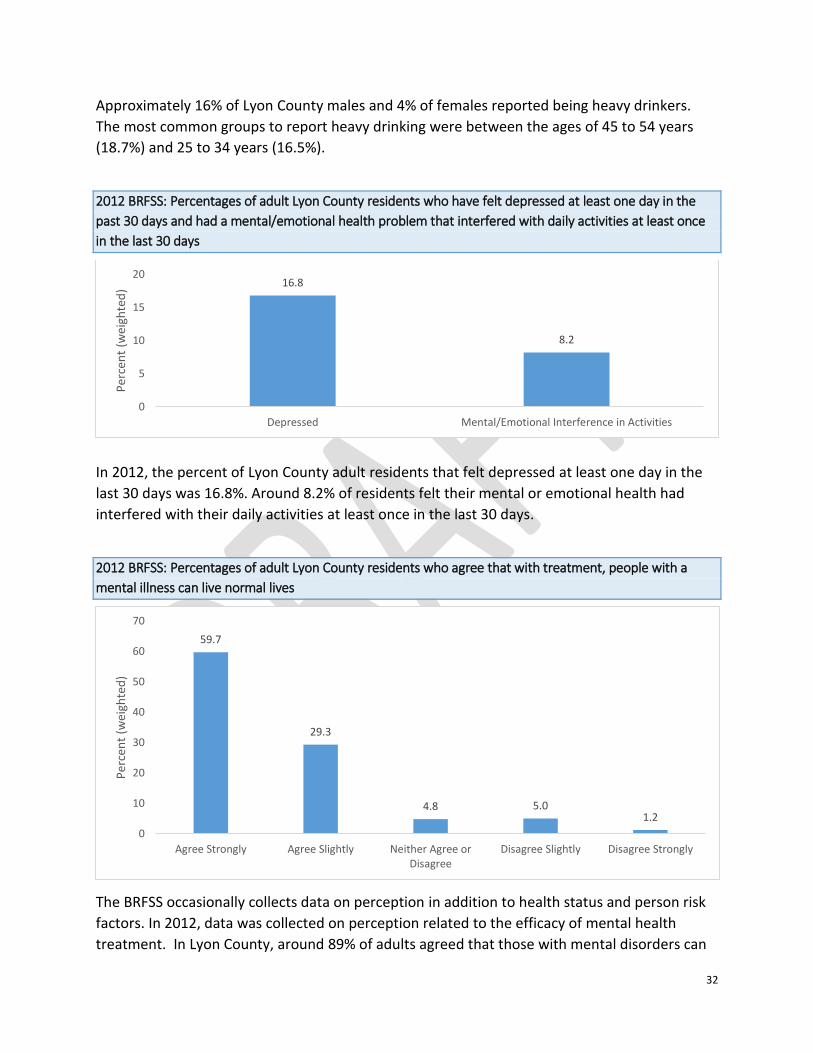
2012 BRFSS: Percentages of adult Lyon County residents who have felt depressed at least one day in the
past 30 days and had a mental/emotional health problem that interfered with daily activities at least once
in the last 30 days
In 2012, the percent of Lyon County adult residents that felt depressed at least one day in the
last 30 days was 16.8%. Around 8.2% of residents felt their mental or emotional health had
interfered with their daily activities at least once in the last 30 days.
2012 BRFSS: Percentages of adult Lyon County residents who agree that with treatment, people with a
mental illness can live normal lives
The BRFSS occasionally collects data on perception in addition to health status and person risk
factors. In 2012, data was collected on perception related to the efficacy of mental health
treatment. In Lyon County, around 89% of adults agreed that those with mental disorders can
16.8
8.2
0
5
10
15
20
Depressed Mental/Emotional Interference in Activities
Per
cen
t (w
eigh
ted
)
59.7
29.3
4.8 5.01.2
0
10
20
30
40
50
60
70
Agree Strongly Agree Slightly Neither Agree orDisagree
Disagree Slightly Disagree Strongly
Per
cen
t (w
eigh
ted
)
33
live a normal life with treatment. Over 6% of adults disagree that those with mental disorders
could live a normal life, with treatment.
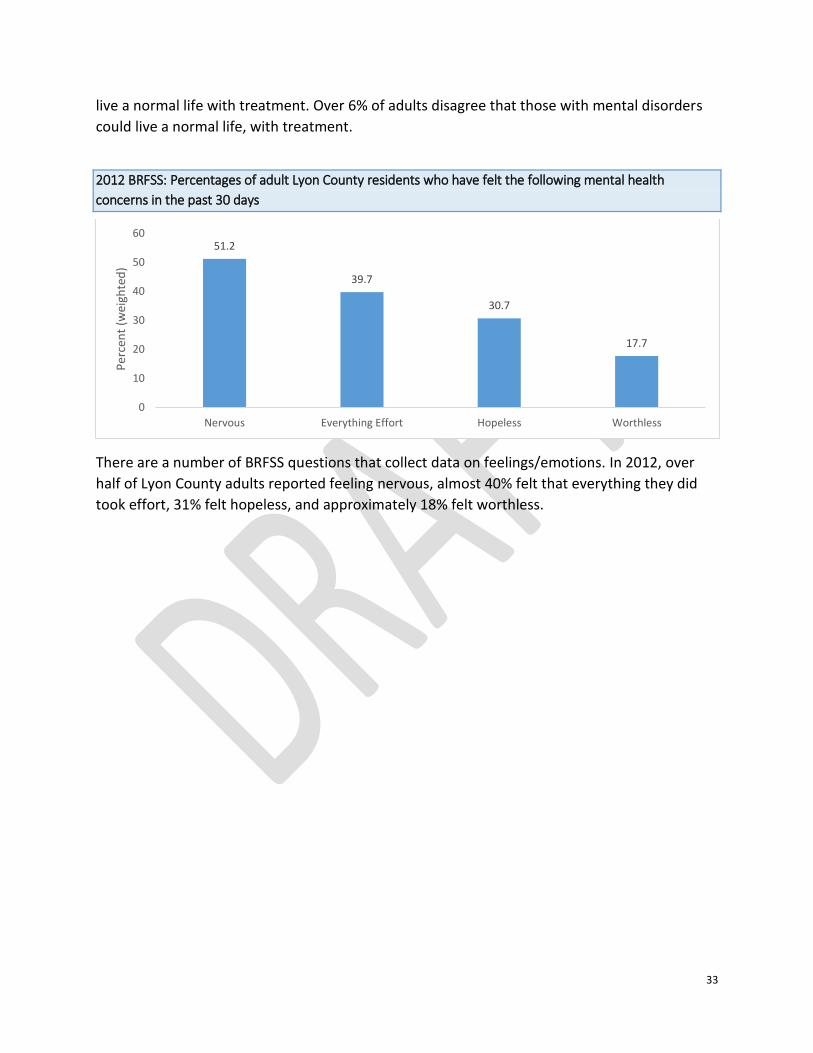
2012 BRFSS: Percentages of adult Lyon County residents who have felt the following mental health
concerns in the past 30 days
There are a number of BRFSS questions that collect data on feelings/emotions. In 2012, over
half of Lyon County adults reported feeling nervous, almost 40% felt that everything they did
took effort, 31% felt hopeless, and approximately 18% felt worthless.
51.2
39.7
30.7
17.7
0
10
20
30
40
50
60
Nervous Everything Effort Hopeless Worthless
Per
cen
t (w
eigh
ted
)
34
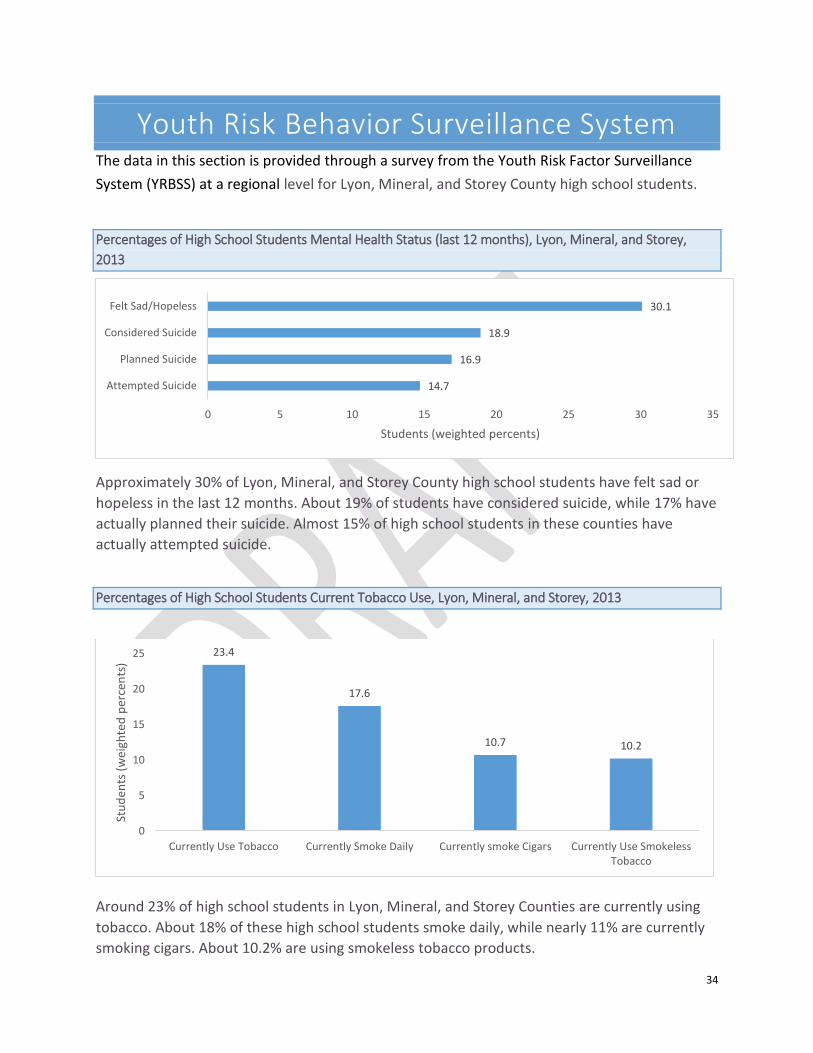
Youth Risk Behavior Surveillance System The data in this section is provided through a survey from the Youth Risk Factor Surveillance
System (YRBSS) at a regional level for Lyon, Mineral, and Storey County high school students.
Percentages of High School Students Mental Health Status (last 12 months), Lyon, Mineral, and Storey,
2013
Approximately 30% of Lyon, Mineral, and Storey County high school students have felt sad or
hopeless in the last 12 months. About 19% of students have considered suicide, while 17% have
actually planned their suicide. Almost 15% of high school students in these counties have
actually attempted suicide.
Percentages of High School Students Current Tobacco Use, Lyon, Mineral, and Storey, 2013
Around 23% of high school students in Lyon, Mineral, and Storey Counties are currently using
tobacco. About 18% of these high school students smoke daily, while nearly 11% are currently
smoking cigars. About 10.2% are using smokeless tobacco products.
30.1
18.9
16.9
14.7
0 5 10 15 20 25 30 35
Felt Sad/Hopeless
Considered Suicide
Planned Suicide
Attempted Suicide
Students (weighted percents)
23.4
17.6
10.7 10.2
0
5
10
15
20
25
Currently Use Tobacco Currently Smoke Daily Currently smoke Cigars Currently Use SmokelessTobacco
Stu
den
ts (
wei
ghte
d p
erce
nts
)
35
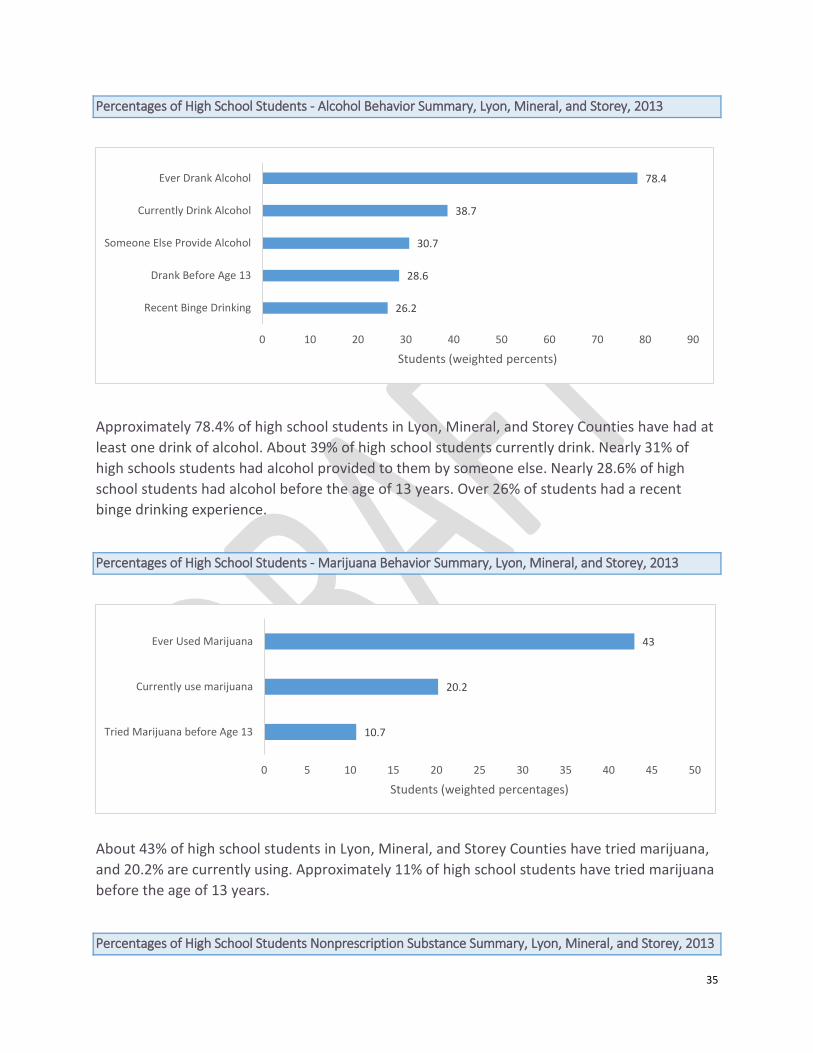
Percentages of High School Students - Alcohol Behavior Summary, Lyon, Mineral, and Storey, 2013
Approximately 78.4% of high school students in Lyon, Mineral, and Storey Counties have had at
least one drink of alcohol. About 39% of high school students currently drink. Nearly 31% of
high schools students had alcohol provided to them by someone else. Nearly 28.6% of high
school students had alcohol before the age of 13 years. Over 26% of students had a recent
binge drinking experience.
Percentages of High School Students - Marijuana Behavior Summary, Lyon, Mineral, and Storey, 2013
About 43% of high school students in Lyon, Mineral, and Storey Counties have tried marijuana,
and 20.2% are currently using. Approximately 11% of high school students have tried marijuana
before the age of 13 years.
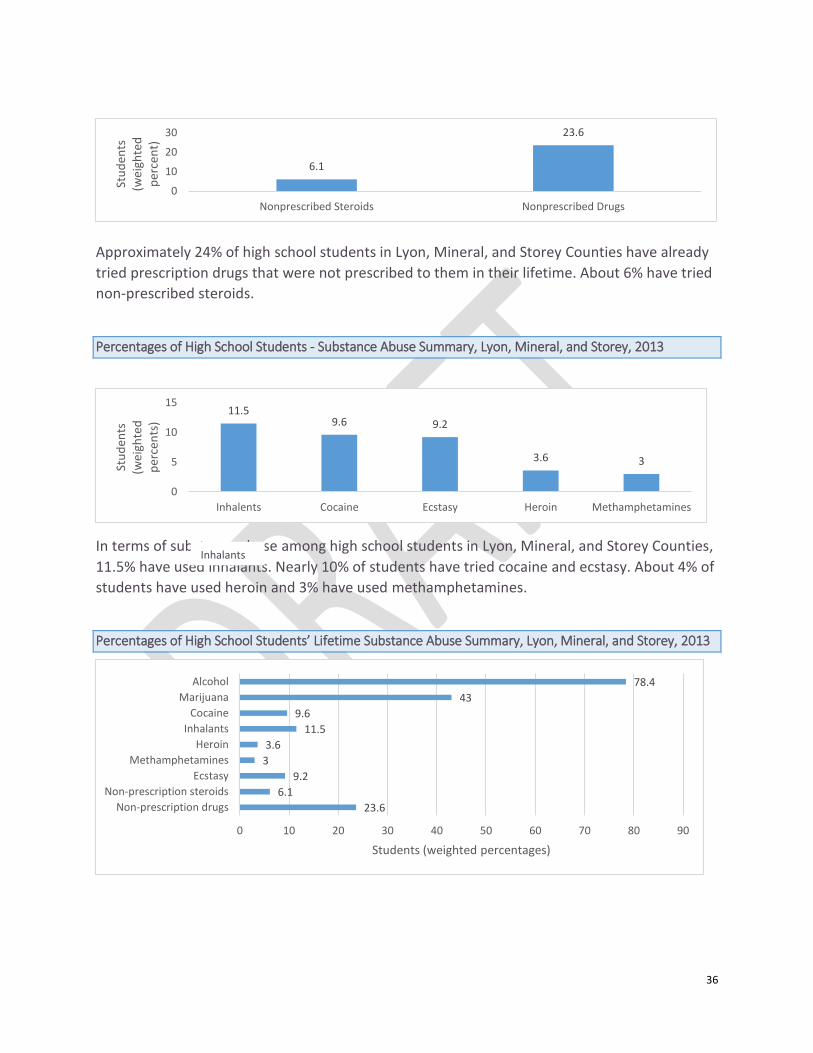
Percentages of High School Students Nonprescription Substance Summary, Lyon, Mineral, and Storey, 2013
78.4
38.7
30.7
28.6
26.2
0 10 20 30 40 50 60 70 80 90
Ever Drank Alcohol
Currently Drink Alcohol
Someone Else Provide Alcohol
Drank Before Age 13
Recent Binge Drinking
Students (weighted percents)
43
20.2
10.7
0 5 10 15 20 25 30 35 40 45 50
Ever Used Marijuana
Currently use marijuana
Tried Marijuana before Age 13
Students (weighted percentages)
36
Approximately 24% of high school students in Lyon, Mineral, and Storey Counties have already
tried prescription drugs that were not prescribed to them in their lifetime. About 6% have tried
non-prescribed steroids.
Percentages of High School Students - Substance Abuse Summary, Lyon, Mineral, and Storey, 2013
In terms of substance abuse among high school students in Lyon, Mineral, and Storey Counties,
11.5% have used inhalants. Nearly 10% of students have tried cocaine and ecstasy. About 4% of
students have used heroin and 3% have used methamphetamines.
Percentages of High School Students’ Lifetime Substance Abuse Summary, Lyon, Mineral, and Storey, 2013
6.1
23.6
0
10
20
30
Nonprescribed Steroids Nonprescribed Drugs
Stu
den
ts
(wei
ghte
d
per
cen
t)
11.59.6 9.2
3.6 3
0
5
10
15
Inhalents Cocaine Ecstasy Heroin Methamphetamines
Stu
den
ts
(wei
ghte
d
per
cen
ts)
23.6
6.1
9.2
3
3.6
11.5
9.6
43
78.4
0 10 20 30 40 50 60 70 80 90
Non-prescription drugs
Non-prescription steroids
Ecstasy
Methamphetamines
Heroin
Inhalants
Cocaine
Marijuana
Alcohol
Students (weighted percentages)
Inhalants
37
Regarding lifetime substance abuse among high school students in Lyon, Mineral, and Storey
Counties, the most common substances used were alcohol (78.4%), marijuana (43%),
prescription drugs not prescribed to them (23.6%), and inhalants (11.5%).
School Success
When students’ behavioral health needs are not identified, they are more likely to experience
difficulties in school, including higher rates of suspensions, expulsions, dropouts, and truancy,
as well as lower grades. Nationally, 50% of students age 14 and older who are living with a
mental illness drop out of high school. This is the highest dropout rate of any disability group.
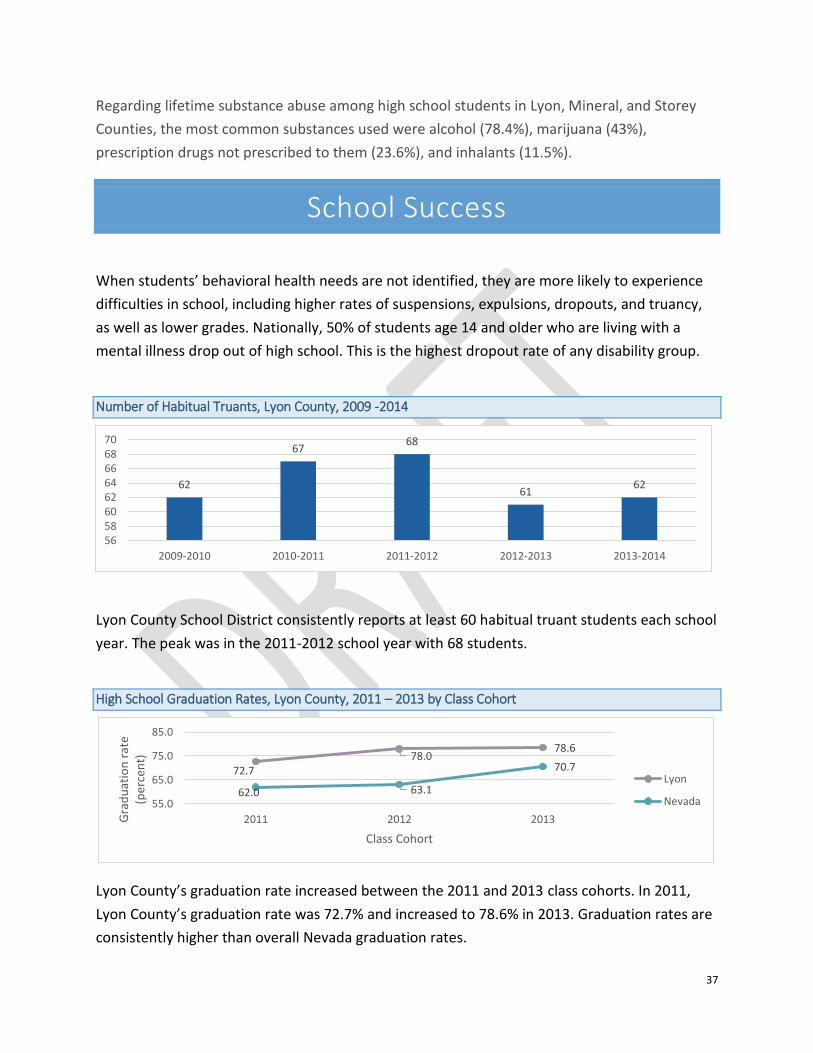
Number of Habitual Truants, Lyon County, 2009 -2014
Lyon County School District consistently reports at least 60 habitual truant students each school
year. The peak was in the 2011-2012 school year with 68 students.
High School Graduation Rates, Lyon County, 2011 – 2013 by Class Cohort
Lyon County’s graduation rate increased between the 2011 and 2013 class cohorts. In 2011,
Lyon County’s graduation rate was 72.7% and increased to 78.6% in 2013. Graduation rates are
consistently higher than overall Nevada graduation rates.
62
6768
6162
5658606264666870
2009-2010 2010-2011 2011-2012 2012-2013 2013-2014
72.778.0
78.6
62.0 63.1
70.7
55.0
65.0
75.0
85.0
2011 2012 2013Gra
du
atio
n r
ate
(per
cen
t)
Class Cohort
Lyon
Nevada